investment governance report quarter 1 2013
TRANSCRIPT

Investment Governance Report – Quarter 1 2013
London Borough of Hammersmith & Fulham Pension Fund
This report is addressed to the Audit & Pensions Committee of the London Borough of Hammersmith & Fulham Pension Fund only. – Not for onward distribution

2 Strategic Overview
Summary
Majedie FTSE All Share + 2% p.a. over three year rolling periods
MFS MFS Custom Benchmark
Barings 3 month Sterling LIBOR + 4% p.a.
Ruffer 3 month Sterling LIBOR + 4% p.a.
Goldman Sachs 3 month Sterling LIBOR + 2% p.a.
Legal & General Bespoke liability related benchmark (2 x LB - 3 month Sterling LIBOR)
The assets of the Fund are considered in terms of four broadly equally weighted sections: UK Equity Mandate, Overseas Equity Mandate, Dynamic Asset Allocation Mandates and the Matching Fund.
The UK Equity Mandate is managed by Majedie and the Overseas Equity Mandate by MFS. There are two Dynamic Asset Allocation managers, Barings and Ruffer. The Matching Fund is split equally between a
global bond mandate managed by Goldman Sachs and a Liability Driven Investment (LDI) fund managed by Legal & General. With the exception of the LDI fund, all others are actively managed by fund managers
who aim to meet or exceed their stated benchmark.
Liability Benchmark (LB)
This Liability Benchmark was last reviewed in December 2011.
To match the predicted growth in the liabilities, the Total Fund return needs to meet a return equivalent to the Liability Benchmark plus 2.2% p.a. (net of fees). The Total Fund strategy aims to exceed this and
targets a return 2.5% p.a. (net of fees) in excess of the Liability Benchmark. Within this, the Matching Fund is targeting a return of 1% p.a. in excess of the Liability Benchmark.
Additionally, the Panel has agreed to invest up to £15 million in four private equity fund of funds. Two managed by Invesco, which has approximately 75% invested in the United States and 25% in Europe, and
the other two by Unicapital which is invested almost entirely in Europe.
Private Equity
The liabilities move in accordance with changes in relevant gilt yields. For this reason, the benchmark used to measure the estimated movement in liabilities, the "Liability Benchmark" is calculated based on
the movement of a selection of Index-Linked gilts, in the following proportions:
45% Index-linked Treasury Gilt 1¼% 2017, 20% Index-linked Treasury Gilt 1¼% 2027, 10% Index-linked Treasury Gilt 1⅛% 2037, 5% Index-linked Treasury Gilt 0¾% 2047, 20% Index-linked Treasury Gilt 1¼% 2055.
Manager Benchmarks
Each Investment Manager has a benchmark which they are monitored against on an ongoing basis. These are:

3 Performance Overview
Notes:
1) Over the 3 months to 31 March 2013, 3 month LIBOR returned 0.1%, over a 12 month period the return was 0.7%.
2) All numbers are sourced from the Custodian, Northern Trust, and have not been independently verified.
3) Returns are shown gross of fees throughout.
4) Figures may be affected by rounding.
Breakdown of Fund Peformance by Manager as at 31st March 2013
Fund Manager Market Value (£000) % of Total Fund Target % of Total
Fund
3 month
return (%)
1 year return
(%)
2 year return
(%) p.a.
3 year return
(%) p.a.
Total Fund 725,891 100.0 100.0 10.4 15.1 11.6 10.0
New Liability Benchmark + 2.2% p.a. 8.0 11.6 16.5 13.9
Difference 2.4 3.5 (4.9) (3.9)
UK Equity Mandate 173,369 23.9 22.5
Majedie 9.6 20.7 13.4 11.8FTSE All Share + 2% p.a. 10.9 19.1 11.0 10.9
Difference (1.3) 1.6 2.4 0.9
Overseas Equity Mandate 171,759 23.7 22.5
MFS 13.9 16.4 11.7 10.0MFS Custom Benchmark 14.4 16.2 9.2 8.7
Difference (0.5) 0.2 2.5 1.3
Dynamic Asset Allocation Mandates 203,111 28.0 30.0 7.1 9.3 7.0 7.0
Barings 123,116 17.0 18.8 5.6 7.9 6.3 6.43 month Sterling LIBOR + 4% p.a. 1.1 4.7 4.9 4.8
Difference 4.5 3.2 1.4 1.6
Ruffer 79,994 11.0 11.2 9.6 11.3 8.0 8.13 month Sterling LIBOR + 4% p.a. 1.1 4.7 4.9 4.8
Difference 8.5 6.6 3.1 3.3
Matching Fund 164,316 22.6 25.0 12.0 16.2 15.7 11.3
Liability Benchmark + 1% p.a. 7.6 10.3 15.2 12.7
Difference 4.4 5.9 0.5 (1.4)
Goldman Sachs 62,919 8.7 12.5 1.4 5.5 3.1 2.73 month Sterling LIBOR + 2% p.a. 0.6 2.7 2.8 2.8
Difference 0.8 2.8 0.3 (0.1)
Legal & General 101,397 14.0 12.5 19.8 24.0 26.4 18.3 Bespoke liability related benchmark (2 x LB - 3 month Sterling LIBOR) 14.9 17.7 35.7 26.2
Difference 4.9 6.3 (9.3) (7.9)
Private Equity 13,336 1.8 0.0 7.6 12.8 12.2 14.5
Invesco 7,265 1.0 0.0 7.1 12.7 15.9 16.2
Unicapital 6,071 0.8 0.0 8.3 12.5 7.7 12.1

4 Asset Reconciliation and Valuation
Notes: All numbers are sourced from the Custodian, Northern Trust, and have not been independently verified. Figures may be affected by rounding.
Asset Reconciliation and Valuation
Fund Manager
Closing Market Value
as at 31st December
2012 £000
% of Total Fund Net Investment
£000 Appreciation £000 Income Received £000 Fees £000
Closing Market Value
as at 31st March 2013
£000
% of Total Fund Target % of Total
Fund
Total Fund 657,705 100.0 (1) 65,952 2,133 1 725,890 100.0 100.0
UK Equity Mandate Majedie 158,221 24.1 - 13,807 1,317 - 173,369 23.9 22.5
Overseas Equity Mandate MFS 150,823 22.9 (1) 20,449 464 1 171,759 23.7 22.5
189,594 28.8 - 13,136 352 - 203,110 28.0 30.0
Barings 116,586 17.7 - 6,483 29 - 123,116 17.0 18.8
Ruffer 73,008 11.1 - 6,652 323 - 79,994 11.0 11.2
146,673 22.3 0 17,621 - 0 164,316 22.6 25.0
Goldman Sachs 62,025 9.4 (0) 885 - 0 62,919 8.7 12.5
Legal & General 84,648 12.9 0 16,736 - - 101,397 14.0 12.5
Private Equity 12,393 1.9 - 940 0 - 13,336 1.8 0.0
Invesco 6,787 1.0 - 477 0 - 7,265 1.0 0.0
Unicaptial 5,607 0.9 - 463 - - 6,071 0.8 0.0
Matching Fund
Dynamic Asset Allocation Mandates

5 Fund Breakdown
Notes: Breakdown has been estimated by P-Solve based on the available manager data.
UK Equity, 27.0%
European ex-UK Equity, 8.6%
North American Equity, 15.2%
Asia Pacific Equity, 4.2%
Global Equity, 1.9%
Emerging Markets Equity, 3.2%
Private Equity, 1.8%
UK Index Linked Gilts, 16.0%
Global Index Linked, 1.3%
Global Sovereign Fixed Interest, 2.7%UK Corporate Bonds, 0.9% Global Corporate Bonds, 0.9%
EMD, 0.6% High Yield, 3.2%
MBS/ABS, 3.9%
Property, 0.6% Gold, 1.5%
Cash , 4.9%
Other, 1.6%
0%
10%
20%
30%
40%
50%
60%
70%
80%
90%
100%
Asset Class
Per
cen
tage
of
Fun
d
Asset Class Breakdown as at 31 March 2013
UK, 0.6%
Europe ex-UK, 26.2%
North America, 57.8%
Asia Pacific, 3.7%
Global, 0.5%
Emerging Markets, 10.4%
Cash , 1.0%
0%
10%
20%
30%
40%
50%
60%
70%
80%
90%
100%
Region
Perc
enta
ge o
f Fu
nd
Breakdown of the MFS mandate
UK, 89.7%
Europe ex-UK, 4.8%
North America,
2.7%
Cash , 2.3%
0%
10%
20%
30%
40%
50%
60%
70%
80%
90%
100%
Region
Pe
rce
nta
ge
of
Fun
d
Breakdown of the Majedie mandate
Asia Pacific, 0.4%

6 Overall Performance
The Fund outperformed its liability benchmark by 2.41% over the quarter, returning 10.37%
compared to the target of 7.96%. The Fund’s performance of 15.14% over the year was
ahead of its target by 3.54%. The Fund has failed to keep pace over the last 3 years but has
outperformed by 1.19% since inception.
Notes: All numbers are sourced from the Custodian, Northern Trust, and have not been independently verified. All performance figures over 1 year have been annualised. Returns are gross of fees. Three Year Rolling Relative Returns have been calculated arithmetically from Q4 2012 onwards.
0
2
4
6
8
10
12
14
16
18
Three Months One Year Two Years Three Years Inception To Date
% R
etu
rn
Historical Fund Performance
Fund Target
T hree M o nths One Year T wo Years T hree Years Inceptio n T o D ate
F und 10.37 15.14 11.61 9.95 4.82
T arget 7.96 11.60 16.54 13.85 3.63
-8-6-4-202468
1012
Q2 10 Q3 10 Q4 10 Q1 11 Q2 11 Q3 11 Q4 11 Q1 12 Q2 12 Q3 12 Q4 12 Q1 13
% R
etu
rn
Three Years Rolling Quarterly Returns
Fund Target
-15
-10
-5
0
5
10
Q2 10 Q3 10 Q4 10 Q1 11 Q2 11 Q3 11 Q4 11 Q1 12 Q2 12 Q3 12 Q4 12 Q1 13%
Re
turn
Three Years Rolling Relative Returns
3M Rel 3Y Rel
Q2 10 Q3 10 Q4 10 Q1 11 Q2 11 Q3 11 Q4 11 Q1 12 Q2 12 Q3 12 Q4 12 Q1 13
3M R el -8.18 2.09 4.56 -0.03 -1.73 -13.84 -2.01 5.43 -3.33 4.00 0.39 2.41
3Y R el 4.86 5.57 6.83 6.55 5.98 -0.22 -2.22 0.64 -1.12 -3.46 -4.07 -3.90
Q2 10 Q3 10 Q4 10 Q1 11 Q2 11 Q3 11 Q4 11 Q1 12 Q2 12 Q3 12 Q4 12 Q1 13
F und -6.34 6.87 6.20 0.14 2.27 -5.62 6.79 4.99 -2.42 1.96 4.85 10.37
T arget 2.00 4.68 1.57 0.17 4.07 9.54 8.98 -0.42 0.94 -1.96 4.46 7.96

7 Majedie
Quarterly Manager update
Organisation No significant changes over the quarter.
Product No significant changes over the quarter.
Performance The fund performance was 9.57% over the quarter, 1.28% behind its target. Over 12
months, the portfolio was 1.65% ahead of its target. Performance drivers were
holdings in HP and Sony, with other positive contributions from Brammer, Blur
Group, Lookers, Bolo, ITM Power and Torotrak. The main negative contribution was
from Telecom Italia whose share price fell due to a combination of weak operational
results and further concerns regarding the domestic economy.
Process No significant changes over the quarter.
Majedie are a small boutique specialist active UK Equity manager with a flexible investment approach. Their approach to investment is mainly as stock pickers. They were appointed in July 2005 following an OJEU tender process. They started managing investments for the fund in August 2005.
0
5
10
15
20
25
Three Months One Year Two Years Three Years Inception To Date
% R
etu
rn
Historical Fund Performance
Fund Target
T hree M o nths One Year T wo Years T hree Years Inceptio n T o D ate
F und 9.57 20.73 13.38 11.78 10.94
T arget 10.85 19.08 10.97 10.94 9.00
-15
-10
-5
0
5
10
15
20
Q2 10 Q3 10 Q4 10 Q1 11 Q2 11 Q3 11 Q4 11 Q1 12 Q2 12 Q3 12 Q4 12 Q1 13
% R
etu
rn
Three Years Rolling Quarterly Returns
Fund Target
Q2 10 Q3 10 Q4 10 Q1 11 Q2 11 Q3 11 Q4 11 Q1 12 Q2 12 Q3 12 Q4 12 Q1 13
F und -10.47 11.36 7.29 1.56 2.34 -8.15 6.63 6.24 -4.10 6.96 7.42 9.57
T arget -11.35 14.17 7.90 1.53 2.41 -13.05 8.92 6.62 -2.14 5.21 4.33 10.85
-4
-2
0
2
4
6
Q2 10 Q3 10 Q4 10 Q1 11 Q2 11 Q3 11 Q4 11 Q1 12 Q2 12 Q3 12 Q4 12 Q1 13
% R
etu
rn
Three Years Rolling Relative Returns
3M Rel 3Y Rel
Q2 10 Q3 10 Q4 10 Q1 11 Q2 11 Q3 11 Q4 11 Q1 12 Q2 12 Q3 12 Q4 12 Q1 13
3M R el 0.99 -2.46 -0.57 0.03 -0.07 5.64 -2.10 -0.36 -2.00 1.66 3.09 -1.28
3Y R el 4.11 2.93 2.11 2.48 2.13 3.00 0.32 -0.92 -2.04 -0.90 0.48 0.84
Notes: All numbers are sourced from the Custodian, Northern Trust, and have not been independently verified. All performance figures over 1 year have been annualised. Returns are gross of fees.
8 MFS
Quarterly Manager update
Organisation No significant changes over the quarter.
Product No significant changes over the quarter.
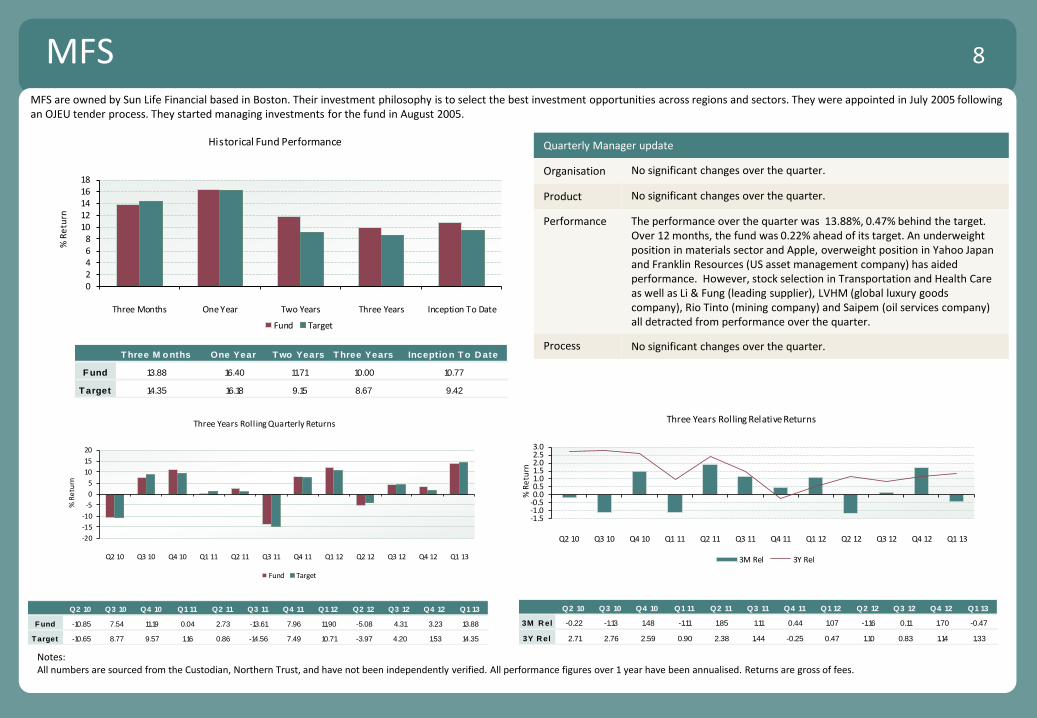
Performance The performance over the quarter was 13.88%, 0.47% behind the target. Over 12 months, the fund was 0.22% ahead of its target. An underweight position in materials sector and Apple, overweight position in Yahoo Japan and Franklin Resources (US asset management company) has aided performance. However, stock selection in Transportation and Health Care as well as Li & Fung (leading supplier), LVHM (global luxury goods company), Rio Tinto (mining company) and Saipem (oil services company) all detracted from performance over the quarter.
Process No significant changes over the quarter.
MFS are owned by Sun Life Financial based in Boston. Their investment philosophy is to select the best investment opportunities across regions and sectors. They were appointed in July 2005 following an OJEU tender process. They started managing investments for the fund in August 2005.
02468
1012141618
Three Months One Year Two Years Three Years Inception To Date
% R
etu
rn
Historical Fund Performance
Fund Target
T hree M o nths One Year T wo Years T hree Years Inceptio n T o D ate
F und 13.88 16.40 11.71 10.00 10.77
T arget 14.35 16.18 9.15 8.67 9.42
-20
-15
-10
-5
0
5
10
15
20
Q2 10 Q3 10 Q4 10 Q1 11 Q2 11 Q3 11 Q4 11 Q1 12 Q2 12 Q3 12 Q4 12 Q1 13
% R
etu
rn
Three Years Rolling Quarterly Returns
Fund Target
Q2 10 Q3 10 Q4 10 Q1 11 Q2 11 Q3 11 Q4 11 Q1 12 Q2 12 Q3 12 Q4 12 Q1 13
F und -10.85 7.54 11.19 0.04 2.73 -13.61 7.96 11.90 -5.08 4.31 3.23 13.88
T arget -10.65 8.77 9.57 1.16 0.86 -14.56 7.49 10.71 -3.97 4.20 1.53 14.35
-1.5-1.0-0.50.00.51.01.52.02.53.0
Q2 10 Q3 10 Q4 10 Q1 11 Q2 11 Q3 11 Q4 11 Q1 12 Q2 12 Q3 12 Q4 12 Q1 13
% R
etu
rn
Three Years Rolling Relative Returns
3M Rel 3Y Rel
Q2 10 Q3 10 Q4 10 Q1 11 Q2 11 Q3 11 Q4 11 Q1 12 Q2 12 Q3 12 Q4 12 Q1 13
3M R el -0.22 -1.13 1.48 -1.11 1.85 1.11 0.44 1.07 -1.16 0.11 1.70 -0.47
3Y R el 2.71 2.76 2.59 0.90 2.38 1.44 -0.25 0.47 1.10 0.83 1.14 1.33
Notes: All numbers are sourced from the Custodian, Northern Trust, and have not been independently verified. All performance figures over 1 year have been annualised. Returns are gross of fees.

9 Dynamic Asset Allocation Group
The performance of the group over the quarter was 7.13%, the LIBOR-based target returned
1.11%. Outperformance was driven by a continued rally in equity markets over the quarter while
Index-linked gilts performed particularly well due to the surprise announcement by the National
Statistician not to alter the way RPI inflation is measured. This means that the RPI rate will
continue to run above the CPI measure for the foreseeable future. Over the past 12 months,
performance has been 4.61% ahead of the target.
0
2
4
6
8
10
12
Three Months One Year Two Years Three Years Inception To Date
% R
etu
rn
Historical Fund Performance
Fund Target
T hree M o nths One Year T wo Years T hree Years Inceptio n T o D ate
F und 7.13 9.33 7.02 7.03 10.28
T arget 1.11 4.72 4.85 4.82 4.91
-4
-2
0
2
4
6
8
Q2 10 Q3 10 Q4 10 Q1 11 Q2 11 Q3 11 Q4 11 Q1 12 Q2 12 Q3 12 Q4 12 Q1 13
% R
etu
rn
Three Years Rolling Quarterly Returns
Fund Target
Q2 10 Q3 10 Q4 10 Q1 11 Q2 11 Q3 11 Q4 11 Q1 12 Q2 12 Q3 12 Q4 12 Q1 13
F und -2.22 5.32 3.94 0.01 1.18 -1.86 2.16 3.27 -1.44 1.37 2.15 7.13
T arget 1.16 1.17 1.17 1.18 1.19 1.21 1.24 1.25 1.23 1.17 1.12 1.11
-4-202468
10
Q2 10 Q3 10 Q4 10 Q1 11 Q2 11 Q3 11 Q4 11 Q1 12 Q2 12 Q3 12 Q4 12 Q1 13%
Re
turn
Three Years Rolling Relative Returns
3M Rel 3Y Rel
Q2 10 Q3 10 Q4 10 Q1 11 Q2 11 Q3 11 Q4 11 Q1 12 Q2 12 Q3 12 Q4 12 Q1 13
3M R el -3.34 4.10 2.74 -1.16 -0.01 -3.03 0.91 2.00 -2.64 0.20 1.03 6.02
3Y R el - - - - - - 5.10 7.54 4.97 1.59 1.39 2.21
Notes: All numbers are sourced from the Custodian, Northern Trust, and have not been independently verified. All performance figures over 1 year have been annualised. Returns are gross of fees.

10 Barings
Quarterly Manager update
Organisation No significant changes over the quarter.
Product No significant changes over the quarter.
Performance The fund performance was 5.60% over the quarter, 4.49% ahead of its target. Over 12 months, the fund is 3.22% ahead of target. The strongest returns in the quarter came from UK equities followed by overseas equities with an additional modest return in Japanese equities. Overall currency hedging activity had a negative net contribution to returns due to a large position, hedging out of the US dollars back into Sterling to maintain the portfolio weight in the base currency above the 60% minimum level.
Process No significant changes over the quarter.
Barings are a large UK based investment manager investing in global asset classes. They were appointed for the Dynamic Asset Allocation mandate in June 2008 following an OJEU tender process. They started managing investments for the fund in August 2008.
0123456789
10
Three Months One Year Two Years Three Years Inception To Date
% R
etu
rn
Historical Fund Performance
Fund Target
T hree M o nths One Year T wo Years T hree Years Inceptio n T o D ate
F und 5.60 7.94 6.33 6.43 8.85
T arget 1.11 4.72 4.85 4.82 5.27
-4-3-2-101234567
Q2 10 Q3 10 Q4 10 Q1 11 Q2 11 Q3 11 Q4 11 Q1 12 Q2 12 Q3 12 Q4 12 Q1 13
% R
etu
rn
Three Years Rolling Quarterly Returns
Fund Target
Q2 10 Q3 10 Q4 10 Q1 11 Q2 11 Q3 11 Q4 11 Q1 12 Q2 12 Q3 12 Q4 12 Q1 13
F und -3.12 5.73 3.88 0.22 1.19 -1.89 2.07 3.35 -0.90 1.78 1.34 5.60
T arget 1.16 1.17 1.17 1.18 1.19 1.21 1.24 1.25 1.23 1.17 1.12 1.11
-6-4-202468
Q2 10 Q3 10 Q4 10 Q1 11 Q2 11 Q3 11 Q4 11 Q1 12 Q2 12 Q3 12 Q4 12 Q1 13%
Re
turn
Three Years Rolling Relative Returns
3M Rel 3Y Rel
Q2 10 Q3 10 Q4 10 Q1 11 Q2 11 Q3 11 Q4 11 Q1 12 Q2 12 Q3 12 Q4 12 Q1 13
3M R el -4.23 4.51 2.68 -0.95 0.00 -3.06 0.82 2.07 -2.10 0.60 0.22 4.49
3Y R el - - - - - 4.51 5.26 7.38 4.90 1.46 0.98 1.61
Notes: All numbers are sourced from the Custodian, Northern Trust, and have not been independently verified. All performance figures over 1 year have been annualised. Returns are gross of fees.

11 Ruffer
Quarterly Manager update
Organisation No significant changes over the quarter.
Product No significant changes over the quarter.
Performance The fund performance was 9.57% over the quarter, 8.46% ahead of its target. Over 12 months, the fund was 6.55% above the target. The returns for the portfolio were driven by positive contributions from Japanese equity exposure, index-linked bonds ,US dollar position and UK and US equities. The main contributors to Japanese equity came from holdings in Daiei, Kao, Seven & I, SMFG and Toyota. There were no significant detractors to performance over the quarter.
Process No significant changes over the quarter.
Ruffer are a small boutique investment manager investing in global asset classes. They were appointed for the Dynamic Asset Allocation mandate in June 2008 following an OJEU tender process. They started managing investments for the fund in August 2008.
0
2
4
6
8
10
12
14
16
Three Months One Year Two Years Three Years Inception To Date
% R
etu
rn
Historical Fund Performance
Fund Target
T hree M o nths One Year T wo Years T hree Years Inceptio n T o D ate
F und 9.57 11.27 8.00 8.06 13.94
T arget 1.11 4.72 4.85 4.82 5.27
-4
-2
0
2
4
6
8
10
12
Q2 10 Q3 10 Q4 10 Q1 11 Q2 11 Q3 11 Q4 11 Q1 12 Q2 12 Q3 12 Q4 12 Q1 13
% R
etu
rn
Three Years Rolling Quarterly Returns
Fund Target
Q2 10 Q3 10 Q4 10 Q1 11 Q2 11 Q3 11 Q4 11 Q1 12 Q2 12 Q3 12 Q4 12 Q1 13
F und 0.41 4.13 4.11 -0.61 1.13 -1.80 2.44 3.04 -2.55 0.71 3.47 9.57
T arget 1.16 1.17 1.17 1.18 1.19 1.21 1.24 1.25 1.23 1.17 1.12 1.11
-6-4-202468
1012
Q2 10 Q3 10 Q4 10 Q1 11 Q2 11 Q3 11 Q4 11 Q1 12 Q2 12 Q3 12 Q4 12 Q1 13
% R
etu
rn
Three Years Rolling Relative Returns
3M Rel 3Y Rel
Q2 10 Q3 10 Q4 10 Q1 11 Q2 11 Q3 11 Q4 11 Q1 12 Q2 12 Q3 12 Q4 12 Q1 13
3M R el -0.74 2.93 2.91 -1.77 -0.06 -2.97 1.19 1.77 -3.73 -0.45 2.35 8.46
3Y R el - - - - - 9.79 4.86 8.01 5.34 2.35 2.60 3.24
Notes: All numbers are sourced from the Custodian, Northern Trust, and have not been independently verified. All performance figures over 1 year have been annualised. Returns are gross of fees.
12 Matching Fund
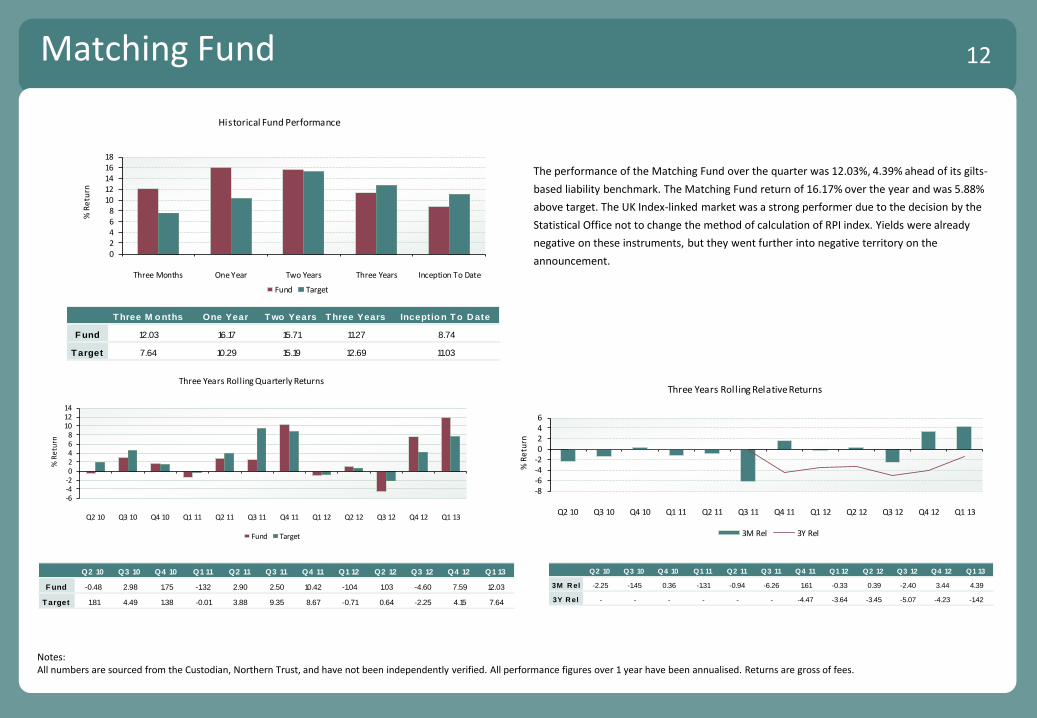
The performance of the Matching Fund over the quarter was 12.03%, 4.39% ahead of its gilts-
based liability benchmark. The Matching Fund return of 16.17% over the year and was 5.88%
above target. The UK Index-linked market was a strong performer due to the decision by the
Statistical Office not to change the method of calculation of RPI index. Yields were already
negative on these instruments, but they went further into negative territory on the
announcement. 02468
1012141618
Three Months One Year Two Years Three Years Inception To Date
% R
etu
rn
Historical Fund Performance
Fund Target
T hree M o nths One Year T wo Years T hree Years Inceptio n T o D ate
F und 12.03 16.17 15.71 11.27 8.74
T arget 7.64 10.29 15.19 12.69 11.03
-6-4-202468
101214
Q2 10 Q3 10 Q4 10 Q1 11 Q2 11 Q3 11 Q4 11 Q1 12 Q2 12 Q3 12 Q4 12 Q1 13
% R
etu
rn
Three Years Rolling Quarterly Returns
Fund Target
Q2 10 Q3 10 Q4 10 Q1 11 Q2 11 Q3 11 Q4 11 Q1 12 Q2 12 Q3 12 Q4 12 Q1 13
F und -0.48 2.98 1.75 -1.32 2.90 2.50 10.42 -1.04 1.03 -4.60 7.59 12.03
T arget 1.81 4.49 1.38 -0.01 3.88 9.35 8.67 -0.71 0.64 -2.25 4.15 7.64
-8-6-4-20246
Q2 10 Q3 10 Q4 10 Q1 11 Q2 11 Q3 11 Q4 11 Q1 12 Q2 12 Q3 12 Q4 12 Q1 13
% R
etu
rn
Three Years Rolling Relative Returns
3M Rel 3Y Rel
Q2 10 Q3 10 Q4 10 Q1 11 Q2 11 Q3 11 Q4 11 Q1 12 Q2 12 Q3 12 Q4 12 Q1 13
3M R el -2.25 -1.45 0.36 -1.31 -0.94 -6.26 1.61 -0.33 0.39 -2.40 3.44 4.39
3Y R el - - - - - - -4.47 -3.64 -3.45 -5.07 -4.23 -1.42
Notes: All numbers are sourced from the Custodian, Northern Trust, and have not been independently verified. All performance figures over 1 year have been annualised. Returns are gross of fees.

13 Goldman Sachs
Quarterly Manager update
Organisation No significant changes over the quarter.
Product No significant changes over the quarter.
Performance The fund performance was 1.44% over the quarter, 0.82% ahead of its
target. Over 12 months, performance was 2.80% ahead of the target. The
portfolio’s outperformance was again led predominantly by the fund’s cross-
sector and currency strategies. The duration strategy, however, detracted
from excess returns over the quarter. The short Japan 7-year futures trade
detracted from excess returns over the period.
Process No significant changes over the quarter.
Goldman Sachs are a very large American investment bank who were first appointed in 1999 following a tender process. They have managed both equities and bonds on an active basis and since February 2009 managed an active bond fund.
0
1
2
3
4
5
6
Three Months One Year Two Years Three Years Inception To Date
% R
etu
rn
Historical Fund Performance
Fund Target
T hree M o nths One Year T wo Years T hree Years Inceptio n T o D ate
F und 1.44 5.50 3.06 2.71 3.18
T arget 0.62 2.70 2.83 2.81 2.13
-2.0-1.5-1.0-0.50.00.51.01.52.02.53.0
Q2 10 Q3 10 Q4 10 Q1 11 Q2 11 Q3 11 Q4 11 Q1 12 Q2 12 Q3 12 Q4 12 Q1 13
% R
etu
rn
Three Years Rolling Quarterly Returns
Fund Target
Q2 10 Q3 10 Q4 10 Q1 11 Q2 11 Q3 11 Q4 11 Q1 12 Q2 12 Q3 12 Q4 12 Q1 13
F und 0.03 0.68 1.10 0.18 -0.27 -1.45 -0.11 2.55 0.03 2.67 1.27 1.44
T arget 0.67 0.68 0.68 0.69 0.70 0.72 0.75 0.76 0.74 0.68 0.63 0.62
-3
-2
-1
0
1
2
3
Q2 10 Q3 10 Q4 10 Q1 11 Q2 11 Q3 11 Q4 11 Q1 12 Q2 12 Q3 12 Q4 12 Q1 13
% R
etu
rn
Three Years Rolling Relative Returns
3M Rel 3Y Rel
Q2 10 Q3 10 Q4 10 Q1 11 Q2 11 Q3 11 Q4 11 Q1 12 Q2 12 Q3 12 Q4 12 Q1 13
3M R el -0.64 0.00 0.42 -0.51 -0.96 -2.15 -0.85 1.78 -0.70 1.98 0.64 0.82
3Y R el 2.51 2.37 2.19 1.60 1.68 1.20 0.34 1.42 0.12 -0.10 -0.23 -0.10
Notes: All numbers are sourced from the Custodian, Northern Trust, and have not been independently verified. All performance figures over 1 year have been annualised. Returns are gross of fees.

14 Legal & General
Quarterly Manager update
Organisation No significant changes over the quarter.
Product No significant changes over the quarter.
Performance The fund performance was 19.79% over the quarter, 4.90% ahead of its bespoke target. Over 12 months, performance was 6.29% ahead of the target.
Process No significant changes over the quarter.
Legal & General are a very large manager of indexed funds. They were first appointed to manage investments for the fund in 1993. They have managed both equities and bonds on an indexed basis. Their current investment mandate started in the first quarter of 2012, although performance has been blended with the previous holding in the LGIM 2055 Index-Linked Gilt Fund.
0
5
10
15
20
25
30
35
40
Three Months One Year Two Years Three Years Inception To Date
% R
etu
rn
Historical Fund Performance
Fund Target
T hree M o nths One Year T wo Years T hree Years Inceptio n T o D ate
F und 19.79 23.95 26.38 18.33 5.59
T arget 14.89 17.66 35.72 26.24 5.76
-15-10
-505
1015202530
Q2 10 Q3 10 Q4 10 Q1 11 Q2 11 Q3 11 Q4 11 Q1 12 Q2 12 Q3 12 Q4 12 Q1 13
% R
etu
rn
Three Years Rolling Quarterly Returns
Fund Target
Q2 10 Q3 10 Q4 10 Q1 11 Q2 11 Q3 11 Q4 11 Q1 12 Q2 12 Q3 12 Q4 12 Q1 13
F und -0.96 5.18 2.34 -2.69 5.85 5.96 19.04 -3.50 1.76 -9.81 12.75 19.79
T arget 0.39 9.89 2.38 -3.30 9.60 16.73 25.16 -2.22 0.38 -5.27 7.69 14.89
-12-8-4048
Q2 10 Q3 10 Q4 10 Q1 11 Q2 11 Q3 11 Q4 11 Q1 12 Q2 12 Q3 12 Q4 12 Q1 13%
Re
turn
Three Years Rolling Relative Returns
3M Rel 3Y Rel
Q2 10 Q3 10 Q4 10 Q1 11 Q2 11 Q3 11 Q4 11 Q1 12 Q2 12 Q3 12 Q4 12 Q1 13
3M R el -1.34 -4.29 -0.04 0.63 -3.42 -9.23 -4.89 -1.31 1.37 -4.79 5.06 4.90
3Y R el 4.71 3.23 3.22 3.37 1.89 -2.92 -6.51 -10.32 -8.41 -10.01 -10.26 -7.91
Notes: All numbers are sourced from the Custodian, Northern Trust, and have not been independently verified. All performance figures over 1 year have been annualised. Returns are gross of fees.

15 Market Commentary – Quarter 1 2013
Continued loose monetary policy and improving investor confidence helped risky assets make a strong start to the year. While the return of European debt issues in the form of a banking crisis in Cyprus slowed momentum in late March, some equity markets still reached record highs over the quarter and others surpassed levels last seen before the 2008 financial crisis.
US equities were amongst the strongest performers with both the major stock indices posting double digit returns and reaching record highs. UK equities followed suit, also producing double digit returns while European markets lagged slightly. High yield corporate credit posted modest gains over the quarter and in contrast to developed markets, emerging market debt and equity experienced small losses due to concerns about inflation, a slowdown in China and depressed commodity prices.
In currency markets the big news over the quarter was the sharp fall in the value of sterling which depreciated substantially versus most major currencies before recovering somewhat towards the end of March. The slide took many by surprise with lots of explanations put forward including continued poor growth figures, stubbornly high government debt and an easing of concerns in the Eurozone leading to a reduction in the need for sterling as a safe haven.
Despite the general risk-on theme of the first quarter, gilt yields remained largely unchanged over the period. Index-linked gilts performed particularly well due to the surprise announcement by the National Statistician not to alter the way RPI inflation is measured. This means that the RPI rate will continue to run above the CPI measure for the foreseeable future, resulting in a larger than expected rise in the liabilities of schemes heavily linked to inflation.
In a move that was largely expected by investors, ratings agency Moody’s cut the UK’s credit rating one notch from its coveted AAA status citing continued sluggish growth, largely as a result of on-going poor growth prospects for the global economy in 2013. George Osborne presented his fourth annual budget in March announcing that economic growth is now expected to be half of that originally forecast at just 0.6% for this year, while borrowing and public sector debt are now both projected to be higher in the coming years than originally expected. A number of measures were announced including further plans to help struggling home buyers, an increase in the personal tax allowance a year earlier than planned and an updated remit for the Bank of England to allow the use of “ unconventional monetary instruments” to boost economic growth. In Europe, key events included the Italian elections held in February which yielded no clear winner and the emergence of the Cypriot banking crisis which served as a reminder that European sovereign debt issues still pose a significant threat to markets and global growth, irrespective of the size of the particular economy in focus. Away from the furore, economic fundamentals for the region as a whole remain depressed as unemployment reached a record high of 12%, manufacturing continued to contract and growth remains sluggish. Given that most governments are looking to control their fiscal budgets and reduce debt to more sustainable levels, a tough economic climate is expected to continue in the short to medium term with 2013’s growth forecast pointing to a 0.4% contraction. The US economy continued to lead the way for much of the rest of the developed world, with key economic indicators such as job creation and manufacturing experiencing strong growth. The housing market, a bellwether of the economic recovery, also showed signs of strengthening with gains in house prices, homes sales and construction spending. Elsewhere, in Asia, Japanese equity markets have seen some of the strongest returns over the quarter with the Nikkei index rising over 20%. This was largely in response to the new Prime Minister, Shinzo Abe, announcing his intentions to loosen monetary policy via a new large stimulus package and a higher inflation target of 2%.

16 Contacts and Important Notice
Client Contact
Jonathan Hunt
020 7641 1804
Fund Actuary
Graeme Muir, Barnett Waddingham
P-Solve Contact
John Conroy
020 3327 5048
11 Strand, London WC2N 5HR
Datasource: Data has been sourced from the Custodian, Northern Trust, and the Managers.
IMPORTANT INFORMATION This Investment Governance Report has been prepared for the Audit & Pensions Committee of the London Borough of Hammersmith and Fulham Pension Fund (the “Fund”) only. It is not for onward distribution. The purpose of this report is to provide factual information relating to the current portfolios, valuation, components and a factual description of the performance in the period covered by the report. The subject matter of this report has been agreed with you and is provided by us in order to meet our reporting obligations to you under the FCA Rules. As such, it has not been prepared for distribution to individual scheme members or retail investors. P-Solve is authorised and regulated by the Financial Conduct Authority and which is part of the Punter Southall Group of Companies. This document is intended for the recipient only. The information expressed is provided in good faith and has been prepared using sources considered to be reasonable and appropriate. Past performance is not necessarily a guide to future returns. Registered Office: 11 Strand, London WC2N 5HR. Registered in England & Wales: No. 3359127. FCA Registration No. 195028
THIS REPORT IS ADDRESSED TO THE AUDIT & PENSIONS COMMITTEE OF THE LONDON BOROUGH OF HAMMERSMITH AND FULHAM PENSION FUND ONLY – NOT FOR ONWARD DISTRIBUTION