investment in improvement strategies and academic
TRANSCRIPT

THE EUROPEAN EDUCATIONAL RESEARCHER
DOI: 10.31757/euer.322 http://www.eu-er.com/
Abstract: Secondary schools have adopted various strategies in an effort to improve performance. Collaboration and benchmarking
are two such strategies. However, schools still continue to post poor grades in national examinations, an indicator that most of the
students fail to meet the university cut off mark and thus fail to join university. This raises the question of whether such investment
is really justified. This study sought to investigate whether investment in these two practices translated into improved education
outcomes as measured by mean scores in the Kenya Certificate of Secondary Education. The study adopted correlation research
design. From a target of 103 schools in the region involved in collaboration and benchmarking, 31schools were randomly selected.
The sample comprised all 31 Directors of Studies and 31principals from the sampled schools. Data were collected using
questionnaires with closed and open ended items, and document analysis. Data were analyzed inferentially (PPMCC and Multiple
linear regression) using the Predictive Analytical Software (PASW) Version 19.0. The data on open ended items were coded using
open coding, categorized and reported verbatim. Findings indicated that, investment in the two strategies significantly improved
academic achievement (r=0.822; r2=0.676; adjusted r2=0.603). However, considered independently, investment in collaboration
had a much higher impact on academic achievement (r=0.843, r2=0.711; adjusted r2=0.697), compared to investment in
benchmarking (r=0.510, r2=0.260; adjusted r2=0.219). It is recommended that, schools should generously and uniformly invest in
both collaboration and benchmarking in order to boost academic achievement. In addition, well endowed schools should be
encouraged to share their resources.
Keywords: Academic achievement; collaboration; benchmarking; Investment.
Introduction
Worldwide, countries are keen on improving their
education standards and subsequently, the learning
outcomes of their students. As a result, they are
constantly exploring new techniques that can
positively increase education achievement.
Collaboration and benchmarking are two practices
which have been adopted by schools in various parts
of the world because they are instrumental in
enhancing academic achievement. Collaboration
alludes to working together to solve a common
problem or achieve a common goal. It clearly fosters
the ethic of sharing as observed by Bernis and
Biederman (1997) that, significant interventions in the
20th century were produced by collaborative effort. In
literature, the terms collaboration, collegiality,
cooperation, partnerships and professional learning
communities are used interchangeably to describe how
teachers work together (Weindling, 2005).
Collaboration provides an atmosphere as well an
avenue for sharing information and ideas. Bouchamma
et al. (2012) reported that, collaboration benefitted
students as well as teachers and the school as a whole
as collaboration between teachers enabled them to
achieve academic goals.
Benchmarking was a term used by cobblers to measure
a person’s feet for shoes. Someone’s foot would be
placed on a bench and then the pattern would be
marked out. This pattern would be used to fashion a
shoe. Moriaty (2008) disclosed how later, this term
was used in relation to surveying or the geological
practice of making marks in the ground to ensure that,
this formed the basis of subsequent placements and
measurements. This term has more recently been
associated with businesses where it denotes comparing
Investment in Improvement Strategies and Academic Achievement:
The Case of Secondary Schools in Kenya
Jane Amunga Kaimosi Friends University College, Kenya

54 | A M U N G A
a company’s performance to that of another to
determine which inputs, processes, output systems and
functions were significantly different from those of
their competitors (Amunga et al., 2013). Ruby (2013)
reiterates that, benchmarking has a clear focus on
improvement and this explains why educational
institutions have also adopted the use of the term as
well as the practice. Today, educational institutions are
big business houses engaged in stiff competition but at
the same time striving for continuous improvement
and excellence. Demand for accountability during the
release of national examination results has put schools
on high alert. It is this pressure that has seen schools
come up with a plethora of activities that are expected
to improve academic achievement key of which are
collaboration and benchmarking.
Collaboration and benchmarking are strategies that are
used hand in hand in the continuous improvement
model. These practices require the investment of time,
human and financial resources. A review of literature
by Atkinson et al. (2007) on inter school collaboration
revealed that, collaboration was hindered by lack of
time. It was reported that working in a collaborative
way required sufficient time for discussions and
meetings and this was not available. When schools that
should be involved in the collaboration exercise were
far removed from each other, this had a time and cost
implication which make it difficult work to
collaboratively (Woods et al., 2006; Lindsay et al.,
2005). In Northern Ireland, it was difficult to establish
sustainable collaborative relations because schools
had different ways of preparing their time tables. It
also meant that, schools had to incur the costs of
transporting children from one school to another.
These, coupled with financial constraints, school
cultural differences and problems of trust (School of
Education, 2008) are factors that easily worked against
collaboration. This therefore means that, collaboration
required sufficient time and enough financial
resources if it was to be successful. Adequate time was
also an important requirement for thorough planning
and early identification of potential problems (Turner,
2005). In another report by Woods et al. (2006), some
schools reported as many as 400-500 hours per term
but on average, teachers were devoting 200 hours on
collaborative activities.
Darling-Hammond et al. (2009) found that, sustained
and intensive collaborative learning was correlative to
achievement gains. However, in many schools, time
was still a problem because there were so many
programmes and activities in which teachers were
involved such that, there was no time left for
professional collaboration (Dillion, 2005). A similar
survey of the views of the Association of Teachers and
Lecturers (ATL) on teachers as collaborative
professionals working collaboratively with teachers
from other schools revealed that this was an
uncommon practice because of time logistics.
Although teachers felt working collaboratively would
help improve their teaching and pupils learning, they
complained of lack of time for collaborative work. In
addition, 90% of the teachers said that, to do their work
effectively, they needed to work closely with teachers
from other schools but this was not happening
(Weindling, 2005). Aiston et al. (2002) noted that,
there were constraints of time and resource working
against effective collaboration. Although
collaboration was regarded as a vehicle for achieving
shared goals, there were still problems and
inconveniences borne by those involved.
The European Educational Researcher | 55
Collaboration has in some countries benefitted from
heavy funding. According to (Armstrong, 2015), in
England, there was an initiative to create a network of
Maths hubs. This resulted in the creation of 32 hubs
across the country with a financial implication of
£11million. The creation of these hubs was meant to
tap the expertise and knowledge across the country
and eventually share the good practices (DfE,
2014a).There were reports that, schools were banding
together to assist each other through willing
distribution of professional knowledge and sharing of
resources (Armstrong, 2015; Hargreaves, 2010). For
instance, a project that was designed to increase
collaboration between Independent and state schools
saw the project get a funding of £176, 288 in 2014
(Armstrong, 2015). Although it was reported that, in
Norway, there was an industry-education
collaboration which saw companies contribute to
schools financially (Rustena & Hermelinb, 2017), the
exact amount spent on this collaborative effort is not
clear. Similarly, a study by Schenke et al. (2016)
revealed that, 12 Research &Development projects in
secondary schools in Netherlands received funding
from the Dutch Council for secondary Education, but
again, the amount was not specified. It is worth noting
that, these studies and reports detail the element of
how much it cost to carry out collaborative activities
but they are silent on whether this translated into any
improvement in learning outcomes for the students
and schools involved. Loveland, Miyakawa and
Hirayama (2004) presented an account of the Japan-
Florida Teens Meet Project involving collaboration
with Yumegakuen High School and Ridgewood High
School in an electronic environment. The two
teleconferences held between the schools cost $400. A
collaboration aimed at increasing the number of
specialist schools and raising standards throughout
secondary education cost £2,133, 150 (Woods et al.,
2006). This investment led to an improvement in the
overall GCSE results.
Where collaboration activities were funded centrally
by the government, sustainability was a problem when
this funding ended (Turner, 2004, Woods et al., 2010).
This means as collaborations are established, there
should be clear funding modalities as well as
mechanisms for sustainability so that, the initial aim of
collaboration does not necessarily end with the
withdrawal of funding. When this happens it is a sure
way of eroding the gains realized.
While literature dwells on financial and time
requirements for collaboration, this practice also
requires human resource investment. In a review of
literature on inter school collaboration, Atkinson, et al.
(2007) found that, of the collaborations reviewed,
some involved a small number of staff but others
involved the governing body, large numbers of
teachers and auxiliary staff. Occasionally, students
and parents were involved (Department for Education
and Skills, 2007e).
Benchmarking at the school level most often involves
looking to better performing schools for practices that
contribute to their sterling performance. This means
educators getting out of their comfort zones and
physically traveling to top performing schools for first
hand information and experience. If best practices are
adopted by educational institutions that benchmark, an
improvement in academic achievement is likely to be
realized. However, for such trips to be effective in
turning performance around there is need for
institutions to commit time, financial and human
resources among other things (Montoyer, 2008).
According to Ruby (2013), benchmarking has been

56 | A M U N G A
criticized for being relatively expensive both in terms
of the finances required and the time. There were visit
costs which included payment for hotel rooms, travel
expenses and meals. There was also the issue of lost
labour time. When such time was lost, in some cases,
extra labour had to be hired or colleagues had to cover
for each other or compensate for lost time where
possible (ibid). Although financial resources were
likely to be limited for benchmarking exercises
conducted by the institutions’ staff than when using an
external consultant, it was still considered a
worthwhile investment that would be necessary at
some level.
In Australia, Universities participated in the
NACUBO benchmarking studies. Participating
institutions paid $15,000 per annum (Massaro, 1998).
In England, it is reported that, mounting one
benchmarking study cost $50,000-$100,000.
Participating institutions did not pay direct costs but it
cost approximately four peoples’ day input (Lund,
1998). In England, benchmarking in higher education
is part of Higher Education Funding Council for
England (HEFCE) funded benchmarking project
whose aim is to improve processes and efficiency
within universities and colleges (Universities UK,
2011). Most of the literature reviewed focuses on
higher education. There is hardly much literature on
benchmarking at the secondary school level. This is an
indication that, this is a practice popular at the higher
education level hence the need for this investigation.
In Kenya, inter-school collaboration and
benchmarking are two of the improvement techniques
which have been adopted by schools in order to boost
performance and move the majority of the students to
the C+ and above bracket, which is the minimum
university entry requirement. Hence, the adoption of
these two strategies meant to improve performance
echoes the trend on the international sphere where the
efforts of collaboration and benchmarking are meant
to maximize the capabilities of participants, and
enhance the quality of the products and outcomes. The
aim of this study was to establish whether investment
in these two practices was justified or misdirected.
Research Objective
1. To investigate the relationship between
investment in collaboration and
benchmarking, and academic achievement.
Research Hypotheses
1. HO1: There is no significant relationship
between investment in collaboration and
benchmarking, and academic achievement.
Methods
Participants
The sampling frame comprised schools previously
classified as provincial secondary schools while target
population were the103 secondary schools identified
as being involved in collaboration and benchmarking.
Of these, 31 schools (30%) were then used in the study
(Gay, 1983; O’Connor, 2011). A total of 62
participants comprised of all the 31 principals and 31
Directors of studies (DOSs) from the sampled schools
formed the study sample. Principals were chosen as
respondents in this study as they represented the
administrative authority in schools and their consent
was needed to access school data. They also initiated
and determined the success of collaboration and
benchmarking activities. The study required
information on financial investment in collaboration
and benchmarking which only the principals could
provide because they authorized the funding of these
activities. Directors of studies were in charge of the
schools’ academic records. They were included to
provide information on academic achievement.

The European Educational Researcher | 57
Instrument
Questionnaires with open and closed ended items were
used to collect information from the Principals and
Directors of Studies.Principals provided
information on the amount of money they had
spent on collaboration and benchmarking and the
number of days utilized for the activities, while the
Directors of Studies provided information on
academic achievement in their schools as measured by
a national examination index (the mean score). Both
the principals and Directors of Studies indicated
members from their schools who participated in
collaboration and benchmarking activities.
Sincedocuments are an important source of data in
many areas of investigation (Mutai, 2000), results
analysis sheets kept in the education office were used
for corroboration of the information obtained from
schools on academic achievement.
Data Analysis
Information on the duration (days) spent on
collaboration was summarised and presented on pie
chart because the data was categorical and set on the
ordinal scale. Information on the staff (human
resource) involved was summarised and tabulated.
The relationship between investment in collaboration
and benchmarking, and academic achievement was
presented on scatter plots because the data was
continuous and set on the interval scale. Inferential
statistics were used to establish the nature of
relationship between financial investment in
collaboration and benchmarking. To begin with, the
Pearson Product Moment Correlation Coefficient
(PPMCC) was determined, and then multiple linear
regression was used to establish the strength of
relationship and identify the most significant predictor
of academic achievement.
Results
Financial Investment
Information on investment in collaboration and
benchmarking was obtained from the principals of
sampled schools which were involved in these
activities. They were requested to indicate the amount
of money they spent on all their collaboration and
benchmarking activities. This information was
correlated with information on school mean scores
received from the Directors of Studies. To establish if
there was any linear relationship between financial
investment in collaboration and academic
achievement; and financial investment in
benchmarking and academic achievement, the data in
each case was presented on a scatter plot.
Figure 1 shows the relationship between the
expenditure (in Kenya shillings) on collaboration and
academic achievement (represented by mean scores),
while figure 2 shows relationship between the
expenditure (in Kenya shillings) on benchmarking and
academic achievement (represented by mean scores).
Figure 1
Investment in collaboration
58 | A M U N G A
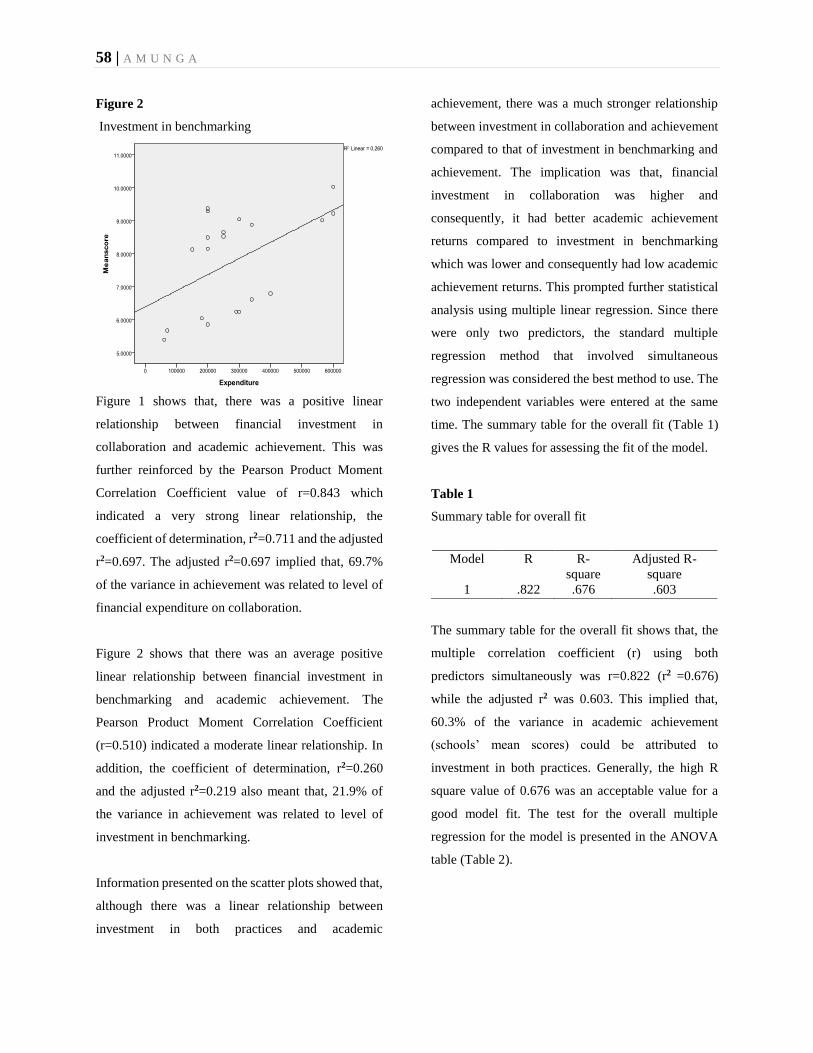
Figure 2
Investment in benchmarking
Figure 1 shows that, there was a positive linear
relationship between financial investment in
collaboration and academic achievement. This was
further reinforced by the Pearson Product Moment
Correlation Coefficient value of r=0.843 which
indicated a very strong linear relationship, the
coefficient of determination, r2=0.711 and the adjusted
r2=0.697. The adjusted r2=0.697 implied that, 69.7%
of the variance in achievement was related to level of
financial expenditure on collaboration.
Figure 2 shows that there was an average positive
linear relationship between financial investment in
benchmarking and academic achievement. The
Pearson Product Moment Correlation Coefficient
(r=0.510) indicated a moderate linear relationship. In
addition, the coefficient of determination, r2=0.260
and the adjusted r2=0.219 also meant that, 21.9% of
the variance in achievement was related to level of
investment in benchmarking.
Information presented on the scatter plots showed that,
although there was a linear relationship between
investment in both practices and academic
achievement, there was a much stronger relationship
between investment in collaboration and achievement
compared to that of investment in benchmarking and
achievement. The implication was that, financial
investment in collaboration was higher and
consequently, it had better academic achievement
returns compared to investment in benchmarking
which was lower and consequently had low academic
achievement returns. This prompted further statistical
analysis using multiple linear regression. Since there
were only two predictors, the standard multiple
regression method that involved simultaneous
regression was considered the best method to use. The
two independent variables were entered at the same
time. The summary table for the overall fit (Table 1)
gives the R values for assessing the fit of the model.
Table 1
Summary table for overall fit
The summary table for the overall fit shows that, the
multiple correlation coefficient (r) using both
predictors simultaneously was r=0.822 (r2 =0.676)
while the adjusted r2 was 0.603. This implied that,
60.3% of the variance in academic achievement
(schools’ mean scores) could be attributed to
investment in both practices. Generally, the high R
square value of 0.676 was an acceptable value for a
good model fit. The test for the overall multiple
regression for the model is presented in the ANOVA
table (Table 2).
Model R R-
square
Adjusted R-
square
1 .822 .676 .603
The European Educational Researcher | 59
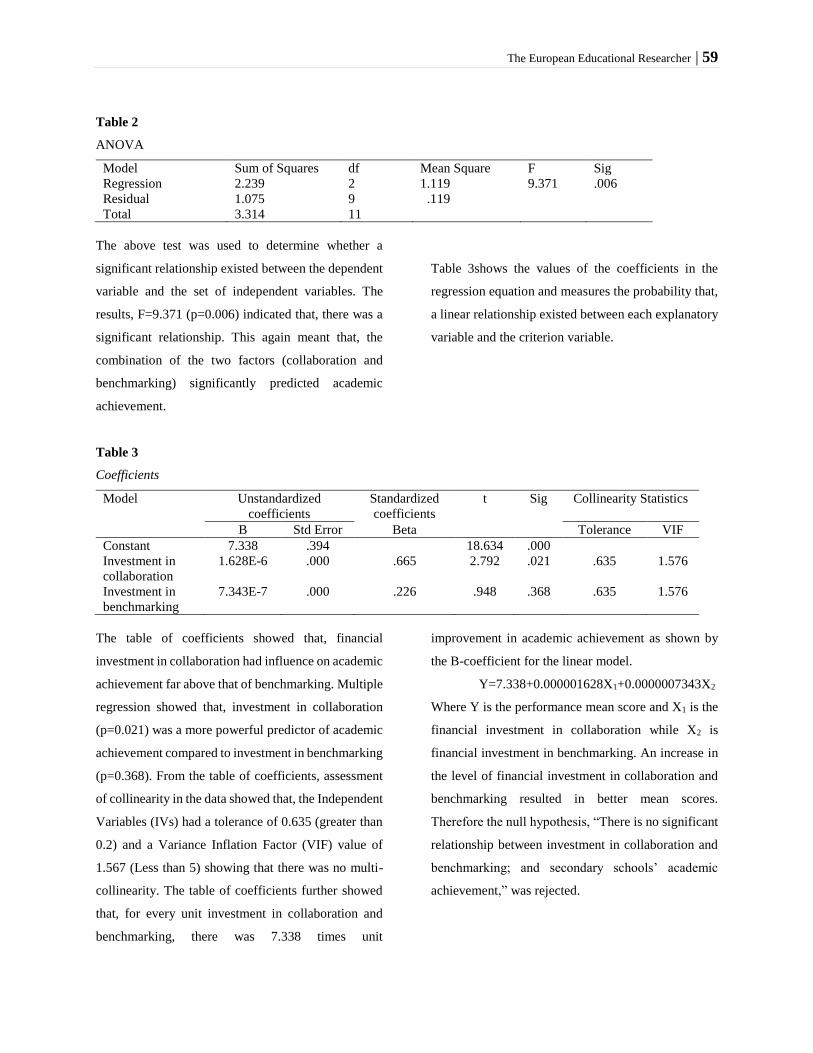
Table 2
ANOVA
Model Sum of Squares df Mean Square F Sig
Regression 2.239 2 1.119 9.371 .006
Residual 1.075 9 .119
Total 3.314 11
The above test was used to determine whether a
significant relationship existed between the dependent
variable and the set of independent variables. The
results, F=9.371 (p=0.006) indicated that, there was a
significant relationship. This again meant that, the
combination of the two factors (collaboration and
benchmarking) significantly predicted academic
achievement.
Table 3shows the values of the coefficients in the
regression equation and measures the probability that,
a linear relationship existed between each explanatory
variable and the criterion variable.
Table 3
Coefficients
Model Unstandardized
coefficients
Standardized
coefficients
t Sig Collinearity Statistics
B Std Error Beta Tolerance VIF
Constant 7.338 .394 18.634 .000
Investment in
collaboration
1.628E-6 .000 .665 2.792 .021 .635 1.576
Investment in
benchmarking
7.343E-7 .000 .226 .948 .368 .635 1.576
The table of coefficients showed that, financial
investment in collaboration had influence on academic
achievement far above that of benchmarking. Multiple
regression showed that, investment in collaboration
(p=0.021) was a more powerful predictor of academic
achievement compared to investment in benchmarking
(p=0.368). From the table of coefficients, assessment
of collinearity in the data showed that, the Independent
Variables (IVs) had a tolerance of 0.635 (greater than
0.2) and a Variance Inflation Factor (VIF) value of
1.567 (Less than 5) showing that there was no multi-
collinearity. The table of coefficients further showed
that, for every unit investment in collaboration and
benchmarking, there was 7.338 times unit
improvement in academic achievement as shown by
the B-coefficient for the linear model.
Y=7.338+0.000001628X1+0.0000007343X2
Where Y is the performance mean score and X1 is the
financial investment in collaboration while X2 is
financial investment in benchmarking. An increase in
the level of financial investment in collaboration and
benchmarking resulted in better mean scores.
Therefore the null hypothesis, “There is no significant
relationship between investment in collaboration and
benchmarking; and secondary schools’ academic
achievement,” was rejected.

60 | A M U N G A
The Investment of Time
Collaboration and benchmarking are improvement
techniques that also require the investment of time.
Principals were asked to indicate the number of days
they utilized per term for these activities. The general
picture of time spent on these activities is shown in
figure 3.
From Figure 3, most schools spent 10-20 days per term
on collaboration and benchmarking activities. These
activities involved visitations as well as joint activities
hence the need for the so many days that were utilized.
Human Resource Investment
The information used to establish the members of the
school communities involved in collaboration and
benchmarking activities was sourced from both the
Principals and DOSs for corroboration. The
percentage is given to one decimal place in brackets.
Table 4 summarizes the findings.
Figure 3
Number of days spent on collaboration and
benchmarking
Table 4
Members involved in collaboration and benchmarking activities
Respondent All HODs Teacher
Examiners
Any
Teacher
Students
Total
%
Principal 12(19.4) 0 (0.0) 14(22.7) 5(8.1) 31(50)
DOS 12(19.4) 2(3.2) 13(21.0) 4(6.5) 31(50)
Total 24(38.8) 2(3.2) 27(43.6) 9(14.5) 62(100)
The findings revealed that, although the majority of
the respondents (27; 43.6%), said collaboration and
benchmarking practices were open to any teacher, a
significant number (24; 38.8%) reported that this was
carried out by all heads of departments. This meant in
the majority of schools, all the teachers participated in
collaboration and benchmarking. This element of
human resource investment also meant that, whenever
some teachers were engaged in collaboration and
benchmarking activities, their workloads had to be
shouldered by colleagues or that teachers had to assign
work to their classes.
All the participants were asked to respond to an open
ended question on the questionnaire on whether they
thought investment in these practices had been useful
for their respective schools. One of the Principals
explained that:
Collaboration encourages good relations
between teachers and learners, enhances early
syllabus coverage and enables schools to

The European Educational Researcher | 61
jointly produce examinations. This is usually
done by having teachers from collaborating
schools team up and prepare standard
examinations. This actually saves on time and
encourages resource sharing by participating
schools.
For some schools, collaboration led to the acquisition
of the best manpower, made schools restructure their
programmes to accommodate all the needs of
collaboration in advance, improved pedagogy and
fostered sharing of knowledge and ideas. The shared
instructional practices had led to improved
performance.
The positive observations notwithstanding, there were
respondents who felt collaboration had been useful but
it was quite expensive, time consuming and sometimes
difficult to sustain. A Director of studies remarked:
The biggest challenge is that, some schools
withdraw from the collaboration once they feel
that they have benefitted enough. In the process
some of the collaboration teams break up and
schools have to realign themselves with new
partners. This can be quite inconveniencing
when, as a school, you have already drawn a
collaboration programme indicating activities
and dates to avoid disrupting your academic
calendar.
It was also reported that, some schools were too
immersed in their traditional ways to change, while
others felt it created confusion due to constant
changing of collaboration partners.
On benchmarking, those who found it a useful
investment said that, it made schools borrow and adopt
best practices that resulted in improved academic
performance. It was also regarded as the best
mechanism in achieving success because it enhanced
creativity and improvisation. One DOS stated that:
Benchmarking has assisted our school to
continuously review targets set. We have kept
on revising our targets and using the
techniques we have borrowed from other
schools to achieve them. This has put our
school on a constant upward trend.
However, another DOSs complained aboutlack of
meaningful reports brought back to schools by the
teams that went out to benchmark as well as lack of
funds to implement learned strategies:
There is hardly improvement in performance
even after benchmarking because most of the
benchmarked ideas are not implemented
especially those that require additional
financial input. In addition, you may send out a
team to benchmark, but when the members
come back, they do not bother sharing the best
practices they went out to benchmark.
A principal was of the opinion that:
Most of what is learnt is forgotten as time goes
by and in some cases; teachers have a negative
attitude. There is also the problem of lack of
honesty by some benchmarked schools which
do not share the secrets of their academic
success openly. Withholding of information
leaves members who have enthusiastically set
out on the benchmarking mission feeling
cheated.
62 | A M U N G A
Discussions
The findings of the current study showed that
collaboration required financial, time, and human
resource investment. The financial investment in
collaboration and benchmarking activities was borne
by individual participating schools. They were
therefore in direct control of the collaboration
activities. In the reviewed studies, collaborations faced
sustainability issues because of the termination of
central funding (Turner, 2004; Woods et al., 2010).
This contrasts with the current study where although
the funding was internal and sustainable,
colloborations collapsed when schools withdrew from
the partnership. Findings of this study revealed that,
collaboration and benchmarking led to sharing of
knowledge, resources and adoption of best practices
which in turn improved academic achievement. This is
in agreement with what was reported by other scholars
who made similar observations (Bouchamma et al.,
2012; Armstrong, 2015; Hargreaves 2010; Weindling,
2005; Ruby, 2013).
The findings of the current study which showed that
investment in collaboration positively affected
achievement agreed with findings of Woods, et al.
(2006) who reported that, investing £2, 133,
150contributed to improved overall GCSE results.
However, although most of the other reviewed studies
and reports (Morris, 2007; Loveland et al., 2004; &
Atkinson et al., 2007) detailed financial investment in
collaborative activities, there was hardly any statistical
evidence of how this affected academic achievement
in schools creating a point of departure with this study
because it clearly correlates financial investment in
collaboration and performance.
The findings of this study on financial and human
resources requirements for collaboration and
benchmarking again agreed with Montoyer (2008)
who reported that, there were visit costs which
included payment for hotel rooms, travel expenses and
meals. On investment of time, findings of the current
study showed an average of 10-20 days spent per term.
This agreed with the findings of Woods et al. (2006)
that showed some schools reported as many as 400-
500 hours per term but on average, with teachers
devoting 200 hours on collaborative activities. The
200 hours therefore translated into about 17 days a
term on the assumption that day time was what was
fully utilized. This implied that, setting time aside for
collaboration activities was important. Other authors
(Atkinson et al., 2007; Woods et al., 2006 & Lindsay
et al., 2005) found that collaboration was constrained
by lack of adequate time, finances and distance.
Similarly, respondents in the current study complained
of insufficient time and logistic challenges of distance
and finances that saw them change their collaboration
partners.
The findings of the current study also indicated that
schools invested financial and human resources in the
benchmarking activities. As reported by many
respondents, teachers were mostly involved in the
exercise. Again, the findings of the current study on
human resource investment were also similar to those
of DfES (2007e) which reported participation of large
numbers of teachers. However, while DfES (2007e)
reported that, apart from teachers, parents and the
governing body also took part, in this study, it ismainly
the teachers who were involved. The difference in the
finding could be attributed to the fact that, these
activities in the present study were mainly geared
towards academic achievement. The activities were

The European Educational Researcher | 63
therefore examination oriented requiring the input of
teachers in the setting, marking and revision of
examinations. It is noted that, collaboration had a
higher investment and consequently better returns on
academic achievement because it is a practice that
took place throughout the year. Setting, marking
exams and revision was a continuous process during
form four (final school year for students). It therefore
required regular funding. Benchmarking on the other
hand was a one off activity hence the minimal
investment and lower returns.
Conclusions and Recommendations
The findings revealed a positive linear relationship
between financial investment in collaboration and
benchmarking; and academic achievement. It was
therefore concluded that, since collaboration and
benchmarking accounted for 60.7% of the variance in
achievement, only 39.3% of the variance could be
accounted for by other factors. The study also
concluded that, while the two practices seemingly
enhanced academic achievement, investment in
collaboration was higher and consequently academic
achievement was better (r2=0.711) compared to
benchmarking (r2=0.260). Most schools seemed to
have under-invested in benchmarking and probably,
this was why the returns were low. On the investment
of time, findings showed that, most of the schools used
10-20 per term on these activities. Most of the
participants involved in collaboration and
benchmarking activities were HODs and teachers.
Following these conclusions, it was recommended
that, schools should generously and uniformly invest
in both collaboration and benchmarking in order to
boost academic achievement. Secondly, the alumni of
schools that are not financially endowed should be
encouraged to set up a special fund meant for
collaboration and benchmarking activities. School
managers were advised to form memoranda of
understanding with partner schools to cushion
themselves against sudden collaboration withdrawal
shocks. Finally, well endowed schools should be
encouraged to share their resources.
References
Aiston, S., Rudd, P.,& O’Donnell, L. (2002). School Partnerships in Action: A Case Study of West Sussex Specialist
Schools. (Report No. 36). Slough: NFER.
Amunga, J.,Ondigi, B., Ndiku, J., & Ochieng, P. (2013). Collaboration, benchmarking and secondary schools’ mean
scores in the western region, Kenya: An analytical investigation. International Journal of Education and
Research, (9), 133-140.
Armstrong, P. (2015). Effective school partnerships and school collaboration for school improvement: a review of
evidence.
https://assets.publishing.service.gov.uk/government/uploads/system/uploads/attachment_data/file/467855
/DFE-RR466-school_improvement_effective_school_partnerships.pdf
Atkinson, M., Springate, I., Johnson, F., & Hasley, K. (2007). Inter-school collaboration: A literature review.
Slough: NFER.

64 | A M U N G A
Bernis, W., & Biederman, P. (1997). Organization genius: The secrets of creative collaboration. Reading, MA:
Addison-Wesley.
Bouchamma, Y., Savoie, A., & Basque, M. (2012). The impact of teacher collaboration on school management in
Canada. US-China Education Review B5, 485-498.
Darling-Hammond, L., Wei, R., Andree, a., Richarson, N., &Orpanos, S. (2009).State of the profession: Study
measures status of professional development. JSD 30(2), 49-50.
Department for Education and Skills (2007e). Teachernet case studies: Fostering global links between London and
Ghana. www.teachernet.gov.uk/publications
Department for Education (DfE) (2014a). Maths Hubs: Guidance.
https://www.gov.uk/government/uploads/system/uploads/attachment_data/file/28817/DRAFT_Math_hub
s_guidance_doc_v10.pdf
Dillion, P. (2005). Studying and enhancing professional learning community for school effectiveness in Iceland .
REICE (1), 1-16.
Gay, R. L. (1983). Educational Research: Competencies for analysis and application (3rded.). Toronto: Merrol
Publishing Company, Florida International University.
Hargreaves, D. H. (2010). Creating a Self-improving School System. Nottingham: National College.
Lindsay, G., Arweck, E., Chapman, C., Goodhall, J., Muijs, D., & Harris, A. (2005). Evaluation of the Federations
programme: 2nd Interim Report. Warwick: The University of Warwick.
Loveland, T., Miyakawa, H., & Hirayama, Y. (2004). International Collaboration in secondary level education. The
Journal of Technology Studies. 10-18.
Lund, H. (1998). Benchmarking in U.K higher education. In A. Schofield (Ed.), Benchmarking in higher education:
An international review. Paris: UNESCO.
Massaro, V. (1998). Higher education benchmarking in Australian higher education. In A. Schofield (Ed.),
Benchmarking in higher education: An international review. Paris: UNESCO.
Montoyer, R. (2008). Critical successful factors for effective benchmarking. Brussels: Education and Culture D.G.
Moriarty, J. P. (2008). A theory of benchmarking. A thesis submitted in fulfillment of the requirement for the
degree of Doctor of Philosophy at Lincoln University.
Morris, S. (2007). NCSL/ Kirklees LEArning Project: Developing collegiates
https://cms.ncsl.org.uk/media/F7B/56/lea-project-case-study-kirklees.pdf
Mugenda, O. M., & Mugenda, A. G. (2003). Research methods: Qualitative and Quantitative Approaches. Nairobi:
Acts Press.
Mutai, B. (2000). How to write a quality research proposal. Edinburg. Thelley Publications.

The European Educational Researcher | 65
Rubby, A. (2013). Benchmarking as a driver for change. Benchmarking Governance as a Tool for promoting
change,57-66. Retrieved from https://repository.upenn.edu/gse_pubs/533
Rustena, G., & Hermenelinb, B. (2017). Cross sector collaboration in upper secondary school vocational education:
experiences from two industrial towns in Sweden and Norway. Journal of Education and Work, 30 (8),
813-826.
Schenke, W., Driel, J., Geijsel, F., Sligte, H., & Volman, M. (2016). Characterizing cross professional collaboration
in research and development projects in secondary education. Teachers and Teaching 22 (5), 553-569.
DOI: 10.1080/13540602.2016.1158465
School of Education (2008). School collaboration in Northern Ireland: Opportunities for reconciliation? Belfast:
Queen’s University.
Turner, J. (2005). Independent-state school partnerships. Educational Journal, 82, 29-29.
Turner, J. (2004) Building bridges: a study of independent-state school partnerships. Nottingham: National College
for School Leadership (NCSL).
Universities UK (2011). Efficiency and effectiveness in higher education: A report by the universities UK Efficiency
and Modernization Task Group. www.UniversitiesUK.ac.uk
Weindling, D. (2005). Teachers as collaborative professional: A survey of the views of ATL members. London: The
Education Union.
Woods, P., Levacic, R., Evans, J., Castle, F., Glatter, R., & Cooper, D. (2006). Diversity and collaboration?
Diversity Pathfinders Evaluation Report. Research No. 826. London: Department for Education and Skills.
Woods, C., Armstrong, P., Bragg, D., Collins, A., &Pearson, D. (2010) School Business Manager Demonstration
Project Evaluation Study: Final Report. Nottingham: National College for School Leadership (NCSL).
Corresponding Author Contact Information:
Author name: Jane Amunga
Department: Educational Foundations, Psychology and Management
University, Country: Kaimosi Friends University College, Kenya
Please Cite:Amunga, J. (2020). Investment in improvement strategies and academic achievement: The case of
secondary schools in Kenya. The European Educational Researcher, 3(2), 53-65. DOI: 10.31757/euer.322
Copyright: © 2020 EUER. This is an open-access article distributed under the terms of the Creative Commons
Attribution License, which permits unrestricted use, distribution, and reproduction in any medium, provided the
original author and source are credited.
Received: December 01, 2019 ▪ Accepted: May 09, 2020