investment in ireland and the eu - european … · investment in ireland and the eu . debora...
TRANSCRIPT

Investment in Ireland and the EU
Debora Revoltella Director
Economics Department
Dublin
April 10, 2017
20/04/2017 1

Real investment: IE v EU country groupings
20/04/2017 European Investment Bank Group 2
Real investment (2008 = 100)
Source: EIB, based on Eurostat National Accounts
40
60
80
100
120
140
160
180
IE Core Cohesion Periphery

-35.00
-15.00
5.00
25.00
45.00
65.00
1Q05 3Q06 1Q08 3Q09 1Q11 3Q12 1Q14 3Q15
Financial corporations Government HH NFC Total
-35.00
-15.00
5.00
25.00
45.00
65.00
1Q05 3Q06 1Q08 3Q09 1Q11 3Q12 1Q14 3Q15
Financial corporations Government HH NFC Total
Real investment: Sector-level
20/04/2017 European Investment Bank Group 3
Note: Includes 2016 revisions Source: EIB, based on Eurostat Sectoral Accounts
Real GFCF by institutional sector (4Q 2008 = 100)
IE EU28

-40
-20
0
20
40
60
80
100
1Q05
1Q06
1Q07
1Q08
1Q09
1Q10
1Q11
1Q12
1Q13
1Q14
1Q15
1Q16
IPP DwellingsOther structures Machinery & EquipmentOther Total
Real investment by asset
20/04/2017 European Investment Bank Group 4
Source: EIB, based on National Accounts and Eurostat
Real GFCF by asset class (1Q 2008 = 100) EU28 IE
-40
-20
0
20
40
60
80
100
IPP DwellingsOther structures Machinery & EquipmentOther Total

Infrastructure investment
20/04/2017 European Investment Bank Group 5
Source: EIB, based on Eurostat National Accounts
0
0.5
1
1.5
2
2.5
3
3.5
2005 2006 2007 2008 2009 2010 2011 2012 2013 2014 2015
% o
f GD
P
Government Corporate PPP Non-PPP Proejct
0
0.5
1
1.5
2
2.5
3
3.5
2005 2006 2007 2008 2009 2010 2011 2012 2013 2014 2015
% o
f GD
P
Utilities Transport Communication Education Health
Infrastructure investment in per cent of GDP

EIB Investment Survey (EIBIS)
• Annual survey commenced 2Q 2016
• Some 12,500 firms surveyed across EU28 (of which 400 in Ireland)
• NFCs with 5+ employees operating in manufacturing, services, construction &
infrastructure
• Qualitative and quantitative information on: • firm characteristics and performance • Investment needs and constraints • past investment activities and future focus • sources of finance
• Representative of the economy (firms weighted by value-added)
20/04/2017 European Investment Bank Group 6

20/04/2017 European Investment Bank Group 7
The share of Irish firms investing is already high and, on balance, these expect to mildly expand investment
Investment cycle
Medium/Large
Micro/Small Infrastructure
Services
Construction
Manufacturing IE
EU
IT
LV
LT
LU
MT
NL PL PT
RO
SK
SI
ES
SE UK AT
BE
BG
HR
CY
CZ
DK EE
FI
FR
DE GR
HU
-0.150
-0.100
-0.050
0.000
0.050
0.100
0.150
0.200
0.250
0.300
0.350
0.600 0.650 0.700 0.750 0.800 0.850 0.900 0.950 1.000
Low investment expanding High investment expanding
Low investment contracting High investment contracting
This graphs plots the average share of firms that invested in the previous financial year (x-axis) against the net difference between those intending to expand and those expecting to contract investment in coming year .

0%
20%
40%
60%
80%
100%
EU
Irela
nd
Man
ufac
turin
g
Con
stru
ctio
n
Serv
ices
Infra
stru
ctur
e
Mic
ro/S
mal
l
Med
ium
/Lar
ge
Organisation/business processes
Training of employees
Software, data, IT,website
R&D
Machinery andequipment
Land, business buildingsand infrastructure
Investment areas
Q. In the last financial year, how much did your business invest in each of the following with the intention of maintaining or increasing your company’s future earnings?
**The blue bars indicate the proportion of firms who have invested in the last financial year. A firm is considered to have invested if it spent at least EUR 500 per employee on investment activities. Investment intensity is the median investment per employee of investing firms.
0%
2%
4%
6%
8%
10%
12%
EL ES IT SK DE
HU PT AT CZ
EU18 SI DK
UK NL
US FI FR BE IE SE
Investment into intangibles
Share of Irish firms’ investment into intangibles highest in the EU, with machinery further crowded out by property
20/04/2017 European Investment Bank Group 8
Source: INTAN invest

%
20%
40%
60%
80%
100%
Irela
nd
Man
ufac
turin
g
Con
stru
ctio
n
Serv
ices
Infra
stru
ctur
e
Mic
ro/S
mal
l
Med
ium
/Lar
ge
At or above capacity EU average
Share of firms operating at or above capacity
9
%
20%
40%
60%
80%
100%
Luxe
mbo
urg
Mal
taAu
stria
Esto
nia
Rom
ania
Den
mar
kPo
rtuga
lPo
land
Ger
man
yN
ethe
rland
sU
KC
ypru
sH
unga
ryC
zech
Rep
Irela
ndBu
lgar
iaC
roat
iaSl
ovak
iaBe
lgiu
mIta
lySl
oven
iaSw
eden
Spai
nFi
nlan
dG
reec
eLa
tvia
Fran
ceLi
thua
nia
Full capacity is the maximum capacity attainable under normal conditions e.g., company’s general practices regarding the utilization of machines and equipment, overtime, work shifts, holidays etc. Q. In the last financial year, was your company operating above or at maximum capacity attainable under normal circumstances?
Share of firms at or above full capacity

%
20%
40%
60%
Mal
taSp
ain
Aust
riaG
erm
any
Italy
Slov
akia
Irela
ndH
unga
ryC
roat
iaN
ethe
rland
sSl
oven
iaBu
lgar
iaD
enm
ark
Belg
ium
Latv
ia UK
Rom
ania
Esto
nia
Luxe
mbo
urg
Swed
enPo
rtuga
lC
zech
Rep
Fran
ceFi
nlan
dPo
land
Lith
uani
a
Energy efficient building stock
Base: All firms Q. What proportion, if any, of your commercial building stock satisfies high or highest energy efficiency standards? Data not shown for Greece and Cyprus, as the Greek translation may have influenced interpretation of the question. This will be addressed in the next round of interviews.
%
20%
40%
60%
Ger
man
yAu
stria
Hun
gary
Mal
taSl
oven
iaIta
lySp
ain
Net
herla
nds
Luxe
mbo
urg
Esto
nia
Latv
iaBe
lgiu
mIre
land
Den
mar
kC
roat
iaSl
ovak
iaPo
rtuga
lFi
nlan
dC
zech
Rep
Rom
ania
Swed
enFr
ance
Lith
uani
aU
KPo
land
Bulg
aria
State-of-the-art machinery & equipment
Base: All firms Q. What proportion, if any, of your machinery and equipment, including ICT, would you say is state-of-the-art? Data not shown for Greece and Cyprus, as the Greek translation may have influenced interpretation of the question. This will be addressed in the next round of interviews.
Perceived investment gap
20/04/2017 European Investment Bank Group 10
0%
20%
40%
60%
80%
100%
Cyp
rus
Lith
uani
aSl
oven
iaG
reec
eC
roat
iaLa
tvia
Hun
gary
Den
mar
kR
oman
iaEs
toni
aPo
land
Slov
akia
Bulg
aria
Spai
nC
zech
Rep
Ger
man
yU
KIre
land
Portu
gal
Fran
ceM
alta
Swed
enLu
xem
bour
gN
ethe
rland
sFi
nlan
dBe
lgiu
mIta
lyAu
stria
Too much About the right amount Too little Don’t know
Perceived investment gap by country
Q. Looking back at your investment over the last 3 years, was it too much, too little, or about the right amount to ensure the success of your business going forward?
Quality of capital stock

0%
20%
40%
60%
80%
100%
EU
Irela
nd
Man
ufac
turin
g
Con
stru
ctio
n
Serv
ices
Infra
stru
ctur
e
Mic
ro/S
mal
l
Med
ium
/Lar
ge
Q. Looking ahead to the next 3 years, which of the following is your investment priority (a) replacing existing buildings, machinery, equipment, IT (b) expanding capacity for existing products/services (c) developing or introducing new products, processes, services?
0%
20%
40%
60%
80%
100%
Cro
atia
Rom
ania
Den
mar
kSl
ovak
iaN
ethe
rland
sC
ypru
sC
zech
Rep
Pola
nd UK
Ger
man
yAu
stria
Latv
iaG
reec
eLi
thua
nia
Swed
enBu
lgar
iaSp
ain
Hun
gary
Esto
nia
Luxe
mbo
urg
Italy
Slov
enia
Belg
ium
Irela
ndM
alta
Finl
and
Portu
gal
Fran
ce
Capacity expansion Replacement New products/services No investment planned
Investment focus over coming three years
11
Future investment priorities by country Irish firms’ future investment priorities by sector

Technology: Investment to modernise stock
20/04/2017 European Investment Bank Group 12
0%
20%
40%
60%
80%
100%
CZ DK FI IT SK ES UK HR PL IE SE CY BE HU NL PT DE FR MT LU LV LT RO BG EL SI AT EE
Investment in new products, processes or services that are new to the company, new to the country or new to the global market?
Did not invest in new products New to the company New to the country New to the global market
Base: All firms that invested in the last financial year (excluding don’t know/refused responses) Q. Were the new products, process or services (a) new to the company; (b) new to the country; (c) new to the global market?

0% 20% 40% 60% 80% 100%
Uncertainty about the future
Availability of finance
Adequate transport infrastructure
Business regulations
Labour market regulations
Access to digital infrastructure
Energy costs
Availability of staff with right skills
Demand for products or services
A major obstacle A minor obstacle
0% 20% 40% 60% 80% 100%
Uncertainty about the future
Availability of external finance
Adequate transport infrastructure
Business regulations
Labour market regulations
Access to digital infrastructure
Energy costs
Availability of staff with right skills
Demand for products or services
Firms that invested sufficiently Firms that invested too little
Long-term barriers to investment
Long-term barriers to investment: uncertainty & skilled labour
20/04/2017 European Investment Bank Group 13
Q. Thinking about your investment activities in Ireland, to what extent is each of the following an obstacle? Is a major obstacle, a minor obstacle or not an obstacle at all?
Long-term barriers by investment sufficiency

0%
20%
40%
60%
80%
100%
EU
Man
ufac
turin
g
Con
stru
ctio
n
Serv
ices
Infra
stru
ctur
e
SME
Larg
e
Bank loan
Other bank finance
Bonds
Equity
Leasing
Factoring
Loans fromfamily/friends
Grants
Other
Very high reliance on internal finance
20/04/2017 European Investment Bank Group 14
0%
20%
40%
60%
80%
100%
EU
Irela
nd
Man
ufac
turin
g
Con
stru
ctio
n
Serv
ices
Infra
stru
ctur
e
Mic
ro/S
mal
l
Med
ium
/Lar
ge
External Internal Intra-group
Q. Approximately what proportion of your investment in the last financial year was financed by each of the following?
Type of financing used for investment
Q. Approximately what proportion of your external finance does each of the following represent?

Access to finance: a story of two worlds
20/04/2017 European Investment Bank Group 15
PT
EL
HU
HR CY
IE
MT
BG LT
RO
SL IT
LV
NL
SK
ES
UK
AT
DE
PL
BE
DK
FR
EE FI
CZ
LU
SE
0%
5%
10%
15%
20%
25%
30%
0% 2% 4% 6% 8% 10% 12% 14% 16% 18%
Shar
e of
inve
stin
g fir
ms
that
are
hap
py to
rely
ex
cl. o
n in
tern
al fu
nds
Share of investing firms that are external finance constrained
High availability of internal sources; high external barriers
little availability of internal sources; high external barriers
high availability of internal sources; low external barriers
little availability of internal sources; low external barriers
Base: All firms
Finance constrained firms include: those that invested which dissatisfied with the amount of finance obtained (received less), firms that sought external finance but did not receive it (rejected) and those who did not seek external finance because they thought borrowing costs would be too high (too expensive) or they would be turned down (discouraged) Firms happy to use internal funds are those that invested using exclusively internal funds and who stated that they did not seek any external finance because they were satisfied with their internal funds.
Internally financed vs. financially constrained

0% 20% 40% 60% 80% 100%
Amount obtained
Cost of finance
Maturity
Collateral
Type of finance
Very satisfied Fairly satisfied NeitherFairly dissatisfied Very dissatisfied
0%
5%
10%
15%
20%
Portu
gal
Cyp
rus
Gre
ece
Mal
taBu
lgar
iaC
roat
iaH
unga
ryIre
land
Rom
ania
Lith
uani
aSl
oven
iaLa
tvia
Italy
Net
herla
nds
Slov
akia
Spai
nAu
stria
Belg
ium
Ger
man
yU
KD
enm
ark
Esto
nia
Fran
cePo
land
Finl
and
Cze
ch R
epLu
xem
bour
gSw
eden
Rejected Received less Too expensive Discouraged
Share of financially constrained firms
Financially constrained firms
20/04/2017 European Investment Bank Group 16
Base: All firms; Finance constrained firms include: those dissatisfied with the amount of finance obtained (received less), firms that sought external finance but did not receive it (rejected) and those who did not seek external finance because they thought borrowing costs would be too high (too expensive) or they would be turned down (discouraged)
Satisfaction with external finance
Q. How satisfied or dissatisfied are you with …?

Brexit
20/04/2017 European Investment Bank Group 17
0%
20%
40%
60%
80%
100%
positive negative no impact Don't know/refused
Expected effect of outcome of Brexit referendum on investment activities
Q. How do you expect the outcome of the UK referendum on EU membership to affect your investment activities in the coming year?

Summary Survey findings for Ireland
• Investment continues to recover, though data and accounting particularities
related to multinationals blur the picture.
• Infrastructure investment severely hit and continued to suffer through 2015,
with the impact of fiscal constraints on public sector capital investment driving;
• High private sector propensity to invest ongoing, with rotation toward catch-
up in construction and services; elevated share of smaller firms not investing;
• Main barriers to investment are uncertainty, lack of skills, energy costs, and
digital infrastructure; external finance a limiting factor for firms that underinvested.
• Polarised world of financing needs, with a high share of firms relying on
internal finance, including intra-group, and most of the remainder on banking, with
an elevated share of firms experiencing constraints, especially smaller and
younger firms; cost and collateral requirements are important.
20/04/2017 European Investment Bank Group 18

Thank you!
19

Annex
20/04/2017 European Investment Bank Group 20
0%
20%
40%
60%
80%
100%
EU
Irela
nd
Man
ufac
turin
g
Con
stru
ctio
n
Serv
ices
Infra
stru
ctur
e
Mic
ro/S
mal
l
Med
ium
/Lar
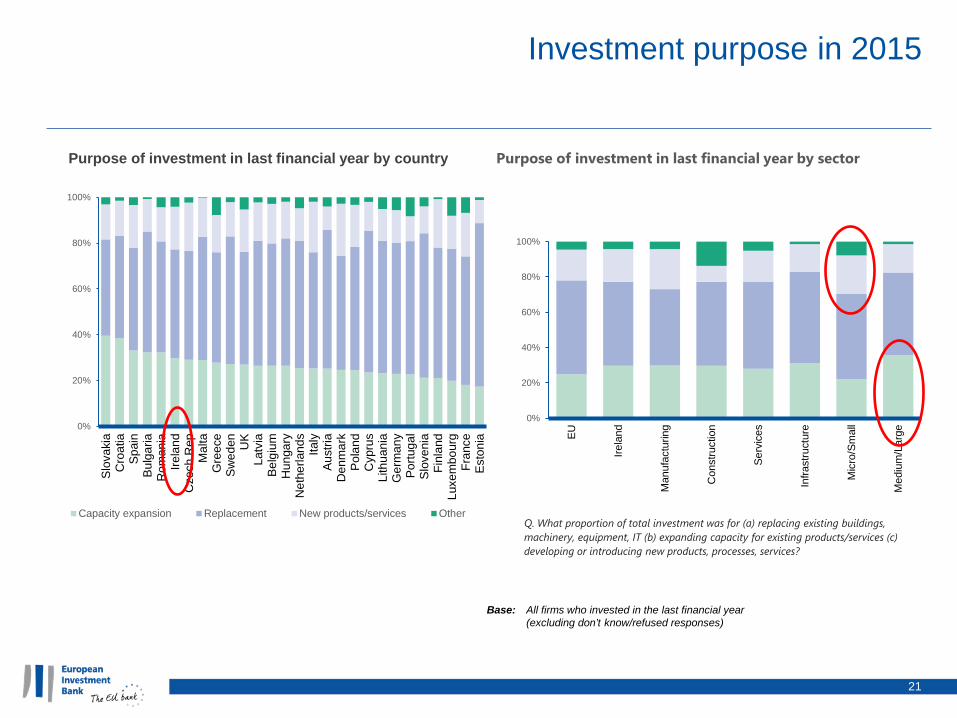
ge
Purpose of investment in last financial year by sector
0%
20%
40%
60%
80%
100%
Slov
akia
Cro
atia
Spai
nBu
lgar
iaR
oman
iaIre
land
Cze
ch R
epM
alta
Gre
ece
Swed
en UK
Latv
iaBe
lgiu
mH
unga
ryN
ethe
rland
sIta
lyAu
stria
Den
mar
kPo
land
Cyp
rus
Lith
uani
aG
erm
any
Portu
gal
Slov
enia
Finl
and
Luxe
mbo
urg
Fran
ceEs
toni
a
Capacity expansion Replacement New products/services Other
Investment purpose in 2015
21
Purpose of investment in last financial year by country
Base: All firms who invested in the last financial year (excluding don’t know/refused responses)
Q. What proportion of total investment was for (a) replacing existing buildings, machinery, equipment, IT (b) expanding capacity for existing products/services (c) developing or introducing new products, processes, services?

External finance
20/04/2017 European Investment Bank Group 22
Satisfaction with external finance
0% 20% 40% 60% 80% 100%
Amount obtained
Cost of finance
Maturity
Collateral
Type of finance
Very satisfied Fairly satisfied Neither Fairly dissatisfied Very dissatisfied
Q. How satisfied or dissatisfied are you with …?
0
0.05
0.1
0.15
0.2
0.25
0.3
0.35
0.4
0.45
0.5
Received Less Rejected Too Expensive Discouraged
Base: All firms; Finance constrained firms include: those dissatisfied with the amount of finance obtained (received less), firms that sought external finance but did not receive it (rejected) and those who did not seek external finance because they thought borrowing costs would be too high (too expensive) or they would be turned down (discouraged)

Productivity On average, Irish firms are more productive than their EU counterparts
Average firm-level TFP growth is falling in IE but the growth rate is higher than in the EU
70
80
90
100
110
120
130
2006-2008 2009-2011 2012-2014Inde
x (1
00 =
med
ian
TFP
for t
he E
U in
200
6-20
08)
Distribution of firm-level TFP in Ireland
p10 p50 p90 mean
-1
-0.5
0
0.5
1
1.5
2
2.5
3
3.5
4
4.5
EU IE Core Periphery Cohesion
2006-2008 2009-2011 2012-2014
Note: Core: AT BE DE DK FI FR SE UK; Periphery: EL ES IE IT PT SI; Cohesion: BG CZ EE HU PL RO SK. Source: ECON calculations based on the Bureau Van Dijk’s Orbis database.