investment in land and water - food and agriculture
TRANSCRIPT


RAP publication: 2002/09
Food and Agriculture Organization of the United Nations
Bangkok, March 2002
INVESTMENT IN LAND AND WATER
Proceedings of the Regional Consultation
BANGKOK, Thailand3-5 October 2001

The designations employed and the presentation of material in this publication donot imply the expression of any opinion whatsoever on the part of the Food andAgriculture Organization of the United Nations concerning the legal status of anycountry, city or area or of its authorities, or concerning the delimitation of its frontiersor boundaries.
All rights reserved. No parts of this publication may be reproduced, stored in aretrieval system, or transmitted in any form or by any means – electronic,mechanical, photocopying or otherwise – without the prior permission of thecopyright owner. Applications for such permission, with a statement of the purposeand extent of the reproduction, should be addressed to the Information Office, Foodand Agriculture Organization of the United Nations, Regional Office for Asia and thePacific, Maliwan Mansion, 39 Phra Atit Road, Bangkok 10200, Thailand.
FAO/RAP 2002
ISBN
974 - 7946 - 17 - 3

Investment in land and water iii
Preface
One of two themes for the forthcoming World Food Summit: five years later (WFS:fyl) is MobilizingResources to Fight Hunger. FAO is concerned that investment in agriculture continues to declineinstead of growing as demanded by the World Food Summit in 1996. The incremental requirementsof agricultural investment in developing countries are estimated at US$30.7 billion per annum – ofwhich approximately one-third is needed for irrigation. The evidence suggests, however, thatagricultural investment has progressively declined rather than increased. For instance, the share foragricultural lending in the loan portfolio of The World Bank fell below 10 percent in the year 2000compared with 40 percent 30 years ago. One possible cause for declining investment in agriculturemight be the historically poor performance of such investments and the non-recognition of theirsecondary benefits. There is also a shift from public to private investment which does not fullycompensate the decline.
FAO is therefore striving to reverse the trend of declining investment and to draw attention tothe fact that investment in Land and Water is a good investment, if managed properly. For thispurpose, the Regional Office for Asia and the Pacific in close collaboration with the Land and WaterDevelopment Division in FAO Headquarters organized and conducted the Regional Consultation onInvestment in Land and Water. Its objective is to raise awareness and to enlist and enable the supportof partners and member countries to attain enhanced commitment and innovation to financesustainable agricultural development and food security.
The consultation was held in FAO’s Regional Office for Asia and The Pacific in Bangkok,Thailand, from 3 to 5 October 2001. High level government officers from 12 countries in the regionparticipated together with observers from the Asian Development Bank, the International WaterManagement Institute (IWMI), the Mekong River Commission (MRC) and various Thai governmentagencies.
This publication contains the papers presented at the meeting as well as the highlights andrecommendations for enhanced investment in Land and Water which resulted from the group andplenary discussions. The Consultation adopted the Bangkok Declaration which urges Heads of Stateand Ministers of agriculture, rural development, planning and finance in the region to alert andmotivate the necessary political will and investment commitment, to form policies and take initiativesto create an enabling environment for sustainable land and water management and advances inagriculture and rural development leading to comprehensive food security.

Investment in land and water v
Contents
Page
SUMMARY REPORT, HIGHLIGHTS AND RECOMMENDATIONS 1
BANGKOK DECLARATION 11
RESOURCE PAPERS 13
Investing in land and water:
The fight against hunger and poverty in the developing Asia R.B. Singh 15
Investment in land and water in the context of the Special Programme on Food Security
J. Poulisse 39
The benefits of investment in land and water K. Yoshinaga 51
Agricultural investment strategies: prioritizing land and water Yoginder K. Alagh 67
Funding investment in land and water S. Saigal 79
Quantifying investment needs for agricultural development in Asia J. Poulisse 97
Investing in irrigation and drainage in the context of water policy and institutional reform
Thierry Facon 105
COUNTRY PAPERS 137
Bangladesh Khwaja Abdur Rahman 139
Cambodia Chann Sinath 161
China Zhou Yinghua 187
DPR Korea Mun Jong Nam 209
India Hemendra Kumar 217
Indonesia Ato Suprapto 233
Laos Anonth Khamhung 243
Pakistan Hafeez Akhtar Randwana 261
Republic of Korea Hong Sang Kim 283
Sri Lanka Henry Gamage 297
Thailand Land Boonkerd Budhak and Manu Srijakorn 313
Thailand Water Boonkerd Budhaka, Manu Srijakorn and Vason Boonkird 325
Vietnam Dao Trong Tu 339
Annex I: Agenda 353
Annex II: Participants 355
Investment in land and water 1
Summary report, highlightsand recommendations
BACKGROUND
One of the two themes for the forthcoming World Food Summit: five years later (WFS: fyl) isMobilizing Resources to Fight Hunger. FAO is concerned that investment in agriculture continues todecline instead of growing as demanded by the World Food Summit in 1996. The Land and WaterDevelopment Division at FAO Rome therefore initiated a process to enlist and enable the support ofessential partners to attain enhanced commitment and innovation to finance agriculture and foodsecurity. The Regional Consultation on Investment in Land and Water conducted by the FAORegional Office, Bangkok is a part of this process, to highlight the crucial importance of this themefor regional food security.
Arrangements and participation
The Regional Consultation was held from 3 to 5 October 2001 at the FAO Regional Office for Asiaand the Pacific (RAP) in Bangkok, Thailand.
In his opening address, R.B. Singh, Assistant Director-General and FAO RegionalRepresentative for Asia and The Pacific, highlighted the present situation and the prospects for foodsecurity, production and poverty in the region. He reported on the status of investment in land andwater, future needs and investment mechanisms and on a required policy framework for investment inland and water towards sustained food security and prosperity. He emphasized the need for anintegrated approach to land and water management, called for an investment strategy and stressed theneed for a flexible and participatory approach to capture the new technological, management anddevelopment opportunities by increased investment in land and water conservation, improvement andutilization. He called upon each nation to adopt and implement a national vision on investment in landand water.
The three-day meeting accomplished the following activities:
• summary presentation of resource papers;• summary presentation of country specific reports from 12 countries in the region;• group discussions (two groups) on selected topics;• preparation of conclusions and recommendations and discussion in a final plenary session; and• preparation, discussion and adoption of the Bangkok Declaration on Investment in Land and
Water as an essential input to the statements by country level delegations which will participatein WFS: fyl.
The Declaration immediately follows this summary. The agenda is given in Annex I; participantsare named in Annex II.

Summary report, highlights and recommendations2
High level government officers from 12 countries attended the Consultation: Bangladesh,Cambodia, China, Democratic Peoples’ Republic of Korea, India, Indonesia, Laos, Pakistan, Republicof Korea, Sri Lanka, Thailand and Viet Nam. In addition to FAO, representatives of internationalorganizations such as the Asian Development Bank, the Mekong River Commission (MRC) and theInternational Water Management Institute (IWMI) attended as observers.
HIGHLIGHTS AND RECOMMENDATIONS
Highlights
Land and land quality
The total land area of the Asia and the Pacific region is 3 001 million ha or 22.9 percent of the world’sland area. However adverse soils, climate and topographic factors limit the possibilities forsustainable agricultural production in about 86 percent of the region.
The consultation concluded that loss of potential soil productivity due to erosion and soilnutrient depletion, with an increasing net negative balance in the soil is the biggest threat to meetingthe region's future agricultural needs. Furthermore loss in soil productivity in both the commercial andsubsistence sectors causes high additional national costs, such as increased food imports, reducedexports and higher social welfare costs for those who fall below the poverty line.
Land and water investment decisions also have serious implications for global warming andclimate change. The potential for carbon sequestration in soils may be as high as 40 percent of thetotal annual atmospheric increase in CO2 concentrations, which may be increasingly tapped throughmultiple cropping and alternate multiple land use systems. Water management practices can greatlyimpact methane emission from paddy fields – an important point of consideration for Asia and thePacific region, as about 90 percent of world’s rice lands are here.
Scarcity of land and water
The consultation recognized the crucial role of intensified utilization of land and water resources forensuring food security, poverty alleviation and broad-based rural development. Estimates show thatbetween 1997 and 2030, about 80 percent of projected crop production growth in developingcountries will come from intensification as higher yields (69 percent) and cropping intensities (11percent), with only 20 percent coming from arable land expansion. The share resulting fromintensification will exceed 95 percent in land-scarce South, Southeast and East Asia.
Similarly in the water sector, by the year 2025, 48 countries with a population of more than1.4 billion persons will face water stress and scarcity. The per capita water availability in Asiadecreased from 9.6 to 3.3 km3/year between 1950 and 2000. Increasing water scarcity will resultlargely from rapidly growing demands for agricultural, industrial and household purposes.Degradation of irrigated land due to waterlogging, deterioration of water quality, upstream landdegradation, seasonal flooding and insufficient river flow will aggravate water shortage problems.The consultation viewed with concern the threat to agricultural production due to the water shortage:it is of particular concern because this sector accounts for 80 percent or more of total fresh water usein these countries.

Investment in land and water 3
Land improvement in less favoured rainfed areas
Farming systems in less favoured areas dominate mixed farming and other practices that contribute tosoil, nutrient and water conservation. Hence major productivity improvements will have to comefrom improved natural resource management practices, technologies for conservation tillage andintegrated watershed development.
Integrated watershed development has become the preferred approach for developing rainfedareas in many Asian countries with the twin objectives of resource conservation and development.Apart from direct benefits to the participants, the impact extends in terms of domestic production,enhanced food security, reduced market fluctuations, income and employment generation and foreignexchange savings.
Low and declining investment in agriculture
The already low and further declining trends in investment in agriculture through both domestic andexternal resources in most of the countries are matters of great concern. When measured in constant1995 price, official development assistance from bilateral and multilateral donors is 8 percent below1990 levels. The proportion of sectorally allocable aid reaching agriculture, forestry and fisheries fellto 20 percent in 1987-1989 and then to 12.5 percent in 1996-1998. In financial year 2000, WorldBank lending for agriculture and rural development was its lowest ever in both percentage terms andabsolute amounts. Current levels of foreign aid at 0.24 percent of annual GDP, fall short of the 0.7percent target set by developed aid-donor countries. Actual aid falls short of that target byUS$100 000 million a year. The share of agricultural lending in the loan portfolio of the World Bankfell below 10 percent in 2000, as against 40 percent 30 years ago. The World Commission on Waterconsiders investment levels to be less than half of that needed (about US$180 million per year) tomeet minimum water, sanitation and nutrition requirements in developing countries by 2025. Recentstudies indicate that the allocations for irrigation schemes and operation and maintenance are less than50 percent of what is required.
It should be recognized that investment in land or water development is not just an investmentin one item – it entails a chain reaction of investing in a whole range of elements such as farmingpractices, plant varieties, nutrients, human resources, the broader infrastructure and conducivepolicies. The Governments are committed to equity-led development goals. In order to enable land,water and labour resources to make their full contribution to achieve these goals, it is necessary tocontinuously enhance their productivity. This will not simply happen without increased investment inland and water development and associated policy reforms for realizing their full benefits and returns.
Investment requirements
Investment requirements can be grouped into two interdependent categories: the monetaryrequirement and the human resource and attitudinal requirement. Land intensification needs maygenerally encompass investments for:
• soil fertility maintenance by adequate levels of balanced fertilization and management of thestructural, textural and organic health;
• land shaping for adoption of minimum tillage and other land operation practices;• soil conservation and afforestation measures;• reclaiming acid, saline, alkali soils, ravine areas, stabilizing sand dunes, waterlogged and other
such degraded land; and• enriching the biological health of soils.
Likewise, investments in water resources, supply and use are required for:

Summary report, highlights and recommendations4
• design and construction of large, medium, small and micro irrigation schemes;• rehabilitation, upgradation and modernization of existing irrigation schemes and systems;• developing new and tapping unutilized water resources;• developing river basin-based integrated development and management of water;• prevention of water pollution and deterioration of water quality; and• integrated watershed development encompassing upgradation of arable land, non-arable land and
underground water, particularly in rainfed areas in arid and semi-arid zones.
Returns on investment in irrigation
A World Bank study of 208 World Bank funded irrigation projects implemented and evaluatedbetween 1950 and 1993, with loans of US$31 billion, indicated comparable satisfactory rates foragriculture as a whole and an all-project average of 65 and 76 percent respectively. The internal rateof return (IRR) for agriculture as a whole was 13 percent and the all-project average was 16 percent.Weighting irrigation projects by area served raises their average IRR to 25 percent with 84 percent ofthe projects rating satisfactory.
Private investment provides all financing for about 20 percent of the total area currentlyirrigated. The share of private investment in the remaining 80 percent is approximately half of totalinvestment.
The high population absorptive capacity of irrigation limits the migration of growingpopulations to areas of greater environmental risk. If additional water for irrigation – 17 percent by2025 – is not forthcoming, the increased burden on rainfed agriculture to meet demand will beenormous and more detrimental to the environment with far more land clearance than at present.
Producing more rice with less water is a formidable challenge for the food, economic, socialand water security of Asia. A comprehensive reform package is needed for improving theperformance of rice irrigation systems. The FAO estimate for increased irrigation efficiency indeveloping countries calls for a rise from 43 percent in 1995/1997 to 50 percent by 2030. This meansinvesting in generation of water saving technologies and practices and their extension, maximizingreturns from both water and land.
Expansion of irrigated area
Between 1961 to 1963 and 1995 to 1997, irrigated areas in developing countries increased at anannual rate of 1.9 percent to about 197 million ha, representing three-fourths of the world’s irrigatedarea, of which 74 percent is in Asia. Asia registered the largest increase with 70 million ha in India,Pakistan and China. However, the area of irrigated land is predicted to increase by 0.6 percent perannum to 242 million ha in 2030. Declining and insufficient investment in agriculture and watersector reflect this decreasing trend in irrigation expansion. This trend does not augur well for meetingthe expected food demands in the future and should be reversed.
Irrigation sector reforms
Irrigation sector reforms should be part of a more general reform of water resource management, inwhich issues of water allocation, water rights, ownership of transferred assets and financialmanagement of operation and maintenance of the irrigation systems are addressed. Wrong incentivessuch as poorly targeted subsidies or inappropriate water pricing systems can induce overuse orwastage of water and eventual groundwater depletion and deterioration of water quality.
Participatory irrigation management (PIM) and irrigation management transfer (IMT)

Investment in land and water 5
In Asia, where older public sector irrigation schemes are more than a few decades old, the issue ofrehabilitation, which is related to those of operation and maintenance and modernization, is becomingincreasingly important. Initial system designs may represent a severe constraint to the adoption of newand more flexible operational procedures required for present and future service requirements. Merelyrestoring the systems to their initial state will not be sufficient. Appropriate Participatory IrrigationManagement (PIM) and Irrigation Management Transfer (IMT) reforms can be instrumental inensuring that the systems are responsive to farmers’ needs. The new ideas about decentralizedirrigation improvement funds exemplify “smart subsidy schemes” that encourage investment by waterusers in maintaining and upgrading their schemes. Privatization of minor irrigation in Bangladeshmodels how policy liberalization accompanied by technical support can promote increasedsmallholder investment in irrigation and better management. Small-scale irrigation schemes canimplement efficient and flexible distribution and management regimes.
Rural micro-credit institutions
Governments and international donors have generally avoided investment in reforming rural financialsystems and developing credit facilities for small farmers with little or no collateral. Uncertainty ofland tenure is a deterrent to long-term and sustainable investment in land. Ambiguities relating torights of land, water and trees contribute to environmental degradation and curb investment desires.Other institutional aspects include the absence of clear community mechanisms for upkeep of publicassets and infrastructure, lack of financial services and the marginalization of women. The absence ofmicrocredit institutions discourages investment in soil and water conservation measures, particularlyif payback periods are relatively long. There is an urgent need to foster the growth and viability ofrural microcredit institutions.
RECOMMENDATIONS
Political will and investment commitment: Economic recession in the 1990s, coupled withglobalization leading to structural adjustment programmes, has constrained national resourcedevolution for land and water investment programmes which will adversely affect productionprospects in the future. Donor priorities in lending for infrastructure and social sectors have changed,further compounded the problem. However, intangible gains, positive externalities and environmentalpayoffs resulting from land and water development projects must be recognized. Synergies with otherrural development programmes which can be exploited and maximized demand increasing levels ofinvestment.
With this background, the consultation appealed to Asia-Pacific Heads of State (and toministers of agriculture, rural development, planning and finance) to alert and motivate their countries'political will and investment commitment to form policies and take initiatives in due proportion tourgency of sustainable natural resource management, to create an enabling environment for advancesin agriculture and rural development. The Consultation called upon Heads of State and Ministers toforge and enable public and private sector cooperation in investment and peoples' participation inplanning and implementation. Such cooperation would focus on watershed and river basindevelopment; integrated land, water and irrigation management; infrastructural and institutionalstrengthening and market reforms, human resource development (for generating, adapting andtransferring technologies and equity- and gender-sensitive approaches to increasing and diversifyingnational and regional agricultural economies) to inaugurate a sustainable Asia-Pacific Ever-GreenRevolution.
Economic policies: Arising from this political will and commitment to investment, suitable economicpolicies must be framed and an enabling environment created to ensure a fair return to cultivators,which in turn encourages their investment in land and water. Such policies may provide more

Summary report, highlights and recommendations6
incentives to the private sector, credit-linked beneficiary investment schemes, direct release of fundsto watershed development implementing agencies, decentralization and the devolution of power. Theyshould also include finance management, operational transparency, collective decision-making,targeted and structured subsidies, community-managed revolving funds, viable water use associations,cost sharing and community level support for higher quality first stage agricultural processingactivities, land rights and entitlements. The need for congruence and coherence among concernedsectoral policies was emphasized.
Priority land and water sector programmes included: conservation tillage, watersheddevelopment, small irrigation systems, groundwater development, improved lower level canalirrigation efficiency, conjunctive use of surface and groundwater, promotion of land consolidationagainst fragmentation and institutional capacity building. The Consultation recognized that improvedirrigation system efficiency, faster groundwater exploitation through aquifer management and landand water management in difficult agro-economic regimes requires greater involvement of farmersand community organizations. The Consultation noted that in many countries such “small projects”are already priorities and need more support, through organizational and financial reforms, for fasterreplication.
The Consultation observed that irrigation project development costs have risen significantlyin the recent past and therefore the benefit in terms of area coverage is not increasing in proportion toinvestment. It recommended that high priority may be assigned to complete the pending projects atthe earliest to avoid cost overruns and time overruns and to derive the benefits in a cost effective way.The magnitude of this situation as occurring in India and other countries needs to be redressed byenhanced investment.
Comprehensive country specific reform packages are needed to improve irrigation systemperformance. Irrigation Management Transfer (IMT) programmes often have budgets too small forinstitutional development, training and capacity building. This may constitute a threat to thesustainability of water user associations after IMT implementation and must be reflected in IMTinstruments.
Small-scale irrigation schemes can bestow efficient flexible distribution and managementregimes. Their limitations include no outside urgency to bear risk, lack of financial or borrowingcapacity, uneconomic irrigation design and management. In such schemes much higher investment bythe beneficiaries may be promoted.
Over-extraction of groundwater is widespread and caused by industrial, domestic andagricultural withdrawals. In substantial areas of China and India, groundwater levels are falling by 1-3metres per year. Over-extraction in coastal areas causes ingress of saltwater into freshwater aquifers.The Consultation recommended that investment in groundwater utilization must be based on waterbalance and recharge data of the area and the spatial distribution of wells and pumps regulatedaccordingly.
The Consultation recognized the FAO Agro-ecological Zoning Methodology (AZM) asproviding a broad framework for developing perspective national land use policy. Irrigation and waterrequirements must be systematically and scientifically assessed in the context of cultivable landavailability, food and agricultural production goals and demand-supply balance. “Global” and “local”models for assessing these needs and prospects are available and can be further developed, whichcountries must be aware of and capable of using in their development planning exercise.
Land and water use planning and management: The consultation noted that more attention is neededto improve planning of land use and land management. Natural resources inventorying, efficient crop

Investment in land and water 7
zoning, land reclamation and soil fertility improvement, arresting the impact of land degradationprocesses involving integration across disciplines, ministries, farmer groups and NGOs is required tomeet farmer-driven technology support for a diversified agricultural economy and sustained faster andmore broad based rural development. Countries were urged to evolve a perspective national land useand water policy fully internalized in national agricultural policy with emphasis on conservation offragile lands, restoration of problem lands and intensified production of good lands. Adequateinvestment must be mobilized for enabling community owned watershed development programmesand for environment-friendly integrated plant nutrient management programmes.
The Consultation noted that besides serious gaps in land and water management andpriorities, there are serious conflicts between quick gains and long-term sustainability. Severalsuccessful experiences of land and water management with tremendous impacts on production,productivity, food security, poverty alleviation, income, trade, and sustainability exist in Asian andother countries. The Consultation recommended that FAO should critically document and share theseexperiences with Member countries. There are cases of failures as well, which should also becritically analyzed and the causes behind made known to avoid further failures.
The Consultation appreciated that many times local wisdom, indigenous knowledge andtechnologies have been highly effective in land and water management. But in the rush for quick fixesand due to the lack of vision and perspectives, these traditions and wisdom are dying. TheConsultation recommended that management of investment in land and water must duly recognize thetraditional knowledge, and blend them with modern technologies referred to as ecotechnology. Theneed for investing in people in shaping their attitude and participation can hardly be overemphasized.The people are the real guardians as service providers as well as beneficiaries, and hence thedevelopment must be rooted in the spirit of “of the people, by the people and for the people."
System-based research and technology development: Given the complexity of judicious developmentand use of land and water resources, the Consultation emphasized that not only agro-physical andagro-biological issues but also socio-economic, environmental and ecological issues should beconsidered in a system approach to ensure the congruence of enhanced productivity (efficiency),sustainability, profitability and equity. Only such an integrated holistic and system-based research andtechnology development approach will simultaneously satisfy the varied stakeholders, such asfarmers, environmentalists (the “Green” lobby) and the wider public. Paradigm shifts are called for inresearch and development (R&D) to emphasize an interdisciplinary and multidisciplinary approachrather than monodisciplinary. Moreover, the process and not only the product, system-based and notjust commodity-based, and people-and-environment-driven and not just technology-driven need to beemphasized. The Consultation recognized that such R&D systems are bound to be complex anddemanding. Therefore, it is recommended that besides increasing R&D investments to meet thecomplex challenges, institutional supports and human resources should be adjusted for establishingand managing various linkages at national and international levels. For ensuring informed investmentand management of the resources, suitable indicators should be developed by NARS, IARCs andFAO for ascertaining economic, environmental, ecological and social costs and benefits.Consequently, policy research capacity, including socio-economic research capacity, will have to begreatly strengthened in national and international land and water R&D programmes.
The Consultation suggested that research and technology development efforts in land andwater sectors, backed up by adequate investment, should cover:
• mapping and use classification of land and water resources to improve the efficiency of land andwater use in agriculture;
• policy, institutional, economic and social aspects of land and water management;• design and operation of irrigation schemes;• management of watersheds for multiple functions;

Summary report, highlights and recommendations8
• management of aquatic ecosystems in particular those with boundaries with terrestrial ecosystem;• wastewater recycling, conjunctive water use, improved water quality and reduced water pollution;• restoration of fertility and structure of degraded lands and prevention of further degradation,
bioremediation; and• integrated soil-water-plant-nutrient management and fertility improvement.
In recent years, national and international agricultural research institutions (particularlyCGIAR, the Consultative Group on International Agricultural Research based at the World Bank)have allocated increased proportions of their budgets to natural resources management. But, often ithas happened at the cost of other equally important areas. Thus, there is a need for explicitlyallocating additional funds to land and water resources commensurate with the priority. Their workprogrammes should clearly identify multidisciplinary and multi-institutional activities. Concernedinstitutions must have capacity to value natural resources and analyze environmental impacts – costsand benefits to justify as well as to monitor the efficacy of the investments. Because ofmultidisciplinary and multi-component technology packages and the emphasis on bottom-up andparticipatory approaches, the Consultation recommended that the extension and technologyassessment and diffusion systems should be overhauled and suitably trained human resources shouldbe developed to establish effective research-extension-farmer-market linkages. The Consultationrecognized that the Asia-Pacific Region is the leader in development and widespread adoption ofIntegrated Pest Management (IPM) technologies, including the farmers’ field school (FFS) initiativeand recommended that FAO and NARS should use this experience in the investment and managementof land and water resources. Indicators and methodologies such as those developed by theInternational Water Management Institute should be internalized in national natural resourcemanagement research (NRMR) programmes.
Database and information sharing: The Consultation noted that adequate, timely and reliable data onthe state of land and water quality, degradation or improvement are generally not available. Itobserved that indigenous technologies and knowledge should form an integral part of databases.Public and private sectors should invest not only in necessary hardware and software but also inhuman resource training and development for collecting, collating and sharing information on landand water resources, recommended the Consultation. Soil and water clinics in rural areas should belinked with rural agricultural information centres which must constitute an integral part of the nationalagricultural information system. International organizations such as FAO, UNEP, CGIAR Centres –including IWMI and global and national Soil and Terrain Digital Database (SOTER) programmes –have established dynamic and comprehensive databases. National and international databases shouldbe linked with these databases for deriving maximum mutual benefits. FAO should strive toharmonize various indicators, methodologies for environmental and ecological accounting and datacollection formats for standardizing the information collection and interpretation procedures.

Investment in land and water 9
Integrated approach to investment in and development of land and water: The Consultationunderlined that although two distinct and two most fundamental natural resources, not only foragriculture but for the very life and existence of the humankind, land and water are intimatelyinterrelated resources. The extent, quality and productivity of the two resources are highlyinterdependent. Therefore, the Consultation emphasized that while there must be land-specific andwater-specific conservation, development and utilization policies, strategies and programmes, there isa need to have clear policy and approach for synergistic development and effective integration of landand water to enhance overall productivity, sustainability, profitability and reduction of environmentalcosts. The Consultation recommended that, on the demand side, land and water policies must bereformed to promote land and water savings through demand management and application ofappropriate technologies. Policy instruments for demand management may include: (i) enablingconditions through provisions of suitable land and water rights and laws to promote investment in andeffective management of the resources, (ii) market-based incentives to promote conservation of landand water resources such as organic farming, appropriate pricing, reduced subsidies on urban waterconsumption and targeted taxes and subsidies, (iii) non-market instruments, including restrictions,licenses and pollution controls and (iv) direct interventions, including conservation programmes.
Rights to land and water: Secure rights to land and water and rights of access to these resources areessential for long-term investment by farmers in land and water conservation and improvement, aswell as to enable the farmers to effectively participate in participatory planning, investment andmanagement. The Consultation expressed concern that such rights have not been granted in severalcountries to the actual users and developers of the resources, and recommended that this gap shouldsoon be rectified. Property rights for women farmers should be given due attention as the number ofwomen-headed households are increasing. Local customs, needs and specifics should be kept in mindwhile strengthening the rights regime, which must have efficient conflict-resolving investment-friendly mechanisms.
Financing mechanisms: The Consultation noted that government services to farmers are beingreshaped by decentralization of government services, with some reduction in quality of services.Governments are also involved in privatizing many services. These trends, along with the WTOsettings are creating changed circumstances in which small farmers have to produce agriculturalproducts and generate family incomes. The Consultation recommended that the impact of thesechanges on farmers and rural communities and future priorities for investment in the rural andagricultural sector should be analyzed. Besides identifying the priority areas for investment, it wouldbe essential to analyze the various financing mechanisms and their linkages. These linkages must bemanaged in consistence with the appropriate rights and laws related to the resources and theirtransparent governance. What is needed are new financing mechanisms, not criticizing the existingones.
The Consultation felt the need of a flexible, responsive and multi-directional financingmechanism. Country-owned poverty reduction strategies (CPRS) can be articulated to provide thebasis for donor concessional assistance (particularly World Bank and IMF lending) and use ofresources freed by debt relief enhanced under the highly indebted poor countries (HIPC) initiative. Itsuggested that the World Bank’s Comprehensive Development Framework (CDF) or its equivalentthe UN Development Assistance Framework (UNDAF) at the country level may form a basis forcoordination around programmes and action plans based on the countries Poverty Reduction StrategyPaper (PRSP). The Consultation noted that of the 23 LIFDCs with the highest prevalence ofundernourishment, 17 are in the HIPC group of eligible countries. Overall, 41 countries with US$170billion in external debt are eligible for consideration under HIPC initiative. The enhanced initiativeseeks to establish stronger link between debt relief and sustainable poverty reduction programmes inrecipient countries.

Summary report, highlights and recommendations10
With the above backdrop, the Consultation suggested that a ‘flexible lending framework'should be evolved as a mechanism for implementing CPRS. In this mechanism, World Bank may takethe lead in providing broad-based poverty reduction support credit (PRSC) linked to key objectives,reform areas and priority action areas such as land and water development. Governments will receivethe credit on IDA terms geared to performance. The funding is integrated with the governmentbudgetary cycle and augments the capacity to allocate resources on a cross-sectoral basis. In thisprocess and facilitation, FAO has a role in assisting governments in articulating agriculture sectorstrategy and in the formulation of programmes within CPRS framework. This also provides scope forinterested bilateral donors to enter into partnership with FAO to support such programmes.
The Consultation further suggested that while each country may evolve clearly defined rightsto land, rights to water, and necessary laws, comprehensive and transparent agrarian reforms shouldbe undertaken. The fundamental need for transparent governance of the natural and monetaryresources and implementation of the rights and laws can hardly be over-emphasized in the context offlow of funds, especially from external sources. Specific policies for promotion of public and privatesectors’ investment, loans, credit and subsidy ('smart' subsidy) with special consideration of need andprospect of small farmers, and the provision of necessary institutional and infrastructural support needto be put in place simultaneously. In their negotiations under the WTO Agreement, developingcountries must structure the 'green box' or if necessary introduce a 'food security box' in theAgreement, to protect the interest of small farmers and resource-poor .
National vision on investment in land and water: Recognizing the fundamental role of land and waterin the very livelihood of people and the state of these resources in the context of sustainable food andenvironmental security, the Consultation advocated that each nation must develop and adopt a visionon investment in land and water. Each country already has a national water vision. Investment is amean to achieve a vision. This should be based on the present and future needs of food andagricultural production and productivity and the national and global opportunities. Each nation mustassess the extent of cultivated land and irrigation it should have to meet its goals. The extent, statusand potential of the resources must be mapped systematically and scientifically, matched with popularaspirations, national capacity and development objectives. One cannot match resources withobjectives, This is magic. Instead, one should do the contrary. Based on this, will emerge explicittargets and policies and sectoral and subsectoral priorities for investment in land and water resources.
Investment in land and water 11
Bangkok DeclarationThe Asia-Pacific Regional Consultation on Investment in Land and Water comprising experts from12 Asian countries:
Concerned for declining quality and per capita availability of agricultural land and water, for highand increasing human-population pressure – with two-thirds of the world’s poor and hungryconcentrated in the Asia-Pacific Region, and alarmed by slow progress in achieving the 1996 WorldFood Summit target of halving by the year 2015 the global total of undernourished adults andchildren;
Conscious that for land and water – the core, but finite, base for agriculture – conservation,improvement, and judicious use and management are fundamental to sustainable livelihood systems,and that the productivity, profitability, income and employment opportunities and sustainability ofAsia’s diverse farming systems must be enhanced to ensure long-tem food security for each householdin every country;
Recognizing the predominance of small and marginal farm holdings and the risks of degradation ofland and water resources through soil erosion, soil-fertility depletion, salt intrusion, waterlogging,flooding, water-table lowering, and water-quality deterioration, and emphasizing the importance ofecotechnology and skilled management for preventing and controlling such degradation processes;
Noting the serious decline since 1990 in national budgets and in donor funding to agriculture ingeneral and to land and water sectors in particular, and mindful of much inefficient and non-transparent governance and of inadequate rights and laws for resource entitlement and utilization;
Stresses the importance and timely opportunity for the World Food Summit: five years later(WFS: fyl) to re-energize political commitments and investments to arrest and reverse the declines innatural resources and their funding supports, and to accelerate thereby an agriculture-led alleviation ofrural and urban hunger and poverty;
Appeals to the Asia-Pacific Heads of State – and to Ministers of Agriculture, Rural Development,Planning and Finance – to galvanize the political will and investment commitment to form policiesand take initiatives (in due proportion to the extreme urgency of sustainable natural-resourcemanagement) so as to create an enabling environment for advances in agriculture and ruraldevelopment; and
Calls upon the Heads and Ministers to forge and enable public and private sector cooperation ininvestment and in peoples' participation for: planning and implementation of watershed and river-basin development, for integrated land, water, and irrigation management, for infrastructural andinstitutional strengthening and market reforms, for human-resource development – particularly for thegeneration, adaptation and transfer of pertinent technologies, and for an equity- and gender-sensitiveapproach to intensifying and diversifying national and regional agricultural economies – therebyinaugurating a sustainable Asia-Pacific Ever-Green Revolution.
Bangkok, 5 October 2001

13
RESOURCE PAPERS

Investment in land and water 15
Investing in Land and Water:The fight against hunger and poverty in thedeveloping Asia
Sustained agricultural growth has been the engine of broad-based economic development, foodsecurity and poverty alleviation in most developing countries. Together with labour, capital andtechnology, land and water constitute the aggregate resource base for agricultural production.Judicious and efficient use of these resources underpins sustained and enhanced agriculturalproductivity and food security. This calls for increased investment in agriculture, and especially inland and water development.
Unfortunately, contrary to the desired course, investment in land and water and agriculture asa whole is decreasing. The reasons behind the apparent contradiction from a perspective of land andwater should be examined in individual countries and ways and means should be sought not only toarrest the decline in investment in land and water, but also to rationally increase the investment inorder to achieve desired sustained productivity growth. All stakeholders – governments, privatesector, financing institutions, NGOs, farmers, civil societies and international organizations – musttake necessary steps to meet the challenges.
This paper (i) gives a brief account of the present situation and prospects of food security,production and poverty, (ii) examines the status of investments in land and water, (iii) analyzes thetrend, future needs and mechanisms of investments in land and water, and finally (iv) provides apolicy framework for investment in land and water towards sustained food security and prosperity.
THE FOOD AND AGRICULTURE SITUATION IN THE ASIA AND PACIFIC REGION
Over the past 50 years, the Asia-Pacific Region has undergone an unprecedented transformation infood and agricultural production, food security and rural development. The Green Revolution process,a science-led synergism among enhanced genetic potential (improved seeds), irrigation and fertilizerstriggered in the mid-1960s, was the engine of this transformation. During the past 30 years, between1969 and 1999, Asian cereal production more than doubled to reach nearly one billion tonnes. Despitethe addition of 1.3 billion people to the region’s population, average per capita food availabilityincreased from about 2 000 kcal/person/day in 1965/1966 to over 2 600 kcal/person/day in1999/2000. Increased agricultural productivity, rapid industrial growth in many countries andexpansion of the non-formal rural economy had almost tripled the per capita GDP. During the last 30years, the poverty level had fallen from about 60 percent to less than 30 percent.________________________________________________________________________________
Dr. R.B. Singh, Assistant Director-General and Regional Representative…for Asia and The Pacific, Food and Agriculture Organization…Regional Office for Asia and the Pacific, Bangkok, Thailand…
________________________________________________________________________________

The fight against hunger and poverty in the developing Asia…16
Yet, over 500 million Asians are chronically undernourished, accounting for about two-thirdsof the world’s hungry people (Figure 1). Child malnutrition exacts its highest debilitating toll in Asiaand the Pacific region, especially South Asia. Likewise, nearly 800 million persons, two-thirds of theworld’s poor, have their homes here. It is disquieting that in the recent years the number of hungryand poor people has not been decreasing but remains stubbornly high. Production growths are low andstagnating; moreover, increased agricultural production in the region has often been associated withenvironmental degradation such as erosion of topsoil, salinization, depletion of soil fertility, loweringof he water table and a fast decline in water availability, waterlogging, pollution of water bodies,eutrophication, build-up of greenhouse gases, ecosystem acidification and loss of biodiversity. Giventhat the per capita availability of land Asia and the Pacific region is one-sixth of that in the rest of theworld, and that nearly three-fifths of the future increase in world population will occur here, futureincreases in food and agricultural production must be realized from ever-shrinking and generallydeteriorating land, water and other production resources. This is indeed an uphill task.
There is a strong link between poverty and food insecurity. As seen in Table 1, from 1987 to1998, as the incidence of poverty fell in Asia, the Middle East and North Africa, levels ofundernourishment declined as well. South Asia, which in 1998 had 522 million people with incomesless than US$1/day, registered 44 percent of the world’s poor as well as the largest number ofundernourished people, some 294 million, or over 39 percent of the world’s hungry. Therefore, thetwin objectives of the World Food Summit (WFS) and the UN Millennium Summit of reducingundernourishment and poverty by half by the year 2015 are highly interconnected and interdependent.
DEMAND AND SUPPLY OUTLOOK TO 2015/2030
Food demand in developing countries is essentially a function of population growth and incomeincrease. As world population registered 4.44 billion people in 1995/1997, developing countriesaccounted for 77 percent of the total (Table 2). In 2030, this proportion will rise to 83 percent, with anestimated world population of 6.7 billion. South and Southeast Asia together will continue to accountfor over 50 percent of the world’s population – 53 and 52 percent towards 2015 and 2030,respectively – although rates of growth will decelerate considerably, especially in East Asia. Giventhe high base level population and not-so-low growth rates, the share of South Asia in the world’spopulation will increase from the current level of 22 percent to 24 percent in 2030, annually adding 19million persons towards 2015 and 16 million towards 2030. The corresponding increments for EastAsia are 16 and 9 million respectively. In the next 30 years, nearly one billion additional people willbe added to the populations of South, Southeast and East Asia, and half of this addition will take placein India and China.

Investment in land and water 17
TABLE 1A comparison of poverty and undernourishment data
1998 1996-1998 1996-1998 1998
RegionPeople in
householdsconsuming lessthan $1/day (%)
Shareundernourished
(%)
Number ofundernourished
(million)Number of poor
(million)
East Asia 15.32 12 155.0 278.32
Eastern Europe/Central Asia 5.14 6 26.4 23.98
Latin America/Caribbean 15.57 11 54.9 78.16
Middle East/North Africa 1.95 10 35.9 5.55
South Asia 39.99 23 294.2 522.00
Sub-Saharan Africa 46.3 34 185.9 290.87Source: FAO, CFS, 2001/2002
Projected per capita income growth (GDP) in Asian subregions between 1995/1997 and 2015and between 2015 and 2030 range from 3.6 to 5.7 percent and are generally higher than thecorresponding growth for developing countries as a whole (Table 3). This growth will greatly help inreducing the poverty level in the region and maintain a fairly high demand for food and agriculturalproducts, leading to reduced undernourishment.
TABLE 2Population data and projections
1995/1997 2015 2030 Growth rate %Million % world Million % world million % world 1995/
1997-2015
2015-2030
World 5 745 100 7 154 100 8 112 100 1.2 0.8
Developingcountries
4 436 77 5 778 81 6 718 83 1.4 1.0
South Asia 1 251 22 1 651 23 1 915 24 1.5 1.0
SoutheastAsia
1 800 31 2 133 30 2 307 28 0.9 0.5
Source: Agriculture: Towards 2015/2030, FAO
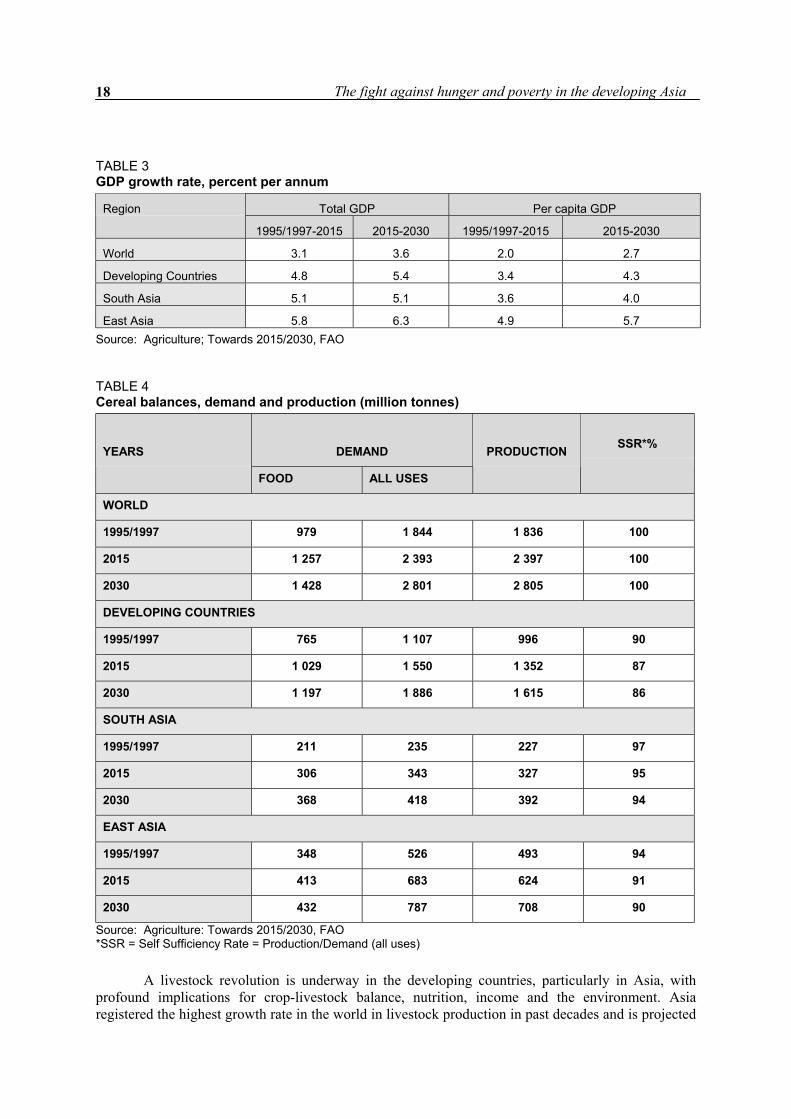
Table 4 gives balances of cereals production and demand over 1995/1997-2015/2030 asanalyzed by FAO (2000). By the year 2030, the world cereal production would need to be increasedto 2.8 billion tonnes, an addition of nearly one billion tonnes. In South, Southeast and East Asia,cereal production is expected to increase by 380 million tonnes, from 720 million tonnes in 1995/1997to 1 100 million tonnes in 2030. Comparing the subregions, South Asia is expected to register anincrease of 73 percent, whereas East Asia (including South East Asia) is expected to register anincrease of 44 percent. Cereals demand is expected to outstrip production both in South and East Asia,the self-sufficiency rate in South Asia falling from 97 to 94 percent and in East Asia from 94 to 90percent over 1995/1997-2030.
The fight against hunger and poverty in the developing Asia…18
TABLE 3GDP growth rate, percent per annum
Total GDP Per capita GDPRegion
1995/1997-2015 2015-2030 1995/1997-2015 2015-2030
World 3.1 3.6 2.0 2.7
Developing Countries 4.8 5.4 3.4 4.3
South Asia 5.1 5.1 3.6 4.0
East Asia 5.8 6.3 4.9 5.7Source: Agriculture; Towards 2015/2030, FAO
TABLE 4Cereal balances, demand and production (million tonnes)
DEMANDYEARS
FOOD ALL USES
PRODUCTION SSR*%
WORLD
1995/1997 979 1 844 1 836 100
2015 1 257 2 393 2 397 100
2030 1 428 2 801 2 805 100
DEVELOPING COUNTRIES
1995/1997 765 1 107 996 90
2015 1 029 1 550 1 352 87
2030 1 197 1 886 1 615 86
SOUTH ASIA
1995/1997 211 235 227 97
2015 306 343 327 95
2030 368 418 392 94
EAST ASIA
1995/1997 348 526 493 94
2015 413 683 624 91
2030 432 787 708 90
Source: Agriculture: Towards 2015/2030, FAO*SSR = Self Sufficiency Rate = Production/Demand (all uses)
A livestock revolution is underway in the developing countries, particularly in Asia, withprofound implications for crop-livestock balance, nutrition, income and the environment. Asiaregistered the highest growth rate in the world in livestock production in past decades and is projected

Investment in land and water 19
to maintain this trend towards the year 2030 (Table 5). South Asia, in particular, will register muchhigher growth rates – 3.2 percent against 1.7 percent for the world as a whole. East Asia will alsomaintain high growth rates, particularly from 1997 to 2015. East Asia (40.4 percent) and South Asia(10.4 percent) together will account for more than half (about 51 percent) of increased global meatproduction. Further, there will be an expansion of the industrial production of livestock. These trendswill put added pressure on water for consumption and environmental health.
TABLE 5Annual growth rate (%) of total livestock production
Region 1987-1997 1995/1997-2015 2015-2030
World 1.8 1.7 1.4
South Asia 4.3 3.2 3.2
East Asia 8.9 2.6 1.6
Source: Agriculture: Towards 2015/2030, FAO
FIGURE 2Incidence of undernourished (million persons)
Source: FAO, SOFI, 2000
Varied demand and supply projections of cereals, livestock and other food products indicate asignificant increase in per capita food consumption, particularly in developing countries, to 2 860 and3 020 kcal in 2015 and 2030 respectively. In South Asia the corresponding figures are 2 790 and3 040 kcal and in East Asia the projections are still higher, 3 020 and 3 170 kcal. These increases willlead to a further significant drop in the share of persons undernourished to 10 percent in 2015 and 6percent in 2030 for the developing countries, to 10 percent and 4 percent for South Asia and to 7percent and 4 percent for East Asia (Table 6). However, due to continued demographic growth (inabsolute numbers), the decrease in the number of undernourished persons will only be to 576 millionin 2015 and 401 million in 2030 from 790 in 1995/97 for Asia to 309 in 2015 and 168 million in 2030from 524 in 1995/97. As of late 2001, the World Food Summit (WFS) goal of halving the number ofundernourished persons no later that 2015, would only be reached towards 2030 (Figure 2).
TABLE 6

The fight against hunger and poverty in the developing Asia…20
Incidence of undernourishment in developing countries
Million Persons Percent of PopulationRegion
1995/1997 2015 2030 1995/1997 2015 2030
Developing Countries 790 576 401 18 10 6
South Asia 284 165 82 23 10 4
East Asia 240 144 86 13 7 4Source: Agriculture: Towards 2015/2030, FAO
SOURCES OF CROP PRODUCTION GROWTH
From 1967 to 1997, the developing countries registered a satisfactory crop production growth rate of3.1 percent (Table 7). East Asia, with a growth rate of 3.6 percent, played the leading role inincreasing the global average. South Asia, with a growth rate of 2.8 percent, also performed well.During the succeeding 34-year period, the growth rate is expected to slow to 1.2 percent in East Asiabut maintain a moderate level of 1.9 percent in South Asia. Yield gains during the Green Revolutionera were generally attributed to almost equal contributions of genetically improved seeds, irrigationand fertilizer with highly significant interactions.
TABLE 7Annual crop production growth rate (percent per annum)
Region 1967-1997 1995/1997-2030
South Asia 2.8 1.9
East Asia 3.6 1.2
All Developing Countries 3.1 1.6
Industrial Countries 1.4 0.8
World 2.2 1.3
Source: AgricultureTowards 2015/2030, FAO
There are three sources of growth in crop production: (i) arable land expansion, (ii) increasedcropping intensity and (iii) yield growth. Yield growth accounts for 83 percent of production growthin Asia, whereas expansion of the net area under cultivation contributes only 5 percent. The remaining12 percent will be through increased cropping intensity (Table 8). In other words, 95 percent of thecrop production growth in Asia will accrue through crop intensification and only 5 percent throughnet area expansion, while in other regions net area expansion will contribute from 20 to 30 percent.
Increased production of wheat and rice in developing countries will need to come from gainsin yield (about four-fifths), whereas maize will rely equally on expanded area planted, even more thanin the past. In Asia, wheat and rice will have negligible or zero net area growth (or even negativegrowth in some major producing countries). Thus yield growth will be the exclusive source ofincreased production.
TABLE 8Sources of growth in crop production (percent)

Investment in land and water 21
Arable land expansion Increase in croppingintensity
Yield increasesRegion
1961-1997 1995/1997-2030
1961-1997 1995/1997- 2030
1961-1997 1995/1997- 2030
South Asia 7 5 14 12 79 83
East Asia 26 5 -6 12 80 83
All developing countries 24 20 5 11 71 69Source: Agriculture Towards 2015/2030, FAO
AGRICULTURAL LAND
The developing countries will expand their total arable land area by 120 million ha between1995/1997 and 2030 (Table 9). This includes an increase of only 15 million ha in Asia (9 million ha inSouth Asia and 6 million ha in East Asia, with annual growth rates of 0.13 and 0.07 percentrespectively). India and China together account for about 28 percent of the developing countries’arable land. India’s share of arable land in South Asia was overwhelming, some 82 percent. In SouthAsia, nearly 90 percent of arable land is already under use, whereas in East Asia, more than 40percent of the available potential is unused. In South Asia excluding India, about 15 million ha of landunsuited for agriculture has been brought under plough, raising sustainability concerns. By 2030,while in the developing countries about 1.7 billion ha additional potentially arable land will beavailable, in Asia only 132 million ha will be potentially available for area expansion (4 million ha inSouth Asia and 128 million ha in East Asia), again emphasizing the importance of yield growth inAsia.
In Asia, future expansion in cropped area will accrue essentially as expansion of grosscropped areas through increased cropping intensity. The overall cropping intensity for developingcountries will rise by 8 percent from 1995/97 to 2030, from 91 to 98 percent (Table 10). Of necessity,and also as one-third of the cultivable land is irrigated, in South and East Asia (particularly China)cropping intensity was the highest, 126 percent in South Asia and 158 percent in East Asia underirrigated conditions. In rainfed also it was over 100 percent. Towards 2030, there will be furtherintensification of 11 percent both in South and East Asia. In certain agro-ecological settings, coveringvast irrigated areas in South and Southeast Asia, cropping intensity is 200 percent or more. It may beemphasized that increased cropping intensities are associated with increased risk of land andenvironmental degradation when it is not accompanied by appropriate technologies and policies.Investment decisions and management must therefore also internalize environmental costs and otherexternalities.
IRRIGATION AND WATER USE
As seen from Table 11, the irrigated area in the developing countries will increase by 54 million ha(or 23 percent) between 1995/97 and 2030. This means that 22 percent of potentially irrigable landwill be brought under irrigation, and 60 percent of all land with irrigation potential (402 million ha)will be in use by 2030. About 75 percent of the developing countries’ irrigated area in 1995/97 was inAsia. This share is projected to be retained through 2030. In other words, nearly 75 percent ofprojected increase in irrigated area in the developing countries would materialize in Asia. Further,China and India together will continue to possess about 54 percent of the developing countries’ totalirrigated area, with India accounting for 28 to 29 percent. South Asian irrigation figures are heavilyimpacted by India as it accounts for 71 and 74 percent of the subregion’s total irrigated area in

The fight against hunger and poverty in the developing Asia…22
1995/1997 and 2030, respectively. Of the projected increase of 17 million ha under irrigation in SouthAsia, 15 million ha will be in India.
TABLE 9Total arable land: data and projections
Region
Arable land in use (million ha)
Annual growth (%) Land in use aspercent of potential
Balance(million ha)
1995/1997
2015 2030 1961-1997 1995/1997- 2030
1995/1997
2030 1995/1997
2030
South Asia 207 212 216 0.18 0.13 84 88 13 4
ExcludingIndia
37 38 39 0.37 0.15 90 95 -14 -16
East Asia 232 236 238 0.91 0.07 57 58 134 128
ExcludingChina
98 108 113 0.89 0.41 47 53 89 74
DevelopingCountries
960 1033 1079 0.68 0.34 32 36 1822 1703
ExcludingChina/India
656 731 777 0.81 0.50 25 30 1751 1630
Source: Agriculture Towards 2015/2030, FAO
TABLE 10Cropping intensity (percent)
Rainfed use Irrigated use Total land in use
Region 1995/97 2030 1995/97 2030 1995/97 2030
South Asia 102 109 126 137 111 122
East Asia 118 120 158 169 130 137
Developing countries 82 85 129 140 91 98
Excluding China/India 68 75 105 118 73 81Source: Agriculture Towards 2015/2030, FAO
The expansion of irrigation during the Green Revolution era in the developing countriesregistered a growth of 94 million ha (1.9 percent per annum), but as the demand rate deceleratesduring the next 34 years the growth rate is projected to drop to 0.6 percent, due to both the increasingcost of bringing additional area under irrigation and retreating water resources. However, because ofincreased cropping intensity in areas under irrigation, irrigated areas in the next 34 years will increaseby 86 million ha. Most of this gain will occur in Asia, where total irrigated area will reach about 40percent, against 14 percent in the developing countries excluding China and India (Table 12). InSouth Asia (excluding India), where there is very high pressure for crop intensification, irrigationintensity is already extremely high (62 to 64 percent), particularly due to Pakistan where irrigationintensity can reach 80 percent. Therefore, the performance of irrigated agriculture in India, China andPakistan will greatly impact the developing world’s irrigated agriculture production.
TABLE 11

Investment in land and water 23
Irrigated (arable land): data and projections
Irrigated land in use(million ha)
Annual growth(%)
Irrigated land aspercent ofpotential
Balance (millionha)Region
1995/1997
2015 2030 1961-1997
1995/1997 -2030
1995/1997
2030 1995/1997
2030
South Asia 78 85 95 2.2 0.6 55 67 64 47
Excluding India 23 24 25 1.9 0.2 82 89 5 3
East Asia 69 78 85 1.5 0.6 62 76 43 27
Excluding China 18 22 25 2.0 0.8 40 52 29 23
Developing Countries 197 220 242 1.9 0.6 49 60 206 160
Excluding China, India
91 103 112 2.0 0.6 40 50 134 113
Source: Agriculture Towards 2015/2030, FAO
TABLE 12Irrigated land as percent of total arable land
Region 1995/97 2015 2030
South Asia 38 40 44
Excluding India 62 63 64
East Asia 30 33 36
Excluding China 18 20 20
Developing Countries 21 21 23
Excluding China/India 14 14 14Source: Adapted from Agriculture Towards 2015/2030, FAO
Agriculture accounts for about 70 percent of the freshwater use in the world. Increasingwithdrawal of freshwater for agriculture is one of the main causes of water scarcity which severalcountries are facing today and many more will face in the future, and more acutely. Therefore,irrigation water must be used most efficiently. As seen in Table 13, irrigation efficiency in thedeveloping countries averaged about 43 percent in 1995/97, varying from 26 percent in Latin America(having abundant water resources) to 50 percent in the Near East/North Africa region and 49 percentin South Asia (water-scarce regions). Improved irrigation technologies, modernization andrehabilitation of irrigation and appropriate water resources policies, means that each region shouldimprove its irrigation efficiency, with maximum improvement taking place in the Near East and NorthAfrican region (15 percent), followed by South Asia (9 percent). In East Asia, less China, efficiency israther low and must be improved considerably. This may be partially attributable to the predominanceof rice cultivation in Southeast Asia where paddy fields are flooded to facilitate land preparation andweed management.

The fight against hunger and poverty in the developing Asia…24
TABLE 13Irrigation efficiency (percent) in developing countries
Year Sub-Saharan
Africa
LatinAmerica
Near East-North Africa South Asia East Asia All
developingcountries
1995/97 42 26 50 49 38 43
2030 44 29 65 58 42 50
Source: Agriculture Towards 2015/2030, FAO
The role of irrigation in enhancing yield and total production (including increased croppingintensity) is also evident. In 1995/97 the developing countries averaged 1.71 tonnes/ha yield forrainfed cereals, projected to grow to 2.23 tonnes/ha in 2030, as compared to 3.82 and 5.16 tonnes/hafor irrigated conditions (Table 14).
TABLE 14Cereal yields in developing countries, rainfed and irrigated
Share in area Share inproduction
Average (weighted) yield Annual yield growth
(percent) (percent) (tonnes/ha) (percent per annum)Waterregime
1995/1997
2030 1995/1997
2030 1961/1963
1995/1997
2030 1961-1997
1987-1997
1995/1997-2030
Rainfed 62 57 42 37 - 1.71 2.23 - - 0.8
Irrigated 38 43 58 63 - 3.82 5.16 - - 0.9
Total - - - - 1.17 2.52 3.49 2.5 1.9 1.0
Source: Agriculture Towards 2015/2030, FAO
WHY THE EMPHASIS ON INVESTMENT IN LAND AND WATER
Land and water are not only the basis of agriculture but of life itself. Protecting, developing andmaintaining the health and viability of these basic resources is fundamental to the survival andprogress of humanity. Investment in land and water must be viewed as investment in sustained foodsecurity, income, prosperity, environment and health. ‘Crop per drop’ as advocated the InternationalWater Management Institute, emphasizes the importance of conservation and judicious use of scarceresources.
The World Bank (2001) estimates that by 2025 as many as 48 countries and some 1 400million people – mostly in least developed countries – will experience water stress or scarcity. Besideslowered water availability (quantity), deteriorating water quality and environmental conditions,irrigation-related land degradation and insufficient river flow will aggravate water shortage problems,which could depress agricultural production and limit industrial and household use (IFAD, 2001).
Worldwide, according to Global Land Assessment of Degradation (GLAD) mapping of nearly105 billion ha of cropland, 38 percent is degraded (Table 15). Africa has the most extensive croplanddegradation (65 percent), followed by Latin America (51 percent) and Asia (38 percent). Water

Investment in land and water 25
erosion and wind erosion, in that order, were the main causes of degradation. In monetary terms,global losses due to land degradation in drylands ranges from US$13 billion to US$28 billion per year.
TABLE 15Agricultural land degradation in different regions (million ha)
Region Total Non-degraded Degraded
Latin America 180 88 92
Asia 536 330 206
Africa 187 66 121Source: Oldeman, 1992
The average cumulative loss of cropland productivity at the world level during the post-SecondWorld War period as a result of human-induced soil degradation was 12.7 percent, and at the Asialevel it was 12.8 percent (Oldeman, 1998). Land and water resources have degraded almost to thepoint of no return in certain agro-ecological pockets in some countries, primarily due to wrongtechnologies, poor management and greed. These trends must be understood as warnings thatlivelihood systems are the basis of society and civilization itself is threatened.
In Asia and the Pacific region there is limited scope of horizontal expansion of cultivated land andirrigated area; per capita availability of agricultural land and water has been decreasing due topopulation growth and the diversification of agricultural land to non-agricultural uses. Moreover,large proportions of the resources have degraded and numbers of large irrigation structures have agedand degenerated. For instance, in South Asia 73 percent of agricultural land suffers from forms ofdegradation (Table 16). All forms of land degradation in South Asia are estimated to cost US$9.8 to11 billion per year (FAO/UNDP/UNEP 1994), or 7 percent of agricultural GDP. Therefore, increasingemphasis will need to be placed on rehabilitation and improving degraded resources.
The total land area of Asia and the Pacific region is 3 001 million ha or 22.9 percent of world landarea. Possible agricultural production in 86 percent of the region is limited by adverse soil, climaticand topographic factors, including cold (2 percent), dryness and aridity (19.4 percent), steep slopes(26.7 percent) and chemical problems (13.5 percent). Thus, only 14 percent of the region’s total landarea is free from constraints on agricultural production.
Soil degradation – in particular loss of potential soil productivity due to erosion and soil nutrientdecline – is the biggest threat to meet the future agricultural needs in the region. Adequate investmentneeds must be mobilized for enabling community owned watershed development programmes and foroptimal fertilization programmes to offset the continuing negative balance of nutrient status of thesoil. The loss of soil productivity in both the commercial and subsistence sectors has national costsand effects, such as the need for more food imports, lessened exports, the possible necessity of reliefsupplies and the need for added agricultural investment. Less tangible but necessarily added to this arethe social welfare costs associated with assisting those who fall below the poverty line.
Over-extraction of ground water is widespread and is caused by industrial, domestic andagricultural withdrawals. In substantial areas of China and India, groundwater levels are falling by 1to 3 metres per year. Over-extraction in coastal areas causes saltwater to intrude into freshwateraquifers. Investment in groundwater utilization must be based on waterbalance and the recharge dataof the area and the spatial distribution of wells and pumps must also be regulated accordingly.
TABLE 16Shares of agricultural land in South Asia affected by different forms of degradation

The fight against hunger and poverty in the developing Asia…26
Type of land degradation Percent of land affected
Water erosion 25
Wind erosion 18
Soil fertility decline 13
Waterlogging 2
Salinization 9
Lowering of water table 6
Source: FAO/UNDP/UNEP, 1994
Commonly encountered environmental degradations such as waterlogging, salinization,overextraction, the use of fossil aquifers, pollution of surface and ground water and their associatedeconomic and social costs can be minimized through appropriate and timely managementinterventions. Land and water investment decisions also have serious implications for global warmingand climate change. The potential for carbon sequestration in soil may be as high as 40 percent oftotal annual atmospheric increases in CO2 concentration. Water management practices can greatlyimpact methane emission from paddy fields – an important point of consideration for Asia and thePacific as about 90 percent of the world’s paddies fall in this region.
Relative impact of soil degradation will vary under different agricultural settings. In Asia, forexample, it is projected that by 2020 economic effects of soil degradation will be most severe indensely populated marginal lands followed by irrigated lands (Table 17). National policy priorities formanaging degraded lands will thus vary widely and must be determined by each country’s resourceendowment, the structure of agricultural supply, distribution of poverty, and the principal agriculturalsources of economic growth (Scherr, 1999).
Fresh water is distributed very unevenly across the globe, with the lowest availability in Asiaand the highest in South America (Table 18). It is projected that by 2025, 46 to 52 countries with anaggregate population of 3 billion will be water stressed (Engelman and Le Roy, 1993). Fuelled bypopulation and industrial growth, between 1950 and 1990 water use increased by 100 to 500 percentin different regions. Agriculture is the biggest user of water, accounting for more than 90 percent ofwater withdrawals in low-income developing countries (Table 19). The decreasing per capitaavailability of water is exacerbated by the increasing cost of developing new water, wasteful use ofalready developed water supplies, degradation of soil in irrigated areas, depletion of groundwater,water pollution, and distorted water policies and pricing.
INVESTMENT REQUIREMENTS
Investment requirements can be grouped into two interdependent categories: the monetaryrequirement and the human resources and attitudinal requirement. Land intensification needs maygenerally encompass investments for such needs as: i) soil fertility maintenance by adequate levels ofbalanced fertilization and management of structural, textural and organic health; ii) land shaping foradoption of minimum tillage and other land operation practices; iii) soil conservation and afforestationmeasures; iv) reclaiming acid, saline and alkali soils, ravine areas; stabilizing sand dunes, waterloggedand other degraded land; and v) enriching the biological health of soils.

Investment in land and water 27
TABLE 17Relative impact of soil degradation in different agricultural pathways
Anticipated impact of soil degradation on
In order of globalpolicy priority
Consumptionby poorfarmers
Agriculturalmarketsupply
Economicdevelopment
Nationalwealth
Severity ofproblem
Dependenceon direct
policy actionto resolve
Densely populatedmarginal lands
Irrigated lands
High-quality rainfedlands
Urban and peri-urbanagricultural lands
Extensively managedmarginal lands
Notes: Resolution of soil degradation problems (last column) requires a strong agricultural economy with farmerincentives and capacity for good land husbandry. Sensible agricultural/rural policies and infrastructureinvestments are needed. The last column refers to policies and public investments needed to control soildegradation. indicate high, medium, and low.Source: Scherr, 1999
TABLE 18Per capita water availability by region, 1950-2000 (km3 per year)
Region 1950 1960 1970 1980 2000
Africa 20.0 16.5 12.7 9.4 5.1
Asia (excluding Oceania) 9.6 7.9 6.1 5.1 3.3
Europe (excluding Soviet Union/Russia) 5.9 5.4 4.9 4.6 4.1
North America and Central America 37.2 30.0 25.2 21.3 17.5
South America 105.0 80.2 61.7 48.8 28.3
Source: Ayibotele, 1992
Likewise, investment in water resources, supply and use is required for: i) design andconstruction of large, medium, small and micro irrigation schemes; ii) rehabilitation, upgrading andmodernizing existing irrigation schemes and systems; iii) developing new and tapping unutilizedwater resources; iv) developing river basin-based integrated development and water management; v)preventing water pollution and deterioration of water quality; and vi) integrated watersheddevelopment encompassing upgradation of arable land, non-arable land and underground water,particularly in rainfed areas in arid and semi-arid zones.
Long-term investment in land and water must be based on well-conceived national land useand water policies, taking into account intersectoral demands, growth prospects and other nationalpriorities. FAO agro-ecological zoning methodology provides a broad framework for developing anappropriate national land use policy. Land and water development programmes for different zonesshould be reflect this methodology and make a strong case for including land and water resources as

The fight against hunger and poverty in the developing Asia…28
priority areas for ODA allocations within the framework of food security and poverty reductionstrategies. Irrigation and water requirements must be systematically and scientifically assessed in thecontext of the availability of cultivable land, food and agricultural production goals and demand-supply balance. Governments must be aware and capable of using ‘global’ and ‘local’ models toassess and plan for needs and prospects.
TABLE 19Sectoral water withdrawals by country income group
Withdrawals by sector (%)Country income
group
Annual per capitawithdrawal (cm3)
Agriculture Industry Domestic use
Low-income countries 386 91 5 4
Middle-incomecountries
453 69 18 13
High-incomecountries
1 167 39 47 14
Source: World Bank, 1992
Investment in research, technology development and extension in land and water managementis necessary to increase water use and development efficiencies. This is important because existingefficiencies are generally low, varying from country to country (hence the scope for learning fromeach others' experiences), and secondly, future increases in production must essentially accruethrough increases in yield and productivity for every drop of water and every inch of cultivated land.As mentioned earlier, nearly three-fourths (74 percent) of the irrigated land of the developing world isin Asia, 14 percent in the Near East and North Africa, 9 percent in Latin America and 3 percent inSub-Saharan Africa. Further, irrigated agriculture is projected to account for a 38 percent of increasein arable land and more than 70 percent of the increase in cereal production between 1997 and 2030.Against these projections, it is worrisome to experience stagnating yields, low yields and decliningrates of yield growths, let alone the widespread degradation of the land and water resources.
Viewed against this background, the investment scenario for water resource development isdisquieting. From 1950 to 1993, only 7 percent of World Bank lending was allocated to agricultureand rural development – discouragingly low in both in terms of percentages and absolute amounts.This does not augur well for the anticipated increase in irrigated land between 1997 and 2030,although it has been shown that in 192 water resource development projects, the internal rate of returnon investment was an average 16 percent (Jones, 1995).
The social context of irrigated agriculture is highly relevant. The high population absorptivecapacity of irrigation limits the migration of growing populations to areas of greater environmentalrisk. If additional water for irrigation or additional irrigated areas are not forthcoming, the increasedburden on rainfed agriculture to meet demand will be enormous and detrimental to environment, withfar more deforestation and land clearance.
Research and development efforts in land and water sectors, backed up by adequateinvestment, should cover: I) mapping and utility classification of land and water resources; ii)improving the efficiency of land and water use in agriculture; iii) policy, institutional, economic andsocial aspects of land and water management; iv) management of watersheds for multiple functions;v) management of aquatic ecosystems, in particular those having boundaries with terrestrial

Investment in land and water 29
ecosystem; vi) wastewater recycling, and the conjunctive use of water, improvement of water qualityand reduction of water pollution; vii) restoration of fertility and structure of degraded lands andprevention of further degradation, bioremediation; and viii) integrated soil-water-plant-nutrientmanagement and fertility improvement.
Water accounting methods developed by the International Water Management Institute(IWMI) can help planners improve water productivity by analyzing where it is going, who is using it,how productive it is per cubic metre and whether it is available for reuse. Likewise, soil fertility andhealth indicators are increasingly available and should be used for assessing resources and investmentpriorities.
TREND OF INVESTMENT
Investments in agriculture, including land and water and research and technology developments havebeen declining. This is paradoxical to the projected demands for food and agricultural products andsupply constraints. It is a matter of great concern that most developing countries in recent years assignonly 6-8 percent of their spending to the agriculture sector, although 60 percent of their populationsdepend on agriculture – and poverty continues to be essentially a rural phenomenon.
More than 90 percent of investment in agriculture in most developing Asian countries comesfrom domestic resources, although in some low-income food deficit countries the proportion ofdependence on foreign assistance may be as high as 25-30 percent. In irrigation, about 90 percent ofthe estimated investment of US$60-80 billion annually in developing countries is based on domesticsources (DFID, 2000, World Bank, 2001). Current levels of investment in water are only 50 percentof the minimum needed. World Bank lending to irrigation was 7 percent of its total lending in 1950-1993, more than any other sector (Jones, 1995), but had dropped to 4 percent during 1990-1997(DFID, 2000). Shrunken and shrinking investment in the water sector is bound to be a majorbottleneck in meeting the projected food and agricultural production in developing countries.
The official flow of funds to agriculture has declined to 63 percent of that at the beginning ofthe decade. At 0.24 percent of annual GDP, current levels of foreign aid fall short of the 0.7 percenttarget set by developed countries. Actual aid falls short of that target by US$100 billion a year. In thelate 1990s, aid and lending to agriculture was one-third the level of the late-1980s which itself wasdown from the late-1970s level. The share of agricultural lending in the loan portfolio of the WorldBank fell below 10 percent in 2000 compared to an average of 14 percent for the decade ending 2000.Thirty years ago the figure was 40 percent (FAO, 2001).
It is well known that countries with high levels of undernourishment also have severebudgetary constraints. Countries with one-quarter of their population as undernourished spend at least30 times less per agricultural worker as compared with countries having less than 5 percent ofpopulation as undernourished (FAO, 2001). Hence the case for a larger flow of concessionaldevelopment assistance to Low Income Food Deficit Countries (LIFDCs) to effectively face thechallenge of food insecurity and undernutrition cannot be overemphasized.
Besides serious gaps in the financial flow to agriculture, particularly to land and water, thereare serious gaps in management and priorities. Moreover, there are serious conflicts between quickgains and long-term sustainability. Several successful experiences of land and water management withtremendous impacts on production, productivity, food security, poverty alleviation, income, trade, andsustainability exist in Asia and elsewhere which must be critically documented and shared with othercountries. Cases of failure should be critically analyzed and the causes should be studied by all toavoid further failures.

The fight against hunger and poverty in the developing Asia…30
Local wisdom and indigenous knowledge and technologies have many times been effective inland and water management, but in the rush for quick fixes and due to a lack of vision andperspective, such sources of indigenous understanding are dying. Managers of investment in land andwater must recognize traditional knowledge and experience, and blend them with moderntechnologies referred to as ecotechnology. The need for investing in the people themselves, in shapingtheir attitudes and participation, can hardly be overemphasized. The people are true guardians, serviceproviders as well as beneficiaries, and hence development must be rooted in a spirit of participation –“of the people, by the people and for the people”.
Uncertainty of land tenure is a significant deterrent to long-term and sustainable investmenton land. Ambiguities relating to rights of land, water and trees tend to contribute to environmentaldegradation and curb investment desires. Other institutional aspects include the absence of clearcommunity mechanisms for upkeep of public assets and infrastructure, lack of financial services andthe marginalization of women. The absence of micro-credit institutions discourage investment in soiland water conservation measures, particularly if payback periods are relatively long.
FINANCING MECHANISMS
The decrease in the proportion of public investment and donor loans and grants invested in theagricultural sector has come about because of a greater priority given by governments to investmentsto develop other sectors (such as infrastructure, energy, transport, education and health). Within theagricultural sector in Asia, however, there is a shift by governments to invest proportionately more innatural resources management (soil, plant and water resources), forestry, fisheries and integrated ruraldevelopment. Priority is also being given to rehabilitation of existing irrigation schemes rather thanthe development of new large schemes and donors are very reluctant to invest in dams.
Governments and international donors have generally avoided investments in reforming therural financial system and developing credit facilities to small farmers with little or no collateral.Private investment in land had been mostly limited to large estate and orchard crops. Governmentservices to farmers are being reshaped by decentralization of government services, with somereduction in quality of services. Governments are also involved in privatizing many services. Thesetrends, along with the WTO settings, are creating changed circumstances in which small farmers haveto produce agricultural products and generate family incomes. The impact of these changes on farmersand rural communities and future priorities for investment in the rural and agricultural sector shouldbe analyzed. Besides identifying the priority areas for investment, it would be essential to analyze thevarious financing mechanisms and their linkages. These linkages must be managed in consistencewith the appropriate rights and laws related to the resources and their transparent governance.
A flexible, responsive and multi-directional financing mechanism is needed. Country-ownedpoverty reduction strategies (CPRS) can be articulated to provide the basis for donor concessionalassistance (particularly World Bank and IMF lending) and the use of resources freed by debt reliefenhanced under the highly indebted poor countries (HIPC) initiative. The World Bank’sComprehensive Development Framework (CDF) or its equivalent, the UN Development AssistanceFramework (UNDAF) at the country level, may form a basis for coordination of programmes andaction plans based on each country's Poverty Reduction Strategy Paper (PRSP). Of the 23 LIFDCswith the highest prevalence of undernourishment, 17 are in the HIPC group of eligible countries.Overall, 41 countries with US$170 billion in external debt are eligible for consideration under theHIPC initiative. The enhanced initiative seeks to establish stronger link between debt relief andsustainable poverty reduction programmes in recipient countries.

Investment in land and water 31
A flexible lending framework is suggested as a mechanism for implementing CPRS. In thismechanism, World Bank may take the lead in providing broad-based poverty reduction support credit(PRSC) linked to key objectives, reform areas and priority action areas such as land and waterdevelopment. Governments will receive the credit on IDA terms geared to performance. The fundingis integrated with the government budgetary cycle and augments the capacity to allocate resources ona cross-sectoral basis. In this process and facilitation, FAO has a role in assisting governments inarticulating agriculture sector strategy and in the formulation of programmes within CPRSframework. This also provides scope for interested bilateral donors to enter into partnership withFAO to support such programmes.
Private sector participation in investment and management must be encouraged. Marketdistortions, imperfect access to information and uncertainty about cost-benefit relationships posediscouragement to private sector participation. However, this area requires capacity building inentrepreneurial skills and facilities for financial services and working capital support. Decentralizedfinancing mechanisms are needed to facilitate such provisions as extension, micro-credit andinformation sharing.
INVESTMENT POLICIES AND STRATEGIES IN LAND AND WATER DEVELOPMENT
Agriculture will continue to be the engine of broad-based economic growth and development in mostAsian countries. The unprecedented success in increasing production, productivity, income growth,food security and poverty alleviation through the Green Revolution process underpins the synergisticinterplay of soil fertility, irrigation, improved seeds, management practices, labour, capital,technology and political will. In recent years, however, it is seen that the pace of growth of yield andproductivity has decelerated, and is even stagnating under major production, regimes such as the rice-wheat system, let alone rainfed areas. Keeping in mind the projected demands of food and agriculture,the state of land and water and the overall environmental health, it will be essential to effect severalparadigm shifts to transform the Green Revolution into Evergreen Revolution to achieve sustainedagricultural growth.
Given that there is negligible scope for horizontal expansion of agricultural land in Asia andthe Pacific region, the only option left is the intensification and diversification of the productionsystem for sustainably enhancing yield and productivity. Considering the assets and liabilities of theGreen Revolution process, the approach towards Evergreen Revolution must be structured on asystem-based, interdisciplinary and participatory approach. It must promote efficiency andinclusiveness and seek congruence of productivity, sustainability, profitability and equity. Based onthis premise, the following policy framework is suggested for investment (financial and management)in land and water.
Integrated approach to land and water management and investment strategy
Although they are two distinct and most fundamental natural resources – not only for agriculture butfor the very life and existence of humankind – land and water are intimately interrelated resources.The extent, quality and productivity of the two resources are highly interdependent. Therefore, whilethere must be land-specific and water-specific conservation, development and utilization policies,strategies and programmes, there is a need to have clear policy and approach for synergisticdevelopment and effective integration of land and water to enhance overall productivity,sustainability, profitability and reduction of environmental costs.
Agricultural area expansion in the land-hungry Asia-Pacific region is largely dependent ongross cropped area expansion (increased cropping intensity), which is closely linked with irrigation
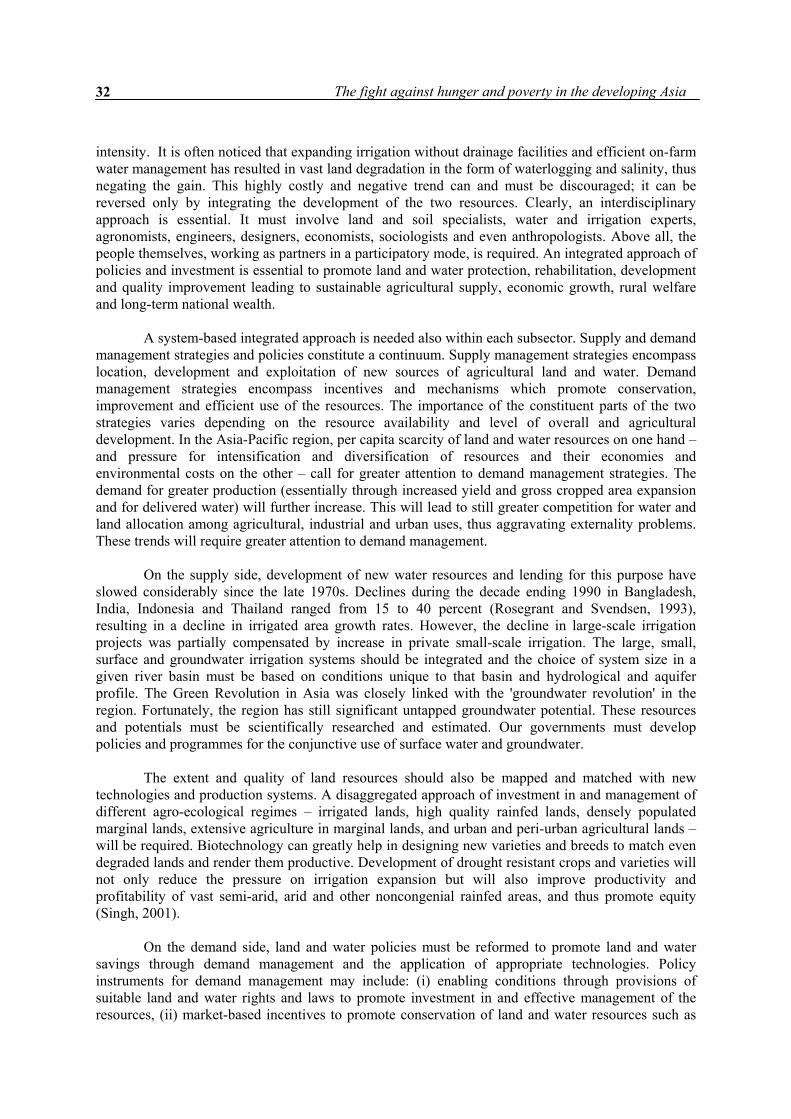
The fight against hunger and poverty in the developing Asia…32
intensity. It is often noticed that expanding irrigation without drainage facilities and efficient on-farmwater management has resulted in vast land degradation in the form of waterlogging and salinity, thusnegating the gain. This highly costly and negative trend can and must be discouraged; it can bereversed only by integrating the development of the two resources. Clearly, an interdisciplinaryapproach is essential. It must involve land and soil specialists, water and irrigation experts,agronomists, engineers, designers, economists, sociologists and even anthropologists. Above all, thepeople themselves, working as partners in a participatory mode, is required. An integrated approach ofpolicies and investment is essential to promote land and water protection, rehabilitation, developmentand quality improvement leading to sustainable agricultural supply, economic growth, rural welfareand long-term national wealth.
A system-based integrated approach is needed also within each subsector. Supply and demandmanagement strategies and policies constitute a continuum. Supply management strategies encompasslocation, development and exploitation of new sources of agricultural land and water. Demandmanagement strategies encompass incentives and mechanisms which promote conservation,improvement and efficient use of the resources. The importance of the constituent parts of the twostrategies varies depending on the resource availability and level of overall and agriculturaldevelopment. In the Asia-Pacific region, per capita scarcity of land and water resources on one hand –and pressure for intensification and diversification of resources and their economies andenvironmental costs on the other – call for greater attention to demand management strategies. Thedemand for greater production (essentially through increased yield and gross cropped area expansionand for delivered water) will further increase. This will lead to still greater competition for water andland allocation among agricultural, industrial and urban uses, thus aggravating externality problems.These trends will require greater attention to demand management.
On the supply side, development of new water resources and lending for this purpose haveslowed considerably since the late 1970s. Declines during the decade ending 1990 in Bangladesh,India, Indonesia and Thailand ranged from 15 to 40 percent (Rosegrant and Svendsen, 1993),resulting in a decline in irrigated area growth rates. However, the decline in large-scale irrigationprojects was partially compensated by increase in private small-scale irrigation. The large, small,surface and groundwater irrigation systems should be integrated and the choice of system size in agiven river basin must be based on conditions unique to that basin and hydrological and aquiferprofile. The Green Revolution in Asia was closely linked with the 'groundwater revolution' in theregion. Fortunately, the region has still significant untapped groundwater potential. These resourcesand potentials must be scientifically researched and estimated. Our governments must developpolicies and programmes for the conjunctive use of surface water and groundwater.
The extent and quality of land resources should also be mapped and matched with newtechnologies and production systems. A disaggregated approach of investment in and management ofdifferent agro-ecological regimes – irrigated lands, high quality rainfed lands, densely populatedmarginal lands, extensive agriculture in marginal lands, and urban and peri-urban agricultural lands –will be required. Biotechnology can greatly help in designing new varieties and breeds to match evendegraded lands and render them productive. Development of drought resistant crops and varieties willnot only reduce the pressure on irrigation expansion but will also improve productivity andprofitability of vast semi-arid, arid and other noncongenial rainfed areas, and thus promote equity(Singh, 2001).
On the demand side, land and water policies must be reformed to promote land and watersavings through demand management and the application of appropriate technologies. Policyinstruments for demand management may include: (i) enabling conditions through provisions ofsuitable land and water rights and laws to promote investment in and effective management of theresources, (ii) market-based incentives to promote conservation of land and water resources such as

Investment in land and water 33
organic farming, appropriate pricing, reduced subsidies on urban water consumption and targetedtaxes and subsidies, (iii) non-market instruments, including restrictions, licenses and pollutioncontrols and (iv) direct interventions, including conservation programmes (Bhatia, 1995).
Secure rights to land and water and rights of access to these resources are essential for long-term investment by farmers in land and water conservation and improvement, as well as to enablethem to effectively participate in participatory planning, investment and management. Property rightsfor women farmers should be given due attention as the number of women-headed households isincreasing. Local customs, needs and specifics should be kept in mind while anchoring the rightsregime, which must have efficient conflict-resolving investment-friendly mechanisms.
Policy support to generation, introduction, assessment and adoption of appropriatetechnologies will be instrumental in water savings, increasing water use efficiency, soil conservationand improvement of soil fertility and productivity. Micro-irrigation (drip, sprinkler and computerizedcontrol systems) saves 40 to 50 percent of water and is free from the problems associated with floodirrigation. In developing countries, water use efficiency is generally low (25-40 percent), whereas indeveloped countries it is 50-60 percent. Conservation tillage is proving highly effective in soilconservation and fertility/productivity improvement in Latin America. But this technology has yet tofind its due place in the Asia-Pacific region where special national programmes should be promotedfor conservation tillage. Technology packages to promote integrated soil-water-plant-nutrient systemsshould be developed and widely adopted on priority basis.
FLEXIBLE, PARTICIPATORY PATHS TO NEW TECHNOLOGICAL, MANAGEMENT ANDDEVELOPMENT OPPORTUNITIES
Fast and far-reaching developments in science, technology (biotechnology, information andcommunication technology), management (e-commerce, regulatory mechanisms), globalization andliberalization, market opportunities and financing mechanisms, call for flexible and highly informedapproaches to priority setting, resource mobilization and allocation and linkages. A dynamic approachto accommodate and capture new opportunities – such as those arising from the WTO, newtechnological products and new information and databases – will ensure necessary changes in landand water management and investment. Often, for example, existing irrigation systems and land usepatterns (e.g. rice paddies) are too inflexible to allow crop diversification, thus denying options forother crops and new products to meet new nutritional and economic opportunities. Therefore, whilethe new irrigation, water and land development plans must have built-in flexibility for diversifiedproduction, the old structures will need to be modified accordingly, of course within location-specificeconomic viability, technological feasibility, social acceptability and environmental compatibility.
National capacities must be developed to assess existing land and water resources andpotential and match them with the production, intensification and diversification needs andpossibilities, duly internalizing the emerging and modern technologies. Required human resources,research and technological capacities, institutional and organizational support, and needed financialinvestments must be provided by individual governments to meet the objectives. Based on theassessment of land, water and irrigation requirements, a judicious balance is needed among newirrigation construction, rehabilitation of old and degrading irrigation systems, upgrading andmodernization of irrigation, reclamation of degraded lands, opening of new lands, cropping intensityand choice of farming systems. In South, Southeast and East Asia, high population pressure anddevelopment demand, means that targeted policies and investments to deal with problems ofdegradation, restoration, upgradation and preventing further degradation of land and water resourcesand irrigation systems assume high priority.

The fight against hunger and poverty in the developing Asia…34
Flexibility must also be maintained among choices of schemes. Large dams and large areacoverage projects built by the public sector, and small schemes built and operated by public or privatesectors (or jointly) have their own economic, social and environmental advantages and disadvantages.The World Bank found that large scale projects were more profitable, but project size explained only10 percent of the variation in performance (Jones, 1995). Thus, the large versus small distinction isnot very useful. Although international support, especially from World Bank, to large damconstructions has greatly reduced, countries must assess their needs and carefully weigh theadvantages and disadvantages of alternative options or may wish to strike a dynamic combination ofthe two. Besides size, the control, management and operation, mechanisms can also be flexible. Theinputs of public and private sectors and civil societies for different purposes will vary, but theirrational blend may provide greater efficiency and effectiveness.
Government’s role in creating large schemes and providing public goods, and instituting andimplementing needed agrarian reforms, rights and laws can greatly be complemented by the privatesector and people themselves by managing the resources and providing veritable services. This willrequire significant organizational development and capacity building for farmers’ and water users’organizations, and groups and for local governments. Mechanisms to transparently moderate conflictsbetween different groups of land and water users and speedily resolve problems are essential to ensuredesired economic returns and other benefits. Experiences of successful water users associations(WUAs) in organization and management (O&M) of water resources should be analyzed and widelyreplicated and adapted. Financial autonomy, financial contributions by members of associations andthe benefits received by them are all interrelated and should further be forged consistent with theparticipation, needs and aspirations of small farmers.
INVESTMENT IN LAND AND WATER CONSERVATION AND IMPROVEMENT
Investment in land and water development is essential for food security, poverty alleviation andbalanced development. Investments in irrigation during 1965 to 1985 were instrumental (along withthe investment in seeds of modern varieties and fertilizers) in ushering in the Green Revolution.During the past decade or so, however, investment in agriculture, land and water, has sharplydeclined, causing deceleration in agricultural growth. The reasons behind the reduced investmentsshould be examined so that effective corrective measures may be taken to face the challenges ofaccelerated and sustained agricultural production and productivity – the Evergreen Revolution.
The pattern, nature and management of investment in land and water may need to be changed.Private sector investment must increasingly complement public sector investment. Development ofthe farmers, by the farmers and for the farmers is increasing and needs support by appropriate policiessuch as the creation of farmers' associations, community and participatory action, and water users'associations. To encourage various investors, economic, social, environmental and ecological impactsof successful investments in land and water should be critically analyzed and the resultscommunicated to policy makers, farmers, people at large and other stakeholders at national andinternational levels. Not only the benefits but also the costs of not or under-investing in land andwater should be analyzed and made widely known.
Critical land and water degradation problem areas should be identified by satellite imageryand isotopic signatures. Investment in reclamation and rehabilitation of such areas should receivepriority attention. Investment opportunities include creating biochecks to control soil erosion,developing windbreaks (widely adopted in China), terracing, building up organic soil matter,installing small-scale irrigation systems and pumps, and creating water harvesting devices. Suchinvestments and management activities should be done in close partnership of public and privatesectors, farmers, researchers, extension workers, and non-governmental organizations. Institutionalsupports, such as credit, subsidies ('smart subsidies' granted by using carefully selected criteria),

Investment in land and water 35
extension and community-based organizations will be needed to effectively organize and managesuch investments. Subsidies as co-investment in increasing the productive potential of land and watershould be encouraged.
More investment in land and water research, technology development, information systems
Research and technology development agendas for land and water must be broadened to address notonly agro-physical and agro-biological issues but also socio-economic, environmental and ecologicalissues to ensure the congruence of enhanced productivity (efficiency), sustainability, profitability andequity. Only such an integrated holistic and system-based research and technology developmentapproach will concurrently satisfy the various stakeholders, namely, the farmers, environmentalists(the “Green” lobby) and the public at large. Research and development (R&D) paradigm shifts mustemphasise interdisciplinarity and multidisciplinarity rather than monodisciplinarity. The process isalso the goal and not simply the product, system-based not just commodity-based, and people-and-environment-driven and not technology-driven. Such R&D systems are complex and demanding.Besides increasing R&D investments to meet such complex challenges, institutional supports andhuman resources must be adjusted to establish and manage linkages at national and internationallevels. To ensure informed investment and resource management, suitable indicators must bedeveloped to identify economic, environmental, ecological and social costs and benefits. Policyresearch capacity, including socio-economic research capacity, must be strengthened in many R&Dsystems. Research and development staff must collaborate with policy-makers and planners.
In recent years, national and international agricultural research institutions (particularlyCGIAR) have allocated larger proportions of their budgets to natural resources management (Alexand Steinacker, 1998). But this has often happened at the cost of equally important areas. Thus, thereis a need to explicitly allocate additional funds to land and water resources commensurate with thepriority. Work programmes should clearly identify multidisciplinary and multi-institutional activitiesand allocate resources specifically for the purpose. Concerned institutions must have capacity to valuenatural resources and analyze environmental impacts – costs and benefits to justify as well as tomonitor the efficacy of the investments. Because of multidisciplinarity and multi-componenttechnology packages and the emphasis on bottom-up and participatory approach, the extension andtechnology assessment and diffusion system will need to be overhauled and suitably trained humanresources will be needed. The Asia and Pacific region leads the world in the development andwidespread adoption of IPM technologies, including the Farmers’ Field School (FFS) initiative. Asiashould use this experience by investment and management of land and water resources. The indicatorsand methodologies developed by the International Water Management Institute should be internalizedin national Natural Resource Management Research (NRMR) programmes.
The impact of land and water R&D investments and management is closely linked with thenature and availability of information on the status and prospects of the resources. The need toincrease the awareness of the status of land and water degradation, availability and improvementissues among policy makers, investors and the broader society can hardly be overemphasised. Recentrevolutions in GIS, information and communication technologies must be harnessed for collecting andsharing information not only on the resources but also on available technologies, market conditionsand socio-economic settings. Information networks must link the farmers, community groups such aslandcare groups in Australia, local governments, extension and research organizations, climate andweather forecast centres, market and input output distribution centres and planners, and executors andpolicy makers.
Indigenous technologies and knowledge should form an integral part of databases. Public andprivate sectors should invest not only in necessary hardware and software but also in human resourcetraining and development. Soil and water clinics in rural areas should be linked with rural agricultural

The fight against hunger and poverty in the developing Asia…36
information centres which must constitute an integral part of the national agricultural informationsystem. International organizations such as FAO, UNEP, CGIAR centres, including IWMI, and theglobal and national Soil and Terrain Digital Database (SOTER) programme have established dynamicand comprehensive databases. The national and international databases should be linked for derivingmaximum mutual benefits. FAO should strive to harmonize various indicators, methodologies forenvironmental and ecological accounting and data collection formats for standardizing theinformation collection and interpretation procedures.
EPILOGUE: NATIONAL VISION ON INVESTMENT IN LAND AND WATER
Each nation must have a vision statement on the investment in land and water. This should be basedon the present and future needs of food and agricultural production and productivity and the nationaland global opportunities. Each nation must assess the extent of cultivated land and irrigation it shouldhave to meet its goals. The extent, status and potential of the resources must be mapped systematicallyand scientifically and matched with the people’s aspirations, national capacity, and developmentobjectives. Based on this, will emerge explicit targets and policies and sectoral and subsectoralpriorities for investment in land and water resources.
Each country should have clearly defined rights to land, rights to water, and necessary laws. Ifnot there, these must be developed and transparent agrarian reforms should be undertaken. Thefundamental need for transparent governance of the natural and monetary resources andimplementation of the rights and laws can hardly be over-emphasized in context of flow of funds,especially from external sources. Specific policies for promotion of public and private sectors’investment, loans, credit and subsidy ('smart' subsidy) with special consideration of need and prospectof small farmers, and the provision of necessary institutional and infrastructural support need to be inplace simultaneously. In their negotiations under the WTO Agreement developing countries muststructure the 'green box' or if necessary introduce a 'food security box' in the Agreement, to protect theinterests of small farmers.
Who would have predicted that the world would not be the same after 11 September 2001 – atleast in the short to medium term. World Bank President James D. Wolfensohn estimated that "tens ofthousands more children will die worldwide and some 10 million more people are likely to live belowthe poverty line" of US$1/day because of the attacks and that many more will be thrown into povertyif development strategies are disrupted. He said that "20 000 to 40 000 children under five years oldmay die from the economic consequences of the September 11 attack as poverty worsens” (BangkokPost, 2 October 2001). Mr Wolfensohn further cautioned that developing countries GDP growth couldbe cut by 0.5 to 0.75 percent and developed countries by 0.75 to 1.25 percent in 2002 due to theimpact of the terrorist attacks.
Will investment in agriculture be further depressed due to the September 11 tragedy? It mustnot. The silent violence of hunger and poverty is a killer of a much bigger proportion. As Chilean poetGabriella Mistral has so eloquently reminded us all, the hungry child cannot wait. his bones andsinews are being formed now. You can’t tell him tomorrow; his name is today.
REFERENCES
Alex, G. and Steinacker, G. 1998. Investment in natural resources management research: experience and issues.In Persley, G.J. ed. Investment strategies for agriculture and natural resources – investing in knowledge fordevelopment. CAB International.
Ayibotele, N.B. 1992. The world’s water: assessing the resource, Keynote paper at the International

Investment in land and water 37
Conference on Water and the Environment: Development issues for the 21st Century, 26-31 January 1992,Dublin.
Bhatia, R., Cestti, R. and Winpenny, J. 1995. Water conservation and reallocation: Best practice cases inimproving economic efficiency and environmental quality. A World Bank-Overseas Development InstituteJoint Study. Washington, DC. World Bank.
Clarke, R. 1993. Water: the international crisis. Cambridge. IT Press.
Department for International Development. 2000. Addressing the water crisis – healthier and more productivelives for poor people. Consultation document. London.
Engelman, R. and Le Roy, P. 1993. Sustaining water: population and the future of renewable watersupplies. Washington, DC. Population Action International.
FAO/UNDP/UNEP. 1994. Land degradation in South Asia: its severity, causes and effects upon the people.World Soil Resources Report 78. Rome.
FAO. 2000. Agriculture towards 2015/2030. Technical Interim Report. Rome.
FAO. 2000. The State of Food Insecurity in the World. Rome.
FAO. 2001. Assessment of the world food security situation. Committee on Food Security, 27th Session, CFS:2001/2. Rome.
International Fund for Agricultural Development. 2001. Rural poverty report 2001: the challenge of endingrural poverty. Rome.
Jones, W.I. 1995. The World Bank and irrigation. Washington, DC. World Bank.
Oldeman, L.R. 1992. Global extent of soil degradation: biannual report. Wageningen: InternationalSoil Reference and Information Centre.
Rosegrant, M. and Svendsen, M. 1993. Asian food production in the 1990s: irrigation investment andmanagement policy. Food policy 18(2): 13-32.
Scherr, J.S. 1999. Soil degradation: a threat to developing country food security by 2020? In 2020 vision forfood, agriculture, and the environment, Discussion Paper 27. Washington, DC. International Food PolicyResearch Institute.
Singh, R.B., 2001. World agriculture and biotechnology. Keynote paper presented at APEC, ATC andJIRCAS Joint symposium on agricultural biotechnology 3-5 September 2001, Bangkok.
World Bank. 1992. Natural resource management in Nepal: 25 years of experience. Washington, DC.
World Bank. 2001. The World Bank and water: water issues brief. Washington, DC.

……Investment in land and water 39
Investment in land and water in the context ofthe Special Programme on Food Security
THE SPECIAL PROGRAMME ON FOOD SECURITY
On the basis of a desk review of Special Programme on Food Security (SPFS) projects, this paperpresents findings, reviews constraints, and examines how water control, soil management and plantnutrition issues relate to other aspects of the SPFS and to the goal of ensuring food security for all.
FOOD SECURITY AND SUSTAINABLE LIVELIHOODS FOR THE RURAL POOR
The FAO definition of food security is: “a state of affairs where all people at all times have physicaland economic access to sufficient, safe and nutritious food to meet their dietary needs and foodpreferences for an active and healthy life”. An estimated 800 million people worldwide suffer frommalnutrition although food is not scarce at the world level. Food insecurity is a problem of lack ofaccess resulting from either inadequate purchasing power or inadequate productive resources neededfor subsistence. Other causes of food insecurity are drought, conflict, poverty, population growth,poor economies, and failures in governance and in aid. Rural areas have specific problems with fragileecosystems, low productivity, neglect of pastoralism, narrow livelihood bases, weak infrastructure,few social services, and slow response to alerts. Resource-poor farmers have seen few benefits fromeconomic liberalization, and financial markets view them as poor credit risks.
A livelihood encompasses income in cash and kind; social institutions such as kin, family andvillage, gender relations and property rights; and access to education, health services, roads, watersupplies and other social and public services. It is sustainable when it can cope with stresses andshocks and maintain or enhance its capabilities and assets both now and in the future, while notundermining the natural resource base.
AIMS AND COMPONENTS OF THE SPECIAL PROGRAMME ON FOOD SECURITY
The SPFS is a principal strategy of FAO. It seeks to help low-income food-deficit countries (LIFDCs)improve their national and household food security on an economically and environmentallysustainable basis. It aims to promote rapid increases in productivity by small farmers in foodproduction and other rural activities, reduce production fluctuations and improve food access throughincreased household incomes.
________________________________________________________________________________
J. Poulisse, Senior Economist and J. Thomas, consultant rural development …Land and Water Development Division, FAO, Rome….
________________________________________________________________________________

Investment in land and water in the context of the Special Programme on Food Security…40
SPFS provides an opportunity to test innovative approaches on a small-scale with a view totheir wider replication. The SPFS belongs to and is the responsibility of the participating countrieswith FAO acting as an international facilitator and catalyst. Its eventual success will depend ongovernments’ willingness to establish a political, social and economic climate conducive toagricultural growth and the alleviation of rural poverty.
The guiding principles of the SPFS are national ownership, a focus on high-potential foodsand areas, participation, environmental awareness, and regard for the role of women. The SPFSapproach emphasizes participation and building partnerships at all levels. It aims to involve allpersons with a role to play: government officials of beneficiary and donor countries; scientists;extension workers; private traders and entrepreneurs; experts from intergovernmental agencies andNGOs; and farmers. It seeks to exclude no social group and to create no inequities and it attachesgreat importance to promoting the flow of information and knowledge to poor people. The SPFSgenerally endeavours to equip poor smallholders with productive assets in order to help them realizetheir potential.
The SPFS began in 1995 and is now operational in 60 countries (36 in Africa, 13 in Asia,seven in Latin America and two in Oceania). It consists of two phases: pilot (Phase I) and expansion(Phase II). Phase I involves demonstrations on farmers’ fields in selected areas within a country.These aim to: introduce farmers to innovative practices; enable participation in the evaluation of thetechnologies and management practices; identify and overcome obstacles to their adoption. Wherereliable water supplies are unavailable, SPFS envisages the introduction of low-cost irrigation anddrainage systems, together with better storage systems and land use practices to conserve water. Whenit begins, Phase II intends to create the environment for large-scale replication of developmentapproaches that have proved successful.
Phase I has four main interrelated and complementary components: water control; cropintensification; diversification of production systems; and constraints analysis and resolution. Thefocus on water control reflects the fact that timely water availability is crucial for plant development.With some investment and knowledge, many farmers could use water to safely increase the yield,quality and timeliness of crops. Water control entails complementary measures for intensification andthe proper maintenance and operation of infrastructures. The diversification of production systemsrecognizes the complexity of farming strategies and the need to develop ways of generating income,and the benefits of a more diversified nutrition. The constraints analysis process feeds back into PhaseI and forwards to Phase II.
Water control
The SPFS focuses on the technologies of farm production including small water supplies under thecontrol of farmers, such as furrow irrigation, pump systems and small water harvesting systems. Suchdecentralized production systems depend on a few centralized services to supply credit, seeds, animaldisease diagnostics and pest control techniques.
Although in principle water is a public good, the 1992 Dublin Statement states that “water hasan economic value in all its competing uses and should be recognized as an economic good”.Privatization is increasingly denying the poor access to water, especially for irrigation. The SPFSsupports water appropriation by the rural poor to make their livelihoods less vulnerable, and to anchortheir water rights in the law.
Realizing the potential of water control for self-employment and wage-employment by therural poor requires thorough investigation, in particular with regard to gender equity.
……Investment in land and water 41
The impact of a water control project on the nutritional situation of the community is not easyto demonstrate in a quantitative and objective way. The ultimate measure of a project’s success is theassociated change in the nutritional level of the community. However, indicators of better nutritionrequire considerable time to become significant and meaningful.
Crop intensification and production system diversification
Agricultural intensification requires increased flows of nutrients to crops, a higher nutrient uptake andhigher stocks of plant nutrients in soils. However, unless implemented properly, intensification cancause nutrient depletion, threaten biodiversity, increase erosion and, ultimately, environmentaldegradation. Without nutrient inputs, agriculture in the tropics results in nutrient mining. Thus, theSPFS project report from Guinea underscores the need for soil fertility management. Plant nutritionmanagement depends largely on prevailing economic and social conditions. Farmers’ decisionsdepend on their economic situation and socio-economic environment; their perception of economicsignals; and their acceptance of risks. Plant nutrition management can contribute to food security andto sustainable crop production.
Optimizing the management of plant nutrients while maximizing incomes for farmers withinthe local economic context entails local-level decisions on the management of and investment in localsources of nutrients (vegetation and livestock). The major aspects are: assessment of nutrientrequirements; choice of sources and methods of supply; determination of the level of domesticfertilizer production required; price levels and subsidies for plant nutrients; legislative aspects; andtechnical support. Policy-making in these areas determines the extent to which farmers have access toplant nutrients and are able to increase their production while maintaining soil fertility. A farmerneeds purchasing power to obtain external inputs, and advice on how to use them in a balanced way.In remote areas of developing countries, poor farmers lack purchasing power, mineral fertilizers areexpensive because of transport costs and intermediaries, good advice is hard to obtain, and fertilizersubsidies have widely disappeared as a result of structural adjustment (FAO, 1998).
A concern in the SPFS is to overcome the yield gap (the usually considerable differencebetween per hectare yields in the food-challenged community and in experimental fields undercontrolled conditions). Among the reasons for this yield gap are: (i) government cuts in support foragricultural research (IFPRI, 1999); (ii) privatized research geared to farmers who can pay royaltiesrather than to subsistence farmers; (iii) limited research into crops grown in the tropics; (iv)constraints such as production costs and marketing.
Research-developed crop varieties need tending to in a particular context: the “technologypackage” surrounding the application of the selected seeds and ensuring the development of theirpotential. The main factors supporting the crop are water management at the root level, plant nutritionand pest protection. In Phase I, the SPFS tests and demonstrates the benefits of using improved seedswhile adjusting the package to local conditions. If successful, the technology spreads to use byfarmers who have had an opportunity to evaluate its application in their own household context.
Agricultural intensification and diversification have led the SPFS to support cash crops as aflexible way of improving nutrition, in particular for infants, and of facilitating children’s access toeducation. A diversified productive base, such as in the “field, pond and stable” approach in SoutheastAsia, enhances household food security through a more intense use of the available assets, availabilityof more varied food, and the added ability to generate cash. Such systems are easily internalised, inparticular when they offer an opportunity for women to employ their time more effectively. Forexample, freeing them from carrying water from distant sources can have a positive nutritional impactas they can apply more time and energy to productive activities.

Investment in land and water in the context of the Special Programme on Food Security…42
Many urban poor and underemployed resort to the street trade of food though often beset byhygiene and health hazards and lacking suitable land, safe water and adequate inputs. Phase I hasevidenced the links between rural and urban poverty and the need for coherent food security policies.Consequently, SPFS activities have incorporated urban and peri-urban agriculture.
PROJECT FINDINGS AND CONSTRAINTS
This section presents project-specific data from initiatives in Africa and Asia (Boxes 1 and 2).
A Senegal case study
A study carried out in Senegal (Sonko, 2001) identified factors that contribute to food insecurity inthe context of a rural village: (i) Lack of landownership. Obstacles include: high population pressure,land parcelling, difficulties in reaching remote land, settlement of borrowed land (owing tomigration), social status and gender; (ii) Social disintegration. Disintegration of social culture ingeneral and of the family in particular; (iii) Credit access difficulties. Chronic debt related to formerfinancing mechanisms has removed capital from the rural economy; (iv) Lack of employment. Littledevelopment of off-farm employment opportunities; (v) Conflict and insecurity. Some productionactivities are risky because of low prices, floods and other contextual hazards; (vi) Disability and oldage; and (vii) Macro-economic and structural adjustment-related policies may penalise rural activities.
Subsidized support tends to leak to the non-poor, where it is less effective in improving foodsecurity. For example, the Senegal study of sustainable livelihood approaches in the SPFS examinedthe situation at the Saré Bouka demonstration site. Ranking people by wealth, it found that 70 percentof those considered rich (19 percent of the population) received poultry, whereas only 22 percent ofthose considered poor (50 percent of the population) benefited from the programme. In the context ofthis village, the rich are people that fulfil their food needs over the year and have some surplus. Mostof them have agricultural equipment and are able to recruit temporary workers. Some of them ownbusinesses, save money, lend money or goods and have stocks of merchandise and provisions.Diligent monitoring and conservation can prevent the flow of project resources to the non-poor.
A Tanzania case study
Small-scale rural producers may apply over 80 percent of their household product to meeting theirbasic food requirements and their livelihood strategies may be complex. For example, a jointFAO/DFID analytical study of the application of sustainable livelihood approaches to SPFS (Temu,2001), carried out in areas of Tanzania vulnerable to food scarcity, identified strategies that include:(i) providing casual labour against payment, often at distant places; (ii) engaging in off-farm activitiessuch as brick making, quarrying and brewing; (iii) consuming alternative foods, e.g. roots and tubers;(iv) seeking help from the extended family; (v) borrowing food or money; and (vi) reducing foodintake. The first three options are common to most livelihood strategies, while the last three relate to astate of food distress. Households on the brink of food insecurity have no savings and limited or noaccess to credit, and any failure in their strategic enterprises may result in acute food insecurity,dissolution of the household, emigration of the stronger and starvation of its weaker members. Suchhouseholds adopt conservative risk management strategies and are averse to engaging in anyspeculation as long as their food supply is not secure.
A nutritional impact survey carried out in Tanzania during Phase I enabled better planning ofPhase II (Egal, 2001). In Mali, the failure to conduct a preliminary study had a negative impact oncertain social groups. The Tanzania study found no explicit documentation to indicate the undertakingof in-depth surveys and research to establish the food security status and vulnerability in the project

……Investment in land and water 43
area. With decisions based on secondary information and without a full understanding of economicand social forces, action will remain haphazard.
The FAO/DFID study found that current land tenure arrangements provide little incentive forsmallholders to fully adopt the SPFS-recommended technological packages. Farmers highlightedproblems of conflict between herders and crop producers. Other problems stemming from land tenureinclude apparent lack of concern to improve the quality of land by investing in it, and also failure toconserve it by measures such as fire prevention, erosion prevention, proper management of watercatchments and tree planting.
In Tanzania, the participatory approach was advanced through: (i) formation of homogeneoussocial economic groups (Participatory Farmers Groups, PFGs); (ii) a participatory process ofidentifying production constraints; (iii) participatory selection of appropriate production technologies;(iv) farmer training to enable full participation in technology dissemination; (v) creatingunderstanding and acceptance of the programme through awareness and sensitization about SPFS; and(vi) orienting training of village extension workers and equipping them with participatory techniquesand relevant technologies. Interviews with officials indicated that the approach recommended in the“Guide on Participatory Group Formation” was valid and succeeded in promoting farmerparticipation.
CONSTRAINTS, SHORTCOMINGS AND HOW TO DEAL WITH THEM
Productivity gains depend increasingly on human resources. Professional training and integration offarming populations into the process of development must accompany improved health, nutrition andliteracy levels. In this regard, Phase I tackled some activities originally envisaged for Phase II, such asfarmers’ field schools. A number of points emerged. For example, technical solutions must beintegrated with local issues to provide solutions for resource-poor communities. In very diverse social,economic and ecological environments, technology packages must be diverse and adaptable.Extension staff need to be aware of the technology and the specific needs of their communities.However, extension staff is often poorly prepared in terms of new technology skills and knowledgeand their transfer. This handicap, coupled with poor motivation due to low salaries and status, maymake them reluctant to face farmers. Extension staff should be a first target for training.
Within the SPFS, water control for irrigation focuses on simple low-cost technologies andinvolves other specific aspects such as institutional capacity building, promotion of support activities,and integration with other components. Success hinges on group formation and farmer participation inirrigation scheme maintenance, the promotion of relevant technologies and partnership arrangements.The need for multidisciplinary teams to support extension workers has emerged. Unsatisfactoryfarmer participation in various stages of technology transfer often points to a persisting weakness inthe approach. Reporting on irrigation activities should include such aspects as irrigated land increasesand cropping intensity improvements.
There is a need to demonstrate that water is a major constraint, to fully determine the level ofsubsidies in irrigation, and to gather more data on technologies and returns to investments. Forexample, in Tanzania, Phase I showed farmers in irrigated demonstration areas how to double yieldsby using improved seeds at the proper planting dates, applying fertilizer, spacing plants properly, andprotecting soil and water. Although the exercise was successful, it did not provide a breakdown of theefforts and rewards at the household level derived from the use of irrigation. In Malawi, peopleinterested in irrigation farming faced the problem of access to communal land. Most of the landbelongs to particular individuals and unless genuine cooperation exists, using borrowed land for groupfarming usually results in conflict. There should be a critical assessment of landownership before

Investment in land and water in the context of the Special Programme on Food Security…44
selecting sites for smallholder irrigation. Land tenure problems also exist in Nepal, where goodirrigable land is underused while landless farmers are forced into temporary emigration.
In Pakistan (Box 1), zero tillage technology saved irrigation water and reduced tillageoperation costs. In Bangladesh (Box 2), the best practice in channel management decreased pumpingcosts by 25 percent. In Bolivia, the technique reduced erosion on land that intensification hadrendered highly exposed. An important criterion was that the same land could be used for pasturebefore and after the cropping season.
Human resources
Women
Rural women often have a threefold role within a household: child-rearing, household managementand income earning. Women’s share in the labour force is generally high in countries where landavailability and income per agricultural worker are low. For example, in Zimbabwe’s communalareas, women constitute 61 percent of the farmers and at least 70 percent of the labour force (FAO,1996). Comparative studies of the productivity of irrigated plots in Burkina Faso (Zwarteween, 1997)and in Senegal indicate the higher productivity of female-managed plots. In Mali and Tanzania,entrusting women with marketing and managing the returns resulted in net benefits in child nutrition.
In Ethiopia, the SPFS includes 160 sites with over 30 000 participating farmers, more than 50of them widows. It would thus appear that other women are supposed to participate through the malehead of the household. The participation of women in PFGs in Tanzania ranged from 49 to 19 percent.At a national SPFS workshop in Kenya, the 29 field staff was all men. This aspect requires furtheraction, as achieving better nutrition without the full participation of women will be difficult.
Developing the sensitivity and capacity of SPFS staff so they can address inequity towardswomen and focus on supporting women’s role in food supply and nutrition can have a large impact onits effectiveness, especially in reducing malnutrition among children. However, gender discriminationtends to remain entrenched. Participation in the information gathering phase should involve thestakeholders, that is, women in food-challenged households. The same cultural patterns that result ingender inequity often also make it impracticable for male agents to collect and cross-check therelevant information. Among the subjects in any investigation are land tenure arrangements, waterallocation to female-headed households and the non-agricultural uses of water that alleviate theworkload and improve health and nutrition for poor women and children. In order to target povertyalleviation and nutritional improvement effectively, the SPFS needs gender-integrated teams.

……Investment in land and water 45
BOX 1Special Programme for Food Security in Pakistan, 1998-2001
Objectives:
• supplement national efforts to increase food production through enhancing crop productivity;• ensure food security and alleviate poverty at village level through improving productivity and
income of small farmers;• build a sustainable model to ensure continuity of the food security programme.
Phase I: operational in two pilot villages since August 1998 (and one other since August 1999).Approach: participatory – farmers’ leadership and participation in all field activities. Focus: smallfarmers (large farmers restricted to 12 acres for input provision from the project). Water Users’Associations established and federated in a Village Organization. Phase I completed end July 2000.
Phase II: completion of ongoing activities in existing pilot villages and start-up at two new pilot villageswith the objective of training local manpower to extend the project model to other villages.
Programme components:• water management (watercourse improvements, furrow bed irrigation technology, precision land
levelling with laser technology, farm redesigning and planning, water scheduling and minimaltillage technology).
• crop management (improved and certified seeds, balanced fertilizer application, plant protectionmeasures, modern farming technologies and machinery, and crop diversification).
• income diversification (small-scale rural poultry farming, bee-keeping, agro-forestry; growing off-season vegetables; fish farming at farm level; and production of certified seeds).
• human resource development (group extension approach; training in production technology forfarmers and field staff of agriculture extension and on-farm water management departments;benchmarks established at village level).
• socio-economic constraints analysis (at village, district, provincial and national levels).
Food crops such as wheat, maize, rice, oilseeds and pulses are the main focus of the programme.Provincial governments have provided manpower and technical services assist farmers at theirdoorstep. For ensuring future sustainability, each village now has an input sales centre, farm servicescentre and revolving fund account under the supervision of the Village Organization.
Farmers pay 100 percent cost of inputs (50 percent at delivery and 50 percent after harvest). Forimplements, farmers contribute 50 percent and the programme pays the rest.
Crop productivity: Under this project, wheat productivity increases (compared with the benchmark value)in the pilot villages ranged from 28 to 51.5 percent for the first crop and averaged 62 percent for thesecond crop with a maximum increase of 168 percent, while for rice the productivity increases were 26.7percent (first crop) and 50.3 percent (second crop) with a maximum of 125.6 percent.
On-farm water management: Furrow bed planting of wheat has given a 13 percent higher yield thanwith flat bed sowing and a water saving of 22 percent compared with the flood irrigation system. Zerotillage technology has penetrated the rice-wheat system and have farmers bought 50 drills at theirown expense.
Income diversification: The SPFS pilot project provided 500 birds and a poultry shed. The farmersthen built seven more sheds for 12 000 layer chicks resulting in an 11-fold increase in poultry shedarea and a 24-fold increase in the number of chicks within one year. From bee keeping, each farmerhas averaged a profit equivalent to that from 2.4 ha of wheat, 1 ha of cotton and 2 ha of rice. Farmershave started fish farming at their own expense.
Revolving fund accounts ensure project sustainability, and at some site farmers now rent out theirfarm implements, so enabling a permanent source of income and access to all kinds of implements.

Investment in land and water in the context of the Special Programme on Food Security…46
Many project agents (national and international civil servants, consultants, experts,technicians and extension agents) are reluctant to venture out of their assigned field. Their assumptionthat others will combine all the elements to improve the nutritional situation is often mistaken andproject benefits may accrue, not to the targeted group, but to the non-poor.
Another problem is the communication gap between poor farmers and researchers. Extensionservices are understaffed, often with ill-prepared, poorly paid and unmotivated staff. The Tanzaniastudy points out that the delivery of extension services has been weak, while the PFG relies heavily onextension services for the dissemination of technological packages and conducting on-farmdemonstrations. New approaches and commitment are needed to ensure that farmers benefit fromtechnological innovation.
Elitist tendencies are common. Non-local people find it is easier to deal with the moreeducated or cosmopolitan locals. But, the task is to ensure that every member of the community hasinternalised the pros and cons of the envisaged actions and the benefits and obligations ofparticipation. Consensus then needs to lead to action, but not every community has the leaders and theteam to do this.
A critical aspect in some projects is that local manpower is not familiar with the technicalitiesof on-farm water management. However, it is difficult to assess the extent to which training helpsovercome constraints. Trainees attend courses because they feel the need for training in order toproperly apply the knowledge to securing their livelihood. However, during the high agriculturalseason, farmers may prefer to tend to their fields. In rural areas with high seasonal or permanentunderemployment and disguised employment, the prospect of receiving a financial benefit in the formof a training allowance may attract participants. This may lead to applying limited financial resourcesin an unsustainable and unsound approach.
Financial, organizational and technical constraints
Credit, funding and the private sector
Large global and regional development banks are available to support government developmentefforts. However, in conventional banking, small producers are not creditworthy, or the business istoo small to justify the transaction costs. Small farmers need more innovative forms of banking. Incohesive communities, small farmers groups can provide collateral, while loans in kind can helpovercome practical difficulties.
Within an adequately implemented regulatory framework, the private sector should beincreasingly responsible for investments and services such as input provision, credit and marketingservices, and the development of agro-industries. However, private investment in agriculture isseldom pro-poor. In many developing countries, traders provide marketing and credit services tofarmers that lack access to a market within reasonable distance. However, traders tend to take amonopolistic position, are generally unable to supply technology and unwilling to financeinfrastructure. This system leaves farmers no margin for capitalization. For many subsistence farmers,fertilizers are unaffordable. Pesticides are a health hazard as farmers lack training in their use. Undersuch circumstances, employment generation for unskilled local people is low quality and minimal.Lacking an adequate public policy framework, the potential of the private sector to improve incomesand food security remains underutilized.

……Investment in land and water 47
The main problems small farmers have with input supply and output marketing relate to:enabling policy for private sector marketing; rural infrastructure investments; extension services;market information; and adequate post-harvesting handling and storage. Small farmers, rural tradersand extension staff need improved business skills. Within a competitive environment, stable relationsbetween farmers and the private services sector are advantageous. In the Kauti district of Kenya, forexample, a wholesale exporter collects French beans produced by smallholders, but there is no formalcontract, the exporter does not always take all the harvest and does not provide credits for inputs.
Organizational and technical aspects
Many countries have been slow to set up a national SPFS steering committee. For example, althoughBurkina Faso committed itself to implementing the SPFS in 1995/1996, in June 1999, while work inthe field was advanced, there was still no steering committee. In Tanzania, owing to what may be anoverly bureaucratic structure, senior officials and committees have minimal direct influence onfarmers’ activities. However, senior managers accept and support farmer ownership of the process.The success of Phase I was due to the active participation of stakeholders at every stage. Variousstakeholders (farmer’s groups, input suppliers, credit institutions, research and extension officers,regional and district policy-makers and authorities) participated in identifying key issues and, at a
BOX 2
Special Programme for Food Security in Bangladesh
The On-farm Water Management Pilot Programme became operational in July 1999.
Objectives:
• demonstrate and pilot farm-level water management procedures and techniques consistent withfarmers’ needs and ensure the sustainability and participative management of surface water.
• develop and test procedures to strengthen the capacity of authorities and local NGOs to provideeffective support to farmers to improve on-farm water management (OFWM) and to intensifycrop production.
• monitor and assess programme effectiveness and prepare recommendations on how to expandthe pilot demonstrations into national and regional development programmes.
Activities implemented:
• Participatory rural appraisal.• District workshops and first national workshop.• Technical staff training, farmers’ seasonal training, farmers’ field school and technical field
training.• Pilot demonstration programme with main crops included (i) OFWM improvements and
(ii) crop husbandry techniques and technologies adapted to the specific conditions.• Community development with local NGOs.• Women’s group training.
Achievements:
• On-farm water management - (i) delineation of manageable irrigation blocks, (ii) improvement ofthe distribution systems, (iii) irrigation scheduling and (iv) supplementary irrigation of rice.
• Best practice in channel management - command areas increased 20 percent; pumping costsdecreased 25 percent.
• Crop demonstrations - new crops and varietal shift for agricultural diversification, improved ricenursery, line transplanting of rice, green manuring, balanced fertilization, integrated pestmanagement and small pond fish culture now adopted at pilot sites and adjoining areas.
• Training for capacity building, skills development and empowerment - involving women• Community development and women’s development training - water user groups and
associations formed with groups for women.

Investment in land and water in the context of the Special Programme on Food Security…48
later stage, implementation approaches such as increased production, project financing, technology,expertise and human requirements, and information needs.
In Angola preliminary studies carried out by persons unfamiliar with the reality of the projectregion failed to provide the information required to formulate a work plan. It is necessary to establishpreliminary contacts with the communities in order to identify and address problems that haveimmediate solutions, and so gain their trust. This makes it possible to obtain a clear picture of theexisting socio-economic reality and a list of families, useful for defining the interventions andenabling participation. It is also essential to establish freely elected and recognized (by traditional andpolitical authorities) community development committees which should be active in the planning andexecution of all actions.
The full integration of infrastructure and rural development is essential. Projects aimed atwater control infrastructure development alone have limited chances of benefiting the poor beforethey benefit the non-poor.
Although the privatization of public goods, such as knowledge, may aim to improve dynamicefficiency through greater innovation, a loss of static efficiency may result from thwarted competitionand the underuse of protected knowledge (Stiglitz, 1999). The SPFS projects do not appear to haveused copyrighted seeds, possibly because they are not relevant to the needs of the rural poor.Traditionally, farmers save selected seeds from one growing season and plant them in the next, and inthis way are sure of using locally adapted varieties.
Rural people’s skills may no longer be appropriate under changed conditions, but farmers arewary of changing traditional farming methods and need exposing to new techniques without theircarrying too much risk. Applying technology to transform agriculture and raise incomes is at the heartof most development assistance in this field. The major problems are not technical but concernreaching agreements on facts, alternatives or solutions. Technology can contribute to economicgrowth by overcoming resource scarcities and by combining products and inputs to optimise output.However, complex, diverse and risk-prone production environments call for adaptive designs andstrategies. Many technologies address single commodities and specific forms of production, such asrainfed or irrigated agriculture. In reality, farming households pursue a range of production activities,which may include spatial diversification to ensure food, fire, shelter and health. Designing supportservices to cater to such diversity is difficult.
Phase I highlighted other development constraints and problems. They included having openand porous borders with large and relatively developed countries; inappropriate donor policies anddependence on donors; misplaced national priorities; and administrative instability. Also, farmersabandoned newly introduced subsidized cropping patterns once the FAO-recruited team withdrew;there were shortages of seeds and planting and propagation materials (centralized systems of inputproduction, procurement and distribution failed to cater to local needs); and there was a paucity oftechnical and economic information related to irrigation based on actual experience and observationas well as the fragmentation of holdings.
SPFS has been subject to specific constraints and issues. FAO recruited staff may beoperating in a different regime of rewards and incentives, or parallel to the existing network ofagricultural research and extension services. Such factors and the associated issues of replicability andsustainability are the principal SPFS-created constraints that may seriously jeopardise its expansion.
Another SPFS-specific constraint relates to the doorstep delivery to farmers of inputs eitherfree or at heavily subsidized rates. An efficient and effective input distribution system is essential toany development programme. The priority national policies attach to rural roads, technology systems,

……Investment in land and water 49
etc. is a testimony to the recognition of these prerequisites. However, the means and style adopted inactually implementing the SPFS may be at variance with its own and national goals. The SPFSapproach of delivering key inputs itself or through seeking special favour is contradictory and canbecome a major SPFS-produced constraint on the programme’s expansion as it is neither replicablenor sustainable. Instead, it should explore ways of improving existing institutions and systems.
CONCLUSIONS
There is general agreement that the provision of food security has to start from the household level.Changing the agricultural structure of developing countries while promoting sustainable livelihoodsfor rural people and reducing poverty requires a long-term commitment. However, as internationalinstruments erode governments’ capacities to implement national policy objectives, national effortsneed supporting in a context of food security as a global public good. Food security and ruraldevelopment are essential precursors to prevent environmental degradation.
SPFS has demonstrated that investment in land and water can promote agriculturalintensification and diversification. The resulting sustainable productivity gains can improvehousehold incomes and livelihoods, provided certain identified constraints are overcome. Overcomingsuch constraints usually requires funds, be they on long-term credit, on concessionary terms or grants.To generate funds, it will be necessary to prepare small, well-designed food security projects withconcrete goals and reasonable overheads. Such projects will need to demonstrate what inputs areneeded to obtain the results that the stakeholders desire. The results of such projects need to have animmediate and clear relation with the improvement of livelihoods and food security. Reportingchanges in the nutritional situation may not be practicable in every case, but nutritional impactsurveys and monitoring can provide proof that the SPFS is having an impact where it matters.Transparent implementation of the SPFS and an accurate monitoring and reporting system arepreconditions for acquiring credibility. The capacity to generate, analyze and report the necessary dataneeds strengthening. A key role for FAO lies in collating and disseminating the critical information ina reliable way.
A lesson from the SPFS project in Guinea is that, before launching the project, institutionalpartners need to provide adequate and timely information at the field level in order to ensure thatpartners such as farmers’ groups buy into it. The project identified a need to strengthen the capacity tomonitor, evaluate and analyze the economic viability of proposed packages. Rural developmentspecialists are a key element in establishing the capacity and professionalism of the SPFS teams.
Incorporating nutritional impact surveys in the SPFS planning process can help direct projectbenefits to improving the nutritional situation of the poorest households in the target community.There should be a special focus on understanding the role and functions of women in the household,as any action leading to increased effectiveness in family nutrition can free time for other productivetasks. Severe conceptual and methodological biases have undervalued women’s role in agriculture.On the other hand, however, the experience with the SPFS shows the potential to improve upontenancy rights and contract farming opportunities in some countries as significant developments.
In conclusion, land and water investments are essential components of an approach that seeksto ensure sustainable food security. However, small-scale project success and wider replication willdepend on managing all pertinent aspects of investment in water (e.g. irrigation, drainage and watermanagement), land (e.g. plant, nutrient and soil management), human resources and infrastructure in adynamic national and international context.

Investment in land and water in the context of the Special Programme on Food Security…50
BIBLIOGRAPHY
Briscoe, J. 1998. The financing of hydropower, irrigation and water supply infrastructure in developingcountries. Paper prepared for the United Nations Department of Economic Affairs, presented at the ExpertGroup Meeting on Strategic Approaches to Freshwater Management, Harare, 27-30 January 1998.
Egal, F., Kouadio, G., Siano, R. & Tiendrebéogo, F. 2001. Impact des aménagements hydroagricoles sur lasécurité alimentaire des ménages et de la nutrition: l’experience de la FAO.
FAO. 1994. New directions for agriculture, forestry and fisheries. Rome.
FAO. 1996. Food production: the critical role of water. Technical background paper for the World FoodSummit. Rome.
FAO. 1998. Guide to efficient plant nutrition management. Rome.
FAO. 1998. Rural women and food security: current situation and perspectives. Rome.
FAO. 2000. Food for cities; food supply and distribution policies to reduce urban food insecurity(http://www.fao.org/AG/AGS/AGSM/SADA/Pages/DT/DT4300E.htm). Rome.
FAO. 2000. New dimensions in water security: water, society and ecosystem services in the twenty-first century.AGL/Misc/25/2000. Rome.
IFPRI. 1999. The past 25 years: successes, failures and lessons learned in feeding the world.www.cgiar.org/ifpri/2020/background/25years.htm
Shakya, P.B. 1998. Constraints analysis of the Special Programme in Nepal and investment model for itsexpansion phase. Kathmandu.
Sonko, L. 2001. Joint analytical study of the application of sustainable livelihood approaches in the FAOSPFS: Senegal data collection. Rome, FAO/DFID.
Stiglitz, J.E. 1999. Knowledge as a global public good. In Global public goods: international cooperation in thetwenty-first century. New York, UNBDP/Oxford University Press.
Sy, J.H. 1999. Global communications for a more equitable world. In Global public goods: internationalcooperation in the twenty-first century. New York, UNBDP/Oxford University Press.
Temu, A. 2001. Joint analytical study of the application of sustainable livelihood approaches in theFAO/SPFS: Tanzania mission report. Rome, FAO/DFID.
Van Koppen, B. 1999. More jobs per drop for the poor: poverty and gender dimensions in a vision for food andrural development.
Zwarteween, M.Z. 1997. A plot of one’s own: gender relations and irrigated land allocation policies in BurkinaFaso. Research Report 10. International Irrigation Management Institute, Colombo.

……Investment in land and water 51
The benefits of investment inland and water
INTRODUCTION
Agriculture and the rural sector remain vital to pursuing the related goals of food security, povertyalleviation and sustainable development.
Increased agricultural output will have to come mainly from intensified rather than extensiveproduction as per capita land and water resources diminish. This implies continued productivity gainsin the use of these two primary resources and factors of production.
Such increases in productivity will require increased investment in agriculture, and especiallyin land and water development. However, investment in these areas is decreasing or at best stagnating.Governments, authorities and development practitioners are thus facing the paradox of having agreedto development goals requiring increased production with diminishing per capita resources, butwithout the concomitant investment to do this.
This paper examines this apparent contradiction from a perspective of land and water. Itfocuses on land and water as finite resources and factors of production on which productivity-increasing technology in agriculture depends. While dealing with land and water in parallel, it alsorecognizes their interrelationship and complementarity. The emphasis is on irrigation because of itsprominent role in food production under intensive systems and because it is the largest consumer ofwater in agriculture and in overall water use. The paper also examines ways in which land and waterinterrelate under less-favoured rainfed conditions to improve productivity. The overall theme is that ofwhy investment in land and water development is essential for food security, poverty alleviation andbalanced development in developing countries.
LAND AND WATER AVAILABILITY
Together with labour and capital, land and water constitute the aggregate resource base foragricultural production. Their association with appropriate types and levels of labour, capital andtechnology enhances their productivity in agriculture. Thus, their availability is central todevelopment, food security and poverty alleviation.
________________________________________________________________________________
K. Yoshinaga, Director, Land and Water Development Division…FAO, Rome…
________________________________________________________________________________

The benefits of investment in land and water…52
Land availability
According to FAO estimates, about 30 percent of the world’s land surface is suitable for rainfedagriculture. Of this area, some 2.8 billion ha in developing countries have the potential for growingrainfed crops above an acceptable minimum level. With 960 million ha already cultivated, this leaves1.8 billion ha for further expansion (FAO, 2000a).
However, the utility of this reserve is limited as about 90 percent of it lies in seven LatinAmerica and sub-Saharan countries. Furthermore, much of the land suffers from constraints such asecological fragility, low fertility, toxicity and lack of infrastructure. Human induced land degradationsuch as soil erosion and salinization is also a factor.
The projected expansion of arable land for crop production in developing countries by 2030 isabout 120 million ha, with the bulk of it in sub-Saharan Africa (57 million ha) and Latin America(41 million ha).
FAO estimates that between 1995/7 and 2030 about 80 percent of the projected growth incrop production in developing countries will come from intensification in the form of higher yields(69 percent) and cropping intensities (11 percent), with the remaining 20 percent coming from arableland expansion. The share due to intensification will exceed 90 percent in land-scarce parts of theNear East, North Africa and South Asia. In the preceding 34 years 76 percent of the growth in cropproduction was due to intensification (71 percent from higher yields and 5 percent from highercropping intensity), and 24 percent from arable land expansion. Intensified production occurs mainlyon land already under cultivation (FAO, 2000a).
Water availability
The major problem with water is not its quantity but its uneven distribution in time and space. Thecombination of uneven distribution and expanding population is increasing the pressure on waterresources in various countries, mainly in Africa and the Near East. In 1995, 29 countries withpopulations totalling 436 million experienced water stress or scarcity. By 2025 the correspondingfigures will be about 48 countries and more than 1.4 billion people, most of them in the leastdeveloped countries (World Bank, 2001). Moreover, such data do not show how countries with amplesupplies of water relative still experience shortages in many localities, e.g. China and India.
Increasing water scarcity will result largely from rapidly growing demands for agricultural,industrial and household purposes. At the same time, the potential for expanding supplies in manycountries and localities is diminishing. Deteriorating water quality and environmental conditions,degradation of irrigated land, insufficient river flow, upstream land degradation and seasonal floodingwill aggravate water shortage problems. Unless there is prompt action, developing countries risksevere water shortages that could depress agricultural production and limit industrial and householduse (IFAD, 2001).
The threat to agricultural production is particularly severe because this sector accounts for80 percent or more of total water use in many developing countries (Yudelman, 1994). As irrigation isthe largest user of water (often at highly subsidized rates), attention needs to focus on improving itsgenerally low water use efficiency levels.

……Investment in land and water 53
IRRIGATION
By ensuring a regular and timely supply of water, irrigation reduces the risk of crop losses fromuncertain rainfall and enables production in areas or at times without rainfall. There are strongsynergies between irrigation and other principal sources of agricultural growth such as fertilizer,improved plant varieties, better husbandry, upgraded infrastructure and better integration intomarkets. These encourage farmers to invest in land improvements and in other inputs.
Irrigation is difficult to analyze or to generalize about because irrigation systems areextremely diverse in terms of size, technological sophistication, crops produced, agronomic practices,economic and financial viability, reasons for existence, institutional organization and social context.However, their common denominator is that they all provide water to enable farmers to increaseoutput per hectare.
In 1995/97, the total irrigated area in developing countries amounted to about 197 million ha(three-quarters of the world’s irrigated area). Seventy-four percent of this irrigated land is in Asia,14 percent in the Near East/Africa, 9 percent in Latin America and 3 percent in sub-Saharan Africa. Inview of this and the fact that the annual growth of irrigated area in developed countries fell to0.2 percent in 1990-1997, it is reasonable to conclude that events in developing countries willcontinue to dominate the world irrigation scene (FAO, 2000a).
Contribution
Irrigation increases cropping intensity andcontributes to expansion in cropped areas. Itincreases yields, stabilizes output, enables cropdiversification, reduces risk and increases farmincomes and employment. Through itsinfluence on agricultural incomes, irrigationhas a multiplier effect on non-farm incomes. Itcontributes to food security and povertyalleviation. By improving agriculturalproductivity, irrigation contributessignificantly to overall growth anddevelopment (Box 1).
While determining the precise share ofproduction gains attributable to irrigation isalmost impossible, without the advances inirrigation technology and extraordinaryinvestment in irrigation expansion by bothpublic and private sectors, the GreenRevolution would probably have had a muchsmaller impact (Barker and Van Hoppen,1999). With the exception of the mostfavoured rainfed areas, the Green Revolutionoccurred only on irrigated land (Seckler,1999).
The Green Revolution helped morethan double the aggregate food supply in Asia over a 25-year period, with only a 4 percent increase inthe net cropped area (Rosegrant and Hazzell, 1999). It also contributed to significant national
BOX 1Agricultural productivity, growth and
development
There is general agreement that increases inagricultural productivity are central to growth,income distribution, improved food security andpoverty alleviation in rural economies. There isstrong evidence that it is essential to accelerateagricultural growth if poverty is to decline rapidly.
Increased farm production improves farmersincomes, generates on-farm employment andlowers food prices, all of which reduce poverty asthe poor typically spend 60-70 percent of theirincome on food. Recent studies suggest that aneven more significant effect on rural povertyderives from increased farm incomes stimulatingdemand for the goods and services offered by thesmall-scale enterprise sector. Where labour isabundant, agricultural growth generates significantincome and employment multipliers within the localnon-farm economy. Where such large multipliersexist, technological change in agriculture has thepotential to generate significant new non-farmearnings for the poor. Continued agriculturalgrowth, and hence more water for irrigation, isessential if this subsector is to play its role inreducing poverty (Mellor, 2000; IFAD, 2001).

The benefits of investment in land and water…54
economic growth and saved large areas of forests, hillsides and other environmentally fragile landsfrom conversion to agriculture.
Perhaps the greatest benefit of irrigation has been in keeping food affordable to the poor.Between the 1960s and the 1990s real grain prices fell by approximately 50 percent as productiongrowth continued to exceed population growth. Although subsidization of food grain production bydeveloped countries played a part, the Green Revolution was largely responsible for this decline(Barker and Van Hoppen, 1999).
The Green Revolution also sustained employment (IFAD, 2001). Where an area doubledgrain yields in the 1970s, employment per hectare normally rose by 40 percent, with a further30 percent due to extra-farm demand for rural non-farm products (Hazzell and Haggeblade, 1993).The incidence of poverty in affected rural areas fell, typically from 30 to 50 percent to 5 to 15 percent(IFAD, 2001). In the 1970s agriculture accounted for 25 to 40 percent of GDP in the GreenRevolution countries, which contributed substantially to their GDP and consumption growth.
In India, the multiplier effect of higher incomes in agriculture creating off-farm employmentopportunities helped decrease the number of people below the poverty line from 50 percent toapproximately 35 percent between the mid-1970s and 1990 (Datt, 1998).
Irrigation has good distributional effects as most irrigation projects have targeted privatefarmers (mostly smallholders) and its benefits accrue mainly in rural areas. Two-thirds of the incomeof the rural poor comes from farming and most of the rest depends for growth on linkages to farming(IFAD, 2001).
In developing countries irrigation serves about one-fifth of all arable land, accounts for some40 percent of all crop production and almost 60 percent of cereal production. Recent analyses suggestirrigated agriculture will account for 38 percent of the total increase in arable land and for more than70 percent of the increase in cereal production between 1995/1997 and 2030 (FAO, 2000a).
Expansion
Between 1961/1963 and 1995/1997 the irrigated area in developing countries increased at an annualrate of 1.9 percent to 197 million ha. Asia registered the largest increase: 70 million ha (mainly inIndia, Pakistan and China); while in sub-Saharan Africa the increase was 2 million ha. The predictionis for the area of irrigated land to increase by 0.6 percent per year to 242 million ha in 2030. Decliningand insufficient investment in agriculture, the broader water sector and irrigation reflects this decreasein irrigation expansion.
In developing countries there are signs of underinvestment and underperformance inagriculture. When measured in constant 1995 prices, official development assistance from bilateraland multilateral donors is 8 percent below 1990 levels. Throughout the 1990s the flow of funds toprimary agriculture declined while there was increasing attention on other areas, in particularenvironmental protection, rural development and infrastructure (FAO, 2000b). The proportion ofsectorally allocable aid reaching agriculture, forestry and fisheries fell to 20 percent in 1987-1989 andthen to 12.5 percent in 1996-1998. The real nature of net aid disbursed to agriculture in the late 1990swas 35 percent of its level in the late 1980s (IFAD, 2001). In financial year 2000, World Banklending for agriculture and rural development was its lowest ever in both percentage terms andabsolute amounts (World Bank, 2000).
Estimates of current annual investment in the water sector range from approximatelyUS$60-80 billion (DFID, 2000; Elz, 2000; World Bank, 2001). Of this amount approximately90 percent comes from domestic resources and the rest from international donor aid and multilateral

……Investment in land and water 55
funders, of which the World Bank is the principal source (DFID, 2000; World Bank 2001). TheWorld Commission on Water considers investment levels to be less than half of that needed (aboutUS$180 million per year) to meet minimum water, sanitation and nutrition requirements, mostly indeveloping countries, by 2025. On a global level there is a substantial shortfall, both for capitalinvestment and for the operation and maintenance (O&M) of existing infrastructure. The tendency isto allocate most money to new capital works with insufficient funding for operation, maintenance andsystem rehabilitation. Recent studies indicate that the amounts allocated for irrigation scheme O&Mare typically less than 50 percent of those required (DFID, 2000).
From 1950 to 1993, 7 percent of World Bank lending went to irrigation, more than any othersubsector (Jones, 1995), but fell to about 4 percent for the period 1990-1997 (DFID, 2000).
This decline in investment in agriculture and irrigation does not augur well for the anticipatedincrease in irrigated land between 1995/1997 and 2030.
Paradox
The decline in investment in new irrigation projects is leading to a paradoxical situation wherealthough meeting the increasing demand for food will require more irrigated land, the investmentsmay not be forthcoming. Given the long lead time between planning and implementing irrigationprojects, failure to reverse the downward trend in investments could soon lead to food shortages withdirect consequences for many developing countries and particularly for the poor.
One way of starting to resolve this paradox is to examine the reasons and relatedcircumstances for the reduced investments in irrigation and to put the factors involved intoperspective within the challenges facing the agricultural and food sectors in developing countries.
LAND IMPROVEMENT IN LESS-FAVOURED RAINFED AREAS
Agricultural development strategies emphasizing irrigated agriculture have increased food productionand stimulated economic growth. At the same time large areas of less-favoured rainfed lands sufferfrom neglect and lag behind in their economic development. These lands are characterised by lowagricultural potential, often because of poor soils, steep slopes, short growing seasons and lower anduncertain rainfall, but also because neglect has left them with limited infrastructure, weak institutionsand poor access to markets. As population densities grow with no matching increases in production,food insecurity and poverty worsen and widespread degradation of soil and water resources tends tooccur.
On development and environmental grounds alone, there will need to be a greater focus onless-favoured areas in setting priorities for policy and public investments. In some cases landexpansion can contribute to increased agricultural production. However, in many less-favoured areas,social and environmental crises are already common sometimes soliciting more investment in crisisrelief than in development from governments and donors. There is evidence that strategic investmentsin the economic development of less-favoured areas can be more cost effective than relief even in arelatively short period of time (Owens and Hoddinott, 1998). Increased public investment intechnology and infrastructure in less-favoured areas may yield higher marginal returns thancomparable additional investments in irrigated agriculture (Fan and Hazzell, 1997).
This does not mean that there should be less public investment in irrigated and high-potentialrainfed areas in developing countries. It signifies that there should be a better investment balancebetween irrigated and less-favoured areas because reclamation and/or further development of the latter

The benefits of investment in land and water…56
can benefit the large numbers of poor people living there. The amount of economically justifiablepublic investment in any locality should depend on the net social returns from productivity growth,poverty reduction and the containment of environmental degradation.
The investment needs of less-favouredrural areas often involve improving health andeducation, infrastructure and agriculturalproduction in different combinations and in anintegrated manner. Farming systems in less-favoured areas typically include mixed farmingand other practices that contribute to soil,nutrient and water conservation. Thus, whilesome types of commodity improvement arerelevant for less-favoured areas there isgrowing consensus that major productivityimprovements will have to come fromimproved natural resource managementpractices and technologies tailored to theecological, social and economic circumstancesof rural communities, e.g. conservation tillageand integrated watershed development.
Land improvement techniques
Conservation or minimum/zero tillage is apractice that replaces conventional ploughingwith adapted planting equipment andappropriate crop rotation. By protecting soilsfrom erosion, improving soil structure, raisingsoil fertility, increasing water retention oncropland and reducing land preparation costs,conservation tillage helps increase yields andprofitability.
Following its successful application inthe central and southern parts of Brazil (Box 2), parts of Paraguay adopted conservation tillage tocounter widespread soil degradation and erosion. As the result of an almost threefold increase in netfarm income and average rates of return on marginal investment in equipment of from 6 percent(medium farms) to 14 percent (large farms), conservation tillage spread to 250 000 ha (19 percent ofland cultivated mechanically) between the late 1970s and 1995/1996 (Sorrensen, 1997).
Various forms of land reclamation and development by means of manually and mechanicallyinduced soil and water conservation have also proved successful. For example, in low rainfall areas ofSenegal and Burkina Faso widely spaced small shallow basins, or furrow lines created with tractordrawn equipment captured sufficient runoff to establish islands or strips of tree and shrub species.This in turn led to more widespread improvement in soil physical characteristics and increased fodderproduction. Livestock carrying capacity improved and in some areas better soil moisture regimesnearly doubled the yields of millet and niébé (Dutraux and Keita, 1999). In another project in BurkinaFaso and Niger a combination of small stone bunds and hand-dug holes filled with manure helpedtreble millet and sorghum yields and restore about 100 000 ha. Food availability in participatinghouseholds rose by 20-40 percent. The average family using these technologies moved from an annualcereal deficit of 644 kg to a surplus of 153 kg (IFAD, 2001).
BOX 2Land improvement
in Santa Catarina state, Brazil
From 1991 to 1999 the World Bank provided aloan of US$33 million to Santa Catarina state toreverse ongoing land degradation and to increaseagricultural production, productivity and farmincomes for 81 000 mostly small-scale farmers in520 of its 1 700 microcatchments.
The main thrust of the project was to introduceand develop conservation tillage. Accompanyingelements were: the upgrading of extension andtraining adaptive research, control of erosionrunoff from rural roads and an incentiveprogramme to encourage the adoption ofconservation practices.
Production of the main crops – maize, wheatand soybeans – increased by an estimated 20 to35 percent. Farmers adopted improved landmanagement practices including conservationtillage on some 400 000 ha in 434 assistedmicrocatchments. The project reached about35 percent of the state’s farmers and reduced soilloss by 10 to 50 percent. Runoff water in streamscontained fewer suspended solids, coliformbacteria and pesticide residues thus reducingsilting and water treatment costs and lowering theincidence of water-borne diseases and pesticidepoisoning.
The project’s estimated rate of return atappraisal was 20 percent.

……Investment in land and water 57
INTEGRATED WATERSHED DEVELOPMENT
Because of the interrelationships between ecological, social and economic factors that cause soil andwater degradation and because of the need to include these factors when reclaiming and improvingland and water, integrated watershed development has become the preferred approach for developingrainfed areas in many countries. In general such projects have two major objectives:
• conservation – to slow and reverse the degradation of the natural environment in project areasthrough the development and use of appropriate soil and moisture conservation measures;
• development – to promote systems for the production of food, fodder, forest and livestockproducts that improve beneficiaries’ incomes and well-being on a sustainable basis.
Typically, the largest component of such projects comprises physical investments in soil andwater conservation technologies and practices, which provide the basis for improved agriculturalproductivity. The second largest element is to establish and/or strengthen institutional arrangementsand the human skills needed to ensure the implementation and sustainability of projects. Watershedsor subwatersheds have proved to be practical units for the implementation of this type of project. Suchprojects usually achieve their conservation and production objectives. The key aspect is theinstitutional and financial sustainability of these and future investments. Experience points to anumber of basic determinants for success in this regard. These include: the importance of ownershipof the project by beneficiaries; the need for beneficiaries to realize some short-term benefits fromproject interventions; the need to provide integrated support services; and the importance ofmonitoring and feedback mechanisms to periodically evaluate progress and make any necessarycorrections.
Three World Bank-funded integrated watershed development projects (representing someUS$133 million in loans) implemented in India and Indonesia during the 1980s yielded economicrates of return at completion of 17, 14 and 13 percent respectively. These conservative calculationsconsider only quantifiable benefits such as increased crop yields and do not include non-quantifiedbenefits such as reduced erosion, siltation and pollution.
This indicates that agricultural intensification mainly through land and water developmentshould be a key component of development strategies in less-favoured rainfed areas in certaincountries. Such investments can yield acceptable economic rates of return with direct benefits forparticipants. Where the evaluation takes their social and environmental impacts fully into accounttheir returns may exceed those of other agricultural investments. Nevertheless, because the shortage ofwater limits the production potential of most less-favoured areas, their contribution to overall foodgrain production and food security in most countries will remain relatively modest. High-potentialareas with irrigation will continue to be the breadbaskets for most developing countries.

The benefits of investment in land and water…58
IMPACTS AND BENEFITS OF INVESTMENT IN LAND AND WATER
Investment in developing land and water resource offers long-term benefits that may eludequantification by conventional analysis. Beyond a project’s immediate rate of return, developingcountries need to consider the wider benefits in terms of increased domestic production, enhancedfood security, reduced market fluctuations, and foreign exchange savings. Moreover, suchinvestments involve many interrelated factors with a range of potential direct and indirect effects.Although it may not be possible to legislate for successful investment, countries can pursue policiesthat are conducive to creating the conditions for greater market efficiency and higher farm-gate prices.
As the preceding chapter provides an indication of the returns and long-term benefits frominvesting in land development projects, the following sections concentrate on the impacts and benefitsof investment in irrigation.
Returns on investment
Returns on investment in irrigation are comparable to alternative investments (Carruthers, 1996). Themost comprehensive evaluation of irrigation project performance is the World Bank study of 208World Bank funded irrigation projects implemented and evaluated between 1950 and 1993. It alsoexamined a further 614 projects with irrigation components, more than 100 irrigation projects atvarious stages of implementation and non-World Bank studies that enriched the exercise. World Banklending for irrigation during the period was US$31 billion (Jones, 1995).
Of 192 projects subjected to both appraisal and evaluation, 67 percent rated satisfactory andtheir average estimated economic internal rate of return (IRR) at evaluation was 15 percent. Afterallowing for inflation, this level of return is impressive especially as most projects require large initialinvestments and have a long gestation period before net benefits materialize. The comparablesatisfactory rates for agriculture as a whole and the all-project average are 65 and 76 percentrespectively. The IRR for agriculture as a whole is 13 percent and the all-project average is16 percent. Weighting irrigation projects by size of area served raises their average IRR to 25 percentwith 84 percent of the projects rating satisfactory.
These overall ratings are surprisingly good as typical irrigation projects are extremelycomplex. They involve engineering, agronomic, sociological and organizational changes that renderimplementation and sustainability difficult. A positive element is that irrigation projects havequantifiable objectives which facilitate establishing their degree of success or failure by measuringthem against no-project situations. In addition, the projects achieved their average evaluation IRR of15 percent in an era when overvalued exchange rates and a variety of indirect taxes or subsidies tocompeting urban interests penalized agriculture (Carruthers, 1996).
Implementation Completion Reports on 11 World Bank financed irrigation projects in Asiaand Latin America (mainly in the 1990s) for a total loan amount of approximately US$1.973 billionhad an average economic rate of return at completion of 17 percent.
A strong indication that irrigation pays is the amount of private investment it attracts. Privateinvestment provides all the financing for about 20 percent of the total area currently irrigated (about264 million ha in 1995/97). The share of private investment in the remaining 80 percent isapproximately half of the total investment. Furthermore, there is an estimated additional 70 million haof land under informal private irrigation that falls outside government control.
This information indicates that it would not be rational to avoid investing in irrigation projectson the grounds of low investment returns.

……Investment in land and water 59
ENVIRONMENTAL AND SOCIAL IMPACTS
Irrigation often has negative environmental impacts such as waterlogging and associated salinizationof soils due to overirrigation and inadequate drainage. Overextraction of groundwater is alsowidespread in many developing countries. In some areas, particularly in the Near East/North Africa,irrigation draws on fossil aquifers that receive little or no recharge and is therefore not sustainable.The environmental and economic consequences of such practices are serious and will grow worse inthe absence of appropriate responses (FAO, 2000a).
Because of its role in agricultural intensification, irrigation contributes to the pollution ofsurface and groundwater with nitrates, phosphates and ammonium compounds. The latter can causeexcessive algal growth, proliferation of aquatic weeds and eutrophication in irrigation canals anddownstream waterways thereby damaging fragile ecosystems. Irrigation can contribute to theincreased incidence of water-borne and water-related diseases, and to problems associated with theresettlement of displaced people.
However, irrigation also has very important and pervasive positive environmental impacts.For example, the high population absorptive capacity of irrigation limits the migration of growingpopulations to areas of greater environmental risk. If additional water for irrigation (17 percent by2025) is not forthcoming, the increased burden on rainfed agriculture to meet demand will beenormous and detrimental to the environment, with far more land clearance than is currently the case(Elz, 2000).
Furthermore, there are technical, economic and social solutions for most of the negativeeffects of irrigation (Carruthers, 1996; FAO, 2000a). For example, there is major potential for meetingfuture agricultural and overall water needs by raising water use efficiency, thereby reducingenvironmental damage in many cases. It is possible to repair much of the damage already done andavoid similar problems in the future. Many of these solutions are likely to require a managementrather than an investment approach.
Irrigation is a factor in global environmental issues such as climate change as irrigated riceproduction contributes about 20 percent of global methane emissions. This is causing increasingconcern as methane is 20 times more powerful than carbon dioxide and atmospheric levels are risingfast. However, even with a projected expansion in the area under rice of about 6.5 percent by 2030,methane emissions could decrease as farmers grow more low-methane rice under controlled irrigationwith better nutrient management (FAO, 2000a).
In addition, the potential exists to transform cultivated land from a net source to a major netsink of carbon. Any practice which improves plant cover and yields such as irrigation contributes tothis process.
The fact that irrigation is facing a number of challenges is not a reason for withdrawing fromit but rather a reason for engaging in a search for solutions (Carruthers, 1996).
Scheme size
Little has damaged the image of irrigation as much as the negative impacts (land inundation,population displacement and ecological disruption) of large irrigation schemes, especially those withlarge dams. However, any balanced assessment should also include their positive effects (Seckler,1998). Moreover, much irrigation does not involve large dams, whose prime function tends to bemore for electricity generation and flood control rather than for irrigation.

The benefits of investment in land and water…60
In many developing countries large-scaleirrigation schemes remain essential for foodproduction, employment generation anddevelopment (Elz, 2000; Gleick, 2000; IFAD,2001; Seckler et al., 1998). The WorldCommission on Dams is evaluating dam projectsusing an objective approach to incorporate moreaccurate estimates of their true costs and benefits(Gleick, 2000; IFAD, 2001).
The evaluation of World Bank financedirrigation projects shows a strong correlationbetween project size and satisfactory performance:the larger the command area, the higher the likelyeconomic returns. This is true for surface andgroundwater projects and applies to all regions.The economies of scale stem from engineering and management efficiencies (Jones, 1995).
However, small-scale schemes do have definite advantages under particular circumstances.Because of their limited more cohesive membership and simple institutional arrangements, suchmember-controlled schemes generally enjoy more efficient and flexible distribution and maintenanceregimes. However, their limitations often include: no outside agency to bear risk; lack of financial orborrowing capacity; uneconomic irrigation design and management. Another problem is thatnegotiations with other upstream and downstream users to maintain equity of water use withinwatersheds or aquifers can be difficult (IFAD, 2001).
Water use efficiency
Irrigation accounts for 80 percent of freshwater withdrawals in developing countries. One way forsuch countries to expand their irrigation is by improving water use efficiency.
While the concept of efficient water use is complex (Box 3) and difficult to achieve inpractice, improving the efficiency of irrigation water use can contribute significantly to meetinggrowing demands. Seckler (1998) estimates that the amount of water saved by achieving an irrigationeffectiveness of 70 percent in total gross irrigated area by 2025 could meet about one-half of theincreased demand for additional water supplies in the 1990-2025 period. However, the conceptual andpractical challenges to achieving such efficient water use are equally large because water has multipleusers, uses and externalities. Better irrigation scheme organization and management and therehabilitation and upgrading of existing schemes are generating real gains.
FAO (2000a) estimates the irrigation efficiency of a group of 93 developing countries torange from 26 percent in areas of abundant water (Latin America) to 50 percent in the NearEast/North Africa region where water use calls for higher efficiencies. The forecast is for irrigationefficiency for these countries as a group to rise from 43 percent in 1995/7 to 50 percent by 2030.
Notwithstanding wide variations between regions and countries in the group, waterwithdrawal for irrigation accounted for about 7 percent of total water resources in 1995/1997. Theforecast is for water withdrawal to grow by 12 percent by 2030. Thus, there is sufficient water forfuture irrigation and other needs in these countries. Nevertheless, in most countries where irrigatedagriculture is already important, water for expansion will have to come mainly from efficiencysavings on existing schemes. Given the need to boost agricultural productivity and growth in thesecountries, the importance of investing in water saving technologies and practices is clear.
Box 3Efficiency of water use
The concept of efficient water use in irrigationincludes the conveyance efficiency, fieldefficiency, water use efficiency and economicefficiency of water (water productivity)amongst others. There is a tendency toconsider water use and allocation in a holisticmanner because of the highly integratednature of water use systems involvingdifferent users. This entails establishing thewater balance of river basins. This mayrequire analyzing systems’ efficiency atdifferent levels. Thus, measuring water useefficiency can be complex and the highdegree of external effects may make it moredifficult.

……Investment in land and water 61
Rehabilitation and upgrading
Given the need to use irrigation water more efficiently on existing schemes, it follows that the bulk ofnew investment should focus on rehabilitation and upgrading rather than on new schemes. Indeed, it isnow often difficult to distinguish between new development and the extension of existing schemes.Projects are usually a combination of the above aspects. This is of little consequence providing thatinvestments are economically viable and enhance scheme functioning and sustainability. However, itis important to avoid misconstruing rehabilitation for deferred maintenance without correcting theproblems causing unsustainable maintenance in the first place. If not, this could lead to repetitivefunding of maintenance from external sources.
In order to maximize returns, scheme improvement should incorporate lessons from previousirrigation developments and not simply rehabilitate projects to old standards. Improving performanceincludes repairing and modifying structures and enhancing scheme management and associatedinstitutional arrangements.
Good planning and implementation are prerequisites for high investment returns. This isparticularly relevant for complex, multi-dimensional irrigation schemes usually involving a number ofinterested parties. It is counterproductive to skimp on resources needed for the preparation, appraisaland implementation of such projects. Unforeseen problems that arise during implementation should beresolved promptly even at the expense of extending implementation. Confirmation comes from theevaluation of World Bank irrigation projects which showed that variations in implementation time(whether overall time or delay) had no effect on economic returns (Jones, 1995).
The emphasis on rehabilitation and upgrading can contribute to improving returns on newinvestments in irrigation in a number of ways. First, efficiency gains do not only make water availablefor new irrigation. By reducing overirrigation, they also attenuate the principal causes of landdegradation on irrigation schemes, such as waterlogging and salinization. This is important aswaterlogging and salinization significantly reduce irrigation performance in some countries. Second,because a considerable part of the extensive investments in irrigation during past decades are nowregarded as sunk costs, incremental investment in improving scheme performance will yield high ratesof return. Confirmation of this comes from the competitive economic rates of return obtained withirrigation projects that include a substantial portion of rehabilitation. Third, increased productivity andgrowth resulting from improving schemes will reduce the urgency to develop new irrigation to meetgrowing food needs. This will provide more time to thoroughly appraise and plan new irrigationdevelopment that will become economically less attractive if development costs increase and theprices of agricultural commodities stagnate or decrease. It will also allow more time to incorporatelessons from existing projects into new development.
Another advantage of rehabilitation is that project unit costs are usually low, a fact whichincreases the likelihood of economic viability (Jones, 1995).
The need to fund rehabilitation from external sources reflects low economic returns from firstgeneration projects. At the same time the large volumes of sunk costs in these schemes offers theopportunity to place them on a sound economic, social and environmental footing while assuring ratesof return comparable to other investments.Operation and management

The benefits of investment in land and water…62
Inadequate operation and management of irrigation schemes is often a major cause of poor projectperformance and weak sustainability. Many governments have found it increasingly difficult tofinance the costs of irrigation operation and management as well as being effective providers of waterservices to large numbers of small farmers. These factors have led to infrastructure deterioration,shrinkage of area irrigated, maldistribution andwastage of water, and advancing waterloggingand salinity.
Many governments are attempting totransfer management responsibility for irrigationsystems from government agencies to farmersorganized into water users associations (WUAS)(IWMI, 2000). Consensus is emerging thatoperation and management problems, schememaintenance, irrigators’ ownership of theirsystems and cost recovery are interrelated.Evidence is accumulating that comprehensive yetpragmatic approaches that include the aboveaspects can overcome organization andmanagement problems.
The keys to these unusually complex,interrelated problems reside in the principles offinancial autonomy and irrigator participation inorganization and management by means of viableWUAs. The most promising route to improvementlies in making irrigators responsible for their ownorganization and management and in providingthem with the requisite technical supportparticularly regarding group formation and theskills needed for effective scheme management.There is a considerable amount of experienceabout the circumstances that encourage irrigatorsto create effective and durable groups (Ostrom,1994, 1996). One clear lesson seems to be theimportance of recognizing that group membershave to bear costs as well as receive benefits.
One of the prerequisites of such anapproach is government willingness to devolve.Global experience suggests that irrigationmanagement transfer on a large scale has beenmost successful where: the irrigation system iscentral to a dynamic, wealth-creating agriculture;the average farm size is large enough for a typicalor a significant proportion of the command areafarmers to operate like agribusinessmen;backward linkages with input supply systems and forward linkages with output marketing systems arestrong and well-developed; and the costs of self-managed irrigation are an insignificant part of thegross value farming output (IWMI, 2000). Mexico provides a successful example of irrigationmanagement transfer (Box 4).
BOX 4Reform and irrigation management
transfer in Mexico
Following a sharp decline both in publicinvestment in irrigation and also in farmers’contributions to organization and managementcosts, and with irrigated crop production falling0.4 percent per year, the Government of Mexicotook decisive action. It opted to transformirrigation from an engineering driven, centrallymanaged and government funded sector to amore decentralized system based on transparentinvestment selection criteria and greaterparticipation of beneficiaries in decision makingand cost recovery. Moreover, it reducedagricultural price support to market related levels.
The outcome has been that water users haveincreased their funding of organization andmanagement from 20 to 90 percent, organizationand management costs have fallen about40 percent, and water use efficiency andproductivity is improving by about 3 percent peryear. Government financial contributions toorganization and management have almostdisappeared. Due to increased water-feecollection and improved management,rehabilitation, deferred maintenance andupgrading are ahead of schedule. Water tableproblems, salinity and other unfavourableenvironmental effects are diminishing. Landvalues in rehabilitated saline areas haveincreased fourfold. Because of improvements inproduction efficiency and productivity and theelimination of price guarantees, the value ofagricultural production is growing at 4.8 percentper year. Rising agricultural exports have had afavourable impact on terms of trade.
The estimated overall economic rate of return forthe project at completion is 31.5 percent over 20years.
Two important determinants of success for theproject have been strong political support for theprocess and appropriate accompanyingmacroeconomic and agricultural policy reforms.

……Investment in land and water 63
An important principle underlying the privatization of irrigation schemes is using water as aneconomic good. While water is an economic good in most cases, Perry et al. (1997) ask "whether it isa purely private good that can reasonably be left to free market forces, or a public good that requiressome amount of extra-market management to effectively and efficiently serve social objectives”. Theanswer to this lies in value judgements and their application to different conditions of time and place.While privatizing water in the sense of giving farmers and markets a greater role in both financing andmanagement of irrigation may be promising, it is also necessary to satisfy basic needs criteria beforeoptimizing economic returns in terms of consumers’ sovereignty. Perry proposes sequentialpreconditions for the beneficial introduction of market forces in water allocation and use.
Privatization of minor irrigation in Bangladesh illustrates how policy liberalizationaccompanied by technical support canpromote increased smallholder investment inirrigation and thereby boost agriculturalproduction, farm incomes and employment(Box 5).
Gradual, selective privatization oforganization and management and otheraspects of irrigation shows considerablepromise as a way of improving schemeviability and sustainability. Investment inprivatization measures have producedencouraging results.
CONCLUSIONS
In the coming decades irrigation will becomeincreasingly important as it will enableintensification to generate 80 percent ofoverall growth in crop production and70 percent in cereal production. Whileimportant, rainfed agriculture lacks potentialto replace irrigated agriculture in anysignificant way. Thus, irrigation is vital todeveloping countries’ attempts to achievefood security and meet other growing needsand, as a whole, they do have sufficient landand water for its anticipated expansion.
Through its impact on agriculturalproductivity, irrigation has be neficial effectson rural incomes, rural employment, foodsecurity, poverty alleviation and overallgrowth and development. Moreover, it hashad a significant effect in keep foodaffordable to the poor. Without moreirrigation many countries will not attain theagricultural and overall economic growthrates required to achieve food security andreduce poverty. Irrigation also has positive
BOX 5Enhanced agricultural growth throughincreased private sector investment in
minor irrigation in Bangladesh
Implemented between 1991 and 1997, this projectachieved its primary objective of faster growth inagriculture through increased private sectorinvestment in minor irrigation by eliminatingregulations, subsidies and other advantages whichfavoured public sector provision of minor irrigationbased on deep tubewells and pumped surface waterirrigation.
The project facilitated the provision of equipmentby agents and provided technical assistance fortraining and for strengthening support institutions. Italso provided assistance for a range of projectsupport services including: planning andimplementation of minor irrigation, formation ofWUAs, selection of equipment, assessment ofirrigation growth, hydrological exploration, and trialsfor irrigation technologies and rehabilitation methods.
In the six-year period, the number of shallowtubewells (STW) and the STW irrigation areaincreased at annual rates of 32 and 16 percentrespectively. Liberalization of the sector led to: anincrease in the number of equipment suppliers andequipment servicing facilities (rural workshops); areduction in engine and other equipment prices; andan increase in the number of farmers owningtubewells. The latter included a growing number ofsmall farmers who gained access to irrigationbenefits, thereby positively influencing the equityimpact of the project. Annual farm income rose by 25and 53 percent for STWs and deep tubewellsrespectively. The project’s estimated economic rateof return at completion was 16 percent.
The project successfully supported government inmaking important policy changes to liberalize theminor irrigation sector that promoted rapiddevelopment in minor irrigation and in servicescatering to this technology. The overall evaluationwas that the project had significant positive effectson the economy of Bangladesh.

The benefits of investment in land and water…64
distributional effects because it mainly targets smallholders living in poor rural areas.
The financial returns on investments in irrigation are generally comparable to alternativeinvestments. Indeed, most analyses may understate their true returns by failing to consider all thepositive indirect social and environmental effects of irrigation. Future investments in irrigation will bemainly for rehabilitation and upgrading and will earn higher rates of return by benefiting from thelarge amount of sunk costs in existing schemes. Viewed differently, a failure to maintain and improveexisting schemes would result in the loss of the benefits of the investment already made in irrigation.The large amount of private investment that irrigation attracts worldwide indicates that it does yieldworthwhile returns.
Technical, economic, social and environmental solutions now exist to rectify and preventmost of the problems associated with irrigation. By adhering to sound guidelines, irrigation projectscan be an environmental asset. Thus, it would be a mistake to allow a perceived negative image toconstrain investment in irrigation.
Improvements in the current low level of water use efficiency in irrigation will release largevolumes for expansion, and for use by other sectors. There has been considerable progress in usingtechnological, operational and managerial methods to improve efficiency levels. The underlyingprinciples at work are those of irrigator participation, financial autonomy, partial and progressiveprivatization and corresponding government withdrawal. Their practical application will enhance theviability of future investments in both existing schemes and in developing new ones.
In addition to investment in irrigation, there is also a need for more investment to reclaim,conserve and further develop the productivity of land and rainfed agriculture in less-favoured areas.Techniques such as conservation tillage and integrated watershed development have demonstratedthat investment in these areas can yield acceptable returns while achieving the twin goals ofproductivity growth and poverty alleviation. Marginal returns to such investment in less-favouredareas can exceed those in irrigation. A proper balance between the two will help to develop thepotential of less-favoured areas and satisfy the needs of the people living there.
Investing in a land or water development project is not just an investment in one item, itentails investing in a whole range of elements such as farming practices, plant varieties and nutrients,human resources, the broader infrastructure and conducive policies.
The international community is committed to development goals with pressing humanitarianimplications. However, in order to enable the vital elements of land and water to make their fullcontribution to achieving these goals, it is necessary to increase their productivity. This will nothappen without increased investment in land and water development.

……Investment in land and water 65
BIBLIOGRAPHY
Barker, R. & Van Hoppen, B. 1999. Water scarcity and poverty. IWMI Water Brief 3. Colombo, InternationalWater Management Institute.
Carruthers, I. 1996. Economics of irrigation. In Pereira et al. (eds.) Sustainability of irrigated agriculture.
Chaturvedi, M.C. 2000. Water for food and rural development: developing countries. Water International,25(1). International Water Resources Association.
Datt, G. 1998. Poverty in India and Indian states: an update. FCND Discussion Paper No. 47. Washington, DC,International Food Policy Research Institute
Dutraux, M. & Keita, M.N. 1999. Etude d’impact du travail des charrues “Delfino” et “Treno” sur larecuperation des terres fortement degradees. Accra, FAO.
DFID. 2000. Addressing the water crisis: healthier and more productive lives for poor people. Consultationdocument. London, DFID.
Elz, D. 2000. Is the world running out of water? Quarterly Journal of International Agriculture, 39, No.2.Frankfurt/M, Germany, DLG-Verlag.
Fan, S. & Hazzell, P. 1997. Should India invest more in less-favoured areas? EPTD Discussion Paper No.25.Washington, DC, International Food Policy Research Institute.
FAO. 1993. The state of food and agriculture. Rome.
FAO. 2000a. Agriculture: towards 2015/30. Technical Interim Report. Rome.
FAO. 2000b. The state of food and agriculture. Rome.
Gleick, P.H. 2000. The changing water paradigm: a look at twenty-first century water resources development.Water International, 25(1), International Water Resources Association.
Hazzell, P. & Haggeblade, S. 1993. Rural-urban growth linkages in India. Indian Journal of AgriculturalEconomics, 46(4).
IFAD. 2001. Rural poverty report 2001: the challenge of ending rural poverty. Rome, International Fund forAgricultural Development.
IWMI. 2000. Can poor farmers in South Africa shoulder the burden of irrigation management? IWMI News.Colombo, International Water Management Institute.
Jones, W.I. 1995. The World Bank and irrigation. Washington, DC, World Bank.
Mellor, J.W. 2000. Agricultural growth, rural employment and poverty reduction: non-tradables, publicexpenditure and balanced growth. Paper prepared for the World Bank Rural Week 2000, Poverty orprosperity: rural people in a globalized economy.
Ostrom, E. 1992. Crafting institutions for self-governing irrigation systems. San Francisco, US Institute forContemporary Press.
Owens, T. & Hoddinott, J. 1998. Investing in development or investing in relief: quantifying the poverty trade-offs using Zimbabwe household panel data. Washington, DC, International Food Policy Research Institute.
Perry, C.J., Rock, M. & Seckler, D. 1997. Water as an economic good: a solution or a problem? ResearchReport 14. Colombo, International Irrigation Management Institute.
Rosegrant, M. & Hazzell, P. 1999. Transforming the rural Asian economy: the unfinished revolution. HongKong, Oxford University Press for the Asian Development Bank.
Seckler, D. 1999. Revisiting the “IWMI Paradigm”: increasing the efficiency and productivity of water use.IWMI Water Brief 2. Colombo, International Water Management Institute.
Seckler, D., Amarasinghe, U., Molden, D., De Silva, R. & Barker, R. 1998. World water demand and supply,1990 to 2025: scenarios and issues. Colombo, International Water Management Institute.

The benefits of investment in land and water…66
Sorrensen, J.W. 1997. Financial and economic implications of no-tillage and crop rotations compared toconventional cropping systems. Rome, Investment Centre Division, FAO.
World Bank. 2000. Reaching the rural poor: framework for a revised World Bank rural development strategy.Washington, DC.
World Bank. 2001. The World Bank and water. Water Issue Brief. Washington, DC.
Yudelman, M. 1994. Demand and supply of foodstuffs up to 2050 with special reference to irrigation.International Irrigation

…Investment in land and water 67
Agricultural investment strategies:prioritizing land and water
INTRODUCTION
This paper uses FAO and related studies to bring out the critical role of land and waterinvestments in any broad based growth strategy for the developing countries of Asia and the Pacificregion. Land and water investments are under field conditions, integrated with each other. As landreserves are used up, water investments and policies become the key to overcoming the landconstraint and sourcing agricultural growth for food security and development. This is particularly soin the post-WTO scenario. Improved and more timely water supplies in the field are also associatedwith the introduction and spread of the new technologies, at the initial phase of even bio-technologyvarieties.
The water sector was neglected in the last decade of the last century, despite FAO’s studiedinterventions to the contrary. More recently, the link between sustainable rural growth and a multi-pronged land and water development strategy under alternative agro-climatic regimes in Asia and thePacific region has been established in a fairly systematic manner. Successful newer paradigms ofdevelopment include multi-financing sources, taking account of private, community and borrowedresources and newer forms of organizations, including private, cooperative, NGO-led and communityorganizations and 'mixed' forms. Research, however, shows the need for the state to play a majorstrategic and enabling role, setting up new institutional organizations, establishing financial andorganizational rules and creating a framework for resolving problems that inevitably arise withinnovative solutions. We illustrate some of these issues with data and carefully selected examples andbest practice case studies.
STRATEGIC ROLE OF LAND AND WATER INVESTMENT
FAO moved from irrigation as an agricultural input to a perception of the synergistic role of water inthe process of agricultural growth as early as the late-1970s in Agriculture Towards 2000: "Thepervasiveness of such influences is suggested by a comparison of targets for 1975 proposed in the1969 FAO Indicative World Plan for Agricultural Development (IWP) with actual experience up to1976. While actual production growth in most developing regions was below proposed growth rates,most identified inputs ... actually exceeded growth rates proposed for them".
For example, the targeted annual growth rate for agriculture in Asia and the Pacific was 3.7percent, but the achieved rate was 2.6 percent. However, arable land grew at 0.6 percent annually,________________________________________________________________________________
Yoginder K. Alagh, Former Minister of Power, Science and Technology…and Planning, India …
________________________________________________________________________________

Agricultural investment strategies: prioritizing land and water…68
twice the target rate and irrigated land at 2.2 percent while the target was 1.8 percent. Since thenpolicy and planning exercises have been more holistic with simultaneous development of land andwater. Thus the planning methodologies of Agriculture Towards 2000 considered the developmentsequence of moving land from a soil and water regime to an alternate one. There were five land andwater classes of numerical models, from bad soils with low and variable water availability to goodirrigated lands. This more synergistic view was developed from FAO field experience in preparingagro-climatic regimes for appropriate cropping and farming systems. Agriculture Towards 2010carried this process to a logical conclusion with sustainable development of land and water resourcesproviding the basis of farming systems (Alexandratos, 1995).
These integrated views had an impact on policy recommendations and target systems. In somecountries the role of irrigation in releasing the land constraint was clearly seen. One planning exercisefor Asia stated that: (i) harvested area could be estimated directly as a function of past irrigated area,giving a direct estimate of elasticity of harvested area to harvested irrigated area; (ii) croppingintensity could be estimated as a relation of arable irrigated area; and that (iii) cropping intensitycould be separately estimated for irrigated and non-irrigated areas and time trends analyzed andprojected.
These categories are approximate and water is now treated in a more sophisticated frameworkwhich connects scarce resources with sustainable food and water security. Water flows do not followadministrative or political boundaries; geophysical and not political and administrative featuresconfine aquifers. Climate also determines the demand for water, including evaporation. Seasonalrainfall cycles can be very different across countries. For structural understanding and policy analysis,water is now seen as central to a sustainability agenda.
Water availability is now more accurately estimated in structural analysis and advancedproject design for aquifer management, drainage and conjunctive use projects, e.g. the Mike Shemodel for Australia's Murray Darling Basin Plan used by the New South Wales Department of Landand Water Conservation. As discussed by Millington (1996) it is used for integrated catchmentmodelling and its main features can represent major flow features and describe dynamic interactionbetween surface and subsurface water systems. A simple multi level flow chart model is shown inFigure 1.
Figure 1
Water --------------------- Population; needs, irrigation, trees, etc Development \
\ \ \ \ \ \ \ \
\ Wells Drilled \ \Climate Regime --- Water Table \
Depth ----------------------- Deep Aquifer Water Quantity \ / \ / \ / Groundwater Quantity
Source: Nicholas Sonntag (1996)
A more detailed version with added water resources made available by more precise basinassessment is seen in the Mahi Narmada Doab model developed by Alagh and Buch with initial heads

…Investment in land and water 69
in 1980, calibrated heads for 1990 and forecasts for 2000 under alternative use assumptions. Themodel reflects forest cover, surface irrigation and pumps drilled (Fisher, 1995).
Integrating surface flows with local small storage projects is now more accurate. A 14 percentrise was reported in estimated water availability – not trivial in the context of water scarcity – in theShedhi branch of the Mahi system, initially planned with no tanks (Table 1)
TABLE 1Tank storage in the Shedhi system
Year Number of tanksdeepened (progressive)
New capacity created(million m3)
Range of deepening(m)
1993/1994 150 3.5
(6.0 to 9.9)
1 to 6
June 254 6.0
(7.9 to 13.9)
0.25 to 9.3
Source: Alagh (2000)
Microstudy approaches to water resources availability assessment reflect complex sourcescompared to earlier assessments based on empirical formulas, preliminary projections and simpleguesses. International programmes address such limitations, but there is a more basic problem. Thesynergy of water as a sustainable holistic resource can only be captured with integrated methodology,e.g. simultaneous use of tanks and surface conveyance strategies. More precise assessments can be ofcritical importance.
TABLE 2Irrigated area: share and growth, 1967 to 1995 (growth rates on 3-year moving averages)
Country Share of Agricultural Growth of Irrigated AreaArea Irrigated % % annual
1970 1995 1967/1982 1982/1995
Bangladesh 11.63 37.56 4.95 5.39China 37.18 37.02 1.59 0.79India 18.44 31.82 2.64 2.42Indonesia 15.00 15.18 0.65 0.49Korea Republic 51.52 60.76 0.73 -0.65Malaysia 5.91 4.47 2.34 0.22Myanmar 8.04 15.38 1.87 3.37Nepal 5.91 29.82 12.55 2.67Pakistan 66.99 79.63 1.39 0.89Philippines 11.88 16.60 3.80 1.33Sri Lanka 24.55 29.16 1.91 0.21Thailand 14.19 22.70 4.23 2.78Viet Nam 15.95 29.60 3.71 1.29Total 25.17 33.24 2.05 1.56
SOURCE: FAOSTAT

Agricultural investment strategies: prioritizing land and water…70
Conceptually, water availability measurement is in the context of physical systems in theecological domain. This is a strong argument for integrating such work with the FAO tradition ofcooperative work with UNESCO on agro-economic zoning, including soil and land categories: drysemi-arid, moist semi-arid, subhumid and fluvisols/gleysols and marginal variations of these, plusirrigated desert (FAO, 1978/81; FAO, 1982; FAO, 1993).
Agro-economic zoning of soil/land type, water and climate by category is of centralimportance. Climate here means weather, i.e. temperature and rainfall levels and variations, whilewater is both surface and ground. The concept is well described in Sadasyuk and Sengupta (1968)who divided India into 18 agro-climatic zones and 44 subregions. Similar exercises have beendeveloped in other large countries such as Indonesia (Nasution, 1993).
SLACKENING INVESTMENT AND STRATEGIC RESPONSES
That real investment in land and water has not progressed as suggested by the FAO Global Models,Policy Studies and Global Conferences is well known. Moreover, there is evidence that efforts andinvestment have fallen since the 1980s compared to earlier periods. Table 2 shows that from 1982 to1995 growth of irrigated area was 1.56 percent annually in 13 Asian countries, compared to 2.05percent annually from 1967 to 1982. Irrigation growth declined in 11 of 13 countries, the onlyexceptions being Bangladesh and Myanmar.
Countries where irrigation growth declined by 50 percent or more from 1982 to 1995compared to 1967 to 1982 were China, Republic of Korea, Malaysia, Nepal, Philippines, Sri Lankaand Viet Nam. Given the primal role of water in a synergistic policy of widespread rural growth, thesedevelopments are of concern.
TABLE 3Poverty removal and malnutrition amelioration based on water development Asia 2020
Per capita food availability (kcal/day) Ruralpoverty
(millions)
Eliminating malnutrition(malnourished children,
0-5 years, millions)
1970 1993 2010 2020 1970 1993 2010
REGION
A B C D E
India 2 083 2 397 2 559 2 764 3 201 213 250 76 59 31
South Asia 2 184 2 370 2 510 2 719 3 201 72 64 100 83 41
China 2 019 2 680 2 913 2 913 3 535 364 266 24 17 0.4
Southeast Asia 1 945 2 525 2 626 2 626 3 193 74 90 16 13 4
Developing Asia 2 045 2 525 2 646 2 646 3 275 722 669 140 113 45NOTE: A = Low Investment: Weak Reform; B = High Investment: Strong Reform; C = Eliminating Malnutrition;D = Baseline; E = Elimination.Source: ADB, 2000 based on IFPRI data.
The need to reverse these trends is obvious. Practical steps to emphasize the need for land andwater investment are necessary, such as educational campaigns with content as indicated above. Thesewould rely on the synergy and sustainability of land and water investments. NGOs, farmers' groups,agricultural universities, schools and the media could be involved in a long term process.

…Investment in land and water 71
As many people are more impressed by disaster predictions than by basic education aneffective strategy might emphasize crisis aspects of neglect scenarios relative to water and foodsecurity as 'New Millennium' variants of earlier FAO Self-Sufficiency Ratio (SSR) indicators.
A useful way to respond to the neglect of policy and investment in land and waterdevelopment is to press for an understanding of scenarios of widespread sustainable growth, foodsecurity and water security using available rural development scenarios. Agriculture Towards 2010projections need not be repeated. Recently the Asian Development Bank (ADB) used InternationalFood Policy Institute (IFPRI) studies to project such scenarios. Table 3 reflects the critical role of landand water development policies on eliminating poverty and malnutrition.
Rural poverty is very high in Asia and the Pacific region (669 million in the 1990s), with 266million poor in China and 250 million poor in India, according to IFPRI studies used by ADB.IFPRI’s global IMPACT model projects a 'business as usual' scenario of 'low investment-weak reform'and a preferred scenario of 'high investment-strong reforms'. Water investments and policies arecentral differences in the two scenarios: Scenario A 'low investment-weak reform', 0 percent watergrowth and 10 percent drop in usage compared to Scenario B: 'high investment-strong reform', 5percent water growth and 10 percent increased usage.
Box 1
Projections for 2020POPULATION 1 330 million
URBAN POPULATION Low: 465 million; High: 590 million
SLUM POPULATION Low: 85 million; High: 130 million
SOLID WASTE DISPOSAL 100 to 110 million tonnes
COAL DEMAND FOR POWER GENERATION Low: 817 million tonnes;
High: 2 016 million tonnes
CROPPING INTENSITY More than 1.5
NET AREA SOWN Constant at 141 million ha since the 1990s
IRRIGATION INTENSITY Around 1.75
WATER SHORTAGE 10% to 25% between 2020/2050
NOISE LEVELS Twice the norms in trend forecast
AIR POLLUTION Two to 2.5 times norm in trend forecast
Source: Alagh, 2000d.
Table 3 shows the importance of the growth of irrigation and improved water use on povertyand malnutrition amelioration. By 2010, if land and water scarcity and degradation are avoided bybetter policies, river basin management improves, user-managed irrigation is implemented, waterrights, pricing and markets are introduced and groundwater management is enforced, average percapita daily availability of calories in developing Asia will rise from some 2 500 kcal per capita in

Agricultural investment strategies: prioritizing land and water…72
2001 to 2 850 kcal. By 2020 or before, malnutrition can be eliminated. Land and water policies mustbe part of a larger reform of good governance and economic reform.
EMERGING SCARCITIES
Some studies of large developing economies including China, Brazil, India and Indonesia indicate thatin terms of current and anticipated growth trends (apart from shortages of water for direct use),sustainable requirements for water to intensify land use in agriculture, forestry, urban sanitation andenergy requirements will require sharp breaks with past attitudes and policies. Business as usual willnot work. An Indian illustration shows that cropping intensity must rise dramatically, non-coal-basedenergy expand rapidly and that BOD disposal strategies will be critical as Box 1 shows. Similarscenarios were presented for China and Indonesia.
While present studies suggest technology and ‘appropriate’ institutions as an urgent panacea,the work is of a preliminary nature and needs considerable focus. Most models bring out the cost ofdelay in starting on the preferred policy paths.
Studies bring out the conflict in sharing of water between agricultural and non-agriculturalneeds and rural and urban requirements. Such conflicts show up in ‘land scarcity’ or sustainabilitycrises, for example deforestation. Improved water use is invariably an important part of the mediatingstrategy in terms of allowing intensive agriculture and releasing land for sustainable use. In India,Singh (1994) suggests that non-agricultural land use is growing at 6 to 10 percent per decade. Witharable area not expanding, he calls for a land use policy. Alagh (2000d) calls for a changed emphasisfrom urban land ceilings and control of each plot to a land use and transportation policy, showing thatthe pattern of urbanization can determine the quantum of BOD and water demand. Brown (1995)projects worrisome projections for land conflicts between urban and rural use in China, are differentfrom the lower figures in UNU-IAS (Lindert, 1996).
There is much variation in estimates of waterlogged and otherwise degraded land. For Indiaestimates vary from 50 million ha to 13 million ha. There is similar variability in global estimates.The author tends to agree with Alexandratos (1995) that many so-called global estimates are simplyinformed opinions, problems are less severe and sustainable development strategies can make anappreciable impact.
Pricing of water use is clearly important when such scarcities emerge. This is particularly truefor irrigation and groundwater use. Investments in technology are also seen as particularly beneficial,both on water supply and distribution and on water using activities like newer crop varieties (ADB,2000). In projections for the United Nations University regarding India, Alagh (2000d) shows thatthere are at present no water saving technologies in the field. Hybrid paddy in both India and Chinaneeds more water per hectare than HYVs and is also more demanding in terms of stress. But moreappropriate cropping sequences across agroclimatic regions will save water. It would be useful toprecisely outline the role of water development and management strategies in some large countrieswith different agro-climatic regimes which are a 'World within the World' (Alagh, 1994) tosystematically determine these issues.
INSTITUTIONS: STRUCTURE AND INCENTIVES
Near consensus among water sector institutions focuses on three essential elements: privatization,decentralization and the role of the market. As with earlier World Bank research, a recent study onAsian agriculture by the Asian Development Bank (2000). There is much to be said for these
…Investment in land and water 73
approaches. Agriculture is atomistic: farmer response to economic incentives and direct interventionby large government agencies regarding input or output is often counterproductive. In Asia thepowerful work of Hayaami for example has shown the vitality of peasant markets (Hayaami, 1981).Continued agricultural growth reduces unemployment and poverty. In good soil and water conditions,given available market infrastructure, the competitive model works.
The state can play a role in technology generation, infrastructure creation, introducing newtechnology, market intervention and risk reduction, but the success or failure of the green revolutionstill relies on the farmers themselves and their organization. It is now recognized that hunger,deprivation and unemployment were minimized in areas where widespread agricultural growth tookplace, generally supported by market incentives. Growth was fast in areas with good soils and assuredrainfall or irrigation, but arid regions, hill slopes, difficult aquifers – hard rock or coastal areas proneto salinity ingress – were bypassed because they were problem areas. Peasants are rational. Marketswork here as well but reality is more complex. The performance of areas with low and/or uncertainrainfall regimes was poor and uneven. 'Marketization', 'commercialization and sometimes'globalization' led to serious problems, with socio-economic deprivation, destabilization, andenvironmental disaster, as two sides of the same coin. Helleiner, later chair of the International FoodPolicy Institute (IFPRI), showed that associated with the disasters in Saharan and Sub-Saharan Africawas the systematic decline of peasant and community organizations in rural areas (Helleiner, 1986).
Varied agro-economic regimes in difficult areas historically evolved to a balance betweensocial activity and resources because of traditional economics and culture related to soils, climate andresources. These are again being incorporated in watershed and other water and soil developmentprojects. This traditional equilibrium was in many cases cruel, especially to women. Nonethelesssociety had coped with the crisis of resource endowments. This fragile equilibrium was beingdisturbed, before the current emphasis on globalization. Diminishing mortality, rising populationpressure, commercialization and marketization were leading to the breakdown of traditional practices.Increasing desertification, soil erosion, flood proneness and forest clearing could be traced to waterharvesting or drainage breakdown and rising commercialization – including a decline of in kindlabour contributions.
These vicious circles coexist with positive experiences. Some households and communitieshave coped with similar fragile land and water endowments and have met energy, food, basicemployment and income deficits in a sustainable manner. While in the early 1990s these wereconsidered 'experimental' in nature, today they are of such magnitude to be called 'alternative'organizational methods rather than demonstration projects. In the late 1980s under the author’ssupervision, eight case studies were studied by independent research institutions in India, wherecommunity effort with private landownership, food and energy gaps were met in a sustainablemanner. These studies described the land and water development project implemented in a definedhomogenous micro geographical area such as a hill slope, a micro watershed, a tributary branch, anaquifer, or an irrigation distributory (Alagh, 1991). They estimated land and water development costs,labour, ‘outside finance’, output as food requirements met, energy requirements met and foddersupplies. There were estimates of ‘economic rates of return on the investment’, i.e. at accountingborder prices, with a shadow wage rate 25 percent higher than the market rate. Financial rates ofreturn at market prices were also estimated. The studies showed high economic rates of return (18percent plus) making them very productive investments.
The initial studies were widely replicated (Chopra and Kadekodi, 1993). A recent study bythe United Nations University and an ADB review of Asian agricultural experience has some insights(ADB, 2000). There is yet no theory of such development, but there are preliminary pointers whichwe review. The projects examined have varied considerably. Watershed development for settledagriculture, alternate tree crops, salinity reclamation, farmer-run lower level irrigation systems,

Agricultural investment strategies: prioritizing land and water…74
aquifer management in difficult situations, such as coastal aquifers, tribal lift irrigation cooperatives,and tank irrigation have been reported and studied.
The success stories are community and leadership based, with leadership coming from diversesources – an NGO, an army retiree, a concerned civil servant and a scientist. The leaders either hadscience backgrounds or knew enough to adapt from nearby science institutions. Organizationstructures were mixed neither purely private nor fully community-based control. The leadershipinvariably argued for aggressively functioning markets, private landownership and household levelagricultural operations, but there was limited, well-defined land or water management cooperation.This could be drainage, soil shaping, contour management, improvement and management of lowerlevel canals, controlled grazing and so on.
Even though the economic rates of return were high, they incurred financial losses. Thesehave at least been estimated in the initial stages of operation. The reasons are not fully understood.Some pointers are to the effect that invariably output prices are lower than border prices and inputprices are higher. Markets are poorly developed in fragile regions and soil; amendments, pump sets,seed prices and interest rates will be higher than in developed regions Another reason could be thatinput rates may in poor soils be high initially and may go down as the organic composition of the soilimproves. In saline lands for example, initial irrigation requirements for leeching may be high, seedrates and soil amendments may cost substantially and low value crops may need to be grown inrotation to improve the organic composition of the soil. Financial support to such efforts also needseffort at institutional reform. Collateral becomes difficult to organize in partial cooperative forms oforganizations and bankers generally find community collateral unacceptable. Many of these projectsrequire lending through a weather cycle, for example a watershed development cycle. The fact thatthat some of the resource requirements of such projects emerge from labour contributions of thecommunity makes it difficult to work out margin requirements. There is an interesting discussion ofreform issues from a bankers perspective to refinance the loan component of such projects in anannual report of a national bank for agricultural and rural development (NABARD, 1991).
There is need to design a policy of initial and targeted subsidies for such efforts and alsofinancing reform. This is a complex issue. The intention has to be to help those who help themselves.But the rules of such help systems are not easy to design, as they have to work at a highlydecentralised level. The economic imperative will be to operate a hard budget constraint; otherwiseresources will be wasted. On the other hand viable projects must be supported. There are alsoquestions of financial reform mechanism design. Until recently, it was easier to buy a tax-free NewYork Municipal corporation bond than a local bond for infrastructure support of the kind beingdiscussed. There is now a vast literature on irrigation performance and management systems. Manycase studies are available, including those initiated by the International Institute of IrrigationManagement. More recent attempts have been made to generalise from them. The need to integratenew technology with community and socio-economic institutions has been indicated (Small andCarruthers, 1991; Ostrom 1994, 1996 and IIIM studies summarized in Shaul, Manor and J.Chambouleyron, 1991). The relative inefficiency of state-run systems is known, and theirimpingement on historically evolved communal systems (Wade, 1982 and Chambers, 1988; Siy,1987; de los Reyes and Jopillo, 1987). Newer studies report on the fragile nature of traditionalirrigation system rules, their vulnerability to outside interference and commercialization – particularlyin terms of contributed labour and maintenance. The struggle to define rules which permit localinitiative without open-ended subsidies is recognized. Moreover there is now an awareness thatdisincentives to perverse behaviour must be put in place. Paradigms for land and water policies indifferent agro-climatic regimes must be developed, with organizational and financial rules forpractical working systems.
…Investment in land and water 75
An emerging literature questions the proposition that decentralization and self-managementwill automatically increase performance levels. Government expenditures in the water sector maydecline. Lacking a policy to monitor performance and anticipate systemic solutions to emergingproblems is a problem in itself. Empirical studies show mixed results from some decentralizedparticipatory experiments (Vermillon, 1997; ADB, 2000a). ADB quotes a study by Rice that pooroperations and management have a little impact on irrigated crops (ADB, 2000b).
On land and water and problems of ecologically fragile areas, Agenda 21 seeks acomprehensive approach and asks for implementation of sustainable development investment plansand strategies at national level through international cooperation. The Technical Annexe to TheHague Meeting Pronk-Mahabubul Haq paper by I. Sachs commends an agroclimatic approach to landand water development costs.
Alagh (1991b) gives many examples of watershed development projects with a short-pay-back period. Techniques for such projects are well known and their impact at community level wouldbe favourable. Yet they need public funding for the front-up costs. Alagh argues for agro-climaticplanning in terms of alternative agricultural and framing systems to overcome the shortcomings offavoured crop/region approach (Sachs in Pronk and Haq, 1992).
The literature on capacities and designs leads to interesting questions. On the one hand it isargued that there has been an excessive emphasis on building physical capacities and management andinstitutional issues have been ignored in irrigation systems. Traditional management systems inparticular it is argued are being swamped. On the other hand it is argued that physical capacities havefallen short (IMMI, 1987, 1991). Ambler's plea that “The link between techno-managerialarrangements and local performance goals must be understood before measuring performance orproposing interventions" probably contains an important clue (Ambler, 1991). Alagh and Buch (1995)have shown that in planning distribution systems in developing countries using hydraulic techniquesdeveloped elsewhere – for example full supply hydraulic distribution systems operating in thedeveloped world – need much innovative systems work. In the California aqueduct and the Canal deProvence, there were few farmers as compared to the examples they studied. The behaviour of largefarming populations must be studied and built into capacity and design parameters. They show the useof acreage response studies and water allocation and distribution systems working on conjunctive useprinciples with the operation authority monitoring and if necessary intervening. The Mekong BasinIndicative Plan asks for such work to be intensified and refers to the Alagh-Buch model as “anexcellent example of how agricultural econometric models are used in water resource planning to helpdesign and manage large irrigation systems.” (Mekong River Commission, 1996). This is an area ofhigh priority work for project design and policies.
While recognition of water rights will generally lead to smaller dams, the need for basin andinterbasin transfers of water will remain. For example the Mekong agreement stipulates cooperationon maintaining flows "To enable the acceptable natural reverse flow of the Tonle Sap to take placeduring the wet season". The agreement emphasizes sustainable development (article 6) and showssensitivity to water rights not seen earlier. Such awarenesses will have important design and structuralimplications on interdisciplinary work not seen earlier, when the economist, social anthropologist andsocial worker were seen as add-ons after project design rather than a part of the engineering designteam. Replication of these examples will need systematic work, training and manuals.

Agricultural investment strategies: prioritizing land and water…76
LOCAL AND GLOBAL RULES
The problem of imposing budget constraints at local level and helping those who help themselves isdifficult to address. Another way of setting the problem is to harness the great vitality of decentralizedmarkets in replicating widespread rural growth within the core areas of local and global concern.Some lessons:
• Financial institutions must design structures to enable community collateral such as self helpfinancing groups. Land and water development groups, local infrastructure projects in road orcommunication sectors (Alagh, 2000), making products developed in R&D institutions, trainingfor production with improved techniques, and market development schemes developed by localand community groups are other examples (ADB, 2000a);
• Lending through a weather or project cycle is necessary. NABARD began such a scheme in 1991,gave it up in 1993 and is again starting it now (Reserve Bank of India, 2000);
• Developing 'policy champions' to set administrative, financial and procedural issues at local,regional and national levels, when problems arise with these kind of development strategies. It isreasonably certain that problems are going to arise in development experiments which are off thebeaten track. The question then is, is there anyone in the policy decision making structure to sortout the problem. ADB reports in a study of farmer managed irrigation systems, that failures werethose where such support did not exist. Failure here is defined as performance levels in waterdelivery lower than by government agencies (ADB, 2000a).
Such problems arise in part because existing legal and administrative systems and financialrules are structured for formal organizations in the public or private corporate sectors, as are globalfinancial institutions. Newer institutions with strategic mixtures of organizations and styles – such ascooperatives and corporations, NGOs and government, NGOs and cooperatives – do not have a levelplaying field: for example a loss-making subsidized electricity system can underprice a renewablesgroup and drive it out of the market. Legislation for a recommended structure for cooperativecompanies is in India's Parliament (Alagh, 2000c). Eventually subsidies and protection given toestablished groups must be withdrawn. In the meantime equal protection must be given to each group.Incentives and disincentives for such growth should begin with basic policies such spending cannotexceed available resources. Resources which are short or binding constraints at national and globallevels are elastic at local levels but using them requires policy changes at higher levels. For example,it is easy to buy a New York City tax free bond, but little attention has been given to developingmarkets for such bonds to raise funds for local bodies in developing countries – and the fiscal reformthat must precede them, as demonstrated in Ahmedabad (Vaidya, 1999).
The last three problems essentially work out that the reform process has to be fairly deeprooted for widespread land and water based poverty reducing growth processes to take place. Thismight be the appropriate tone to conclude.
BIBLIOGRAPHY
Alagh, Y.K., 1988. Guidelines for agroclimatic planning: a draft for discussion, Journal of Land Development.
Alagh, Y.K., 1991a. Indian development planning and policy. Wider studies in development economics,Helsinki and Delhi, Vikas.

…Investment in land and water 77
Alagh, Y.K., 1991b. Sustainable development, from concept to action: techniques for planners,UNCED/UNDP.
Alagh, Y.K., no date. Next phase of agroclimatic research. In Next phase of agroclimatic research, ARPU Vol2, New Delhi, Concept.
Alagh, Y.K. & D. Buch, 1995. The SSP and sustainable development. In Fisher, W., 1995. Towards sustainabledevelopment, Columbia University Seminar Series, New York, Sharpe.
Alagh, Y.K., 2000a. Water and food security in South Asia, World Water Forum and Ministerial Meeting, TheHague.
Alagh, Y.K., 2000b. Global sustainable future and developing countries. Tokyo, United Nations University.
Alagh, Y.K., 2000c. Report of the high level committee on legislation for corporatisation of cooperatives. NewDelhi, Ministry of Company Affairs.
Alagh, Y.K., 2000d. Sustainable development: India 2020, Tokyo, United Nations University/IAS.
Ambler, J., 1991, Bounding the system. In Hayaami, Y., 1991. Performance measurement in farmer managedirrigation systems, Colombo, International Irrigation Management Institute.
Alexandratos, N., ed. 1995. World agriculture towards 2010: an FAO study, Chichister, Wiley.
Asian Development Bank, 1999. The growth and sustainability of agriculture in Asia. Manila.
Asian Development Bank, 2000a. Rural Asia: beyond the green revolution, Manila.
Asian Development Bank, 2000b. Rural Asia: companion volumes I-III, Oxford University Press. UNU/IAS.
Chopra. K.& G. Kadekodi, 1993. Watershed development, Economic and Political Weekly, June 26: A61-A67.
Chambers, R., 1988. Managing canal irrigation: practical analysis from South Asia. Cambridge, CambridgeUniversity Press.
De Los Reyes & S. Jopillo, 1987. An evaluation of NIA’s Participatory Communal Programme. In InternationalInstitute of Irrigation Management, 1987. Public interventions in farmer managed irrigation systems.Colombo.
FAO, 1978/81. Agro-economic zoning atlas. Rome, FAO-UNESCO.
FAO, 1982. Agro-economic zoning atlas. Rome, FAO-UNESCO.
FAO, 1993. Agriculture towards 2010, Rome. In Alexandratos, N., ed. 1995. World agriculture towards 2010:an FAO study, Chichister, Wiley.
Fisher, W., ed. 1995. Towards sustainable development, Columbia University Seminar Series, New York,Sharpe.
Helleiner, G. 1986. Balance of payments experience and growth prospects in developing countries, WorldDevelopment, 14: 877-908.
Hayaami, Y. 1981. Understanding village community and the direction of agricultural change in Asia, Delhi,IEG. Occasional Paper, New Series, No. 1.
International Institute of Irrigation Management. 1987. Public interventions in farmer managed irrigationsystems. Colombo.

Agricultural investment strategies: prioritizing land and water…78
International Institute of Irrigation Management, 1991. Performance measurement in farmer managedirrigation systems. Colombo.
Lele, U., N. Kumar, Y. Alagh, N. Saxena & K. Mitra, 2000. Forestry in India: an evaluation. Washington, DC,World Bank.
Lindert, P., 1996. The bad earth, Davis, University of California Agricultural History Center.
Manor, S. & J. Chambouleyron, 1991. In International Institute of Irrigation Management, 1987. Publicinterventions in farmer managed irrigation systems. Colombo.
Mekong River Commission, 1996. Mekong Basin Indicative Plan. Phnom Penh.
Nasution, L. 1993. Agricultural regionalistion of Indonesia. Bogor, Agricultural Research Centre.
Ostrom, I., 1994. Neither market nor state: governance of common pool resources. Washington, DC, IFPRI.
Ostrom, I., 1996. Rules, games and common pool resources. Ann Arbor, University of Michigan Press.
Pronk, J. & M. Haq, 1992. Sustainable development: from concept to action, UNCED/UNDP.
Sadasyuk, G. & P. Sengupta, 1968. Economic regionalisation of India: problems and approaches. MonographNo. 8 of Census 1960. New Delhi, Census of India.
Siy, R., 1986. Averting bureaucratisation of a community managed resource. In Korten, D., ed. 1986.Community management: Asian experience and perspective, New Haven, Kumarian.
Small, L. & I. Carruthers, 1991. Farmer financed irrigation. Cambridge, Cambridge University Press..
Sonntag, N., 1996. Adaptive management policy exercises: two methods for integrated resource management.
Vaidya, C., 1999. Private sector participation in financing and management of urban water supply andsanitation projects. In 31st Annual IWWA Technical Volume. Delhi. IWWA.
Vermillon, D., 1997. Impacts of irrigation management transfer: a review of the evidence. Colombo, IIIM.
Wade, R., 1982. Employment, water control and water supply institutions, Sussex, IDS.

…Investment in land and water 79
Funding investment in land and water
INTRODUCTION
This paper advocates enhanced financing support for sustainable agricultural and rural development(SARD). It examines the trend in resource flows to agriculture and explores issues in sustainableagricultural development. It also presents an overview of innovative financing mechanisms and theprinciples of a framework for the coherent and effective use of investment resources.
RESOURCE FLOWS TO AGRICULTURE: INTERNATIONAL FINANCIAL FLOWS
International financial flows are crucial to sustaining growth in developing countries. The financialcrises in the second half of the 1990s adversely affected private financial flows and their recovery hascontinued to lag output and trade growth. Moreover, the cyclical slowdown of the global economycould well dampen these flows. However, this decline in private flows reflects some improvement intheir quality as volatile short-term flows have fallen sharply. Foreign direct investment (FDI) is morestable. Countries experiencing rapid FDI growth have benefited from augmented domestic savings,financing for new investment opportunities, and exposure to international markets. The potential forproductivity growth through private capital flows has probably increased because of the growingimportance of knowledge as a production input. On average, private capital inflows raise domesticinvestment in a ratio of almost one to one. However, the effect is strongest for those countries that areleast integrated with international financial markets. Thus, the association between foreign inflowsand domestic investment is strong in Africa.
However, private flows favour high performing economies. The benefits are available mainlyto countries that have a strong capacity to absorb them. This underscores the importance of ahospitable business climate in attracting and sustaining FDI flows. Short-term portfolio flowsreinforce positive growth dynamics but decline in conditions of economic adversity. Moreover, theirvolatility can impose considerable costs. This calls for capacity building support to manage volatilityand safeguard domestic financial stability.
Total net external flows to developing countries peaked in 1997 (Table 1). Net official flowshave since declined to 63 percent of their level at the beginning of the decade. Net private flows (bothcapital and FDI) have also declined since 1997 but are still nearly 6.6 times higher than official flows.However, for many developing countries official flows provide important support to their economicgrowth momentum while their market-based reforms continue. To date, FDI flows have not beensufficiently responsive to these changes because of risk perceptions about the legal and regulatoryframeworks and contract enforcement and dispute settlement mechanisms.
________________________________________________________________________________
S. Saigal, Consultant …Land and Water Development Division, FAO, Rome….
________________________________________________________________________________

Funding investment in land and water…80
The share of FDI in net private flows increased from 58 percent in 1997 to 69 percent in2000, about US$5 billion more than in 1997. FDI flows to low-income countries quadrupled between1991 and 2000, but remained less than 2 percent of their GDP. The share of the low-income countriesin all FDI flows to developing countries fell to 7 percent (13 percent in 1991). Sub-Saharan Africa hashad particular difficulty in attracting FDI. This is due to insufficient market size, poor infrastructure,political uncertainty, corruption and restrictive policy regimes. The top ten developing countryrecipients of FDI (China, Brazil, Mexico, Argentina, Malaysia, Poland, Chile, the Republic of Korea,Thailand and Venezuela) accounted for 74 percent of total FDI flows to developing countries in 2000,amounting to 3.8 percent of their GDP.
Where net private capital flows and FDI decline, the need for official aid flows comes intosharper focus. Current levels of foreign aid, at some 0.24 percent of annual GDP, fall short of the0.7 percent target set by developed countries. The actual aid falls short of that target by someUS$100 billion a year. Overseas aid to Africa fell from US$32 per person in 1990 to US$18 perperson in 1998.
International official resource transfers provide about US$5 billion a year, about 10 percent ofofficial development assistance (ODA), to fund international public goods, e.g. health, agriculturalresearch and environmental protection and an additional US$11 billion finances complementarydomestic infrastructure.
TABLE 1Net long-term resource flows to developing countries, 1991-2000 (US$ 000 million)
1991 1995 1996 1997 1998 1999 2000
Total123 261 311 343 335 265 296
of which:Official flows 61 55 32 43 55 45 39Private flows 62 206 279 300 280 219 257Of private flows: Capital markets 26 99 148 127 104 34 79 FDI 36 107 132 173 177 185 178
Share of developing countries (%)In global total private flows 12 12 13 14 10 8 8In global FDI 22 32 35 37 26 19 16
FDI inflows as share of totaldeveloping-country FDILow-income countries 13 13 14 11 8 5 7Least developed countries 5 2 2 2 2 3 3
The proportion of sectorally allocable aid reaching agriculture, forestry and fisheries fellsharply from the mid-1970s to about 20.2 percent in 1987-89 and then to 12.5 percent in 1996-98.The real value of net aid disbursed to agriculture in the late 1990s was 35 percent of its level in thelate 1980s. The share of agricultural lending in the loan portfolio of the World Bank fell below10 percent in 2000, compared to an average of 14 percent for the decade ending 2000. Thirty yearsago the figure was 40 percent. In constant 1995 prices, total commitments for agriculture are 8 percentbelow the level in 1990. Contributions from bilateral donors, mainly countries in the DevelopmentAssistance Committee (DAC), were about US$4.3 billion in both 1997 and 1998. The increased levelsof assistance in 1997 and 1998 over that of 1996 were due entirely to increased levels of multilateral

…Investment in land and water 81
assistance, particularly from the International Development Association (IDA), while bilateralassistance was actually lower than in 1996.
The share of agriculture in total government expenditure in developing countries ranges from0.015 percent to 23 percent, with this share being lower than 10 percent in 90 percent of cases.Countries with high levels of undernourishment are also those with severe budgetary constraints. Thispoints to the case for a larger flow of concessional development assistance to such countries toeffectively face the challenge of food insecurity and undernutrition.
Investment needs
The total annual gross investment needs of agriculture in the developing countries (primaryagriculture, storage, processing and support infrastructure) would be about US$180.4 billion for theperiod up to 2015. A continuation of current annual investment rates until 2015 would be insufficientto achieve the World Food Summit (WFS) target. The expected shortfall averages 12 percent for alldeveloping regions and is 38 percent for sub-Saharan Africa.
Programmes such as the Soil Fertility Initiative, the Integrated Land and Water ManagementAction Programme for Africa, the International Programme of Land Quality Indicators, the Inter-American Water Resources Network, and the Critical Ecosystems Partnership need financialresources for implementation, up-scaling and replication. The sustainable development of land andwater resources calls for increased resource flows from domestic and external sources, but also for amore effective use of such resources and improved frameworks of partnership and aid coordinationamong all stakeholders.
International development goals
The DAC guidelines on sustainable development strategies stress the need for deep structural changesin the economy, society and politics. Land and water issues are linked to the development goals ofpoverty reduction, food security and nutrition, and to the implementation of national strategies forsustainable development by 2005.
There is a trend towards the rural poor depending increasingly on non-farm sources of incomegeneration. The share of non-farm employment in rural employment among the rural poor rangesfrom 30 to 50 percent. Despite this positive trend, the dependence of the poor on the natural resourcebase and on agriculture poses a challenge for the sustainable development of land and water resources.Addressing opportunities and constraints of smallholder agriculture requires both technical andinstitution-building support and financial resources for investment in rural infrastructure. Withoutsuch resource flows, the realization of the international development goals is not possible within thespecified timeframe.
Improving support for international development
Governments can and must do more to encourage public awareness of assistance activities andsupport for international cooperation for development. This calls for: establishment of clear goals fordevelopment policy; reorientation of development education to portray issues objectively; anintensified effort to assure efficient and effective programme management; awareness thatdevelopment cooperation deserves support because of the mutual interests that it serves and becauseof the moral imperative of helping others to help themselves and improving resource use.
The main measures to increase the effectiveness of ODA are: implementation of a holistic andcross-sectoral approach to sustainable development; developing a strategy for country leadership with

Funding investment in land and water…82
mutual responsibility among partners for development outcomes and distinct accountabilities;emphasizing partnership and collaboration among governmental and non-governmental actors atnational level; ensuring that aid coordination integrates external assistance with the developmentpriorities of the recipient country. Donors and recipients should adhere to strategic objectives andinvestment programmes; placing responsibility for aid coordination primarily with the recipientcountry. Two elements of an enabling environment are policy performance and institutional quality;and introducing results-based frameworks for assessing aid coordination.
There is a need to provide considerable capacity-building support in order to helpgovernments nurture policy reform, strengthen aid coordination capacity, and reach partnershipagreements with donors. The agreements should delineate mutual responsibility for developmentoutcomes and the distinct accountabilities of each partner. The Poverty Reduction Strategy Paper(PRSP) will serve as the main instrument for implementing these recommendations.
ISSUES IN LAND RESOURCES DEVELOPMENT
The deployment of resources through financing mechanisms and modalities involves three inter-related segments: (a) SARD; (b) land degradation; and (c) natural resource management (NRM).Water resources constitute a distinct cluster. The investment dimension of these segmentsencompasses key issues:
• economic and policy measures to increase sustainable productivity;• the degradation of both marginal and high-productivity irrigated lands;• sustained cultivation of sloping lands;• deforestation and loss of biodiversity; and• declining reserves and increasing competition for water resources.
The main planks of the integrated and participatory strategies to address these issues are:
• integrated systems approaches to sustainability issues;• integrated research programmes to find least-cost, quick-return conservation methods;• integrated approaches to pest, disease and weed management;• improved information on declining productivity and natural resource degradation, and on the
methods for their alleviation; and• a search for solutions in the context of institutional, environmental and economic interfaces.
Sustainability
SARD implies jointly producing food and other goods for farm families and markets, and alsocontributing to frameworks to provide a range of public goods. However, SARD does involvedifficult choices and trade-offs. It is also not easy to develop incentive frameworks that can ensureoptimal solutions in terms of costs and benefits. An analysis of SARD issues requires acomprehensive framework that shows the interrelationship of all aspects of development.

…Investment in land and water 83
Production gains from intensification
Agriculture is the key sector for generating incomes and employment in both farm and non-farmeconomies in most developing countries. Therefore, agricultural intensification holds great promise asan instrument to simultaneously alleviate poverty, meet food needs, and avoid exploitation of thenatural resource base.
To help ensure global food security, the developed countries need to aim for sustained gainsin productivity in order to provide stable food stocks to meet emergencies or to fight hunger andmalnutrition in pockets of chronic poverty and vulnerability.
Agricultural intensification in developing countries
In the last 40 years, the doubling of cereal output has come from three sources: area expansion,intensification and yield increases. The area under irrigation more than doubled between 1950 and1980. However, its rate of growth has since slowed substantially. In many areas, physical andtechnological constraints are likely to restrain large-scale conversion of potentially cultivable land.Increased cereal production has to come primarily from increased productivity or higher yields, butwithout compounding environmental problems such as erosion and salinization. In some countriesannual losses in production potential attributable to soil depletion may reach 1.5 percent of GDP.Expanded production and employment in agriculture is usually feasible to the extent that:
• agriculture’s total productivity factor grows enough to outweigh any falls in net farm prices;• farm resources, especially land, are redistributed towards small and family farms;• technology changes in a labour-using way, or incentives change so that farmers use a larger
proportion of land labour-intensively.
Agricultural intensification need not degrade the environment, but inappropriate andmismanaged intensification can lead to environmental degradation. Rural poverty causes a moreserious environmental problem in developing countries through the forced exploitation andconsequent degradation of environmentally fragile lands. On balance, the potential for increasingyields through intensification outweighs the alternative of expanding acreage.
Large pockets of rural poverty are concentrated in dryland areas (fewer than 120 growingdays per year). Drylands extend over at least 20 million km2 with a population approaching 500million. A central precondition for their development is the assignment of a high priority to drylandsimprovement. Projects and programmes to combat land degradation need to be flexible and include:
• Strengthened information and monitoring systems, especially for drought preparedness.• Integrated programmes and policies which balance conservation and production objectives.• Improved dryland resource management through environmentally sustainable practices.• Programmes to eradicate poverty and promote alternative livelihood systems.• Support for indigenous technologies and local participation.• Enhanced national capacity for rural development.• Support for the control of population growth.
Intensification will have to meet the expected doubling in food requirements by 2050.Therefore, the sustainable use of land, whether in high potential or dry areas, becomes crucial. TheFAO SOFA 2000 calls for a new green revolution, which involves resource-poor regions and farmersand so-called orphan species and varieties.

Funding investment in land and water…84
ISSUES IN SUSTAINABLE WATER RESOURCES DEVELOPMENT
Principles for effective water policy
The emerging principles for the efficient and sustainable use of water are:
• Undertake national water resources development and management in a holistic and sustainedmanner to meet national development goals and protect the environment.
• Decentralize the planning, development and management of specific water services to anappropriate level responding to basin boundaries.
• Delegate the delivery of specific water services to autonomous and accountable public, privateor cooperative agencies providing measured water services in a defined geographical area totheir customers and/or members for an appropriate fee.
• Allocate shared water resources efficiently for the mutual benefit of all riparian users.• Enable participatory and consultative activities at each level.• Ensure a commitment to sustained capacity building, monitoring, evaluation, research and
learning at all levels.• Ensure sustainable water use in society (with incentives, regulatory controls, and public
education promoting economic efficiency, conservation of water resources, and protection ofthe environment) within a transparent policy framework.
An ideal institutional framework for rational water resource management would include:
• A decentralized, accountable structure that is coherent at each layer of administration.• Self-management of independent bodies and self-financing at user and higher levels of activity,
according to users’ ability to pay.• Market mechanisms as an integral part of water allocation.• An enabling role for government, with key responsibilities for capital investment, supporting
legislation, data collection and processing, and support for basic technical R&D.• A comprehensive and consistent legal code which clearly defines the water rights and
responsibilities of individuals, groups, agencies and government bodies.• A set of procedures for de jure and extra-legal arbitration of disputes and established
enforceable penalties for misuse and degradation of water resources.
Irrigation, drainage and groundwater development
Investments to promote efficient systems of surface irrigation and drainage and groundwaterabstraction assume crucial importance within the framework of integrated water resourcesmanagement policy. About 17 percent of all cropland is irrigated, accounting for some 40 percent offood and fibre production. Irrigated agriculture is highly water intensive, claiming nearly 70 percentof world water abstraction (over 90 percent in agricultural economies in the arid and semi-aridtropics). Wasteful irrigation practices not only entail the loss of precious water but also causewaterlogging and salinization. More than 10 percent of the world’s irrigated land suffers from varyingdegrees of salinization, and the extent and severity of this phenomenon are growing. In addition,seawater intrusion can damage aquifers irreversibly. Despite large investments and subsidies,irrigation performance has not always fulfilled expectations in terms of yield increases and efficiencyof water use. Agriculture is also a relatively low-value, low-efficiency and highly subsidized wateruser. This situation is not sustainable.
Food security is closely linked to success in water control. Moisture control at root levelallows for the maximization and stabilization of production. Success will not come from expansion

…Investment in land and water 85
alone (more dams and canals, larger tracts of land levelled and watered). Increasingly, it must comefrom improved management and rehabilitation of inefficient systems, and the substitution oftraditional systems by systems based on accurate technology. Achieving this will require funds andqualified, capable farmers and managers.
From the perspective of sustainable water resource management, Table 2 summarizes someexamples of actions to be encouraged/discouraged in the irrigation and drainage subsectors.
Table 2Issues in irrigation and drainage
Encourage Discourage
Cost recoveryManagement of irrigation units by farmers and/or userassociationsAdded emphasis on in-farm operationsRehabilitation of existing systemsEconomic incentives for water conservation, especiallygroundwaterMaintenance of investmentsFinancial sustainabilityComplementarity with other usesFarm drainage as part of the projectAdequate disposal of irrigation return flows as anintegral part of the projectExplicit consideration of policies for tariffs andsubsidies
Non-transparent, non-targeted and non-temporalsubsidiesEmphasis only on main delivery and drainage systemswithout consideration for in-farm drainageGroundwater depletionConflicts with other uses
OTHER PRIORITY ISSUES IN SUSTAINABLE AGRICULTURAL DEVELOPMENT SYNERGIES
To exploit the synergies between the Rio Conventions on desertification (UNCCD), biodiversity(CBD), and climate change (UNFCC), it is necessary to operate concurrently at four levels:• awareness building and information dissemination;• programming to build complementarities in respective country-driven projects and
programmes, or subregional/regional initiatives;• implementation of programme elements requiring joint or mutually reinforcing complementary
actions;• building databases and information exchange.
Climate change, global warming and water resources
The impacts of climate change on water users and the water environment will depend on the nature ofthe institutions managing water and the physical infrastructure. Among the factors that influence theability of a water system to respond to change are financial resources and technical expertise. Thefocus of water management is turning towards flexible, integrated systems, incorporating both supplyand demand management. Such systems are inherently better able to cope with climate change, andare easier to adjust as more information appears.

Funding investment in land and water…86
The inclusion of soil carbon sequestration into future arrangements for carbon sequestration isan important development for the role of land-based activities within the framework of the CleanDevelopment Mechanism (CDM). This issue calls for a more integrated approach to landproductivity, soil fertility, forestation and biodiversity. The potential for soil carbon sequestration maybe as high as 40 percent of the total amount of annual atmospheric increase in CO2 concentration.Moreover, the appropriate choice of crops coupled with appropriate land management will lead toincreased carbon retention. The Global Mechanism (GM) is associated with innovative ways ofactivating the flow of new funds for CCD implementation. However, many operational andmeasurement issues remain before activating the CDM as a source of fund raising.
FAO and IFAD have agreed to implement a programme to strengthen regional and nationalcapacities to define strategies focused on greenhouse gas emissions for the benefit of the sustainablemanagement of natural resources of the region. Forestry and agroforestry can compensate forgreenhouse gas emissions by creating new sinks for carbon dioxide, and by protecting existing foreststhat are carbon stores.
Valuation of environmental effects
The reasons for unsustainable practices and environmental damage lie in policy and market failures tovalue environmental resources and to incorporate environmental costs in prices. Part of the cause liesin unclear or non-existent property rights.
Valuing in situ natural resources solely as raw materials ignores their role in the earth’s lifesupport systems. This requires attaching non-monetary weights for forests, biodiversity, non-renewable resources, and global commons. Such a valuation system would establish linkages betweenthe economic goals of profit maximization and environmental sustainability. Such systems of greenaccounts seek to prevent the overuse of natural resources. However, translating this concept intopractice raises many technical issues. The precise economic value of ecological assets is difficult toassess. This is due partly to the lack of information on the market value of ecological goods andservices and partly to uncertainty about the dynamics of ecosystems, as well as problems ofquantifying certain non-market values. Many of the environmental effects are manifest either atdistant locations (downstream effects) or in the future (the gradual depletion of soil nutrients). Theeffects may be in situ or off-site. However, quantifying such effects on ecological assets wouldrequire monitoring systems to collect and analyze data for economists to use in attaching values toecological damage in relation to losses in productivity and sustainable development. One analyticaltool is the social rate of discount. Apart from various technical issues involved in its application, thereis also some apprehension that the use of such discounting may work against the interests of thenatural environment. The higher the discount rate, the less long-term environmental damage willappear to matter, and the less attractive will investments to conserve the environment appear.However, the answer lies in incorporating a criterion of sustainability into certain aspects of decisionmaking. Table 3 summarizes existing economic principles and their extensions at project, sectoral andmacroeconomic levels.
One method of project appraisal combines the concepts of economic feasibility, acceptability,and sustainability. In its application to a watershed development project, feasibility is measured by thechange in sustainable income for the successive generations of project households as seen from today;acceptability by the average annual income which the current generation of project households derivesfrom the project; and sustainability by the tax or subsidy equal to the difference between sustainableand average annual income for the current generation of project households. Internalizing externalcosts and negative welfare impacts in the project and forcing a sustainability constraint on the projectdo restrict the scope of feasible projects. However, potential gainers outside the project, either inspace (externalities) or in time (sustainability), can be taxed on the basis of part of the gains which

…Investment in land and water 87
rural development projects may create for them. This approach can help identify win-win investmentoptions.
Such valuation/appraisal exercises require interdisciplinary team efforts within a frameworkfor monitoring the costs of neglecting, and the benefits of, conserving such ecological assets. Thisneeds funding support, as does capacity building of related expertise and institutional frameworks.Synergies between knowledge, environmental protection and investments include:• Improved collection, transfer and use of agricultural and environmental information;• Capacity building in approaches/methodologies to identify win-win outcomes;• Improved environmental standards through incentive frameworks;• New opportunities for profitable and sustainable environmental investments.
TABLE 3Techniques for valuing the environment
MARKET TYPE
Conventional market Implicit market Constructed market
Based on actual behaviour
Effects on production,
Health
Defensive or preventive costs
Travel costs
Wage differences
Property values
Proxy goods
Artificial market
Based on intended behaviour
Replacement cost
Shadow project
Contingent valuation
Definitions: Defensive costs: Ex-post costs of mitigating damage. Replacement cost: Future cost of replacing animpaired environmental resource by an equivalent asset, assuming that original resource was at least as valuableas the replacement expense. Shadow project: cost of special project designed to offset environmental damagecaused by another project. Proxy goods: Market value of a substitute for an environmental asset that itself is notmarketed. Artificial market: Willingness to pay for an environmental asset determined on an experimental market.Contingent valuation: Willingness to pay for an environmental asset or willingness to accept compensation for itsloss, determined by direct questions.
Market failures are the result of institutional failures the failure to establish the regulatoryframework to: secure property rights, check open access to common resources, enforce contracts,impose and collect taxes, recover costs, and provide transparent rules governing incentives anddisincentives, responsibilities and accountability. The key environmental principles are:proportionality; the polluter pays; prevention; and common but differentiated responsibility.
Technology and institutional modernization
A major weakness of agricultural research and technology generation and diffusion is that the nationalagricultural research systems (NARS) are underfunded and poorly equipped. Their research prioritiesdo not fully incorporate the problems of dryland agriculture and resource-poor and low-potentialareas. The linkages with extension services and farmers, and with international and regionalagricultural research centres, leave much scope for improvement. It is necessary: (i) for farmers toadapt their traditional systems to a more competitive market environment; and (ii) to look for less

Funding investment in land and water…88
costly, more responsive and more pluralistic transfer systems that can reach a wider clientele of smallproducers.
Another issue is the decline in public-sector agricultural support services, particularly inremote areas. There is a case for promoting efficient private-sector services, such as expanding NGOextension systems, provision of group-based financial services by intermediaries, and other forms ofparticipatory credit delivery. There is a need for institutional decentralization and representative localstructures to motivate and supervise grassroots rural development initiatives.
New techniques aimed at promoting sustainable intensive farming systems need to bedeveloped and disseminated. Such techniques relate to soil and moisture conservation, soil fertility,crop protection, the management of new crop varieties, and water harvesting.
There is a strong case for strengthening programmes and funding to accelerate theimplementation of CGIAR research programmes through collaboration with other agencies. CGIARrecommends earmarking an increasing proportion of funding for sustainability-related research andproviding it in the form of incentives or seed money to foster consortia and networks.
Other institutional issues
Institutions affect development outcomes in economic and social fields. For example, uncertainty oftenure is usually a deterrent to long-term sustainable land use. Ambiguities relating to usufruct rightsof land, water and trees tend to contribute to environmental degradation. Other institutional aspectsinclude the absence of clear community mechanisms for the upkeep of public assets andinfrastructure, a lack of financial services, and the marginalization of women. The absence of micro-credit institutions discourages investment in soil and water conservation measures, particularly ifpayback periods are relatively long.
A priority area is the need to strengthen national and local environmental managementcapacities. Addressing global environmental problems requires: (a) integration of these concerns intonational policy making; and (b) improved use of scarce resources through financial leverage andmarket-based approaches. Institutional frameworks need to be developed to promote and implementinterventions to address cross-border concerns.
FINANCING SUSTAINABLE DEVELOPMENT
International development cooperation
The rationale for development assistance has changed. Good governance is now an importantcomponent of the broad framework of policy dialogue. There is an emerging consensus that povertyreduction and growth must be at the heart of the agenda for sustainable development. Its basicprinciples are:
• Development is a process of societal transformation that takes place over time;• A comprehensive approach to development and a multidimensional view of poverty;• Faster growth is essential for sustained poverty reduction, and greater participation of the poor
enhances growth potential;• Country ownership of the goals, strategy and direction of development and poverty reduction
(shared ownership by representative segments of society) is critical;• The development community as a whole must work closely together;• A clear focus on measurable development outcomes.

…Investment in land and water 89
The main instruments to translate the above principles into action are:
• Country-owned poverty reduction strategies to provide the basis for donor concessionalassistance (particularly World Bank and IMF lending), and guide the use of resources freed bydebt relief under the enhanced Highly Indebted Poor Countries (HIPC) initiative;
• The World Bank’s Comprehensive Development Framework (CDF) or its equivalent the UNDevelopment Assistance Framework (UNDAF) at country level as a basis for coordination ofprogrammes and action plans based on the country’s PRSP. The CDF represents an approach topolicymaking based on a greater balance between the economic, human and structural elementsof development, and on new partnerships that support countries in achieving this balance.
This framework would ensure coherent strategies which reflect ownership by a broad spectrumof domestic stakeholders. It would also improve donor coordination and serve as a platform to focusthe analytical, advisory and financial resources of the international community on achievingmonitorable results. However, implementation is a complex process involving many country-leveltrade-offs and tensions. Apart from capacity constraints in fully articulating strategies and actionplans, the process involves conflict resolution between sectors, implementing agencies and publicinterest lobbies. The World Bank recommends:
• more deliberate use of lending and non-lending tools to foster consensus through increasedlocal involvement and more widespread dissemination of analytic work;
• more use of pilot projects to test new approaches;• greater use of advisory services and flexible lending instruments to nurture policy change.
The framework implies a greater selectivity among donors in allocating ODA resources. Thecase for increased financing for development rests not just on the principle of universality, but onpolicy orientation and performance. Developing countries need to demonstrate their commitment to,and progress in, undertaking market-based reforms. Moreover, their development strategies should bein tune with the objectives of good governance, poverty reduction, basic health, sanitation, andeducation. Another element of selectivity lies in the policy of individual bilateral donors in terms ofthe focus of their development assistance on a narrow set of priority areas and countries.
Developed countries channel a part of ODA as contributions to the core funds of multilateralinstitutions, or as trust funds. Through their support to a developing country, major institutions, e.g.the World Bank Group and the IMF, also trigger private capital flows by lowering private sector riskperceptions or more directly as part of a financing package. Furthermore, multilateral organizations ofthe UN system mediate with developed member countries to leverage financial resources to providecritical technical and advisory services to the developing countries. For example, FAO has promotedagricultural production and food security in developing countries and has helped raise resources in thefight against hunger and undernutrition through its Special Programme for Food Security (SPFS) inlow-income food deficit countries (LIFDCs).
While ODA is the most dependable source of concessional assistance for the low-incomedeveloping countries, there is a need to explore other diversified funding channels to enhancefinancial flows for sustainable development. These include non-traditional sources, such as Arabfunds, private endowments, and private financial flows. Private flows comprise foreign directinvestment, portfolio investments in marketable securities by foreign financial institutions, foreignbank loans, and export credits. However, such capital flows favour a limited number of betterperforming developing countries with absorptive capacity and infrastructure to attract private capital.All foreign investments augment the domestic rate of investment. However, private financial flows

Funding investment in land and water…90
pursue profit and not social or development objectives. There are some corporate social investmentavenues, but their contribution to resource flows for development is still limited.
Raising resources to finance development
In countries where food insecurity is prevalent, external assistance to agriculture accounts for up to86 percent of gross domestic investment and 51 percent of government expenditures. The externalassistance in such countries has to come primarily from ODA.
FAO estimates that the SPFS requires an annual financing of about US$1.4 billion(US$17 million per country). The projected sources of funding are: the FAO SPFS Trust Fund(US$500 million), recipient countries (US$67 million), bilateral donors (US$137 million), andmultilateral financing institutions (US$670 million). The actual mobilization over five years by FAOhas been US$230 million, an indication of the scale of underfinancing that has constrained theimplementation of the SPFS. To meet this challenge of persistent resource constraints, it is necessaryto develop innovative ways to finance the sustainable development of land and water resources on apredictable and long-term basis.
Innovative financing mechanisms
The investments for the agriculture sector and food security form three broad categories: primaryproduction, post-harvest system, and public support. Financing may come from domestic/externalprivate and public channels. More generally, financing may be for: programme or project investments;policy and institutional reforms; capacity-building support; provision of support services; orsupervision, monitoring and evaluation. Financing may be in the form of loans or grants provided bydonor agencies, or through funds raised in the capital markets (Table 4).
Innovations in financing mechanisms are unlikely to take the form of creating new fundingchannels. This became apparent during the negotiating process for the UNCCD, which incorporatesthe Global Mechanism (GM). The GM is a catalyst and facilitator for mobilizing resources for theimplementation of the UNCCD in the developing member parties. It should work with all membercountries to: (a) improve the efficiency of allocation and use of financial flows at both the supply anddemand ends of the resource mobilization equation; (b) to add value through the reorientation of suchflows towards the realization of the goals to combat land degradation; and (c) to do so through multi-channel partnerships and by acting as an honest broker between donors and recipients. The mainlesson is that the international community is averse to creating new funds or financial mechanisms,and wishes to place greater reliance on the more effective use of existing channels. Thus, the searchfor innovation must focus on:
• effective coordination among various development partners,• attention to diverse local conditions,• adaptations and flexibility in reshaping existing instruments of lending or grant assistance,• creating a monitorable track record of effective implementation by developing countries.• using NGOs and civil society in funding arrangements at the grassroots level to prevent leakages
or transmission loss in fund flows.There are also global initiatives to leverage the potential of international financial flows,
particularly on the issue of reforming international financial architecture. Although not borne out bytrends in financial flows, the process of globalization has raised expectations that private capital flowsand trade may gradually displace aid as the dominant financing source for developing countries as aconsequence of:
• greater integration of the global economy;

…Investment in land and water 91
• ongoing technological change;• increased risk-management ability in developing countries;• an accentuated dualism between the modern and the subsistence sectors of the economy and in the
agricultural sector.
TABLE 4A schematic typology of financing
Concessional lending Grants Loans on ordinaryterms
Private capital
Investmentinterventions
X X X
Policy & institutions X X XCapacity building X XSupport services X XSupervision,monitoring &evaluation
X X
Main sources offinancing
IDA (World Bank’ssoft loan widow)IFADRegionaldevelopment banks(soft windows)Islamic DevelopmentBank, Kuwait Fund,OPEC FundDeveloping countrybudgets
BilateralsTrust fundsTechnical assistanceby multilateralsSocial developmentfundsHIPCUNDPFAO (technicalservices/SPFS)WFP (food aid)Other UN agenciesGEF (env. problems)GM (for CCD)IFAD (TAGs)Regional banks (forfeasibility studies,etc.)CGIAR/IARCs(for research)Arab FundsInternational NGOs,foundations, Islamicendowment fundsIndividuals
World Bank (IBRD) /IFCRegionaldevelopment banksIFADIslamic DevelopmentBank (leasing; equityparticipationKFW (Germany)
FDIPortfolio investmentsthrough capitalmarketsCommercial bankborrowingsDebt restructuring.Trade relateddeferred paymentarrangements,supplier’s creditsBonds & shares ofdeveloping countryinstitutions in foreigncapital markets
The estimates of funds needed for this purpose must be brought within the global frameworkof financing sustainable development.
Instruments and mechanisms
Flexible lending framework

Funding investment in land and water…92
The Country Poverty Reduction Strategy (CPRS) formulation exercises emphasize improving publicresource allocation and raising the productivity and cost-efficiency of public investment. Once there isa consensus on the strategy among the main stakeholders, the World Bank and other donors areprepared to finance the resulting investments through a flexible framework. For example, the WorldBank may take the lead in providing broad-based Poverty Reduction Support Credit (PRSC) linked tokey objectives, reform areas and priority action areas. Governments will receive the credit on IDAterms in tranches geared to performance. The funding is integrated with the government budgetarycycle and augments the capacity to allocate resources on a cross-sectoral basis. FAO has a role inassisting governments in articulating their agriculture sector strategy and in the formulation ofprogrammes within the CPRS framework. Interested bilateral donors could enter into partnership withFAO to support such programmes.
Improved aid effectiveness needs to complement flexible lending through: improvedabsorptive capacity in the developing countries: recourse by them to sound and pro-poor policies; andimproved aid resource flows to such better performing countries. A logical extension of this process isthe common pool approach to assistance. This implies that a single development strategy for eachcountry would guide all donors (each receiving the same monitoring report) with the common pool ofresources supplementing the recipient's budgetary resources.
Debt relief
Debt relief covered by the Heavily Indebted Poor Countries (HIPC) initiative can increase resourceflows to developing countries. Such relief is tied to appropriate policy reforms. Under the enhancedinitiative of 1999, interim debt relief begins immediately at the decision point for most countries. Theenhanced initiative has quickened the pace of debt relief. It has the consequence of effectivelyincreasing the resources available to developing countries for agreed priority programmes.
Overall, 41 countries with US$170 billion in external debt are eligible for consideration. Debtowed to multilateral institutions accounted for about 40 percent of their total debt obligations in 1997.From the perspective of such countries, debt relief has a significant impact on their economicprospects. The debt of the average HIPC is more than four times its annual export earnings and well inexcess of its GNP. The enhanced initiative seeks to establish a stronger link between debt relief andsustainable poverty reduction programmes in recipient countries. This framework must includesupport for FAO WFS goals and the SPFS. Of the 23 LIFDCs with the highest prevalence ofundernourishment, 17 are in the HIPC group of eligible countries.
Debt relief helps countries access external financial resources by reducing their debt burdenand servicing commitments. This should release budgetary resources to meet priority developmentexpenditures. Moreover, debt relief would reduce the preoccupation with negotiating debt servicemodalities. Instead, it would allow relations with donors to focus on a long-term policy dialogue.
For countries not covered by the HIPC initiative, debt exchange operations could link debtrelief to targeted sectoral programmes. The IFAD has some experience in assisting developingcountries in negotiating debt transfers linked to Club of Paris debt relief operations. Similar debttransfer arrangements have also been negotiated in the context of debt restructuring or buybacksfinanced by the IDA and other donors.
Private sector participation in public goods and services
International public goods make an important contribution in sustaining the development process inthe developing countries. Specialized technical agencies of the UN system provide public goods in theform of technical assistance, advisory services and international standards. However, as conventionalODA ordinarily flows on a government-to-government basis, the financing of international public

…Investment in land and water 93
goods has tended to occur on an ad hoc basis. Structured funding mechanisms could provide systemicsupport for international public goods. This would require innovative mechanisms aimed at:
• integrating country-based financing with global and regional programmes;• leveraging public resources with additional private money;• a framework to align the incentives of countries with the global public interest through
standards, treaties and regulatory mechanisms.
Market distortions, imperfect access to information and uncertainty about cost-benefitrelationships have discouraged private sector participation. This area requires capacity building inentrepreneurial skills and facilities for financial services and working capital support. The privatesector does not find sufficient incentive to operate in remote rural areas with poor infrastructure.Decentralized financing mechanisms are needed to facilitate service provision, such as extension andmicro-credit.
Some national public goods affect the creation of international public goods. For example,planting forests helps reduce gas emissions. However, there is a distinction between the financing ofcore activities to create public goods and support for complementary activities for their diffusion anduse. Both types of activities may involve different types of financing mechanisms and cost recoveryor revenue generation modalities. Moreover, there is a real need for innovation to facilitate directfinancing of regional cooperation programmes.
The Clean Development Mechanism
Under the CDM, industrial countries could purchase rights to emit greenhouse gases from activities indeveloping countries. Emission rights trading is intended to ensure that emission reductions occurwhere they are cheapest to implement. The purpose of the CDM is, in part, to assist developingcountries in achieving sustainable development. However, its functioning has raised a number oftechnical and institutional issues.
The Prototype Carbon Fund
The Prototype Carbon Fund is a private-public partnership (sponsored by the World Bank) tofacilitate emission rights transactions between private investors and host countries. Through themonitoring, verification and certification of emission reduction, the fund could build trust betweenparties and so promote sound development of the market. The fund expects to attract additional publicand private resources and promote the transfer of environmentally safe technologies.

Funding investment in land and water…94
Climate change
The first session of the Conference of the Parties (COP 1) of the UNFCC identified three stages in theadaptation process:
• Stage I. Impact studies to identify particularly vulnerable countries or regions. Assessments ofpolicy options for adaptation, and appropriate capacity building.
• Stage II. Measures, including further capacity building, to prepare for adaptation.• Stage III. Measures to facilitate adaptation, including insurance.
COP 1 decided to fund the full cost of Stage I measures where these are part of the formulationof national communications (extended to Stage II measures in 1998). The Global EnvironmentFacility (GEF) has been financing climate change enabling activities. The UNFCC applies to activitiesto adapt to climate change. However, the financing mechanisms for these measures are not yet clear.Joint implementation as a flexible financing framework
Joint implementation originally referred to a generic family of institutional mechanisms that wouldallow parties to engage in cooperative (bilateral and multilateral) implementation of theircommitments. Such assistance could have three components:
• Assist with the implementation of sustainable agricultural development strategies, policies andactivities which would also have a positive impact on adaptation to climate change.
• Finance activities which specifically implement adaptation concerns.• Enable the sale of emission reductions by developing countries.
The Global Environment Facility and the Global Mechanism
The role of the GEF is largely catalytic, providing funding in the form of guarantees, concessionalloans and grants. The key features of GEF financing are:
• Financing of incremental costs linked to interventions that address global environmentalconcerns which otherwise would remain unattended in the national projects. Thus, the GEFhelps mobilize substantial cofinancing of resources relating to local/national investments.
• Pursuing global and local linkages with an emphasis on global benefits.• Promoting market-oriented policies in cooperation with both private and government partners,
with an increasing focus on programmatic funding.
The focal areas of the GEF are: biological diversity; climate change; international waters; andozone layer depletion. The GEF Council has decided in principle that land degradation should becomea focal area. It has also made the IFAD one of its executing agencies. This provides an opportunity forcloser collaboration between the Global Mechanism (GM), the IFAD and FAO to leverage GEFfinancing for the design and implementation of investment programmes linked to CCD. The GM is afacilitator for resource mobilization from multiple financing channels, seeking to promotepartnerships for financing CCD implementation. In this context, the GM has sought to forge closecollaboration with the GEF in:
• facilitating and generating a pipeline of projects and activities for potential GEF financing;• forging partnerships based on CCD’s cross-sectoral and participatory approach to land
degradation as an integral part of development strategies;• facilitating the mobilization of financial resources to cofinance GEF assistance.

…Investment in land and water 95
The development of a grant facility
Given the debt management problems of many developing countries, a grant facility can provideappropriate financing for many areas of investment, such as capacity building, institutional and policydevelopment, and other public goods and social capital. Many of these countries need extensivecapacity building support to implement their poverty reduction and agricultural developmentstrategies. In this context, the establishment of trust funds in the multilateral institutions (funded bybilateral donors) has become an important source of grants (Table 5).
TABLE 5Donor contributions to trust funds administered by selected international organizationsOrganization Most recent reporting
yearAmount
(US$ million)
Share of global orregional
programmes (%)
UNDP 1999 329.0 20
WHO 1998-1999 93.0 70
UNICEF 1999 601.7 4
Asian Development Bank 1999 135.3 25
Inter-American Development Bank 1999 25.4 80
World Bank 2000 1 301.0 55
CONCLUSION
For many developing countries, investment in land and water resources is crucial to their efforts toachieve food security and sustainable development. Such countries need to attract significantlyincreased funding. This calls for a fully integrated framework and innovative approaches to facilitatefinancial flows throughout the developing world, with greater private-sector involvement and anenabling role for governments.
Developing countries, international institutions and donors need to channel investmentresources to where they will be most effective in terms of achieving development goals. However,with the limited amount of public and private funding available, the emphasis has to be on a morerigorous prioritization of aid allocations and on the more effective use of aid resources. There is astrong case for including land and water resources as priority areas for ODA allocations within theframework of poverty reduction strategies.

…Investment in land and water 97
Quantifying investment needsfor agricultural development in Asia
PURPOSE OF THIS DOCUMENT
In order to support World Food Summit: five years later (WFS: fyl) and in particular to drawattention to investment needs in agriculture, FAO proposes a method to estimate investment requiredto accelerate agricultural development in Asia and the Pacific region particularly regarding land andwater development and production intensification. This method would enable ministries of agricultureto dialogue more effectively with designated national financial authorities regarding investmentrequirements for agricultural development. The methodology proposed is straightforward, transparentand adaptable to country circumstances.
Though empirical and still approximate, the advantage of the method over more globalapproaches is that it enables governments to track relationships between investment in a range ofselected items contributing to development (Table 3), and chosen development indicators such asgrowth, poverty reduction and food security. Attention is thus focused on trying to demonstrate howinvestment in agriculture influences development rather than assuming this the case. The method canbe tailored to individual country circumstances and choices by selecting a preferred developmentgoal, by including investment items most likely to influence the goal and by applying country-specificunit costs for each investment item. The method does not prescribe investment items or the source offunding for investment.
The method’s greatest value is likely to be that it provides the agricultural sector with aninstrument to quantify the likely costs and benefits of investing in the sector. Such quantification –particularly as it becomes more refined with use – should serve to strengthen agriculture’s case forgreater prominence in policy debates and investment allocation with those who control finances incountries, with donors and with potential investors. Greater insight into the linkages betweeninvestment in agriculture and desired development outcomes at country level will hopefully helpreverse the downward trend in agricultural investment which seems to have been little influenced bygeneral (though true), statements about the centrality of this sector for growth, development and foodsecurity.
________________________________________________________________________________
J. Poulisse, Senior Economist …Land and Water Development Division, FAO, Rome….
________________________________________________________________________________

Quantifying investment needs for agricultural development in Asia….98
The purpose of this document is thus to present the method to participants for comment, at thesame time requesting them to apply it at country level using national costs per item to thereby assistgenerating more reliable and thus credible global investment figures for Asia. The example used in thedocument to demonstrate the use of the method estimates agricultural investment needed for theRegion as a whole to achieve the WFS objective of halving the number of hungry people by 2015. Arange of investment items most likely to affect primary agriculture as well as food processing anddistribution are used, and estimated average costs per item are applied.
METHOD
Increased demand
It is assumed that WFS:fyl, is inspired, at least in part, by the need to improve the effectiveness ofefforts to achieve the goals of the WFS, particularly to reduce the number of hungry by half by 2015.
Since the purpose of the exercise is to develop scenarios for country specific investment inland and water development, and production intensification, additional food needs have to bequantified before possible investments to meet these increased needs can be established under variousassumptions. The purpose of the exercise is thus to estimate investment required to generateincremental production needed to meet the WFS goal by 2015 as illustrated in the 'on track' projectionin the following diagram.
SOURCE: The state of food insecurity in the world 2000, FAO

…Investment in land and water 99
TABLE 1Food production increments required by 2015 (%)
CEREALS OTHER FOOD LIVESTOCK TOTAL FOOD
Bangladesh 29 27 27 28India 6 5 6 5Nepal 12 9 13 11Pakistan 13 13 33 25Sri Lanka 7 3 6 5Cambodia 6 6 17 9China 28 10 12 15Indonesia 7 6 - 1DPR Korea 22 32 39 26Lao PDR 29 27 36 30Malaysia 6 13 10 11Mongolia 13 17 23 22Myanmar 5 13 - 5Philippines 16 12 26 18RO Korea 5 2 - -Taiwan 11 14 32 23Thailand 2 - 7 -Viet Nam 7 3 19 9
The anticipated additional demand for food is expressed by FAO in a revised per capita kcalfood intake for each country that would achieve the goal of halving the number of undernourishedpeople – assuming that the WFS target applies to each country and that the per capita calorieconsumption pattern remains the same as the base year (1995/1997). The Agriculture Towards2015/30 scenario is based on the UN 1998 Assessment for population projections and on FAOSTATdata as known in June 1999. It is currently being revised for the final AT2015/30 report. Theenhanced daily per capita calorie food intake is distributed proportionately over the 28 foodcommodities that constitute the FAO AT 2015/30food basket; i.e. no change in the composition of thefood basket is assumed. Additional per capita calorie intake is thus converted into volume of fooditems by allocating additional calorie demand proportionately to the food items in the 2015/30-foodbasket. This additional demand or enhanced daily per capita calorie food intake (consumption)multiplied by projected population size provides the anticipated increased demand for food at nationallevel.
Increased domestic production
The need for increased domestic production is arrived at by subtracting FAOs latest estimates oflikely food supply in 20151 from the anticipated increased demand for food. The portion of the 1Estimates of food supply in 2015 are presented in Agriculture Towards 2015/30, Technical Interim report,April 2000. However, data used by FAO are subject to continuous revision and only country specificinformation provided by countries can lead to greater accuracy. The estimates are in particular sensitive topopulation growth and the estimate used for daily per capita calorie food intake.

Quantifying investment needs for agricultural development in Asia….100
increased demand to come from increased domestic production is established by maintaining theprojected AT 2015/30 Self-Sufficiency Ratios (SSR) constant. Doing this assumes that net imports offoodstuffs will increase at the same rate as domestic production.
TABLE 2 WFS 2015 added land requirements ('000 ha, base AT2015)
COUNTRY RAINFED IRRIGATED
Bangladesh - 667
India - 1 870
Nepal - 51
Pakistan 314 755
Sri Lanka 15 0
Cambodia 95 9
China 237 -
Indonesia 701 403
DPR Korea 29 123
Lao PDR 118 6
Malaysia 112 -
Mongolia 0 0
Myanmar - -
Philippines 829 170
Republic of Korea 47 92
Taiwan 0 0
Thailand - 174
Increased production requirement to achieve the WFS goal for countries and commoditygroups expressed as a percentage of the projected AT 2015/30 year 2015 production is presented inTable 1. The increased production requirements itself vary, however, according to country specificplanning assumptions and is not presented here. In addition, ongoing policy and investmentinterventions, likely to have a substantial impact on eventual domestic production are not considered.It would appear that increased production to achieve the established goal, under the assumptionsmade, is substantial in most countries.
Yield increases and harvested land expansion
Increased harvested area (rainfed and irrigated) and higher yields provide the required increase inproduction by country. The AT 2015 Crop Growth Factors (yield increases and harvested landexpansion) for each of the 34 crops under the ‘business as usual scenario’ were used. Major effortswill also be required under the assumptions made to expand irrigated agriculture. Increased yields willalso need to be supported by increased fertilizer inputs. Fertilizer use in the region is low; however,farmers can only achieve higher ‘national’ yields when fertilizer use becomes more profitable. Thisimplies that increased demand for food becomes effective, that increased food supply originatesprimarily from domestic production and that improved fertilizer response, for which investment in soil

…Investment in land and water 101
fertility is a prerequisite, materialises. Increased fertilizer use to support the higher yields wasestimated using the procedures described in Fertilizer Requirements in 2015 and 2030, FAO 2000.
Investment
To relate increased production to investment, 27 capital items contributing to agricultural production,developed by FAO, are proposed. These cover resource and input requirements for primaryagriculture, marketing and processing facilities and include other elements of rural development suchas infrastructure. No direct provision has been made for investment in technology development andtransfer because of the difficulty of establishing a basis to estimate this for Africa as a whole.Individual countries may thus choose to add research and extension as a capital item contributing toagricultural development. When countries complete their cost table (Table 3), the compilation of theinvestment cost is straightforward (Table 4). A provisional indication of the magnitude of the requiredinvestment in land and water development as a percentage of the total investment in the primarysector (crop and livestock production) is presented in Table 5. It is again emphasized that these resultscome from indicative investment costs expressed in calibrated 1994 US dollars while some investmentitems have not been included at all due to lack of data. This points to the need for countries to use thebest information at their disposal when completing Table 3 to ensure a meaningful outcome.
TABLE 3Provisional average investment unit costs in 1994 US$
Average Unit CostINVESTMENTITEM
DESCRIPTION
US$ EastAsia
SouthAsia
Estimated separately for six land classes, each valued at itsspecific unit cost. Total unit cost shown is weighted average.No depreciation.
($/ha) 350 350
• Rainfed land: low rainfall ($/ha) 0 350• Rainfed land: uncertain rainfall ($/ha) 350 350• Rainfed land: good rainfall ($/ha) 350 350• Rainfed land: problem areas ($/ha) 350 350• Naturally flooded land ($/ha) 350 350
1. Development ofarable land undercrops
• (Irrigated) desert land ($/ha) 0 3502. Irrigationextension &improvement
Unit costs are region-specific. Unit cost show is weightedaverage. Depreciation rate is 2.4% per annum
($/ha) 2 750 2 750
3. Soil & waterconservation
25%of all non-irrigated land to be protected by 2015 (up from0.0% in 1988/1990. No depreciation.
($/ha) 150 150
4. Flood control20 to 60% (depending on region) of all naturally flooded landto be protected by 2015 (up from 10-30% in 1988/1990.Depreciation 2% per annum.
($/ha) 800 800
5. Establishment ofpermanent crops
Costs incurred from planting to bearing for citrus, other fruit,oil crops
($/ha) 2 500 2 500
6. Tractors &equipment
Standard units include 1 45 hp 4-wheel tractor 3-bottommouldboard plough, tandem disk harrow seed box trailer &(Near East only) 1 combine harvester per seven units. Unitcost shown is weighted average. Depreciation:12.5% perannum.
($/tractor)
25 000 25 000
7. Increasednumbers of draftanimals
Animal pairs; no depreciation. ($/pair) 800 800
8. Equipment fordraft animals
Standard set of plough harrow, seeding tube, 2-wheel cart.Depreciation rate 10% per annum.
($/set) 300 300
9. Handtools $17.60 per member of agricultural lab worker. Depreciationrate 20% per annum.
($/set) 25 25
10. Working capital 50% of the increased fertilizer nutrient cost taken asinvestment in working capital.
- 300 300

Quantifying investment needs for agricultural development in Asia….102
LIVESTOCK
Number of animals added to existing stock, Each animal isvalued at the product of its carcass weight & meat price(2 023, 2 032, 1 366 & 1 300 $/metric tonne respectively)• Cattle & buffaloes Each 200 200• Sheep & goats Each 80 80• Pigs Each 100 100
11. Increasednumber of livestock
• Poultry Each 1 112. Milk production Two-thirds increased milk production assumed from projects
needing investment of $528/tonne. Depreciation unknown.On-farm share assumed at 10%
$/mt 700 700
Sows are 15% of commercial pig operations. Pig operations togrow to 60% in 2010 (20% in 1989**); poultry to 70% (30% in1989**). Depreciation 5% per annum.Sow units $/unit 1 300 1 300
13. Housing,equipment forcommercial pig &poultry production
Birds $/bird 1 114. Development ofgrazing land
Land clearance & establishment of watering points. $/ha 80 80
15. Meat production Two-thirds added meat production assumed from projects withinvestment of 7 040 $/tonne. No depreciation could beidentified.
$/mt 4 000 4 000
16. Milk production Same rules as for item 12; Off-farm share assumed at 90% $/mt 700 700
STORAGE, MARKETING & PROCESSING
17. Dry storage All increments in production to be stored at investment costfrom $20/mt at farm level to $300/mt for upright silos. Crops:cereals, pulses, oilseeds, cocoa, coffee, tea, tobacco, cotton,sugar. Depreciation 2% per annum.
$/mt 130 130
18. Cold storage ofbananas, fruits &vegetables
1% of production to pass through cold storage; allowance forcold storage of livestock products in included in items 12, 13 &16. Depreciation 14.3% per annum.
$/mt 2 700 2 700
19. Rural marketing 25% of agricultural population to be served by 2010 (20% in1989**). Depreciation 2% per annum.
000$/unit
300 300
From 30 to 70% of production (depending on region)to behandled in such markets. Depreciation 2% per annum. $/mt 300 300Vegetables $/mt 1 601 1 141
20. Assembly &wholesale marketsfor fruits &vegetables Bananas, citrus and other fruits $/mt 1 569 1 12221. Transport ofagricultural products
40% of all products assumed transported an average 200km $/mt 200 200
All cereals used for food plus 25% of feed cereals milledlocally. Depreciation rate 5% per annum.
$/mt 120 120
Wheat $/mt 260 260Rice $/mt 100 100Maize $/mt 150 150Barley $/mt 150 150Millet $/mt 150 150Sorghum $/mt 150 150
22. Milling cereals
Other cereals $/mt 150 15023. Processingoilseeds
80-85% of all oilseeds crushed locally. Depreciation 8% perannum.
$/mt 180 180
24. Processingsugar crops
Cane & beet production (net of feed, seed) processed into rawsugar. Depreciation 6% per annum.
$/mt 2 300 2 300
25. Processingfruits & vegetables
1-2% processed for domestic use; about 12% of 1989**exports processed increasing at 6% per annum. Depreciation8% per annum.
$/mt 1 000 1 000
26. Ginning of seedcotton
All seed cotton ginned domestically. Depreciation 5% perannum.
$/mt 100 100
NOTE: * mt = metric tonne; ** Stoutjesdijck, November 1994 (1992 US$);

…Investment in land and water 103
TABLE 4Net Investment requirements US$ million (1994)
LAND & WATER CROP PRODUCTION PERCENTAGE
Bangladesh 1 503 9 433 16
India 3 328 22 925 15
Nepal 139 509 27
Pakistan 2 198 12 762 17
Sri Lanka 5 325 2
Cambodia 61 104 58
Indonesia 1 381 3 325 42
DPR Korea 349 1 647 21
Lao PDR 63 121 52
Malaysia - 2 124 -
Mongolia 0 43 0
Philippines 790 3 275 24
RO Korea 271 321 84
Taiwan - 18 -
Viet Nam 279 6 704 4

…Investment in land and water 105
Investing in irrigation and drainagein the context of water policy
and institutional reform
INTRODUCTION
Participatory irrigation management and irrigation management transfer reforms often have the statedobjectives of providing sustainable and adequate financing for operation and maintenance of irrigationand drainage services and of facilitating investment in the required rehabilitation or upgrading ofirrigation systems.
Overall reform of water resources management often encompasses these reforms. It oftenincludes demand management to encourage efficient water allocation and imposes new externalitieson irrigation systems in terms of environmental performance.
In Asia, where older public schemes reach the age of 30 to 40 years in most countries, theissue of rehabilitation, which is related to those of operation and maintenance and modernization, isbecoming increasingly important. While for some countries the extension of irrigated land stillrepresents an important part of irrigation programmes, in most countries rehabilitation programmesare taking on increasing importance. The content and orientation of rehabilitation in a context ofPIM/IMT will therefore be critical.
This paper reviews the concepts of irrigation management transfer, modernization andservice. The paper then examines IMT and PIM in the context of reforms towards integrated waterresources management. It is important to understand the actual characteristics and water managementin the systems that are being transferred. Thus, the paper reviews the actual systems as they exist andimpact and results of IMT and PIM programmes in the region and focuses more particularly on watermanagement for rice, which is the most important crop in the region. The paper then expands on thenotion and consequences of service orientation in irrigation and drainage, and examines requirementsin training and capacity building in the sector.
In the conclusion, some general findings and recommendations are made on investment inirrigation and drainage systems in the context of water policy and institutional reform.
________________________________________________________________________________
Thierry Facon, Water Management Officer…FAO Regional Office for Asia and the Pacific…
________________________________________________________________________________

Investing in irrigation and drainage in the context of water policy and institutional reform…106
In two separate annexes, the decline in public investment in the sector and the relationbetween irrigation and drainage development and poverty alleviation are discussed. Povertyalleviation is increasingly the overarching socio-economic development goal of countries and donors.
SOME DEFINITIONS
Irrigation management transfer and modernization
Irrigation management transfer (IMT) can be defined as the turning over of authority andresponsibility to manage irrigation systems from government agencies to water user associations. Thisinvolves two key roles: the authority to define what the irrigation services will be and the authority toarrange for the provision of those services. After IMT, the water users, typically organized into awater users association (WUA) decide what services should be provided, what their objectives andtarget should be, what service performance standards are acceptable. Arranging for the provision ofthose services includes choosing service providers and collecting whatever resources are required toimplement the desired services.
Modernization of an irrigation system could be defined as the act of upgrading or improvingthe system capacity to enable it to respond appropriately to the water service demands of the currenttimes, keeping in perspective future needs, or as a process of technical and managerial upgrading (asopposed to mere rehabilitation) of irrigation schemes with the objective to improve resourceutilization (labour, water, economics, environmental) and water delivery service to farms. The processinvolves institutional, organizational and technological changes. It implies changes at all operationallevels of irrigation schemes from water supply and conveyance to the farm level. The objective is toimprove irrigation services to farmers although improvements in canal operation will generally be acritical first step in the process. It is they who have to take the final decisions on the modernizationprogrammes and improvements should not stop at the canal level.
Modernization thus defined assumes that IMT has taken place and that farmers are in a positionto decided on the level of service they want and are willing to pay for. The term “modernization” referstherefore not only to the rehabilitation, upgrading or transformation of physical infrastructure inirrigation systems but also to innovation or transformation in how irrigation systems are operated andmanaged.
IMT programmes commonly include efforts to rehabilitate, upgrade or modify irrigationinfrastructure. They also often include efforts to introduce new management systems or proceduresthat are consistent with the expectations and constraints which result from IMT, such as serviceagreements, management audits, asset management and information systems. In the context of IMT,modernization is related to the process of transformation from supply-driven to service-oriented waterdelivery and to changes in governance of the systems for goal setting, which includes the decision onthe service to be provided by the system.
There is a general acceptance of the principle that water management institutions should beconsistent with hydraulic management units, either at the basin, system levels or within the systems,and in practice the configuration of the irrigation systems has had a great influence on the design onPIM/IMT programmes. Other important linkages are related to the setting of objectives for theirrigation systems. Relevant to IMT would be among others the determination of cropping patterns bya previously top-down institution and of the service to be delivered to farmers and on the other handthe necessity to manage water supply and drainage effluents in a river basin/integrated water resourcesmanagement perspective rather than for the single purpose of irrigating crops.Service

…Investment in land and water 107
The notions of water delivery service and of generalized service-orientation of institutions in theirrigation sector, whether river basin agencies, reformed irrigation agencies, irrigation serviceproviders or water users associations has become central in new concepts and definitions ofparticipatory irrigation management and irrigation management transfer. Literature on the evaluationof impacts of on-going participatory irrigation management and irrigation management transferprogrammes in terms of water service delivery, agricultural productivity and agricultural performanceindicates that improved service is a problem area. The sustainability of the water users associations ishowever now seen to depend on their capacity to provide an adequate water delivery service andcontrol and to allocate water and to provide an improved service to enable gains in agriculturalproductivity. This is essential for the capacity of farmers to pay water and for the water usersassociations to be financially viable. As a result, it is now recommended that strategies of gradualimprovement of irrigation systems be adopted to support the transfer of water managementresponsibilities and associated rights.
The concept of irrigation service was introduced in the 1980s together with methods toevaluate service quality. Service is not an abstract or generic notion: it can be qualified precisely interms of equity, reliability and flexibility as well as adequacy. The degree of flexibility in frequency,rate, duration is what distinguishes and characterizes classes of service quality from rotation to on-demand. Thus, the decision on the flexibility at all levels and ultimately at the farm is the mostimportant decision as regards service. Flexibility is most closely related to improvements inagricultural performance, crop diversification, etc. The service definition will also specify theresponsibilities of all parties (farmers, Water User Associations (WUAs), operators of the tertiarycanal, operators of the secondary canals, operators of the main canals, and project authorities) inoperating and maintaining all elements of the system. A main canal provides water, with a certainlevel of service, to secondary canals. Each upstream layer in a hydraulic distribution system providesservice to the layer immediately downstream of it. The actual levels of service at each layer must beexamined to understand the constraints behind the level of service that is provided to the field.
There is a wide range of levels of irrigation service, and the nature of the service may varysignificantly from a highly flexible service differentiated at the farm level to an inflexible serviceprovided on an undifferentiated basis to a large number of farmers. It is therefore important to qualifythe level of service. The levels of service may be different at each layer. It is also important not onlyto identify what the existing level of service is, but also what the expectations are at each layer ofoperation. In service-oriented water management, the decision on the level of service against the costfor providing this service, from ISP to WUAs and WUAs to users, is expressed through serviceagreements which are the foundation of an asset management strategy and managerial capacityupgrading programmes which are translated into financial plans. Service agreements may be amodality to force a negotiation on service levels and initiate a process towards a transformation oftop-down irrigation agencies by providing accountability and transparency.
PIM/IMT, MODERNIZATION AND INTEGRATED WATER RESOURCES MANAGEMENT
Irrigation sector reform and water sector reform
Participatory irrigation management lies squarely within an integrated water resources managementperspective and the policy and institutional changes that this new perspective demands. The growingunderstanding of the centrality of water rights and water allocation issues reinforces this integration.Clearer water rights and farmer participation in basin water resources management to facilitate moreequitable, more efficient processes to improve water use efficiency and reallocate water among usersbecome an important issue. The question of the restructuring and reorientation of the existing

Investing in irrigation and drainage in the context of water policy and institutional reform…108
Box 1Possible new roles for irrigation agencies
♦ River basin planning♦ Water resources allocation & monitoring♦ Development of new policies and regulations♦ Environmental monitoring and enforcement♦ Groundwater monitoring and control♦ Project planning, design and construction♦ Technology transfer to IA♦ Advisory services to associations♦ Monitoring of association performance♦ Arbitrating disputes
irrigation agencies towards assuming responsibilities in implementing water resources managementfurther strengthen these linkages.
The need for a long-term vision
Integrated water resources management is a continuing process that needs to be integrated intoeconomic development processes. In this context, it is necessary to have a long-term vision ofintegrated water resources management and of the transformations that will be required in each sector.
For this purpose, the validity of strategic planning approaches to identify actions that need tobe taken by each actor in each sector by redefining missions, goals, objectives, strategies and priorityplans for immediate action has been tested by FAO and ESCAP in four countries in the region:Malaysia, Philippines, Thailand and Viet Nam in 2000. This exercise was coordinated with the global,regional and national visioning processes animated by the World Water Council and Global WaterPartnership in preparation of and as a follow-up to the Second World Water Forum at the Hague,2000. This international initiate was taken with the objective of averting the looming water crisis andfoster immediate concerted action. At national round tables in 2001, four countries reconfirmed theirnational water visions (Box 2).
Considering the national vision and specific considerations of food security, agricultural andrural development, the countries have defined sectoral visions that encapsulated integrated waterresources management goals and developed priority action plans. Significantly, irrigationmanagement transfer and participatory irrigation management were high on the agenda in eachcountry. By applying strategic planning approaches to the irrigation sector, Viet Nam and thePhilippines found that mere rehabilitation of irrigation infrastructure would not be sufficient toachieve the vision and that the pilot introduction of modern water control and management conceptswas identified among the main priority actions. Modernization of irrigation systems is already anintegral part of Malaysia’s water resources management strategies and is one of the measures beingstudied at present in Thailand.
The study has shown that in practice several important issues need to be considered while oneanalyzes organizational change for participatory irrigation management:
• Arrangements will need to take into account water rights and allocations in a river basinperspective;

…Investment in land and water 109
• Modernization of irrigation systems can be understood as the combination of water managementstrategies and related institutional and technical solutions;
• An integrated water resources management perspective, even in the long term, requires changesnow.
Environmental externalities
Historically, modifications to irrigation projects have not given thorough consideration toenvironmental consequences. But scarce water and concern for environmental impacts increase theneed for improved on-farm irrigation management. Low irrigation efficiencies have been documentedin various projects, and improved irrigation efficiencies are often listed as a major source of "new"water. However, it is now evident that return flows from an "inefficient" project are often the supplyfor downstream projects, in the form of surface flows or groundwater recharge. Therefore, typicalproject irrigation efficiencies in the 20 to 30 percent range by themselves give no indication of theamount of conservable water within a hydrological basin unless that project is at the tail end of thebasin. Conservation (i.e. less spill, deep percolation, and seepage) within one project may deprive adownstream project of part of its accustomed water supply.
Most 'new' water for existing basins and projects will only appear if there is improvedirrigation water manageability by farmers. The potential sophistication of on-farm water managementis highly dependent upon the level of water delivery service provided to individual fields, which inturn depends upon the conveyance manageability within the complete water distribution system.
Box 2National Water Visions
Malaysia
In support of Vision 2020 (towards achieving developed nation status), Malaysia will conserve and manage its water resources to ensure adequate and safe water for all (including the environment).
Philippines
By the year 2025, water resources in the Philippines are being used efficiently, allocated equitably and managed sustainably with provisions for water-related disasters.
Thailand
By the year 2025, Thailand will have sufficient water of good quality for all users through an efficient management, organizational and legal system that would ensure equitable and sustainable utilization of its water resources with due consideration on the quality of life and the participation of all stakeholders.
Viet Nam
The Viet Namese Water Vision is the integrated and sustainable use of water resources, the effective prevention and mitigation of harms caused by water for a better future on water, life and the environment.

Investing in irrigation and drainage in the context of water policy and institutional reform…110
The critical importance of maintaining minimum flow rates and water qualities in naturaldrains and rivers is increasingly being understood. In the USA and Europe, for example, many recentirrigation system modernization efforts have stemmed from the need to reduce in-stream damage toendangered species of fish. In Malaysia, modernization strategies also incorporate similarenvironmental objectives for rivers. The quantities and timing of river diversions, and qualities andquantities of irrigation return flows, have a tremendous impact on the environment. Increasingly theissues will have to be explicitly dealt with by irrigation systems and farmers in the region. This isalready the case in some of the most economically developed countries, and will be a futurerequirement in other countries, which must be anticipated now.
IRRIGATION SYSTEMS IN ASIA
The actual irrigation systems
The concepts used for the development of irrigation by colonial powers were adapted to theconditions and to the objectives of irrigation in the past. Irrigation was extensive and the waterresources were not regulated by large storage reservoirs. The design standards adopted in manydeveloped and developing countries after the mid-1900s to deliver water according to crop demandwere conceptually more advanced. However most of them fail to meet that objective because of thedeficiencies of the water control technology and complexity of the operational procedures. Managingan irrigation system equipped with manually-operated gates at each branching point is a very complextask. In many cases, the systems were designed to be operated at full capacity without considerationfor operation at less than full supply. The use of technology with continually adjustable structureswhich has been the norm during the three decades of intensive development of irrigation indeveloping countries from 1960 to 1990 has badly affected the performance of irrigated agriculture inmany countries. Even the best qualified managers and operators would not be able to manage thesesystems to the highest standards. They simply cannot work. They are now impeding the transfer ofmanagement to user associations. They are being successfully automated in western countries but notin developing countries.
Box 3
Methods that yield "new" water
1. Improved Water Use Efficiency (WUE), where WUE is defined as
WUE = Crop Yield Irrigation Water Consumed
Improved WUE can come from improved use of rainfall, improved timing of irrigations to match critical stages of crop growth, improved investment in fertilizers, pesticides, and cultural practices, reduced waterlogging.
2. Improvements in the quality of surface return flows.
3. Reduction of deep percolation from farmer fields, and the associated reduction of nitrate leaching.
4. Reduction of on-field deep percolation destined for a salt sink.

…Investment in land and water 111
The farmers served by these systems responded to the economic changes and poorperformance or inadequate service by tapping additional water resources to overcome the limitationsof the existing systems, which were under sized for intensive irrigation such as the typical structureddesign systems or provided erratic water supply, to be able to adopt modern cultivation practices anddiversified cropping patterns: tampering of control structures, pumping from canals, drains, borrowpits, replacing animal-driven pumps by motor-pumps and more recently tapping groundwaterresources with a dense system of shallow wells or deep tubewells which provide the flexibility andreliability needed for modern irrigation at farm level. These responses from the farmers are inevitable.
If the water distribution rules define a pattern of water distribution that does not matchtechnically feasible and desired goals of the water users, the users will subvert these rules. This willlead to poor water delivery performance and increases in the cost of irrigation to users. Inconsistencyin the water distribution rules creates difficulties in system operations that are likely to lead toinefficient and inequitable water distribution performance. Especially inconsistency of rules betweenvarious levels: reservoir, main canal, channels is detrimental. Rules in channels cannot be followed ifthere is unpredictability of delivery by main canal.
Making water delivery match goals is important. The need for change in response to changingenvironment, changing agriculture, diversification, etc. requires adapting water distribution rules tochanging demands. The users, on the other hand, must accept the limitations on uses imposed bywater availability and the features of the system. These considerations call for a greater attention to ananalysis of operational rules at all levels in the system and particularly to a proper articulation ofoperational rules at the interface between the future irrigation service providers and water userassociations, to the necessity of improving operations in the upper levels of management if waterusers associations are to be in a position to develop applicable rules and procedures, and to thenecessity of incorporating at all levels production objectives of the farmers.
Very few countries have adopted the full spectrum of modern irrigation concepts andstandards. In a few cases, the design makes use of the most advanced technologies for water controlbut the water distribution strategy lacks the flexibility required for a service oriented delivery. In othercases, the technology is inadequate to satisfy the stated objective of modern irrigation. Morefrequently, neither the technology nor the strategy meets the definition of service orientation,including the projects with faulty designs, and operational procedures designed for the convenience ofthe operators, not of the users.
Initial system designs may represent a severe constraint to the adoption of new and moreflexible operational procedures. Many problems related to inequity and unreliability of water servicecan be attributed to design and operational procedures, which, if left unchanged, will produce thesame results whatever the governance setup. The question whether the technical/hydraulic dimensionof irrigation can be brought under the control of agents focused on non-technical user-derivedobjectives is central as is this would characterize a service-oriented management. The case forreassessing the design standards, configuration and operational procedures at the moment of transferas a result of a review or resetting of both internal objectives in terms of service with the water usersand external objectives with water resources management institutions is therefore compelling.
An appraisal of initial conditions and performance of the systems to be transfer would allowboth a better design and strategic planning of physical improvements together with a definition of theservice to be provided both by the irrigation service provider to WUAs and by WUAs to theirmembers, with indications on ways and means to achieve these service goals and improve them in thefuture, given the forces of change that effect the irrigated sector. To meet the conditions of the future,water delivery from irrigation projects should be more flexible and reliable. Operation rules should betransparent and understood by the users. As for requirements on system operations resulting from

Investing in irrigation and drainage in the context of water policy and institutional reform…112
integrated water resources management, water rights and the necessity to satisfy different water useswith same primary infrastructure are not the only issue. Water obligations related to disposal andquality of effluents, other environmental requirements are or will be part of the externalities imposedon system managers in all countries.
Groundwater and IMT
In many parts of the world, groundwater is a major emerging problem. In some areas, overexploitationis posing a major threat to the environment, health and food security. The explosion of groundwaterirrigation in some countries is a farmer response to the lack of flexibility and, in the worst cases, theunreliability of the canal irrigation systems. Water recycling and the conjunctive use of groundwatermostly happen as a desperate response from farmers who are unable to obtain their share of irrigationwater from the canal or from systems managers as a way to rectify problems of management capacityand shortcomings of the original design. The benefits that the changes have brought to farmersinclude increased quantity of water, increased reliability of water and freedom for the families tochoose their own crop strategies. Service requirements of the farmers are thus met, where possible,from other sources than the delivery of the main surface systems.
It is therefore perplexing that, in spite of an affirmed service orientation, IMT or PIMprogrammes often fail to take into account actual the service needs as expressed by farmers’ actualpractices and actual water management in the systems. New institutions appear to reflect the statedoperations of the canal systems and not appear the need for combined management of water delivery,drainage, water recycling and conjunctive use. Whether this is a threat to the viability of the waterusers associations should perhaps be given more attention.
On-farm irrigation technology
The slow adoption of new on-farm irrigation technology is a perplexing issue. A principal reason isperhaps that the focus of attention in developing countries has occurred at the farm level, and not atthe level of operation of the main and conveyance systems. Farmers will not invest in water savingtechnologies if the service of water is not reliable and if the incentives for saving on water, energy andlabour are not strong enough. Many important management objectives can only be satisfactorilyrealized if the main water distribution system is well operated, and only then high returns can beobtained from agricultural extension advice and the increased application of other complementaryinputs.
Rehabilitation and upgrading
What are the practices through which physical works are planned in PIM/IMT programmes?Particularly in Asia, the most common planning tool is the walk-through. Lack of farmer participationin design and construction has been identified as a problem area and design processes are meant to bemore demand-driven. The objective is to improve conveyance and reliability and reduce canalmaintenance requirements (drop structures, etc.). PRA mapping, transects, of land tenure, farmingsystems, ecosystems are also tools used on the field, mostly to prepare canal layout designs andidentify objectives of rehabilitation/improvement. In practice, a diagnosis of operation procedures isnot performed and operational rules and procedures are not really discussed or linked to identifiedworks. Physical works are not related to service or performance goals. As a rule, expectations are low.The initial focus on upgrading is generally on reliability and equity, which are admittedly the firstissues to address but there is generally no vision of future requirements. There is no discussion offlexibility, i.e. there is no discussion of the main aspect of service quality.

…Investment in land and water 113
There is still a significant knowledge gap on the impact of IMT and PIM in general. Howeverresults of recent impact evaluations and efforts to synthesize existing literature allow us to draw somegeneral conclusions on the impact of PIM/IMT programmes on the quality of water delivery service.However, as most of these programmes have included some measure of rehabilitation or upgrading orinfrastructure or on-farm infrastructure development, it is often difficult to separate farmers’involvement benefits from other changes such as rehabilitation.
Quality of operations and maintenance is often a stated goal of programmes, but most of theevidence is qualitative statements. General impression is that after turnover, services havesubstantially improved in regard to timeliness, reliability, and equity.. Increases in irrigated area andcrop intensity are mentioned in many instances. Flexibility is not a service characteristic explicitlyinvestigated but some results in terms of timeliness and adequacy are registered. Improvements interms of water use efficiency are more uncertain.
In Asia, impacts are typically not noticeable in terms of agricultural performance: change inirrigated area, crop patterns, cropping intensity or yields, PIM has neither improved nor interferedwith agricultural productivity. The future of farming is seen to depend on diversification of crops anda more commercial orientation. Diversification makes irrigation management more complex.Irrigation systems may not have enough capacity to deliver water for other crops or irrigationpractices or may need to be operated differently. Greater reliability may be required, throughimproved main system operation or through more flexibility for farmers to locally distribute wateraccording to their needs. The necessity of reengineering irrigation, i.e. taking a fresh look at keyprocesses and how they can best be carried out and of considering both hardware and softwareelements is emphasized as irrigation becomes more commercial but is in apparent sharp contrast withdesign processes and their outcomes.
PIM has generally led to modest efforts by farmers to improve management efficiencies andresponsiveness. Significant future expenditures loom in the future unless observed under-investmentin O&M is halted. It is therefore recommended to replace periodic rehabilitation with ongoinginfrastructure improvements jointly financed by government and the farmers, with the objective toimprove performance and ensure financial viability and physical sustainability of irrigation. An issuefor the sustained success of participatory irrigation management is therefore the availability offinancial instruments that allow farmers to invest in the upgrading of their irrigation systems.Decentralized irrigation improvement funds are increasing proposed in IMT programmes. Requiredsupport services could be: assessment of system facilities, credit, and design and constructionassistance. The assessment can be done jointly by agency and WUA or contracted out: annualmaintenance planning, selective improvement, planning whole-system rehabilitation.
Low productivity is also often associated with small farm size, a subsistence orientation,production of low value crops such as grains, inappropriate agricultural policies, a poor naturalresource base, and inadequate agricultural services. It is necessary to address these issues or provideassistance through other agencies for production increase, or to subsidize the association. For farmers,the second-generation IMT problem is to increase farm productivity to pay higher irrigation fees andto take advantage of possible improvement in irrigation service quality.

Investing in irrigation and drainage in the context of water policy and institutional reform…114
Type of investment projects
Lending for irrigation has progressively changed over time from a project-specific nature ofinvestments to take the form of sector loans or national/regional in scope projects supporting theobjectives of participation and capacity building. These projects often combine a mix of low costrehabilitation projects and management reforms with attention to improved operation andmaintenance and user participation. Low cost rehabilitation of irrigation infrastructure, in some casesan investment to catch up years of differed maintenance, cannot correct the deficiencies of the originaldesign, if the causes of deficiencies are not identified through an in-depth diagnosis of the currentsystem. In Asia, where the older public schemes reach the age of 30 to 40 years in most countries, theissue of rehabilitation is becoming increasingly important. In theory, rehabilitation provide anopportunity to take into account the management patterns of operators and irrigators. In practice,however, rehabilitation simply re-establishes the physical configuration of the original system. Thecontent and orientation of rehabilitation in a context of PIM/IMT will therefore be critical.
Towards gradual improvement strategies
PIM has generally led to modest efforts by farmers to improve management efficiency andresponsiveness. Under-investment in O&M is also observed. It is therefore recommended to replaceperiodic rehabilitation with gradual on-going infrastructure improvements, with the objective toimprove performance and ensure financial viability and physical sustainability of irrigation. Financialinstruments that allow farmers to invest in the upgrading of their irrigation systems become critical.Decentralized irrigation improvement funds to provide matching funds from Government areincreasing proposed in IMT programmes.
Other regions have often adopted a radically different approach
In contrast with this model, IMT in other regions has often taken a very different shape, with adeliberate effort to change the control logic of the systems from the top down and the transfer of largeunits of the systems to large water users associations. IMT has been more engineering driven, and thisis the main difference with Mexican, Turkish and US experience. The issue is whether basic flaws orconstraints can be addressed with a light rehabilitation programme and whether not doing so hampersIMT/PIM or jeopardizes the success of reform in terms of sustainability of institutions and financialsustainability.
Toward new forms of IMT
WUAs as business enterprises are increasingly seen as a potential solution in the region, perhaps as areflection of Latin American experience, and the question whether they might deliver other services tofarmers is important in the debate on PIM reform. The formation of pilot farmer companies in twosystems in Sri Lanka represents a paradigm shift, from PIM as joint management to the formation ofthe farmer company: agribusiness development and irrigation management turnover, in open-marketeconomy, with irrigation more than a subsector of agriculture, but seen in tandem with trade,commerce and industry. Water is seen as a commodity and no more tied to land and is transferable.
The farmer company is the institutional mechanism for commercialization of farm operations.Distributary canal organizations will continue to function for water management and O&M.Resources allocated by government for O&M will be advanced to the company which will have fourdivisions: irrigation, primary production, commercial, finance and administration. The irrigationdivision will be responsible after transfer of management of the system and provide water rights basedon land entitlement.

…Investment in land and water 115
PIM in Sri Lanka has failed to have results in terms of O&M, water management orproductivity, so to implement participation systematically, organizations need a critical mass ofmutually reinforcing practices, a participative system with an eye on the product and market. It istherefore necessary to shift the focus of PIM to agriculture as an enterprise resulting in a phasedturnover of the irrigation system in totality. New suggested management strategies are significant(conjunctive use, etc.). It is suggested that this pilot experience may be a laboratory for larger Asiancountries.
Second-generation problems: required services to water users associations and farmers
Among the major second-generation problems for associations, the most significant are: insecurewater rights, financial shortfalls, rehabilitation and the lack of financial and administrativemanagement expertise
For farmers, the second-generation problem is to increase farm productivity to pay higherirrigation fees and to take advantage of possible improvement in irrigation service quality: productioncredit; extension service; new technologies; markets and market information; access to inputs; post-harvest services
All irrigation systems require periodic rehabilitation and modernization. If WUAs deferrehabilitation, they will also not upgrade the systems. Many authors suggest that sharing costs ofrehabilitation is appropriate. Required support services to water users associations would be theassessment of system facilities and credit and design and construction assistance.
Assessments may be done jointly by the individual agency and WUA or contracted out:annual maintenance planning; selective improvement; and planning whole-system rehabilitation.Assistance in selection and supervision of consultants and contractors can be facilitated at the level ofthe federation of WUAs to individual WUAs.
RICE
Rice in Asia
In most of Asia, rice is not only the staple food, but also constitutes the major economic activity and akey source of employment and income for the rural population. Water is the single most importantcomponent of sustainable rice production, especially in the traditional rice-growing areas of theregion. Reduced investments in irrigation infrastructure, increased competition for water and largewater withdrawals from underground water lower the sustainability of rice production. However,despite the constraints of water scarcity, rice production must rise dramatically over the nextgeneration to meet the food needs of Asia’s poor. By year 2025, rice production in Asia must increaseby 67 percent from the 1995 production level in order to meet the increased demand for this cerealwhich is the staple for more than one-half of world’s population. Producing more rice with less wateris therefore a formidable challenge for the food, economic, social and water security of the region.
About 80 to 90 percent of all freshwater resources used are for agricultural purposes and morethan 80 percent of this water is used in irrigating rice. In other words, the efficiency of water use inirrigated rice production systems must be significantly increased. The existing strong interdependencebetween water use in the crop production subsystem and the operation of the irrigation facilities forwater service elicits the need for pursuing a comprehensive agenda for improving the performance ofrice irrigation systems.

Investing in irrigation and drainage in the context of water policy and institutional reform…116
Diversification
Since no major net addition to currently irrigated rice areas is expected in the coming decades andmajor breakthroughs in raising yields of rainfed rice systems are unlikely to be available during thisperiod, most of this additional rice will have to be produced in irrigated areas. In rice irrigationsystems, rice monoculture is overwhelmingly the dominant practice. Diversification of the cropproduction system in these areas is desirable for several reasons. First, diversification will openopportunities for increasing farmers’ income from their limited land resources. This is particularlyimportant at the present time when profits from rice culture are very low and declining. Second, it isincreasingly evident that, as productivity of the land under rice monoculture under wetland conditionsis declining over time, a diversified agriculture will be more sustainable in the long run. Third, withincreasing scarcity of water, irrigated agriculture will have to aim at maximizing return to water ratherthan return to land. Present rice culture systems require more water than most other food crops, bothin terms of quantity of food and calorie produced. Therefore, a major scope exists for increasingreturns from water by growing diversified crops, especially in areas of water shortage. To enablefarmers to diversify their cropping pattern, they must be provided with facilities to exercize cropchoice options, which is presently lacking in most rice irrigation systems.
Upgrading rice schemes
The task of upgrading or modernizing an irrigation system for rice cropping in the wet season and fordiversified cropping in the dry season is complex. It requires that any permanent structural or physicalupgrading to be done for rice must also conform to the requirements of the diversified crops to begrown in the dry season. It is therefore logical to assume that the upgrading of common denominatorfactors, i.e. factors that are relevant for both seasons, could be upgraded permanently and these shouldbe handled by the main irrigation system. Examples of these would include upgrading of watercontrol, drainage, reliable schedule of water delivery, etc. at the main system. The on-farm, crop-specific factors could be handled seasonally by the farmers themselves as individuals or as groups.Examples of this type of upgrade would include the same items, as above, but at the farm level.Provision of flexibility will become an additional requirement.
Reliable water supply is critically important for diversified cropping, as farmers have toinvest much more for these crops compared to rice. Areas that are far from the irrigation sourcegenerally suffer more water shortage in the dry season compared to near-by areas. Means ofaugmenting water supply in these areas, if they are suitable for diversified cropping, have to be found.Shallow groundwater development through the private sector is often the most reliable and affordablewater source for this purpose. Groundwater has the advantage of being available on demand at thefarm and able to avoid major water distribution problems.
Suitable methods of water application to the crop (e.g. basin, furrow or basin-cum-furrow),methods of controlling seepage from canals or neighboring rice areas (e.g. dykes, interceptor channel,dyke-cum-interceptor channel), or means of drainage enhancement (e.g. collector gravity drain,pumping, collector-cum-pumping) will be required. Diversified cropping requirements must bethoroughly considered in pursuing the modernization process, with the objective of raising farmers’incomes through provision of flexibility and option to choose crops in the dry season.
Water management for rice
As far as rice water management itself is concerned, whether one aims at raising water productivity orwater use efficiency, it is now widely accepted that a river basin perspective should be adopted withmuch more attention being paid to defining the boundaries of intervention (farm, system, basin).Substantial progress has been made in defining concepts and methodologies (water accounting,

…Investment in land and water 117
modeling, etc.) but available data, which are already woefully inadequate to assess the merit ofinterventions at the farm or system level, water abstraction and even cultivated and irrigated areas, areeven more lacking for the adoption of integrated river basin approaches. More attention must also bepaid to water quality issues and particularly the release of pollutants (fertilizers and other agro-chemicals) and salt concentration.
Nevertheless, practices which minimize irrigation inflow are of a direct interest to farmerswho see their water supply rationed and have to pay an increasing share of its cost, for managers anddevelopers who also face rationing because of degradation of water resources, dam siltation, transferto other sectors, etc. and have an interest in minimizing pumping costs, and operation andmaintenance as well as development costs, and indeed for water resources managers who need to planfuture irrigation developments with minimum environmental impact from withdrawals or reservoirs.In addition, many major rice-growing areas are located in coastal plains. Furthermore, water savingpractices, which require greater water control, typically are associated with or part of packages toimprove agronomic practices and the efficiency of use of other inputs, and therefore play an importantrole in total factor productivity. They therefore contribute to increasing not only water use orirrigation efficiency but also to improving or sustaining water productivity. Indeed, watermanagement methods, which improve water use efficiency, have been developed with a view tomaintain crop yields and actually, when implemented properly, lead to yield increases (in the range of15-20% in China for intermittent flooding and other methods). It follows that, although it is correctand necessary to use rigorous concepts for efficiency and performance at system and basin levels, andto determine under various conditions the optimum combination of improved technologies and watermanagement practices that can meet water demand with least water consumed and managing returnflows to ensure system and basin level efficiency, in practice it is difficult to find water managementtechniques proposed for adoption at the farm level which do not simultaneously raise irrigationefficiency and water productivity.
The range of possible strategies and their effect on various components of irrigation inflowrequirements can be summarized in Table 1. The acceptance by farmers of the strategies and practicesin Table 1 will of course depend on economic factors. Furthermore, they depend on improved watercontrol and management of water at the system level, as well as adequate irrigation (in particular areticulated irrigation distribution system) and drainage facilities. Their availability in China hasallowed farmers to adopt the water savings techniques described above. However, typically, at thatlevel, conveyance, field canal and distribution efficiencies are particularly sensitive to the quality ofmanagement, communication and technical control. When water supply within the system isunreliable, farmers try to store more water than is needed. In many large irrigation systems, fewcontrol structures at any level and poor drainage structures and poor drainage networks contribute to awaste of water.

Investing in irrigation and drainage in the context of water policy and institutional reform…118
TABLE 1Rice, water management and irrigation strategies
PRACTICES T E S&P SRO RCL
Developing improved varieties x
Improving agronomic management x
Changing schedules to reduceevaporation
x
Reducing water for land preparation x x x
Changing rice planting practices x x x
Reducing crop growth water x x x
Making more effective use of rainfall x x
Water distribution strategies x x x
Water recycling and conjunctive use x
Being confronted with this rather large number of problems, it is not surprising that farmersare reluctant to shift to more demanding water management techniques than flooding. However,considering the growing water scarcity and pressure on the irrigated subsector within the water sectorand on agriculture by other sectors of society and overall economic development policies described inprevious sections, there is not much choice and farmers must be provided both with a conduciveenvironment and a proper production tool, i.e. better performing irrigation services.
Improvements in the operation and maintenance of rice irrigation schemes throughrehabilitation of the deteriorated systems, improvement of irrigation infrastructure for surfaceirrigation, irrigation management transfer, modernization, combining to various degrees institutional,organizational and technical changes, have been attempted in the region with mitigated degrees ofsuccess. Studies undertaken by the World Bank in recent years have evaluated the impact of irrigationprojects. A study of 1995 evaluated the design of rice project in the humid tropics and concluded,from the strong degree of resistance of farmers to new design standards and the level of anarchy andchaos observed on the schemes, that the more reticulated systems, capable of supporting on-demandwater delivery, were not appropriate under these climates. A more recent study (1997) assessed theagro-economic impacts of investments in gravity-fed irrigation schemes in the paddy lands ofSoutheast Asia, to determine whether and how the quality of O&M services influences thesustainability of those impacts.
At four of the six sites, the areas supplied by the irrigation systems were significantly lessthan planned. Cropping intensities were also substantially lower than expected at three sites andfalling at a fourth. Only one scheme had attained both its area and intensity targets. Paddy yieldsvaried widely —between schemes and in comparison with expectations— but a weighted average forthe wet and dry seasons at all the schemes was about 3.3 tonnes, or 85 percent of appraisalprojections. However, farmers had not diversified out of paddy. Indeed, the concentration on paddyhad increased. Output was between 32 and 73 percent of appraisal estimates for five schemes. Thereturns had also been driven down by the decline of the international price of rice.
Overall, agency and irrigator performance appeared to be substantially better than expected.Farmers cooperated to achieve at least basic O&M objectives regardless of the level of maturity of theformal organization. There were no substantial negative constraints on irrigated productionattributable to poor performance in O&M. Those O&M operations that are essential to keep sufficient

…Investment in land and water 119
supplies of water flowing to the great majority of the fields were adequately carried out. The studyalso noted the dismantling of complex technological control systems installed in the 1980s in favourof fixed structures that have no adjustments and structures that adjust automatically to changes inwater levels; the rejection by farmers of both rotations and gates. Rotations do occur, but they tend tobreak down under conditions of shortage, which is when they are most needed.
The main finding was that given that they offered poor economics and low incomes, thesepaddy irrigation schemes faced an uncertain future. Small-holder irrigated paddy could no longerprovide the basis for a growing, or even stable, household economy, driving younger family membersoff the farms while older members who stayed behind concentrated on basic subsistence crops, socialcapital would erode and O&M standards were likely to suffer. As economies expanded, irrigatedpaddy would not be able to compete with the incomes to be had from other employment opportunities.Improved O&M performance would not rescue them.
The study recommended that:
• Sharpen the response to O&M failures by disaggregating O&M; identifying the poorlyperforming components; and dealing with disincentives specific to each, such as the tertiary gatesthat farmers below consider unfriendly.
• Simplify the infrastructure and operations technology by converting to fixed and automaticcontrols that need less human intervention and by supporting authorities that plan with the farmersto abandon equitable rotations by rationing water during emergencies.
• Promote the transfer of management to farmers and their WUGs judiciously by recognizing thatorganizing user groups pays off, but also accepting that immature WUGs cannot handle somemanagement responsibilities.
• Improve household earnings by diversifying cropping systems and supporting research, extension,and marketing services keyed to specialty crops and integrated, high-value farming.
The findings and conclusions of these two studies, combined with the results of the evaluationof modernization projects conducted by IPTRID in 1998, seem to be rather pessimistic andcontradictory. However, put together, they tend to indicate that present project designs or operationsare not capable of supporting both economically and technically the intensified, diversified and morewater efficient and productive rice production systems which will be required in the future. They alsoseem to indicate that purely software solutions or mere improvement of operation and maintenance donot deliver the expected results in terms of improvements in performance and yields. They also revealthat many modernization or improvement efforts have been inappropriate, poorly adapted to localcircumstances and the specific character of rice-based production systems, and incomplete orfragmentary. Conjunctive is practiced within “modern” irrigation schemes: it may provide a solutionbut is not available in all places.
TOWARD SERVICE ORIENTATION
Design processes
Performance of irrigation projects is determined by a combination of physical, institutional and policyfactors. The gap between potential and actual outcome is strongly related to over-optimisticassumptions of the hydraulic performance at planning stage, and in a number of cases to faulty andunrealistic designs as well as construction. The performance of operation of irrigation systems isinfluenced by the capacity of the management agency to apply the operational rules defined by thedesigner. Many designs are difficult to manage under real field conditions. The professional contextexplains why design irrigation engineers know little about actual distribution processes. Some of the

Investing in irrigation and drainage in the context of water policy and institutional reform…120
reasons lie in administrative and behavioural reasons, mostly associated with the lack of experience,effective accountability and feed-back from operation of design engineers, whether in irrigationagencies or in local and foreign consulting firms, in lending policies of financial institutions, in lackof accountability of operators and managers to the users. In countries with large development ofirrigation, the state officials have often entrenched engineering practices. The planning, design andconstruction process must produce a system and conditions capable of accommodating effectivemanagement practices. IMT provides an opportunity to correct the administrative and behaviouralreasons at the stages of design, construction and operation.
Modern design is the result of a process that selects the configuration and the physicalcomponents in light of a well- defined and realistic operational plan, which is based on the serviceconcept. It is not defined by specific hardware components and control logic, but use of advancedconcepts of hydraulic engineering, agronomy and social science should be made to arrive at the mostsimple and workable solution. The most important issue is the system ability to achieve a specificlevel of operational performance at all levels within the system. A proper operational plan is theinstrument that combines the various perspectives and helps reconcile conflicting expectationsbetween the users, the project manager, the field operators and the country policy objectives. Thesecond step is the planning of an irrigation project is the decision about water deliveries i.e. thefrequency, rate and duration of water deliveries at all levels of an irrigation system.
A water delivery schedule does not necessarily imply a specific design. A rigid schedule ofwater deliveries to the farm turnouts may use modern irrigation hardware and computerized decisionsupport systems to make the water deliveries reliable and equitable, but a project designed for rigidrotation through simple non-adjustable structures or for proportional distribution cannot be operatedfor flexible water distribution. To a large extent, the layout, original design criteria and standards usedfor an irrigation project limit the options for its rehabilitation and modernization. In extensiveirrigation projects with the objective of thinly spreading water, the design capacity decreases fromupstream to downstream. Traditional delivery systems have no or little flexibility built into them anddo not attempt to match water deliveries to crop needs. In responsive irrigation projects, the designcapacity increases when moving downstream to accommodate the need for flexibility.
Key elements of sustainable service oriented I&D management
Sustainable service oriented irrigation and drainage management can be characterized by thefollowing:It is output-oriented: the cost of the service provision is based on well developed operation and assetmanagement programmes; It involves users to determine levels of service and the associated cost ofservice
The irrigation and drainage organization should be able to recover the cost of serviceprovision either from direct consumers or from subsidies; and it relies on an appropriate legalframework that provides protection for users, the organization providing service and the generalinterest of society
The decision on level of service
The level of service consists in a set of operational standards set by the irrigation and drainageorganization in consultation with irrigators and the government and other affected parties to managean irrigation and drainage system. It must emerge from an extensive consultation process. It shouldbecome a series of norms (targets) against which operational performance is measured. It must berevised on an on-going basis to respond to changes in irrigated agriculture and requires carefulconsideration of the cost associated with specific levels of service. A strategic planning and

…Investment in land and water 121
management approach is recommended. The formulation of level of service specifications is thecentral decision for strategic planning and future operation and management.
Service agreement
It is necessary for all service relationships to define services (transactions) and the conditions attachedto them, and payment required for obtaining these services. These must be stated in quantifiable andmeasurable terms that are easily monitored and controlled. These can be formulated in serviceagreements in the form of contracts that contain details on the level of service to be provided by theorganization, the obligations of customers and the organization and the process for resolution ofconflict should these arise.
For a new or rehabilitated irrigation and drainage scheme the following process could beapplied:
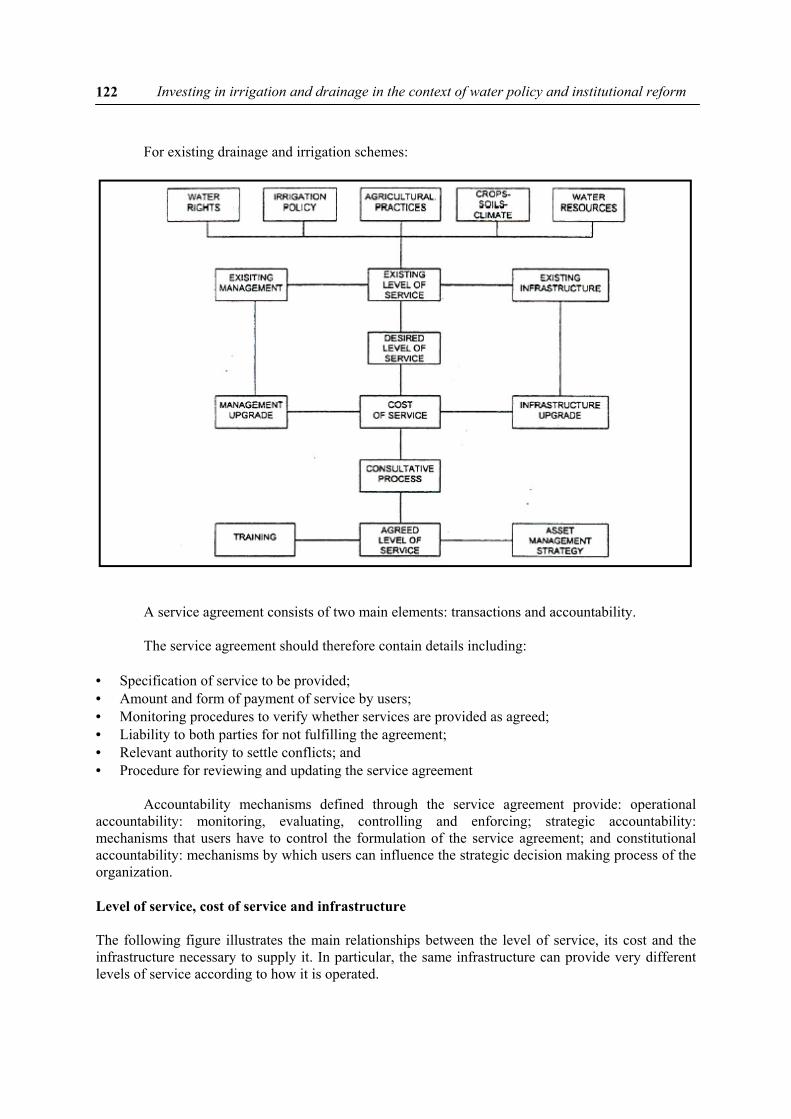
Investing in irrigation and drainage in the context of water policy and institutional reform…122
For existing drainage and irrigation schemes:
A service agreement consists of two main elements: transactions and accountability.
The service agreement should therefore contain details including:
• Specification of service to be provided;• Amount and form of payment of service by users;• Monitoring procedures to verify whether services are provided as agreed;• Liability to both parties for not fulfilling the agreement;• Relevant authority to settle conflicts; and• Procedure for reviewing and updating the service agreement
Accountability mechanisms defined through the service agreement provide: operationalaccountability: monitoring, evaluating, controlling and enforcing; strategic accountability:mechanisms that users have to control the formulation of the service agreement; and constitutionalaccountability: mechanisms by which users can influence the strategic decision making process of theorganization.
Level of service, cost of service and infrastructure
The following figure illustrates the main relationships between the level of service, its cost and theinfrastructure necessary to supply it. In particular, the same infrastructure can provide very differentlevels of service according to how it is operated.

…Investment in land and water 123
FIGURE 3 Levels of service
Management of irrigation systems
Each level of service, to be achieved, depends on operational parameters. Requirements in terms offlow control systems and human resources must be clearly understood and planned for. It is alsonecessary to understand the internal mechanisms of irrigation systems, and to provide selectiveenhancement of those internal mechanisms, if irrigation project performance is to be improved. These'details' are so important that it has been argued that investments must be based on specific actions toimprove them, rather than deciding on the framework for detail improvement only after theinvestment is approved.
Management of irrigation systems in a business and service oriented mode is also a complexoperation. It requires advanced managerial skills and the ability to process and interpret large amountsof data. A feature of modern design and operation is often the minimization of the collection of largeamounts of data for statistical analysis while information needed for operation increases. For examplewater requests and water deliveries have to be recorded and matched with conveyance capacity,seasonal water allocation and total water availability. Water deliveries have to be converted intofinancial transactions. Payrolls and financial assets have to be managed as well as stocks, spare parts,vehicles and construction equipment. Maintenance programmes have to be implemented and closelyfollowed.
Modern information and management systems are imperative to assist managers inperforming efficiently their tasks. These tools can be used irrespective of changes in managementstructure, but the needs will also be felt by WUAs. The availability of management support tools canbe seen as a means to facilitate their taking over their new managerial responsibilities.
Monitoring and evaluation
The effects of any programme that modifies the organizational arrangements for providing the servicemust be evaluated in terms of the quality of that service. In a typical IMT monitoring and evaluation

Investing in irrigation and drainage in the context of water policy and institutional reform…124
system, key issues about outcomes and impact include as potential immediate outcomes the quality ofthe water delivery service. Possible eventual impacts are related to socio-economics and productivity.Potential areas of interest for water users are estimated to be the quality of O&M, the cost of O&M,the use of funds collected, agricultural and economic productivity. Impacts, which are the indirect orultimate effects of an intervention, include cropping intensity, number of crops grown, if design andoperational rules are performance-oriented. M&E is meant to provide information but also tostrengthen local management capacity, enhance skills and support problem solving by WUAs.Standard tools are: walk-through and inspection of irrigation systems, planning maintenance orrehabilitation priorities, preparing O&M plan, supervising field staff, conducting technical audits.
In the service concept, the outcome and impact indicators listed above are actually thespecific objectives of service-oriented management. Indicators can be classified as indicators forcomparing the performance of irrigated agricultural systems, or external performance indicators, andinternal process indicators. External indicators examine values such as economic output, efficiency,and relative water supply (i.e. ratios of outputs and/or inputs). Targets are set relative to objectives ofsystem management, and performance measures tell how well the system is performing relative tothese targets. These performance indicators are primarily applicable to compare actual results withwhat was planned – say, to compare outputs from a project before and after. The objective of internalindicators is to assist managers to improve water delivery service to users. Internal indicators includeindicators to concretely measure service at all levels and could be very useful in M&E systems asservice is generally assessed simply by sampling or polling.
Irrigation management audits, asset assessment and management, benchmarking
Benchmarking, which uses primarily external performance indicators, could be introduced as a wayfor continuously assessing management performance before, during and after IMT and maintaining adynamic of improvement. Irrigation management audits can be used to assess performance accordingto key indicators listed in a service agreement.
Where infrastructure is still owned by the government after IMT, they can be a joint exercisebetween the irrigation agency, WUA and local government to assess governance and serviceprovision, including technical, financial and organizational aspects. A prerequisite for managementaudits is a detailed initial assessment of assets to be transferred with their condition and functionality,and systematic monitoring of assets through detailed survey and monitoring.
Design and operation for IMT
Management of a relatively large system is generally divided between various units. The locations ofthe interfaces between these levels have an important influence on the way the system is operated andits hydraulic performance. If management of the main system must be divided between units, theinterface should be located at hydraulic 'breakdowns' such as reservoirs. The trend is to transfer themanagement of large sections of irrigation systems to large user associations, such as in Turkey andMexico. The contractual approach to bulk supply provision or irrigation service provision may requirechanges in hardware and operational rules at the interface between the management levels. Precise, butuser-friendly, control of flows and measurements of volumes is needed. Reforms often include theestablishment of water rights and trade of these rights, and the pricing of water on a volumetric basis.The design of irrigation projects should take these reforms into consideration. A rigid system withfixed distribution structures is not compatible with water trading. Measurement and control arerequired where trading is expected to occur. The layout of the canal network should also be designedso as to be integrated with not only the roads and drainage system, but also with the multi-level ofmanagement, whether from the agency or user associations.Economic evaluation

…Investment in land and water 125
Conventional economics use a high discount rate for future costs and benefits and fail to show theimportance of maintenance in sustaining the life of a system and the livelihood of farmers. The resultis a that a project with a low initial cost, which deteriorates quickly and is dependent for continuedsurvival on timely and properly funded maintenance, or with high operation costs (pumping schemes)is preferred to one that is constructed to need less maintenance or lower operation costs because itappears cheaper. Such a project may not sustainable without government subsidies, and will have tobe abandoned unless governments keep a policy of subsidizing irrigated agriculture. Subsidies do leakto non-poor But lack of subsidies (or too low) may mean farmers – especially poor farmers – becomeunable to pay the full cost of water fees (especially if for example, prices fall as they have done forstaples) and so unable to support private sector involvement. On the other hand, too muchsubsidization may mean investments are made in poor-quality projects, with low rates of return.
THE NEED FOR SUPPORT SERVICES AND CAPACITY BUILDING
Political commitment and a legislative framework are important to provide the basis for institutionalreforms, but efforts devoted to institutional development and capacity building can determine to aconsiderable degree the success or failure of the devolution process. Defining which support servicesare essential to be provided is an essential step in the IMT process. Such services may includecapacity building in managerial, financial and regulatory needs of water users associations as well astechnical support for irrigation system operations, maintenance, rehabilitation and upgrading. Trainingof service providers should be an important part of the IMT process. However, support services is acritical component that is sometimes overlooked in the design of IMT programmes which havelimited funding for capacity building. This section examines the type of support services needed forwater users associations and farmers within irrigation systems and irrigated agriculture.
Support services after IMT
Capacity building is a long-term process and should not stop with the formal transfer of managementresponsibilities. Unfortunately, funding and support programmes are often limited to the IMT processand WUAs are left at a critical stage without much further support, endangering the sustainability ofthe WUAs. The different support services which may be needed after IMT are indicated below.
Support services offered by the WUA
Sustainability of water users organization will depend to a large extent on their capacity to provide anadequate water delivery service, to control and allocate water, to maintain the hydraulic infrastructureand to promote gains in agricultural services.
Support services that were previously provided by government agencies may also becomepart of the WUA responsibilities. These may include agricultural extension, technical assistance, legalmatters and training programmes. Federations of WUAs can be fairly successful in providing a widerange of services in addition to the O&M and administrative services they have taken over.
Role of the irrigation agency in supporting irrigation management and modernization
The irrigation agency has been the main player in many IMT programmes during and after the IMTprocess. It is the main provider of support services, which typically include technical advise on O&Mactivities, and training and support in administrative and financial matters. It is important thatirrigation agencies support the IMT process and have a clear understanding of their tasks and rolestowards WUAs. In Andra Pradesh, continuing support to WUAs by the irrigation agency is ongoingand a programme of maintenance and rehabilitation is underway, in which the irrigation agency will

Investing in irrigation and drainage in the context of water policy and institutional reform…126
provide further training in O&M, budgeting and bookkeeping. A system of joint technical, financialand social audits of WUAs is being developed. Governments should specify clear policies wherebysupport services for rehabilitation and upgrading of irrigation systems will be provided after IMT.These should be designed so as to promote local self reliance rather than inefficient and unsustainabledependence on the government.
Strengthening agro-economic development
There appears to be a strong correlation between the productivity of irrigated agriculture and thesustainability of water user organizations. Hence, there is rationale for governments to promotedevelopment of agricultural production potential, intensification of farming systems, and developmentof agribusiness and marketing opportunities. Support services in IMT should therefore not be limitedto water delivery and O&M tasks only, but should comprise support in all aspects that will improveperformance and sustainability of irrigated agriculture. More support services are required in schemeswith low agricultural productivity, to motivate and enable farmers to take over water supply servicesboth technically and financially.
Role of agricultural extension
Agricultural extension played an important role during the years of the green revolution in promotingimproved agricultural practices and contributing to substantial leaps in agricultural productivity.Trained to work closely together with farmers, agricultural extension workers could also play animportant role in providing direct support to WUAs in intensifying irrigated crop production andpromoting agribusiness.
With governments committed to the privatization of services, many extension agencies,however, are suffering from a lack of funding and decreased capabilities. Moreover, inter-agencycompetition is constraining or preventing an effective synergy of activities between agricultural andirrigation agencies and is reducing the inputs and support of the agricultural agency in many IMTprogrammes. Two questions arise: Is there indeed a need to redesign and revitalise governmentextension systems, particularly in countries with weak agribusiness sectors? Or is there need andpotential for private sector or non-governmental organisations to take over agricultural extensionservices?
Role of the private sector in provision of agricultural supplies and credit
The private sector can play an increasingly important role in supporting irrigation managementorganizations. Suppliers of agricultural inputs, farm machinery and on-farm irrigation equipment mayoffer technical advice and assistance in further improvements of the irrigation and agriculturalproduction system. Several countries report on the difficulties experienced by WUAs in owning andmaintaining equipment for transport, desiltation, land leveling and construction works. It is apparentthat many operation and maintenance tasks could be entrusted to specialized private sectorcontractors. Further, marketing and agribusiness organizations and suppliers of agricultural inputsmay play an important role in the promotion of more profitable agriculture and supply of equipmentand credit and provision of technical advise. However, this will likely involve contract farming andother business linkages with suppliers of agricultural support services. Agricultural credit plays animportant role in intensifying irrigated agriculture.

…Investment in land and water 127
Irrigation advisory services and on-farm water management
More effective use of water at farm level can contribute importantly to increasing and intensifyingagricultural production. Studies have shown that an effective on-farm water management programmethat improves the field irrigation and drainage system, promotes land leveling and introduces sprinkleror micro irrigation systems can increase harvested irrigated area and yields significantly. In mostcountries irrigation agencies have little experience and interest in on-farm water management, whilein most cases agricultural extension workers have no expertise in water management. Specialisedadvisory services or on-farm water management programmes to introduce appropriate field irrigationtechnology and methods may need to be considered.
Role of river basin management organizations
Growing competition for water between different sectors has led to the formation of basin-wideorganizations to regulate water management and to the basin-wide allocation of water to differentinterest groups within river basins and watershed catchment units. Agreement on procedures for waterallocation and watershed management among different water users are important in this and require aforum for negotiation and consultation, entrusted to river basin organizations. Although institutionalarrangements are, in many countries, still in formative stages, the role of river basin managementorganization in providing support services to irrigation management organizations may becomeincreasingly important and may include legal advice and development and adjudication of water rightswithin basins.
Legal support
Even though initial legislation for the formation of management organization may be provided for atthe start of IMT, continued support may need to be given to water users organizations to assist them toimprove and modernize the regulatory framework in the water sector. Normally, further support andguidance will be required for matters of water rights, water allocation rules and regulations,protection of assets, resolution of disputes and imposition of sanctions.
Training and capacity building
Training and extension is an important tool for developing the knowledge and skills of farmers andWUA officials to undertake management responsibilities and develop more profitable irrigatedagriculture. Generally, training of WUAs included training in financial and administrativemanagement as well in technical aspects of operation and maintenance. However, the quality oftraining varies greatly and it is often reported to be not adequate or ineffective. Countries with a morefocussed effort and commitment to IMT developed extensive training programmes for both WUA andstaff of the irrigation agencies. Training has been directed to developing skills in financial andadministrative management and technical operation of the system, but has been used in particular alsoas a tool to sensitize and motivate farmers, local leaders and staff of the irrigation agencies. FewerIMT programmes included training for the irrigation agencies. This is surprising given the fact thatthe irrigation agency is normally required to play a central role in the transfer process.
Training often proved to be ineffective and more effective training approaches need to bedeveloped. Agency staff at almost all levels need to be involved with trainers–of-trainers programmes.Also, in several cases reported in the profiles, WUAs may provide training support services to theirmembers, in particular in agricultural production methods and in development of markets andagribusiness.

Investing in irrigation and drainage in the context of water policy and institutional reform…128
Cost of institutional development and capacity building
In many IMT programmes, only small budgets are provided for institutional development, trainingand capacity building. As the IMT process is often driven by the government’s lack of funds, manycountries fail to allocate the minimal funding required to establish an effective support programme toensure the formation of sustainable irrigation management organizations. This may constitute aserious threat to the sustainability of WUAs after IMT. The impacts of well-designed training andcapacity building programmes have not been studied in a systematic way and may be one of thereasons for the limited funding allocated to institutional development.
Case for extensive retraining of engineers and managers in irrigation agencies, consulting firmsand irrigation service providers
Intensified and on-going training programmes for both professionals in the reformed irrigationagencies, consulting firms which provide advisory services to water users associations and managersof water users associations and the technical staff employed to operate and maintain their irrigationschemes are understood as one of the conditions for sustained success of the transfer programmes.
It is therefore essential that these programmes introduce and provide knowledge on ways andmeans to design and operate irrigation systems cheaply for good performance and adequate service tofarmers as they evolve toward more commercial forms of agriculture. An appraisal of initialconditions and performance of the systems to be transfer would allow both a better design andstrategic planning of physical improvements together with a definition of the service to be providedboth by the irrigation service provider to WUAs and by WUAs to their members, with indications onways and means to achieve these service goals and improve them in the future.
It is suggested that the Rapid Appraisal Process developed and used in the evaluation ofmodernization programmes of IPTRID could be used for this purpose at programme appraisal stageand for individual irrigation systems. The use of internal process indicators would be useful inmonitoring and evaluation systems.
A pilot training programme on modernization concepts and application of the RapidAppraisal Procedure, which builds on the knowledge synthesis acquired in recent years on moderndesign principles and participatory irrigation management shows promising results. Its application to asystem in Thailand by staff of the Royal Irrigation Department gave very promising results. Similartraining courses will be held in Iran, Viet Nam, Indonesia and Nepal. A concept for a more ambitiousretraining programme based on the same concepts and tools has been developed by FAO and could besupported in the context of efforts to improve the performance of programmes to transfer themanagement of irrigation systems to the users.
CONCLUSION
The notion of water delivery service and of generalized service-orientation of institutions in theirrigation sector, whether river basin agencies, reformed irrigation agencies, irrigation serviceproviders, water users associations has become central in new concepts and definitions ofparticipatory irrigation management and irrigation management transfer. The evaluation of impacts ofon-going participatory irrigation management and irrigation management transfer programmes is oneof the reasons of this evolution.

…Investment in land and water 129
Literature on the evaluation of impacts of on-going participatory irrigation management andirrigation management transfer programmes in terms of water service delivery, agriculturalproductivity and agricultural performance indicates that improved service is a problem area.
The service orientation of irrigation water delivery doers not appear to be sufficiently takeninto account in processes and tools for design and preparation of operation and maintenance plansinfrastructure rehabilitation works, monitoring and evaluation systems. For the large systems, partialor gradual transfer may not provide explicit steps for a real decision on service and the gradualbuilding upstream of governance structures by federation a constraint to address the central strategicquestions of service at the beginning of the transfer process. For small or traditional schemes, thequestion of future needs of irrigated agriculture is often not asked. IMT has rarely affected the designprocesses. The sustainability of the water users associations is however now seen to depend on theircapacity to provide an adequate water delivery service and control and to allocate water and toprovide an improved service to enable gains in agricultural productivity.
In the context of Asia, diversification of rice crops is a major issue for increased income byfarmers and improved agricultural and water productivity. This in turn is essential for the capacity offarmers to pay water and the water users associations to e financially viable. A more forward-lookingstrategy anticipating these future needs is therefore required.
As a result, it is now recommended that strategies of gradual improvement of irrigationsystems be adopted to support the transfer of water management responsibilities and associated rights.Concepts of irrigation management transfer/participatory irrigation management transfer andmodernization are therefore converging. However, there are still some substantial differences:modernization stresses that the infrastructure/physical improvements which must be supported mustbe designed with a view to improve equity and reliability of water delivery service and evolvetowards increasing levels of flexibility. Operational and technical details become very significant.Environmental considerations need to be better taken into account in a perspective of integrated waterresources management.
A more forward-looking strategy anticipating these future needs is required. Recent visioningprocesses in the water sector provide a good condition for strategically planning organizational andtechnical changes in participatory and irrigation management. This in turn is essential for the capacityof farmers to pay water and for the water users associations to be financially viable. An appraisal ofinitial conditions and performance of the systems to be transfer would allow both a better design andstrategic planning of physical improvements together with a definition of the service to be providedboth by the irrigation service provider to WUAs and by WUAs to their members, with indications onways and means to achieve these service goals and improve them in the future.
Although the relationship between design and operation is not univocal, initial system designsmay represent a severe constraint to the adoption of new and more flexible operational procedures.Many problems related to inequity and unreliability of water service can be attributed to design andoperational procedures, which, if left unchanged, will produce the same results whatever thegovernance setup. Many of the transferred systems cannot effectively provide needed or a reasonablelevel of service, now and in the future, with a limited programme of repairs or with rehabilitation.This threatens the capacity of the water users associations to carry the costs of operation andmaintenance of the systems unless service is improved significantly and unless they are in a positionto improve agricultural performance.
Knowledge in the field on how to design and implement service-oriented water control andmanagement is lacking but capacity building components for agency decision makers and field staff,ISP/project operators and managers, consulting firms, water users associations do not address

Investing in irrigation and drainage in the context of water policy and institutional reform…130
sufficiently the practicalities of design, operation etc. on top of governance aspects and advisoryservices. Even if conjunctive use and recirculation are practiced in many cases, PIM/IMT often onlyconcerns surface water systems and their management. This may be a problem for the viability of thenewly created institutions.
Delivering an improved service, securing a water right, charging a water fee may requireimproved water control and measurement of discharges at all levels of the irrigation system. One cantherefore argue that there is a case for reassessing the design, configuration and operationalprocedures at the moment of transfer as a result of a review or resetting of both internal objectives interms of service with the water users and external objectives with water resources managementinstitutions.
Another serious issue is to ensure that rehabilitation, modernization do not increase farmerdependence on the government, In particular, it is now thought that irrigation system improvementworks should be planned and implemented after transfer. Subsidies may still be required but theyshould be smart. The new ideas about decentralized irrigation improvement funds are an example ofthese 'smart' subsidy systems that encourage investment of the users in the maintenance and upgradingof their schemes.
The required transformation of irrigated agriculture will not take place simply as a result oftransfer and demand for improved services. Technical advisory services, financing arrangements, andother agricultural support services will be required.
Therefore, concerning the financing of irrigation and drainage systems in the context of watersector and institutional reform, the following conclusions can be made:
• IMT and PIM reforms do present good opportunities to redress the present under-investment inoperation and maintenance or upgrading of irrigation and drainage systems;
• The service-orientation of irrigation and drainage service providers represents a new model forfinancing of irrigation and drainage services;
• One condition for the success of these reforms is that farmers be provided with a good service:this may entail a significant departure from mere cosmetic or light rehabilitation or upgradingwhich is typically financed in the context of IMT/PIM programmes in the region;
• A second condition for the sustained success of participatory irrigation management is theavailability of financial instruments allowing farmers to invest in upgrading their irrigationsystems;
• A third condition is a substantial increase in the training and capacity building components ofthese programmes;
• A fourth condition seems to be that irrigation sector reforms should be part and parcel of a moregeneral reform of water resources management, in which issues of water allocation, water rights,ownership of transferred assets and the future of the irrigation agencies are addressed;
• Another condition for the sustainability of the reforms is the development of a suitable serviceenvironment to assist farmers in increasing the productivity of agriculture.
ANNEX 1

…Investment in land and water 131
DECLINE IN IRRIGATED INVESTMENT?
Public investment in irrigation has declined
Data on irrigated areas, globally and across regions, show that the rate of growth in irrigated area hasdeclined, and has been accompanied by a decline in lending for irrigation by international donors.There has been a large decline in real lending since the late 1970s and early 1980s, when it peaked.By 1986-87 World Bank lending was only around 40percent of peak lending, and lending by otherdonors shows similar trends.
Many Asian countries show a decline in real irrigation expenditure in the late 1980s. Annualexpenditure in China and Sri Lanka was cut by nearly 50 percent between late 1970s and 1980s. Inthe Philippines the level in the late 1980s was only one-third that in the early 1980s. Expenditurespeaked later in Bangladesh, Indonesia and Thailand, but these countries also show a decline ininvestment in irrigation. In India, public sector investment in irrigation has been stagnant or decliningsince the mid-1980s.
Private sector investment
What of private sector irrigation? Much groundwater is privately owned e.g. India, Bangladesh, somonitoring both use and development of groundwater sources is difficult. But data from FAO’sAQUASTAT programme suggest that investment in groundwater development has offset the declinein public investment (mostly surface schemes). Indeed, the most significant innovation over therecent decades is estimated by many be the diffusion of low-cost low-lift pumps and tubewelltechnology.
Successful strategies for the dissemination of improved on-farm irrigation such as treadlepumps, low-cost drop and sprinkler systems and more generally small-holder land and watermanagement systems are now understood to rely on private sector initiative (manufacturing, dealernetworks, installation) and mass-marketing. The idea is that these investments are highly profitable.The issue is therefore to make systems that are accessible also to the poor or to facilitate their accessto rural credit, and not to rely on subsidies that are typically shown to ration or limit the disseminationprocess.
In the Asia region, private investment in surface irrigation systems is still in its infancy orcontemplated in the reform policy documents, mostly under the pressure from external donors.However, it is not totally absent and there are interesting examples to be found in China, Viet Nam orCambodia. In Australia or New Zealand, IMT is often understood as privatization, as previouslypublic assets are transferred. Although recent problems with privatization of other industries as wellas domestic water supply has led to more caution in the promotion of privatization of irrigationservices, this path to IMT should not be neglected.
In Latin America, private sector investment has historically been important and only gaveground to public sector investment during the 1970s. In Mexico, a substantial number of irrigationunits covering a large proportion (around 40percent) of irrigated area were privately owned, evenbefore reforms of publicly-funded irrigation districts shifted control to water user associations.Increases in private sector investment in irrigation infrastructure have been dramatic, and have helpedcompensate for the 41 percent decline in federal government investment between 1991 and 1995. InChile, with one of the most privatised irrigation sector in Latin America, farmers have to, by law,contribute as much as 75percent to new pumping and channel irrigation projects, with the result thatonly the most profitable schemes are built. But the extent of private sector involvement in the

Investing in irrigation and drainage in the context of water policy and institutional reform…132
approval, funding and operation, management and maintenance of irrigation projects has increasedwater efficiency with booms in agricultural exports despite a small decline in irrigated area per capita.
In Mexico, the increase in private sector investment has led to improvements in performanceof some irrigation systems. Removal of sediment from canals and drains, irrigation budgets and usercontributions have all increased dramatically after irrigation management transfer from the public tothe private sector. Increased water efficiency in Chile is largely attributed to the increase in privatesector involvement. However private sector investment, especially by the poor, relies upon access tocredit facilities and technical assistance, yet subsidies for infrastructure investments can createincentives to invest in non-viable projects or in projects with relatively low rates of return.
What are the reasons for the decline in public investment?
The decline in investment in irrigation is largely ascribed to falling economic rates of return toirrigation projects, both new and existing, making other sorts of investment better options for scarceresources. This may be because higher-return works are usually built first (the best sites for dams havealready been chosen) leaving less good ones for later, because of rising costs of construction, orfalling recovery of costs from users, declining agricultural prices, declining water-use efficiency orincreasing negative impacts (e.g. health and environment).
Returns to irrigation are however comparable to alternative investments in agriculture andnon-agricultural projects. In an evaluation of 192 World Bank funded irrigation projects implementedbetween 1950 and 1993, 67 percent received an overall satisfactory rating with an average internalrate of return of 15 percent at evaluation. There was no downtrend in ERR The relatively constantERR is despite falling world agricultural prices and should carry through to, and parallel results for,trends in returns to irrigation.
There is also an argument that investment in irrigation is falling because of rising costs ofconstruction. This may well be the case in some areas. In India and Indonesia the real costs of newirrigation have more than doubled since the late 1960s and early 1970s; in the Philippines real costsincreased by more than 50 percent; in Thailand by 40 percent, and in Sri Lanka, costs tripled. Theresult is lower returns to investment.
Poor and/or declining cost recovery could be another factor that explains declining trends.Public irrigation projects “have been an enormous drain on government budgets” mainly because costrecovery falls short of covering the actual costs. For example, in Pakistan in 1984 approx. Rs 1 billionwere collected in payment for public irrigation services. Operation and Maintenance costs were aboutRs 2 billion and annualised charges for past irrigation investments were approx. Rs 5.9 billion. Forfive South and South-east Asian countries (Indonesia, Korea, Nepal, Philippines and Thailand), actualgovernment receipts covered less than 10 percent of the full irrigation costs. Increased fiscal pressureto recover costs or to reduce subsidies may also make irrigation projects less attractive other thingsbeing equal, but presumably cost recovery problems will affect all public investments. Given thegrowing demand for domestic and industrial water, and other sources of water squeeze tightening, thisargument becomes less defensible.
The biggest surge in investment in irrigation occurred in the 1970s, leading some to argue thatthis was due to the rise in agricultural prices, due in turn to the two oil crises raising prices of inputsand transport and unfavourable weather conditions, and to argue further that declines in agriculturalprices make future investment in irrigation unwarranted. If these events were perceived to besignificant and likely to extend into the long-run, then this argument may have some merit. It ispossible however that falling agricultural prices now are a consequence of rising irrigated area andhence higher global yields, and even more if extra irrigation creates incentives to green revolutions in

…Investment in land and water 133
seed-fertiliser use, and if these eventually raise yields (more accurately, net value added) more slowlythan they depress farm prices (more accurately, farm output prices relative to farm input prices -fertiliser prices may be bid up, as well as crop prices down. However even if agricultural pricescontinue their downward trend, there is sufficient evidence that ERR can be maintained at acceptablelevels.
A fourth reason behind declining investments in irrigation is declines in other aspects ofirrigation performance in for example water use efficiency or conveyancing efficiency. Misincentives,such as poorly targeted subsidies, or inappropriate water pricing systems can induce overuse orwastage of water and eventual water table depletion. Inefficient irrigation damages the performance ofprojects.
ANNEX 2
IRRIGATION DEVELOPMENT AND POVERTY ALLEVIATION
On-going research by FAO suggests that irrigation development has played a large role in povertyalleviation in Asia. There are huge regional differences in the proportion of cropland that is irrigatedand these coincide with successes or failures in poverty reduction. In Africa only around 3 percent ofcropland is irrigated and the region has experienced very little reduction in poverty in the 1990s [SSAhad a poverty headcount of 47.7 percent in 1990 and 46.3 percent in 1998]. In contrast, 35-40 percentof cropland in Asia is irrigated and poverty reduction in the 1970s was substantial. The researchargues that this is no mere coincidence, rather that differences across regions, countries and stateswithin countries in irrigation is an important factor in determining rates of poverty reduction. Thesignificant poverty reduction in many parts of India for example is attributed to the availability ofirrigation, which not only boosted agricultural production but also made possible the adoption ofmodern farming technology – seeds, fertilisers and pesticides – that further reduced poverty.
Irrigation and poverty alleviation
Irrigation may take many different forms from large dams and canals to small systems of shallowtubewells, small sprinkler systems and porous pots. Irrigation may impact differently on the poor,depending on the irrigation technology itself, their position along the distribution system, theinstitutional rules governing access to water and maintenance of water systems and their ability tocomplement irrigation with other agricultural inputs. Furthermore the poor are not a homogenousgroup of people defined uniformly by a set of characteristics. instead they are much moreheterogeneous, comprising different ages, gender, ethnicity, education, different economic activityand location. Irrigation may affect different types of poor people in different ways: perhaps impactingon small farmers first through boosting yields and income levels, then impacting on landless labourersthrough increased demand for agricultural labourers, and then on the urban poor via lower food pricesand possibly reduced migration of the rural poor to urban areas.
Irrigation facilities also require labour and other domestic inputs for its construction andmaintenance. A project in Nepal that used labour-intensive construction to provide irrigationincreased production potential by over 300 percent and income by over 600 percent, contributingimmensely to food security. The impact of irrigation on poverty via employment will depend on thetype of irrigation system used. For example, centre-pivot sprinkler systems - often hundreds of yardslong - are a classic big-farm-biased, capital-intensive means to water control; but the same effect canbe attained more labour-intensively through gravity-flow. The aim in both cases is to achieve better

Investing in irrigation and drainage in the context of water policy and institutional reform…134
crop per drop, to save water: in one case with capital, in the other with labour. Price is one means toinfluence this choice, research and extension, another; land reform, a third.
Impacts of irrigation on poverty via output, employment and prices
The first direct impact of irrigation on poverty is on output levels. Irrigation boosts total farm outputand hence, with unchanged prices, higher farm incomes. Increased output levels may arise for any ofat least three reasons. Firstly irrigation improves yields with a fixed amount of rainfall throughreduced crop loss due to erratic, unreliable or insufficient water supply. Secondly, irrigation allowsfor the possibility of double-cropping, and so an increase in annual output. Thirdly, irrigation allows agreater area of land to be used for crops. Hence irrigation is likely to boost output and income levels.
The second direct effect on poverty is via employment. Irrigation projects require labour forconstruction and on-going maintenance of canals, wells and pumps etc. This is likely to be animportant sector of employment for the poor, especially the landless rural poor or rural householdswith excess labour or seasonal excess labour. In addition, increased farm output as a result ofirrigation will stimulate demand for farm labour both within the main cropping season and across newcropping seasons, increasing both numbers of workers required and length of employment period.Rural poverty levels may therefore be reduced by increased employment opportunities. In additionthere may be effects that extend to other areas if irrigation projects reduce migration to urban areas,and so reduce the pool of job-seekers and reduce pressure on the downward pressure on urban wagesand the upward pressure on prices of housing and other urban infrastructure.
The third direct effect on poverty is via food prices. If irrigation leads to increases in staplesor non-staple food output then this may result in lower prices for staples and food, in imperfectly openeconomies or if there are significant transport costs internationally, or from food surplus areas totowns or food deficit areas. Net purchasers of food will therefore gain from cheaper food, as willurban consumers.
Hence, examining the direct first-round effects, irrigation is likely to reduce poverty, viaincreased food output, higher demand for employment and higher farm real incomes among a) netfood purchasers in irrigated areas, b) net food purchasers in non-remote unirrigated areas and c) theurban poor. Positive effects may be experienced by net food producers and waged labourers if effectsof, respectively increases in output and employment outweigh effects of price falls. [This isincreasingly likely with liberalisation of food trade; with falls in growth rate of irrigated area; andwith better transport and falling transport-cost/production-cost ratios]. Negative effects might beexperienced by surplus producers in remote, unirrigated areas but net food buyers there – who areusually among the poorest – gain from price falls.
Longer-run impacts
In the longer run, irrigated land may encourage farmers to adopt or increase their use of fertilisers,pesticides, improved seeds and other agricultural inputs, and provide the stimulus for further researchinto improved plants and technology that lead to increased output, and so employment and incomes,with possible further price reductions. This green-revolution style virtuous circle is likely to lead tofurther poverty reduction.
Furthermore, irrigation probably switches farm use away from staples to higher-valueproducts. As long as the rural poor can access appropriate new technologies, possibly also requiringaccess to credit markets, then poverty among small producers and landless labourers is likely to fall.The switch of crops in irrigated areas may also create or expand demand for the crops of unirrigatedareas, so leading to poverty reduction in those areas. Examples of this can be seen in the context ofmodern seed varieties.

…Investment in land and water 135
A second longer-run effect on poverty is via non-farm rural output and employment. As farmoutput and incomes rise and food prices fall, enriched farmers and workers will increase theirexpenditure on non-food products, leading to increased demand for non-food goods and services andso increased employment opportunities in non-farm incomes generating activities. These may includetransportation, construction, food preparation and trading.
Perhaps the biggest long-run effect on rural poverty however is via stabilisation and riskreduction. Crop output levels will not only be on average higher but also experience less varianceover seasons – because of double cropping for example– and over years as reliance on rainfall isreduced. Hence the poor are less likely to need to borrow to smooth subsistence consumption levelsand so avoid the high capital market access costs that they usually face. In addition, less riskyproduction of staples or other crops allows them to take more risks with other activities, encouragingdiversification into higher risk but potentially higher income activities, such as cash crops for exportor new non-farm activities.
To the extent that poor farmers do have access to irrigated land and other agricultural inputs,then the effects of irrigation via output, employment and prices, stabilisation and risk reduction arelikely to be positive in both irrigated areas and unirrigated but non-remote areas. Remote unirrigatedareas are likely to experience negative effects if transport or other market transaction costs aresignificant. The greater availability of food output, lower prices and reduced pressure on urbanresources is likely to be positive.
Irrigation can help or harm the poor depending on how they are involved in the delivery,management and maintenance of irrigation systems. Water User Associations vary from system tosystem, in size and composition, and the extent of control they have over operations and maintenanceof systems. If the poor actively participate and are fairly represented in WUAs then equitable or evenpro-poor allocations of water at affordable cost may ensue. On the other hand, if the poor aremarginalised, or not properly represented in WUAs then inequitable allocations may occur.
In summary
There are a mixture of short-run and long run economic, socio-economic, environmental and politicaleffects of irrigation that may have adverse or positive effects, and may affect different types of poorpeople [landless labourers, small farmers and the urban poor] in different ways. It is likely thatcheaper, more abundant and stable food supplies, more farm employment, stabilisation and riskreduction, and spill-over effects to non-farm activities will be poverty reducing for large categories ofthe poor, although some groups, such as small food surplus farmers in very remote rural poor, may benegatively affected. However, the negative externalities of irrigation – on health and the environment– may be locally very damaging. Irrigation affects poverty via a variety of different transmissioneffects and different types of irrigation system affect different types of poor people. The chief effectsare via increased employment and lower food prices: most of the poor (even the rural poor) gain anincreasing share of their income from employment and are net food purchasers. As well as raisingmean levels of employment, output and incomes, irrigation can also help reduce the variance of each,although there may be increased covariance. However, distribution of ownership of and benefit fromwater and water-yielding assets - small/big farm bias, and labour or capital intensity in use of newirrigation – is critical.

137
COUNTRY PAPERS

…Investment in land and water 139
INTRODUCTION
The physical environment
Bangladesh lies between the 20o25' and 26o38' north latitudes and the 88o and 92o40' east longitudesastride the Tropic of Cancer and the 90o east meridian. Its total area is 144 852 km2, of which about9 700 km2 is occupied by major rivers and estuaries. It has a tropical monsoon climate with four mainseasons: pre-monsoon (March-May); monsoon (June-September); post-monsoon (October-November); and winter (December-February). The mean annual temperature is about 25oC, whilemean monthly temperatures range from 18oC in winter to 30oC in the pre-monsoon season. Meanannual rainfall is 50" to 60" in the west and over 100" in the north, east and south, and exceeds 200"in the far north. Some 85 to 90 percent of total annual rainfall occurs between April and September,with regional variations.
The country is comprised of hills, terraces and floodplains. The northern and eastern hillsoccupy 12 percent of the country, so-called terrace areas (the Madhupur and Barind tracts) about 8percent and floodplain is the remainder. Terraces are uplifted fault blocks and not river or marineterraces (Brammer, 1997). Floodplains are categorized in four types: active river floodplain; meanderfloodplain; piedmont; and estuary and tidal floodplains. Since 80 percent of Bangladesh is floodplain,flood control and drainage not only supports crop irrigation but also prevents damage to crops andland of special importance in terms of food security.
Agriculture operates in a dual water regime of flood during the rainy season and aridity in thewinter. A complex network of watercourses drains an area of some 2 million km2 of which only about7 percent lies within national boundaries. This physical setting severely limits the degree of controland management that can be applied to water inflow both in the monsoon season and during the drywinter. This variation in the temporal and spatial occurrence of water is a major constraint toeconomic development, especially for agriculture, which dominates the economy. The overabundanceof water during the annual monsoon season causes widespread flooding and restricts croppingalternatives. It disrupts normal life. Significant areas of crops are damaged in years of high flood.Conversely, the scarcity of freshwater inflow during winter and at times of heavy groundwater use forirrigation has led to the progressive salinization of coastal aquifers and the environmental degradationof important economic resources such as the Sunderbans (Proceedings, 1992). The combined totalannual monsoon flow of all rivers together is estimated to be 5 million m3/secs which dwindles to 0.25million m3/sec during winter. About 71 percent of the total cultivable area is in higher areas (flooddepth 0-30 cm) and medium high land (flood depth 30-90 cm), yet even the remaining land area is notentirely free of seasonal inundation.________________________________________________________________________________
Khwalja Abdur Rahman, Additional Secretary…Ministry of Agriculture Secretariat, Bangladesh…
________________________________________________________________________________
Investment in land and waterin Bangladesh

Investment in land and water in Bangladesh…140
Importance of land and water
Bangladesh is an overpopulated country with a population density of 891 persons/km2. The need toproduce enough food for all has been a continuing concern for all governments since 1972. Land andwater in this context constitute the two most important resources. All too often these resources havebeen used as though they are inexhaustible gifts of nature. Only in recent years has it been realizedthat these critical resources are limited, more so on a per capita basis, because of the huge populationdependent on them. The current population estimate is 131.5 million (Bangladesh Economic Survey,2001).
There are four principal modes of water development: (i) flood control and drainage; (ii)major irrigation, involving primary pumps, floating pumps or barrages; (iii) minor irrigation,involving traditional non-mechanized methods or modern mechanized methods using hand tubewells(HTW), low-lift pumps (LLP), shallow tubewells (STW) or deep tubewells (DTW); and (iv) floodcontrol and drainage combined with irrigation using double pumping or single pumping with gravitydistribution. Important subsidiary modes of water development include water conservation, commandarea development, and conjunctive operation of surface and groundwater irrigation systems.
Our objective is to highlight the major issues relating to land use and water management. Thisstudy in divided into four parts. Part I documents land and water development programmes executedin different plan periods, budget support including external aid and related issues. Part II delineatesthe historical trends in economic policies which influence investment trends including the prioritygiven to land and water development and projections for future investment requirements. Part III dealswith the growth of private investment in land and water, impediments to such investment and theareas and levels where a complementarity between the two could be established. Finally, in Part IVconclusions are drawn with emphasis on the Special Programme for Food Security (SPFS) andpoverty alleviation through land and water development.
PART I: LAND AND WATER DEVELOPMENT PROGRAMMES
In Bangladesh, land and water development programmes cannot be kept isolated unless programmesof land development are narrowly confined to soil resource development to maintain and augment soilfertility. However, investment in soils resource development generally goes beyond the objective ofmaintaining soil fertility. The process of development in this respect includes soil mapping andclassification of soils by type, checking the level of soil fertility in order to advise the farmers of thesuitability of particular types of land for different crops. Bangladesh has made investments in soilresource development since the 1960s; it has institutional arrangements to continuously advisefarmers on soil fertility issues countrywide. The Soil Resource Development Institute (SRDI) is thepermanent institution in which investment is made under both development and revenue budgets; it istechnically backstopped by the National Agricultural Research System (NARS).
Overall emphasis and consequent investment favours water resource development, whichdirectly and indirectly serves the needs in both categories. The direct contribution of water resourcedevelopment arises out of such programmes as coastal embankments, flood control embankments andflood control and drainage, land reclamation and river erosion control. The coastal embankmentprogramme prevents salinity intrusion, thereby saving agricultural land. Flood control and drainageprogrammes save not only crops, but also infrastructure, human population and livestock. Floodcontrol, drainage and irrigation programmes enable farmers not only to be free of flooding, but alsoincreases cropping intensity through irrigation facilities. Programmes for river erosion prevention areimportant in reducing land loss. It is estimated that the annual loss of agricultural land due to sucherosion is some 8 700 ha. Water resource development programmes since the early 1960s were largely

…Investment in land and water 141
piecemeal and not interconnected due to the absence of a coherent sectoral policy. The National WaterPolicy adopted in 1999 provides for a comprehensive framework encompassing all sectors.Investment in land and water therefore must be seen in this light. The integrated relationship of landand water development was acknowledged in 1989. The Bangladesh Water Development Board(BWDB), the major public sector agency responsible for water sector development, built 6 519 km ofdykes including 3 674 km of sea dykes, 6 095 large and small sluices, 1 276 large regulators, 6 419km of drainage and irrigation canals, two cross-dams reclaiming 124 000 ha of new land, one barrageto protect 2.84 million ha from upland and tidal flood hazards and brought 192 000 additional haunder irrigation (UNDP, 1989).
An estimated US$1 billion in foreign aid was applied to water projects from 1972 to 1989,including investment in minor irrigation, which until 1989 was the responsibility of a public sectoragency called the Bangladesh Agricultural Development Corporation (BADC). A policy changetransferred this responsibility to the private sector, with the exception of a few areas of integrated areadevelopment.
Budget support
Bangladesh began planned development in 1973 with development in the form of five-year plans onwhich annual development programmes (ADP) are prepared. There have been some discontinuitiesdue to the exigencies of public situations. Thus, while the First Five-Year Plan was launched in 1973,a Two-Year Plan (1978-1980) followed it in response to worldwide inflation and uncertainty. In 1980,the five-year plan framework was reinstated and three five-year plans were implemented insuccession. There was no development plan during 1995-1997, but the Fifth Five-Year Plan waslaunched in 1997. Bangladesh is now preparing its Sixth Five-Year Plan. Funds for investment indevelopment projects are channelled through the development budget. Funds are also providedthrough the revenue budget for the permanent offices that execute the projects. All the above plansgive varying priority to land and water development programmes to achieve national self-sufficiencyin food. Allocations and expenditures for agriculture, water resources and rural development indifferent plan implementation periods is shown in Table 1.
Extent of foreign aid
The allocation shown in Table 1 includes external assistance from bilateral and multilateral sources.Foreign aid consists of project aid (loan or grant), commodity aid or food aid. Project aid dominatesthe foreign aid component. It sometimes includes technical assistance in support of projectimplementation as well.
From independence until June 1998, US$33.2 billion in foreign aid was disbursed to allsectors of the economy, 48.4 percent as grants and 51.6 percent as loans. Of this, 17 percent was foodaid, 29 percent was commodity aid and 54 percent was project aid. Since then, significant changeshave altered the total aid profile. In recent years, emphasis has been given to social sectors such ashealth and education, which has led to declining support for land and water sector programmes. Theshare of grants overall has declined as has bilateral aid, decreasing from 74 percent of total aid in1971-1976 to 39 percent in 1997-1998. Food aid also declined consistently from 48 percent of totalaid in 1971-1972 to 7.4 percent in 1997-1998. Commodity aid fell from 50.8 percent to 9.5 percentduring the same period.

Investment in land and water in Bangladesh…142
TABLE 1Allocation and utilization in the public sector during different plan periods
Plan Periods Agriculture, Water ResourcesAnd Rural Development
Total Country
Allocation Utilization Allocation Utilization
BillionTaka
BillionUS$
BillionTaka
BillionUS$
BillionTaka
BillionUS$
BillionTaka
BillionUS$
First Five-YearPlan(1973-1978)
10.41 0.83 6.18(59)
0.49 39.52 3.17 16.35(41)
1.31
Two Year Plan(1978-1980)
8.98 0.59 32.61 2.12 24.02(74)
1.56
Second Five-Year Plan(1980-1985)
55.5 2.50 41.49(75)
1.87 111.00 5.00 103.28(93)
4.65
Third Five-YearPlan(1985-1990)
70.60 2.25 45.88(65)
1.46 250.00 7.97 171.29(69)
5.46
Fourth Five-Year Plan(1990-1995)
78.05 2.02 63.48(81)
1.64 347.00 8.98 274.08(80)
7.09
Fifth Five-YearPlan(1997-2002)
185.50 3.76 46.63*(25)
0.95 858.94 17.41 217.95*(25)
4.42
Source: Plan Documents, Planning Commission, Ministry of Planning, Government of Bangladesh.Note: For the Fifth Five-Year Plan actual utilization shown for the period 1997-1999. Figures in parenthesesindicate percentage of the allocation. Average exchange rates of different plan periods have been considered forconverting Taka into US dollars.
From 1996/1997 to 2000/2001 the flow of external aid for agriculture, including minorirrigation and the water resource sectors, remained static (see Table 2).
In this respect, it is important to refer to the global context regarding external assistance toagriculture, including water resources and land. Available data indicates that the decline in externalassistance to agriculture in 1994 reflected a 30 percent real term contraction in bilateral commitments.
This was partly counterbalanced by a five percent real increase in multilateral commitments in1994. Nevertheless, total multilateral commitment to agriculture in 1994 remained well below levelsrecorded in 1993.

…Investment in land and water 143
TABLE 2Project aid 1996/1997-2000/2001
Year Total Agriculture, Water Resourceand Rural Development
Billion Taka Billion US$ Billion Taka Billion US$
1996/1997 49.24 1.15 14.23(29)
0.33(29)
1997/1998 51.14 1.12 13.97(27)
0.31(27)
1998/1999 57.74 1.20 17.55(31)
0.37(31)
1999/2000 67.50 1.34 19.26(29)
0.38(29)
2000/2001 74.74 1.40 16.42(22)
0.31(22)
Source: Revised ADP Documents, Planning Commission, Government of Bangladesh.Notes: Allocations in US$ takes into account actual exchange rates in different years. Figures in parenthesesindicate percentage of total allocation.
With regard to regional distribution of foreign assistance flow, the level of commitments toAsian countries fell more steeply than for other regions during 1990-1993 (FAO, State of Food andAgriculture, 1996). This was the trend prior to holding of the World Food Summit (WFS) in 1996.This trend has not been reversed. The share of concessional assistance to agriculture in totalcommitments was estimated at 65 percent in 1998, well below the 77 percent share in 1988 and 74percent in 1996.
Targeted activities
Targeted activities in land and water can broadly be divided into (a) activities directly related to land,such as soil resource development, land reclamation and development and management of accretedland and (b) flood control, irrigation and drainage.
Soils
Even prior to its birth in 1971, Bangladesh had invested in soil resource development. Nearly allagricultural land was covered by a reconnaissance soil survey conducted in 1963-1964. According tothe demands of agricultural research, extension and development agencies, further activities aided bythe United Nations Development Programme (UNDP) and the Food and Agriculture Organization(FAO) were undertaken to update existing soil and land use data, taking into account changes inhydrology, irrigation and drainage since 1974. Efforts were also undertaken to establish a mechanismfor the transfer of knowledge of soils and land use to farmers, development officials and studentsthrough varied project instruments. The Department of Soil Survey (DSS) became the SRDI.

Investment in land and water in Bangladesh…144
The activities of this institute have since been extended to make it more pro-farmer to provideadvice directly to farmers through mobile laboratory units. Further, it is engaged in continual updatingof relevant information on soils in nearly 460 subdistricts. The data collected is published anddistributed to the farmers. Regular training of farmers on soil health issues is conducted in the fieldwith participation of research and extension personnel. Soil health cards have also been introduced asan experimental programme.
To improve zinc and sulphur deficiency in soils, the private sector has been drawn into themarketing programme for zinc and sulphur, with positive results. In addition, the Department ofAgriculture Extension (DAE) in cooperation with NARS have ongoing activities to educate farmers inadopting cropping patterns conducive to soil fertility, better land management, and balanced use ofbio-mass, green manure and chemical fertilizers.
The programme for land-related activities is further strengthened by a geographic informationsystem (GIS) covering 30 agro-ecological zones (AEZ). A database of this biophysical informationhas been developed. The AEZ/GIS project also provides training for agricultural extension, researchinstitutes, universities, NGOs and the private sector.
Water resources
Activities relating to water resources can be categorized into irrigation, flood control and drainage.Irrigation is further divided into minor and major irrigation. Other activities include land reclamation,development and management of accreted land and for river erosion control.
In practice, the three components (flood control, drainage and major irrigation) often merge toform distinct types of activities known as flood control and drainage (FCD) and flood control,drainage and irrigation (FCDI). The distinction between FCD and FCDI is based on the objectives andfunctions of particular programme activities. Some activities relate exclusively to flood control anddrainage, while others combine flood control and drainage with irrigation, depending upon theobjectives and the needs assessment of a particular programme. The overall objective – regardless ofprogramme activities – is to ensure water resource management and development in an equitable,comprehensive and integrated manner. FCD and FCDI programmes are capital intensive and requirepublic sector investment. Due to perceptions associated with large scale FCD and FCDI projects in thelate 1950s and early 1960s when a feasibility study after severe flooding in 1954-1955 led torecommendations for large-scale flood protection schemes to save crops from flood damage. A masterplan was initiated and in 1959 the Water and Power Development Authority (WAPDA) was created.Later, these perceptions changed. This will be discussed in Part II.
Management approach
The creation of WAPDA led to public sector-dominated management of the water sector withWAPDA as its focal point. In 1961 BADC took over minor irrigation activities. Its birth is associatedwith the Food and Agriculture Commission Report commissioned by the then Government ofPakistan.
Pakistan's net area of cultivated land is estimated at more than 9.0 million ha of which 7.56million ha are suited to irrigation. Flood control and drainage facilities are provided to 4.45 million haof land (Fifth Five-Year Plan Mid-term Review).

…Investment in land and water 145
Since creation of WAPDA and BADC in the late 1950s and early 1960s, Bangladesh hasfollowed a public sector management approach in water resource development, the broad objective ofwhich aimed at achieving food self-sufficiency as well as to protect infrastructure and damage tohuman and animal lives. In many ways, however, over time these objectives also promoted optimalwater use, securing people’s participation and integrated area development. FCD and FCDIprogrammes and projects remained within the WAPDA domain. Minor irrigation remained within thesphere of the BADC, which was also responsible for ensuring efficient delivery of inputs such as highyielding varieties of seeds (HYV) and chemical fertilizers. Further, it organized farmers to promoteand develop horticultural production.
TABLE 3Public sector irrigation to 1978
Type of Irrigation Irrigated Area (million ha)
Major Irrigation 0.06
Minor Irrigation 0.71 LLP 0.55 DTW 0.14 STW 0.02
Total Public Sector Irrigation 0.77
SOURCE: Two Year Plan, 1978-1980, Planning Commission, Government of Bangladesh.NOTE: LLP=low lift pumps; DTW=deep tubewells; STW=shallow tubewells
Achievement to 1997
By 1978, 1.16 million ha were being irrigated, with traditional methods dependent on surface wateraccounting for 0.39 million ha (representing private sector investment). The achievement by thepublic sector-led management approach is shown in Table 3.
Irrigation, specifically minor irrigation development has had a major shift from public sectorto private sector investment since 1987. The removal of the import ban on diesel engines of specificmakes and models led to a rapid increase in private sector investment on STWs and LLPs. From1988/1989 further policy reforms to remove duties and standardization restrictions on imports ofsmall diesel engines encouraged further expansion of private sales of STWs and LLPs. By 1996/1997four million ha of cultivable land was brought under irrigation coverage by both the public and privatesectors. Details on irrigation coverage by type are shown in Table 4.
Flood control and drainage facilities were provided to 1.82 million ha by 1978. Facilities wereextended to 3.17 million ha by 1987/1888 and to 4.2 million ha by 1996/1997 (Fifth Five-Year Plan).
Impact on food security
It is understood that the concept of food security need not be fully dependent on food availability.However, the concept can nevertheless be viewed in terms of the fact that a rising level of foodproduction and its availability is a necessary if not a sufficient condition for food security. Food grainproduction in Bangladesh rose from just over nine million tonnes in 1960 to over 16 million tonnes in

Investment in land and water in Bangladesh…146
TABLE 4Irrigation achievement from 1987/88 to 1996/97 (million ha)
Types 1987/88 1996/97
Irrigation 2.35 4.00
Surface Water 0.88 1.15
0.11 0.40
0.53 0.58
Gravity flow
LLP (including floating pumps)
Traditional method
0.24 0.17
Groundwater 1.47 2.81
0.87 2.23
0.56 0.53
STW
DTW
HTW
0.04 0.05
Others 0.04
Source: Fourth Five-Year Plan and Fifth Five-Year Plan, Planning Commission, Ministry of Planning, Governmentof Bangladesh..
1987/1988. Through 1996 it ranged from 17 to 19 million tonnes and then rose again through 2001 toover 26 million tonnes. It may not be appropriate to link this rise exclusively to investment in landand water management. It was also affected by technological changes not only in the land and watersectors but also by the introduction of HYVs and the increasing use of chemical fertilizers, in whichthe NARS, the DAE and BADC and the private sector made significant contributions.
Due to the rising production of cereals in the past, cereal prices remained affordable. Thiscontributed to food security because about 70 percent of average protein intake is rice. Additionally,due to recent achievements in food self-sufficiency, government has been able to expand safety-netprogrammes especially for women and children. These include the Vulnerable Group Development(VGD), Rural Maintenance (RMP or cash for work) and Food for Work (FFW) programmes. Thebeneficiaries of VGD and RMP are all women. Under the VGD programme about 0.5 million female-headed households receive 31.25 kg of foodgrain every month for an 18-month period. New groups ofwomen are brought into the programme after graduation of the existing groups. The beneficiaries aregiven skill development training to enable them to earn their livelihood after completion. A recentgovernment study found that marginal propensity to consume is greater for transfers in kind than for

…Investment in land and water 147
cash. Consequently food transfers greater positive impact on food consumption than cash transfer ofan equal monetary value, ensuring better food and health security for the hard-core poor. The largerinvestment in agriculture, water resource and rural development sectors is therefore a necessity toexpand the safety net as well as to ensure food availability at an affordable price (Mid-term Review,1997-2002). There is strong evidence that food assisted programmes increase household food securityand promote human development for the vulnerable poor.
Employment and income generation
The impact of investment in land and water can be assessed by the fact that out of about 132 millionpeople, 80 percent live in rural areas. They are directly or indirectly engaged in a wide range ofactivities relating to land and water. Sixty-three percent of the total population lives on land and waterresource management.
The spread of new technology in crop agriculture instrumented through HYV seed, fertilizerand irrigation has increased the aggregate volume of marketable surplus of food grains. This has led tothe creation of employment in agro processing, trade, transport and service sectors. As the newvarieties are grown the demand for labour increased by 45 percent and work became available duringthe lean season (Mid-term Review).
Irrigation expansion has also led to increased employment opportunities in crop agriculture,as well as in the installation, operation and maintenance of pumps, preparation and maintenance ofirrigation channels, on-farm water distribution, equipment trade, workshop facilities for equipmentrepair and spare parts manufacturing. Trading in seeds and fertilizers has also created significantadditional employment opportunities in the private sector.
Investment in land and water centring on HYV seed-fertilizer-irrigation technology has madesignificant impact on poverty alleviation. The diffusion of agricultural technologies has also changedthe nature and terms of tenancy in the land market with some favourable impact on incomedistribution and poverty alleviation (Mid-term Review).
Benefits from land and water
Apart from increased food grain production there are environmental and social benefits deriving frominvestment in land and water, in particular, flood control and drainage projects. These benefits cannotbe easily quantified. Construction of 6 519 km of dykes including 3 674 km of sea dykes completedby 1989 (later rising to 7 900 km) saved the lives of coastal farmers and the crops they grew fromsalinity intrusion and tidal hazards covering some three million ha.
As noted above, investment in food distribution programmes leading to investment in landand water provided positive results in expanding the food security net. Programmes such as RMP andFFW have not only provided food, but also enabled government to invest in land and water in ruralareas. Under RMP destitute women are organized for maintenance of rural roads; the programmecurrently employs 41 000 destitute women who are also provided training in other income generatingactivities. The annual maintenance of rural roads provides farmer access to markets. FFW added ruralinfrastructure during 1999-2001: 1 987 km of roads, 2 531 km of embankments and excavated 1 487canals.

Investment in land and water in Bangladesh…148
FFW, VGD and RMP address equity issues. While FFW benefits women with income, RMP andVGD serve both women and gender issues by providing training, which creates awareness, enablingwomen to make decisions and undertake initiatives in any business.
TABLE 5Projected economic internal rate of return: selected flood, drainage & irrigation projects
PROJECT NAME DONOR APPRAISALYEAR EIRR (%)
IDA 1979 35
ADB 1980 20-40
IDA 1983 15-22 (FCDI)
Small-scale FCD ProjectsSmall-scale drainage and flood-control project(SSD-FCP)
Small-Scale Irrigation Sector Project (SSIP)
BWDB Small Schemes Project
Small-scale FCDI Project (SSFCDIP)IDA/IFAD 1983 25-40 (FCDI)
IDA 1978 28-38
IDA 1981 21-25
IDA 1970 22
IDA 1975 15
IDA 1977 16
ADB 1977 18
Medium-scale FCD ProjectsDrainage and Flood Control I (DFC-I)
Drainage and Flood Control II (DFC-II)
ADB 1978 18
Source: MPO, National Water Plan Project, Second Interim Report, 1984, p.8.
Redesigned food-assisted rural development programmes address environmental concerns. Forexample, roads were previously constructed under FFW without culverts allowing fish-passes. As aresult, FFW threatened fish production. Under the new programmes, culverts are built under FFWschemes as well. Food-assisted programmes are now combined with afforestation projects to enhanceenvironmental protection and increase fish production (Mid-term Review).
Various donor-funded projects have increased the internal economic rate of return of selectedFCD and FCDI projects (Table 5).

…Investment in land and water 149
Level of project success/failure
The level of success or failures of land and water sector projects is influenced by varied factorsincluding faulty design and time overruns leading to cost overruns. Some failures are attributable topoor management. Public sector-led minor irrigation development, which lasted until the early 1990s,provides examples of failed management. Thus, DTW and LLPs were formerly rented to farmergroups who were meant to pay seasonal rentals to BADC at a fixed rate. DTW rentals have alwaysbeen in arrears; concerted efforts by managers to collect rents on schedule or to provide timely repairand maintenance service were lacking. A joint Bangladesh Government/World Bank study in the mid-1980s led BADC to phase out the rental system for irrigation devices in favour of a sales system.
However, where management is conscious and services to the farmers are satisfactory, rentalsystems can also work well in the public sector. For example the Barind Multipurpose DevelopmentAuthority (BMDA) in northwest Bangladesh operates some 4 000 rental DTW units and rentalrecovery is over 95 percent. A similar project is managed by DAE in southern Bangladesh in whichLLPs and power tillers are rented to farmers and recovery is satisfactory at about 90 percent.
Land reclamation and estuary control in coastal Bangladesh began in 1974. Until 1987 itconcentrated on surveys, training and data collection, but some tangible success was achieved throughbuilding a pilot polder. NGOs helped organize landless farmer cooperatives, 30 of which tookpossession of the land allotted to them within the polder area in 1986. No follow-up action has beentaken. This project cannot be measured in terms of economic benefits, which are outweighed by socialbenefits, evidenced by the fact that hundreds of landless families now have access to land.
People’s participation
People’s participation in project conception, planning, development and execution is vital to projectsuccess, but until the first half of the 1990s, such participation at all stages of project cycles did nottake place. Beneficiary participation in project operation and maintenance developed in the mid-1990s. Many completed BWDB projects did not realize projected benefits due to a lack of funds foroperation and maintenance. The question of cost recovery from the beneficiaries arose as early as1963, but little or no cost was recovered from the completed projects.
Under the BWDB rehabilitation projects an initiative was taken to organize and developWater Users Organisation (WUO). A three-tier system of water users was developed consisting ofWater User's Groups (WUG), Water User's Committees (WUC) and Water User's Associations(WUA).
It was learned that groups are socially very heterogeneous. As in other countries in the region,effective organization for irrigation management through beneficiaries can be difficult to achieve andtakes time (BWDB Systems Rehabilitation Project, 1994). This emphasizes the need to attend tosocial engineering aspects of project design and management.
PART II: HISTORICAL TRENDS AND PRIORITIES
Bangladesh public policy regarding investment and prioritisation in lands and water development wasinfluenced both by (a) the compulsion to protect the country from the ravages of devastating floodsand to attain self-sufficiency in foodgrains. The initial thrust centred on a public sector-ledmanagement approach, mentioned above. Emphasis was on large FCD and FCDI projects until 1972,when a comprehensive study on the land and water sector was conducted by the InternationalDevelopment Association (IDA) at the request of the government. This study drew attention to the

Investment in land and water in Bangladesh…150
need for low cost irrigation systems by exploiting ground as well as surface water resources. That yearsome changes occurred in the institutional arrangement for water resource development. WAPDA wasdivided into two bodies, the Bangladesh Power Development Board (BPDB) and the BangladeshWater Development Board (BWDB), the latter being exclusively responsible for major irrigation,flood control and related activities.
BADC took the lead and infused momentum in minor irrigation sector, while BWDBconcentrated on FCD and FCDI projects. Privatization of the minor irrigation sector was addressedduring the mid-eighties as already stated. In the first phase, the rental of minor irrigation equipmentgave way to a sales system. In the second phase (after 1990), minor irrigation was left totally to theprivate sector and BADC withdrew from the procurement and sale of minor irrigation equipment.BADC was also required to sell its existing stocks in the godown and also those already operating inthe field. This radical change from a public sector-led approach to private sector investment in thewater sector was a difficult decision for the government. There were fears that such a radical changewould impede growth in the minor irrigation sector.
Nonetheless, appropriate policy support for increased private sector involvement wasprovided by government which removed import restrictions (setting the approved brands and modelsof irrigation engines) and import duties and taxes. Public sector presence in minor irrigation, speciallyDTWs, was retained and coupled with integrated area development projects in the northwest throughcreation of a separate body, the BMDA.
In respect of large FCD and FCDI projects, BWDB retains its function as a public sectoragency. There have been changes, however, in its approach to water sector investment. It has alsoopted for small-scale irrigation and drainage projects generally known as Early ImplementationProjects (EIP). These are short gestation projects requiring smaller investment than the usual FCD orFCDI projects. A related development is the initiation of a National Water Plan during the mid-1980s.The objective was to assess total water demand in relation to availability for competing uses such asagriculture, fisheries, water transport and public health. Completion of the National Water Plan led tothe birth of a new institution called the Water Resources Planning Organization (WARPO). Itsdevelopment during the early nineties following the devastating floods of 1987 and 1988 focusedattention on the need to develop a long-term strategy to cope with the complexity of flood impacts.With this thought in mind, the government prepared a flood protection programme and with theassistance of United States Agency for International Development (USAID) specialists carried out aflood policy study. Through this process a Flood Action Plan (FAP) was born, under which a numberof studies were completed.
Development in the nineties led to a greater awareness of water resource planning andmanagement and to formulation of a National Water Policy (NWP) to provide a policy framework forcompeting water uses and priorities. The NWP recognizes that shifting development needs requires abroader perspective to address the diversity of emerging demands on water resources and services.The policy also reflects the awareness that the wider social, environmental and institutionalcomponents of water sector management are not only important, but are central to achieving nationalgoals.
Yet another development providing means to invest in land and water sector took placeduring the 1990s. The Local Government Engineering Department (LGED), primarily responsible forconstruction and maintenance of infrastructure in rural areas, initiated through foreign assistance someprojects in water resource use centring on surface water. Other important developments during the late1980s and 1990s include: creation of WARPO; strengthening research in surface water systemthrough River Research Institute (RRI); and establishment of a Surface Water Modelling Centre(SWMC).

…Investment in land and water 151
LONG TERM PLAN FOR LAND AND WATER
The first comprehensive attempt to develop long term plans for land and water was undertaken by thegovernment during the mid-eighties through the creation of Master Plan Organisation (MPO) whichlater took permanent shape as WARPO, a multi-disciplinary water resource planning body set upunder an Act of Parliament.
National Water Management Plan (NWMP)
The establishment of the National Water Council (NWC) during the mid-nineties was a step forwardto ensure participation of all stakeholders in the preparation and adoption of National Water Policy(NWP) 1999. Based on the policy framework provided by NWP, the draft National WaterManagement Plan (NWMP) was prepared to contribute to overall national goals and to provide aframework plan to guide but not prescribe, in an integrated and comprehensive manner, the actions ofall concerned with developing and managing water resources and services.
The NWMP is a rolling plan to be reviewed and updated every five years, providing a firmplan for the first five years, an indicative plan for the subsequent five years and a 25-year perspectiveplan for the long term, set in a projected context of what may happen in at least 50 years. The NWMPis realistic about the prospects for institutional and implementation capabilities, and seeks torationalize and strengthen the institutional capacity of different stakeholders. It is intended to be ofuse to all agencies and organizations engaged directly or indirectly in the water sector (WARPO,2001).
NWMP has developed and proposed a framework for a water management plan taking intoaccount other sectoral and subsectoral policies, progressing steadily since 1992: the NationalEnvironment Policy (1992), the National Forestry Policy (1994), the National Energy Policy (1996),the National Fisheries Policy (1998), the National Policy for Safe Water Supply and Sanitation(1998), the National Agricultural Policy (1999), and the Industrial Policy (1999).
The draft NWMP notes that these policies in conjunction with the NWP provide an extensiveframework for management of the water sector with no apparent major contradictions. It further notesthat the main policy gap is in land use planning and the lack of an integrated transport policy, whichhas a bearing on navigation. However, it must also be noted that the policy framework provided byNWP has taken into account the needs of water transport including navigation and zoning of land forindustrial use. It is expected that other related issues having relevance for land use planning will betaken into account based on the Land Policy which has now been finalized.
In preparing the NWMP, the future development challenges have been considered. The socio-economic challenges include population growth, urbanization, poverty alleviation, economic growthand development, and employment generation.
Population growth: Total population will increase by 37 percent from 132 million to 181million by 2025, and 224 million by 2050.
Urbanization: Urban population will grow to 73 million (40 percent) by 2025, and to 136million (60 percent) by 2050.
Poverty alleviation: Fifty-seven percent of the population in rural areas and 51 percent of theurban populace is poor.

Investment in land and water in Bangladesh…152
Economic growth and development: Growth rates of 5.5 to 6 percent are projected over thenext 25 years. Fourteen million new jobs will be needed by 2025 plus a further 21 million by 2050.
Democratization and development: Demand is increasing for full consultation andparticipation in all sectors.
Education and public health: Major efforts are required in education and public health withurgent attention to arsenic contamination of aquifers.
Food security: Maintaining rice and protein security will require yield improvements andagricultural intensification, particularly as agricultural land per capita is expected to markedly reduce.
In addition, it has also identified common water related issues and region specific issues (seeBox 1). It is noted that many proposed actions relate to investment in land, specifically including:preservation of the Sundarbans; maintenance of coastal embankment system; flood proofing needs ofaccreted (char) lands and low lying areas; protection of newly accreted land and their development;and erosion in the major rivers.
The NWMP has also drawn attention to technical knowledge gaps. Significant challengesexist in dealing with river maintenance, erosion control, land accretion and coastal management. It hasproposed research on implications and responses regarding climate change, including:
Arsenic: Assessing the current and future extent of contamination and the implications for food safetyof irrigating with arsenic contaminated water;
Groundwater utility: Understanding how quality affects groundwater utility and the long-termstrategic implications.
Natural environmental water requirements: Understanding the relationship between water and thenatural environment and establishing key indicators and thresholds for environmental health andsustainability.
Long-term implications for water management: Promoting dialogue among riparian countries anddeveloping appropriate long-term strategies in response to increasing demands on the system.
Devolved and decentralized water management: Determining the most appropriate models.
Promotion of private sector participation: Assessing how best to promote participation in majorinfrastructure development and management.
Recent approaches to investment in the water sector are holistic, encompassing all sectors of theeconomy. Research on water, and with it land and environment has been emphasized. This reflects achange in priorities from the brick and mortar approach that dominated previous investment decisionsin water to one more consonant with national goals and future development challenges.
…Investment in land and water 153
Funding the National Water Management Plan
The overall capital cost of the NWMP has been estimated to be a little over one trillion Taka orUS$20 billion, distributed between eight clusters as shown in Table 6.
It is intended that these costs will be funded by a combination of traditional governmentallocations from Gross Domestic Product (GDP), beneficiaries, small-scale private sector and othersources. Other sources will include larger private sector instruments, public bond issues and water andenvironment funds, but will be highly dependent on the emergence of the enabling environment.
Inadequate provision for recurring is recognized as a major constraint on sustainable watersector management. The plan will facilitate increased cost recovery based on user pays principles andtransferred responsibilities for scheme operation and maintenance. Furthermore, although therecurring costs will build up to considerable amounts by the end of the plan’s lifetime, the greater partof them will comprise service fees that can be sanctioned. In due course, and based on consultationand sensitization over a suitably protracted period, other recurring costs will gradually become theresponsibility of users – leaving government with a small residue of recurring costs that it shouldrightly cover.
BOX 1
PRINCIPAL WATER-RELATED ISSUES IN BANGLADESH
Common issues: urban and rural services, environmental management and pollution control; local drainageand water management facilities; and arsenic contamination.
South West Region: preserving the Sundarbans; restoring dry season freshwater inflows; maintainingcoastal embankment system; alleviating coastal drainage congestion; Improved cyclone protection; Remedialactions for existing FCDI schemes; floodproofing needs in charland and low-lying areas
North East Region: environmental management of Haor Basin; remedial actions for existing FAC schemes;floodproofing of villages in Haor Basin; erosion of old Brahmaputra left bank; drainage congestion in the kalni-kushiyara and other rivers; local development of the irrigating
North Central Region: bulk water supplies and pollution cleanup for Dhaka; flooding and drainage problems;floodproofing in the charlands and low-lying areas
North West Region: right bank erosion of Brahmaputra; flooding, drainage problems; remedial measures forexisting FCD(I) schemes; drought in western fringes; flood proofing needs in charlands and low-lying areas
South Central Region: maintenance of the existing coastal embankment system; salutation and drainagecongestion; improved cyclone protection; flood proofing charlands and low lying areas
South East Region: gaseous aquifers; improved cyclone protection; maintenance of existing coastalembankment system and drainage congestion; protection of newly accreted lands against tidal flooding and theirdevelopment; remedial action for existing inland FCDI schemes
Eastern Hills Region: small-scale irrigation development in CHT; mini-hydropower development in CHT;improved cyclone protection in CFCP; maintenance of existing coastal embankment system
Rivers and Estuary Region: affordable long-term strategy for erosion protection; affordable long termstrategy for regional augmentation; floodproofing needs in charlands and low lying areas; improved cycloneprotection in the Meghna Estuary; erosion of Meghna River; timely protection of newly accreted lands.

Investment in land and water in Bangladesh…154
The Special Programme for Food Security
With assistance from FAO and other donors government implemented a Special Programme for FoodSecurity (SPFS) with three components: intensification, water control and diversification. As part ofthe intensification component the programme will develop soil testing and analysis based on soil testkits. This activity is correlated with a programme of sample soil analysis in soil laboratories. Farmersand extension staff will be trained to use field test results to determine fertilizer needs. Crop recyclingand rotation and the use of biomass compost and farmyard manure will be promoted. In addition,farmers in the pilot area will be encouraged and trained to undertake integrated pest management.
The results of the on-farm water management pilot programme in support of SPFS wereencouraging. The irrigation command area has been increased by some 20 percent. Trainingprogrammes under the project have helped extension personnel and participatory NGOs in theircapacity building and in developing knowledge and skill in improved water management and cropproduction technology. The major innovations introduced through this programme include: (a)delineation of manageable irrigation and drainage channels, (b) irrigation scheduling in accordancewith crop water requirements and (c) supplementary irrigation for rainfed rice crops. This has had ademonstration effect; neighbouring villages have learned the usefulness of supplementary irrigation,which is vital for Aman rice in drought prone areas. Research showed that with supplementaryirrigation in drought-prone districts (2.8 million ha), increased yields of 20 to 30 percent can beachieved.
TABLE 6Overall capital cost of the Bangladesh National Water Management Plan (NWMP)
Estimated Cost in Billion Taka(mid-2000 prices)
Percentage of Overall NWMPCluster
ShortTerm
MediumTerm
Long Term Residual Total Budget
InstitutionalDevelopment
5.71 5.99 7.76 0.48 19.94 1.98
Enabling Environment 0.88 0.89 1.70 0.20 3.67 0.37
Major Rivers 10.88 29.50 152.78 35.22 228.38 22.70
Towns and RuralAreas
28.87 70.96 152.57 8.49 260.89 25.94
Major Cities 25.84 106.57 254.39 14.51 401.40 39.89
Disaster Management 6.40 7.83 12.30 0.54 27.17 2.70
Agriculture and WaterManagement
4.25 7.67 27.48 6.47 45.87 4.56
Environment andAquatic Resources
3.67 5.47 9.07 0.50 18.71 1.86
Total 86.50 234.88 618.15 66.41 1 005.94 100.00
Source: National Water Management Plan,Ministry of Water Resources,Government of Bangladesh, July 2001.Note: ST = short-term; MT = medium-term, LT = long-term.

…Investment in land and water 155
PART III: PRIVATE INVESTMENT IN LAND AND WATER
Discussion will now be made on (a) how private investment in land and water has grown independentof project support/area, (b) what are the perceived impediments to private investment and (c) in whatareas and at what level a complementarity can be established between public and private investmenton land and water.
How private investment has grown
In its simplest form, private investment in land and water has been driven by the struggle for survival.The level of investment started to increase as the demand for food crops, fish and meat increased withpopulation growth. It has also been supported by policies adopted by the government from time totime. These measures initially included credit support for crop production. The advent of the GreenRevolution in the 1960s resulted in higher productivity per land unit, while water demand forirrigation and additional crops increased. Large-scale FCD and FCDI projects required heavyinvestment and technical support at levels unattractive to the private sector. However, policy changesin the minor irrigation sector which led first to the change from rental to sale system and thenwithdrawal of import restrictions, gave further impetus for private investment.
The magnitude of private investment by farmers in the minor irrigation sector can be seenfrom the historical trend in the use of various types of irrigation pumps (Table 7).
Until 1989 there were restrictions on the import of STW and LLP. Only standardized makesand models approved by the Standardization Committee of the Ministry of Agriculture could beimported. When the restrictions were withdrawn, investment by farmers in equipment purchaseincreased significantly. It is significant that investment in DTW did not keep pace with STWs andLLPs primarily because of the high cost relative to other two types of equipment. Investment in minorirrigation is closely related to rice prices, in particular a rainfed rice variety called Aman (NationalMinor Irrigation Census, 1999-2000).
Performance in regard to investment in agriculture and water resources (Table 8) indicatesthat private investment is lowest in the forestry sector, followed by that of water resources. In all othercases, private investment is much higher than public investment. As explained, the relatively low levelof private investment in water resources is largely due to the need for large amounts of funding.Limited private investment in commercial forests, however, is primarily due to the lack of availableland plus the fact that the idea of commercial forestry as a business has not yet taken root inBangladesh.
On the other hand, rising national demand for fish, poultry and dairy products – and in somecases export potential – has led to higher investment in these subsectors. The number of dairy farmsrose from 26 000 in 1994-1995 to 33 000 in 1999-2000, while 76 000 poultry farms in 1994-1995rose to 106 000 in 1999-2000 – all private sector led investments. Much of this can be explained bypublic policy factors conducive to business growth: first, government (through project intervention)provided necessary credit and technical support to develop agro-based industries; second, selectedentrepreneurs were provided facilities and exposure to necessary technologies; and third, businessincentives (lower tariffs or tax-free status, tax holidays and other concessions) encouraged growth.
On the other hand, rising national demand for fish, poultry and dairy products – and in somecases export potential – has led to higher investment in these subsectors. The number of dairy farmsrose from 26 000 in 1994-1995 to 33 000 in 1999-2000, compared to 76 000 poultry farms in 1994-1995 increasing to 106 000 in 1999-2000 – all private sector led investments. Much of this can beexplained by public policy factors conducive to business growth: first, government through projectintervention provided necessary credit and technical support to develop agro-based industries; second,

Investment in land and water in Bangladesh…156
selected entrepreneurs were provided facilities and exposure to necessary technologies; and third,business incentives (lower tariffs or tax-free status, tax holidays and other concessions).
However, project intervention had only a demonstration effect. Major investment in thesesectors has been generally independent of any project support being driven mainly by market demandand an attractive return on investment. Government established an infrastructure developmentcompany (IDCOL), which currently provides subordinated or junior loans for investment ininfrastructure and utilities. IDCOL is examining the possibility of diversifying its products; if foundappropriate loans could be provided for private sector investment in land and water. IDCOL, however,needs additional resources to continue its operation (Memorandum for Bangladesh DevelopmentForum 2000-2001).
TABLE 7Operational equipment by season 1982/83 to 1999/2000
IRRIGATIONSEASON
ANNUAL OPERATING EQUIPMENT
(‘000 UNITS)
ANNUAL PERCENTAGE CHANGE
STW DTW LLP STW DTW LLP
1982/83 93.1 13.8 35.5
1983/84 120.3 15.5 36.0 29.2 12.3 1.4
1984/85 147.0 16.9 37.0 22.2 9.0 2.8
1985/86 146.0 17.9 37.5 -0.1 5.9 1.4
1986/87 160.3 18.7 40.6 9.1 4.5 8.3
1987/88 188.7 20.3 42.3 17.7 8.6 4.2
1988/89 235.9 22.4 50.8 25.0 10.3 20.1
1989/90 260.0 22.6 51.0 10.2 0.9 0.4
1990/91 270.3 21.5 51.6 4.0 -4.9 1.2
1991/92 309.3 25.5 50.3 14.4 18.6 -2.5
1992/93 348.9 25.7 52.2 12.8 0.8 3.8
1993/94 359.2 24.5 52.6 3.0 -4.7 0.8
1994/95 488.9 26.7 57.1 36.1 9.0 8.6
1995/96 576.2 27.3 60.6 17.8 2.2 5.1
1996/97 629.8 25.2 62.9 9.3 -7.1 3.6
1997/98 664.7 25.3 66.3 5.5 0.6 5.4
1998/99 736.1 26.7 72.9 10.7 5.3 10.1
1999/00 757.1 25.1 71.6 2.9 -6.0 -1.8
Source: DAE, National Minor Irrigation Development Project, Minor Irrigation Census, 1999-2000.Note: 1982 to 1993/94 data from Census of Irrigation in Bangladesh, ATIA

…Investment in land and water 157
Risks in investment in land and water
The private sector investment in land and water, specially land should be judged in terms of risksassociated with such investment from environmental and other considerations. One of the major risks,which are not particularly confined to private sector investment, is the rapid urbanization process andincreasing demand for rural roads and other infrastructure for which public investment has to bemade. Added to the above is the demand for more lands for housing, specially in the peri-urban areas.In these areas, private sector has shown increasing interest and has started increasing investment inreal estate development. The combined effect of all these coupled with loss of land due to rivererosion has led to a sharp decline in the total area of arable land. This is a matter of concern since theannual loss of cropland is estimated at 80 000 ha. This underscores the need for greater investment inland reclamation programmes and zoning of land with supportive provisions for industry and non-agricultural purposes.
TABLE 8Projected investment in agriculture and water resources 1997-2002
Sectors Public Private Total
Crop Agriculture 21.43
(0.50)
65.04
(1.52)
86.47
(2.03)
Fisheries 5.86
(0.14)
21.84
(0.51)
27.70
(2.03)
Livestock 5.44
(0.13)
20.64
(0.48)
26.08
(10.61)
Forests 6.98
(0.16)
4.73
(0.11)
11.71
Water Resources 73.37
(11.72)
7.34
(10.17)
80.71
(1.89)
Total 113.08
(2.65)
119.59
(2.80)
232.67
(5.45)Source: Fifth Five-Year Plan, 1997-2002, Planning Commission, Ministry of Planning, BangladeshNote: Figures in parentheses are billion US$ at 1996-1997 exchange rate. i.e. US$1 = Taka 42.70.
Impediments to private investment for land and water
The major impediments to private sector investment on land and water may be discussed. In respect ofland the major impediments are uncertainties or vagueness in respect of landownership, which landsthe investors in problems of litigation. A related problem is the fear of acquisition of land by thegovernment in public interest. Absence of provision of credit for purchase of land is another obstacleto invest in land. While these impediments would be applicable for investment in land for industrialpurposes, investment in land for agricultural purposes is primarily impeded by atomized nature ofplots of lands. According to the latest Agricultural Census (1996) out of 11.8 million households, 80percent belongs to smallholdings defined as an area from 0.5 to 2.49 acres.
In respect of the water sector the major private investment is mainly done in wetlands and theprevailing system of leasing out the right to fishing needs to be vastly improved in terms of the lengthof the lease period and other terms and conditions. In the wetland locally called haors and baors there

Investment in land and water in Bangladesh…158
is a conflict between those who wishes to promote fisheries and those who have interest in producingrice. Unless this conflicting demand is satisfactorily solved large-scale investments in these areas willnot be forthcoming. While this would apply to investments for fisheries sector, major impediment toirrigation is the requirement of capital for FCD and FCDI projects. The levels of investment are highand it will continue to remain within public sectors.
Complementarity for private and public investment in land and water
The NWP provides a policy framework to establish levels of complementarity for investment bypublic and private sectors. The strategic elements include: coordinating public and private sectorstakeholders; associating beneficiaries and protecting their water management interest; transferoperation and management (O&M) responsibility of projects with command areas of less than 5 000ha to beneficiaries responsible for O&M from their own resources; transfer operation andmanagement responsibility of projects exceeding 5 000 ha by private sector contract (through opencompetitive bidding). Alternatively, the executing agency may jointly retain managementresponsibility with local government and beneficiary groups; transfer FCD and FCDI projects with acommand area of 1 000 ha to local government institutions by phases; provide training andinformation to the private sector and beneficiary groups for capacity building in efficient watermanagement.
PART IV: CONCLUSIONS
The discussion on land and water sectors lends itself to several conclusions. In Bangladesh investmentin land and water has a symbiotic relationship. Investment in the water sector, especially thoserelating to land reclamation, development and management of accreted land, prevention of rivererosion, construction, repair and maintenance of coastal embankments etc. directly and indirectlycontribute to land development and also conduce to greater productivity as (a) additional lands areavailable and (b) loss of land is prevented. Investment in FCD and FCDI projects similarly help ineither preventing crop losses and/or contributing to higher productivity through irrigation.
Bangladesh has a long history of investment in land and water, primarily led by public sectororganizations, dating back to 1959. Policy shifts in management approach for land and waterdevelopment projects and programmes have occurred since then. The major policy shift has been inrespect of minor irrigation centring on the use of pumps (1989), which allowed greater opportunitiesfor investment by the private sector, primarily farmers themselves.
While investment and management in minor irrigation is now exclusively privatized, majorirrigation (FCD and FCDI projects) continues in the public domain primarily due to the level ofinvestment and technical expertise required for its operation and management. The policy frameworkadopted through the NWP nonetheless provides opportunities for private and local governmentinstitutions to own and operate water development programmes not exceeding 5 000 ha commandarea. For those exceeding 5 000 ha, NWP permits private sector investment in operating andmanaging such programmes under lease and management contract. The proposed diversification ofproducts by IDCOL is expected to further expand and strengthen opportunities for such investmentprovided necessary resources are made available to it.
Impact of soil and water development on poverty alleviation, employment generation, incomeaugmentation and food security has been positive in more ways than those herein discussed. InBangladesh, it is all the more so because of the nature and size of farms, 80 percent of total ruralfarms do not exceed one hectare. Due to continued investment on land and water, food availability ona per capita basis increased from 433 grams in 1995-1996 to 534 grams in 1999-2000.

…Investment in land and water 159
The recent policy changes as reflected in the NWP providing for greater opportunities for theprivate sector is firmly rooted in the experiences gained in the past in respect of operation andmaintenance of successful and unsuccessful projects. The lessons learnt from successful andunsuccessful projects have led the government to adopt a holistic approach to land and waterdevelopment in order to provide much greater benefit to the society as a whole than was possible inthe past with fragmented approach in these sectors.
The holistic approach with long term development plan as reflected in the NWMP is expectedto minimize social, environmental and other associated risks in land and water developmentprogrammes. The provision of review of the plan every five years has been consciously made forkeeping the implementation process under close and constant review and providing scope forappropriate adjustments in the greater interests of all stakeholders.
Two major areas of concern remain to be addressed. First, in Bangladesh context thecontinued decimation of arable land through rapid urbanization, development of infrastructures inboth urban and rural areas call for much higher level of investment on land and water than isavailable. The investment programme delineated in NWMP will remain meaningless unless it isbacked by appropriate level of funding. The second concern, which is linked to the first, is thedeclining level of official development assistance (ODA) to developing countries in agriculture sector.The incremental requirement of investment in the sector of such countries are estimated at aboutUS$31 billion per annum of which approximately one-third is required for investment in irrigation.Investment in land and water has long lasting effects in terms of ensuring food security: makingopportunities for the poor to have access to better standard of living, preventing environmentaldegradation, reversing the declining trend of ODA for these sectors will be a step towards achievingthe objectives agreed at the WFS in 1996 by world leaders and will be a step away from a hungry andmalnourished world.
BIBLIOGRAPHY
Brammer, H. 1997. Agricultural Development Possibilities in Bangladesh, University Press Limited, Dhaka.
Bangladesh Water Development Board, 1994. Systems Rehabilitation Project, In Proceedings of NationalSeminar on Implementation of Pilot Cost Recovery Programme in KIP, Dhaka.
Department of Agricultural Extension, undated. National Minor Irrigation Development Project, NationalMinor Irrigation Census, 1999-2000. Dhaka.
FAO. 1998. The state of food and agriculture 1996, Rome.Ministry of Finance. 2001. Bangladesh Economic Survey 2001. Dhaka.
Planning Commission, undated. Fifth Five-Year Plan (1997-2002). Dhaka.
Planning Commission, undated. Mid-term Review of the Fifth Five-Year Plan. Dhaka.
UNDP. 1989. Agriculture Sector Review, Bangladesh Agriculture Performance and Policies, CompendiumVolume III: Land, Water and Irrigation. Dhaka.
Water Resources Planning Organization. 2001. National Water Policy (Draft). Dhaka.
World Bank and Government of Bangladesh. 1992. Proceedings of the Second Flood Action Plan Conference.Dhaka.

…Investment in land and water 161
INTRODUCTION
Cambodia is bordered by Thailand in the west and by Laos and Thailand in the north, by VietNam in the east, and by the gulf of Thailand in the south (Figure 1). The total land area is 181 035km2, consisting of 24 provinces, including two municipalities and 172 districts. Forest areas cover12.1 million ha or 67 percent of total land area. The cultivated area is 3.78 million ha or 21 percentexcluding land mine areas (Table 1). Rice cultivation in 1999 was 2.08 million ha, or 91.2 percent oftotal cultivated areas.
Population is currently estimated at 12 million, growing at annual average of 2.8 percent andwith a population density of 51 persons/km2. It is a notable sex imbalance: 52.2 percent are femaleand 47 percent male, and a high proportion of are in younger age groups because of decades ofconflict. The current per capita GDP (US$290) is considered one of the lowest in the world. Theagricultural sector is Cambodia's top earner in the national economy, accounting for 75 percent of allemployment and 45 percent of the GDP in 1994. Cambodia is a rice-producing and exporting countrywith favourable natural conditions for paddy cultivation.
The overall goal of the Royal Government of Cambodia (RGC) is poverty eradication throughsocio-economic development. Thirty-six percent of the population is estimated to be below thepoverty line. Strategies for attaining these goals focus, among other things, on improved access topublic services, provision of safe drinking water and sanitation (particularly in rural areas), improvedinfrastructure and increased agricultural productivity to achieve food security. The water sector helpsachieve many RGC development goals. Irrigation supports agriculture, and therefore the achievementof food security, poverty reduction and socio-economic development. Water supply and sanitationmeet the needs of the urban and rural populations, as well as their health requirements, and contributeto the achievement of better living standards. Drainage and sewerage support improved health andliving standards while hydropower development aims at socio-economic development. Inlandnavigation moves goods and passengers from one place to another, and facilitates tourism. In general,water contributes to the livelihood and food supply of the population by providing fish, animal proteinand aquatic plants.
_________________________________________________________________________________
Chann Sinath, Deputy Director, Irrigated Agriculture DepartmentMinistry of Water Resources and Meteorology. Phnom Penh, Cambodia
Investment in land and waterin Cambodia

Investment in land and water in Cambodia…162
Under Article 59 of the 1993 constitution, "the State shall protect the environment andbalance of abundant natural resources and establish a precise plan of management of land, water, air,wind, geology, ecological system, mines, energy, petrol and gas, rocks and sand, gems, forests andforestry products, wildlife, fish and aquatic resources". By this provision the state recognizes thevalue of natural resources, including the resources of water and land, as strategic for the country'sdevelopment and the enhancement of the welfare of the people.
TABLE 1Land use and cultivated areas in Cambodia
Land Use Group Area (ha)
I. Natural Area A. Forest 1. Mainly evergreen forest a. Broad leafed forest
Dense broad leafed forest Flood evergreen forest Mangrove forest Mosaic of evergreen or deciduous forest and secondary vegetal formations Mosaic of flooded forest, swampy vegetation, fallow land Secondary vegetation
b. Pine forest (P. merkusii)
2. Deciduous forest
B. Other vegetation Thickets Scrub, brushwood Grass savannah Grassland susceptible to flooding Swampy vegetation
II. Cultivated areas Paddy field Paddy field with palm trees Mosaic of upland crops and secondary vegetal formation Mosaic of field crops and fruit garden/rural area in the lowland Plantation (rubber)
III. Other land usages Bare land and sandy banks
Open water areas, rivers
12 000 200
6 283 4004 816 000
361 70061 400
528 900
157 200358 200
9 800
6 007 000
1 529 20095 600
102 600129 000822 900379 100
3 785 0001 377 1001 309 200
839 400174 40084 900
539 10051 500
487 600
TOTAL 18 153 500
Source: Data from Irrigated Agriculture Department, Ministry of Water Resources and Meteorology (MOWRAM)

…Investment in land and water 163
PREVIOUS DEVELOPMENT OF WATER RESOURCES AND LAND
Ancient history
From time immemorial, water management has been a primary concern for the Khmer people.Agricultural production, central in the economy of our early civilizations, relies on it. Due to irregularpatterns of rainfall with dry spells during the growing season, the annual inundation and variations inmicro relief, water management is quite difficult and, depending on local circumstances, variedmethods have been developed since the earliest emergence of Khmer civilization. Numerous varietiesof rice well adapted to differing local conditions were developed.
Three types of farming can be distinguished:
Floodplain farming: These farmers grow broadcast rice watered by natural flooding in two majorfloodplain areas from the first centuries of Cambodia's history. One is today's Korat plateau innortheast Thailand, while the other is the Mekong River delta, now mainly in Viet Nam. Settlementswere characterized by year round availability of water, ease of land reclamation and a gentle floodregime. In those days, water resource development basically meant digging additional ponds, canalsand moats. Some are quite large, even by today's standards. They often had multiple functions:serving as reservoirs for domestic use, supplementary irrigation in dry periods, stock and fishbreeding and transport. By the tenth century, these locations were almost entirely abandoned, perhapsbecause of a change in the flood patterns or because of security reasons in the delta when piratesattacked settlements.
Bunded field farming: This practice was developed from the eighth century onward by reclaiminglowland forest into small bunded fields. It is estimated that more than 50 million bunded fields existedin the Angkor period. Agricultural and water management practices developed strongly and becamemuch more labour intensive during that time. Rice is no longer sowed directly but is transplanted fromnursery beds; fields are levelled. Many methods have been developed to distribute, retain and retardwater during the rainy season or floods, including building small bunds or dams across valley floorsof small streams (without reaching the sides of the valley) and digging ditches or building bundsparallel to main streams to trap receding waters or to store water flowing in from tributaries oradjacent areas.
Receding flood farming: Depending on local circumstances, the micro relief with depression, leveesand tributaries, a great diversity of sophisticated receding flood farming practices have beendeveloped in the floodplains of Cambodia. Water from the preceding flood and tributaries is retardedand spread laterally by bunds, small dams, dykes, ditches and stored in bunded fields, naturaldepressions and swampy areas or in various types of man made reservoirs. After the rainy season,supplementary watering is achieved by gravity from reservoirs or tributaries using ditches and/orsimple water lifting devices. Often, rice is grown in the upper parts of the depression or reservoirs andwater plants in the deeper parts.
Present methods of development
The methods described above are still widely practised in Cambodia. Intake and diversion structures,canals for the transport of irrigation and drainage water, and organization for operations andmanagement.
Angkor Wat and super irrigation schemes: From the seventh to the thirteenth centuries agreat civilization, called Angkor Wat (after its capital) developed near Tonle Sap, the Great Lake. Tocreate a replica of heaven, walls, temples, roads and city moats were oriented according to

Investment in land and water in Cambodia…164
cosmologically ideal directions, i.e. North-South and East-West, and so were their often hugerectangular ponds. After discovering the ruins of Angkor in the jungle, the French began restorationand the remains of this great past became the basis of a great national myth. The myth suggests thatAngkor's ancient system of moats, ponds and canals, formed a 'super' irrigation system which not onlywas the basis for its rice-cultivation based wealth but that it also cannot be surpassed by contemporarywater wisdom.
Recent history, the Sihanouk period (1953-1970): Inspired by the example of Angkor, PrinceNorodom Sihanouk vigorously promoted upgrading water management, and self-help projects wereplanned and carried out countrywide by the local population under the supervision of local civilauthorities or Buddhist monks. Little knowledge was required to rescale traditional structures intolarger ones, using concrete instead of wood and woven rattan. Many reservoirs in the floodplains wereformed by constructing dams. Traditional dams are low, overtopped by the slowly rising flood.Higher dams require intake structures able to be closed and a crest level above peak flood, becauseovertopping waters will cause too much damage to be repaired during short operating periods.Following establishment of the Mekong Committee in 1957 many project locations for large-scaledams were identified in the 1960s. A cascade of large hydropower dams, mainly in combination withirrigation schemes (up to 200 000 ha) was planned in the mainstream and major tributaries. Most ofthese projects hardly reached the feasibility phase. In Cambodia only the Prek Thnot project (about70 000 ha) had been initiated before the war broke out in 1970.
FIGURE 1Map of Cambodia and irrigation locations

…Investment in land and water 165
The Khmer Rouge period (1975-1979): As during the Angkor Wat period, rice became thestate's economic basis under the Khmer Rouge regime. Almost the entire population was forced togrow rice during the wet season and to construct water management and irrigation systems during theremaining five to eight months of the year. The country was to be turned into a super irrigationsystem, to become independent of rainfall. Those few persons with the required technical knowledgehad either fled, been killed or were not consulted during this process. Prompted by the Angka, thepolittcal centre of the Khmer Rouge, irrigation canals were not laid-out according to contour lines, buton the coordinates which were drawn on most 1:50 000 scale topographical maps. As a result, canalsfrom this period are situated in North-South or in East-West directions having a distance betweenthem of one kilometre. In this way a chessboard of canals was formed. Due to the inclination of theterrain, sections of these canals often slope in different direction than other sections.
Present situation: Today, more than 20 years after the Khmer Rouge regime, it is clear thatonly a small percentage of these structures can be incorporated in any future water managementsystem, and they will require much additional investment. Most of the structures are useless or, evenworse, disruptive to water management.
THE ROLE OF WATER IN THE AGRICULTURE OF CAMBODIA
Government social-economic development requirements and proposals make several references towater resources and their management. Water is seen as contributing to Government prioritiesincluding poverty alleviation and economic growth principally as irrigated agriculture, seen asessential to addressing poverty by achieving food security and promoting income generation in ruralareas. The importance of water is recognized also in the context of water for irrigation. Governmentproposals for public sector investment allocate about 22 percent of projected investment funds to theirrigation sector.
Rural agriculture dominates the Cambodian economy, accounting for nearly half of the grossdomestic product and 90 percent of employment. Consequently, water policy as a whole and irrigationin particular, are significant factors in the development of agriculture leading to food security, povertyalleviation and commercialization. Today, the irrigation has been made available to only 16 percent oftotal cultivated area (Tables 2 and 3). Available data reveal that the country is using only 1 percent ofits total water resources of which 82 percent is in agriculture. Double cropping in full or partialcontrol irrigation schemes is minimal. Production in irrigated rice yields is too low – averaging some2 tonnes/ha. Irrigation rehabilitation and construction are thus priorities set by the Royal Governmentof Cambodia and the active involvement of user farmers is deemed essential at every stage and level.
Rice ecosystems
The International Rice Research Institute (IRRI) has defined four main ecosystems, three wet seasonand one dry season. The wet season systems compare: upland or mountain (2 percent), rainfedlowland (85 percent), including land with supplementary irrigated area, and deepwater/floating (4percent). In the dry season (9 percent), the crop is fully irrigated or grown with supplementaryirrigation either in deep flooded areas or on land exposed by the receding flood.
Wherever possible, supplementary irrigation is given during periods of low rainfall. Somemodern varieties are grown in shallow water, but medium- and deeper-water rice varietes, accountingfor 80 percent of lowland rice, are exclusively traditional. These traditional varieties will yield even ifplanting is delayed until September by late arrival of the monsoon, being photosensitive at reducedlevels.

Investment in land and water in Cambodia…166
TABLE 2Total rice harvested and irrigated areas, 1999
Harvested Area, 1 000 HAProvinceWet Season Total
Irrigated Area1 000 ha
Banteay Mean CheySiem ReapPreah VihearStung TrengRatanakiriMondulkiriKratieKompong ThomBattambangPursatKompong ChhnangKompong ChamSvay RiengPrey VengKandalTakeoKompong SpeuKoh KongKompotKompong SomPhnom Penh
140.2181.0816.91113.46617.6186.180
20.61799.164
168.57171.95083.066
167.243162.318240.22542.674
173.13184.3037.272
133.1079.5
5.396
0.310.0
----
6.01.81.20.19.9
30.09.0
57.045.058.01.0
-2.5
-1.2
140.5191.0816.91113.46617.6186.180
26.617100.964169.771
72.0592.966
197.243171.318297.22587.674
231.13185.3037.272
135.6079.5
6.596
3625.50.30.80.20.21237522622302040204022
0.619.3
3.1
Total 1 843 992 233 2 076 992 407
Source: Irrigated Agriculture Department, MOWRAM
Deepwater (floating) rice is grown where the water depth exceeds about 80 cm (up to 400 cm)in flooded areas around the Tonle Sap and in depressions along the Mekong River, mainly inKampong Thom, Kompong Cham, Prey Veng and Takeo provinces. Most deepwater crops are dryseeded in April/May with seeds germinating with the onset of the rains. The depth and duration offlooding is dependent upon local rainfall and/or the height of the Mekong River. Areas may remainflooded for three to six months.
Dry season rice may be grown either as a fully irrigated crop at the end of the wet season, orin flood recession areas, normally with supplementary irrigation. Dry season rice is also now beingplanted in deep flooded areas in place of the more risky and lower yielding floating rice, that is grownin the wet season. Under these circumstances supplementary irrigation is normally provided. Mostlymodern varieties are used, and yields are significantly higher than for the wet season crops.
TABLE 3Implemented irrigation methods in Cambodia (1999)
MethodIrrigated area, ha
Wet season Dry seasonGravityPump StationMobile PumpTraditional Lift
87 80019 35073 85023 000
119 70023 65047 85011 800
Total 204 000 203 000Source: Irrigated Agriculture Department, MOWRAM

…Investment in land and water 167
REFORMS TOWARD PARTICIPATORY WATER MANAGEMENT
After nearly three decades of war and civil strife, the Cambodian economy continues to be affected bya legacy of turmoil. Agriculture is the backbone of the Cambodian economy, and it depends onirrigation – supplementary irrigation for wet season crops and full irrigation for dry season crops.Most existing systems were damaged by natural deterioration due to inadequate finance to supportforming Farmer Water User Communities (FWUC) to operate and maintain irrigation systems:government and donors (the Asian Development Bank and others) are not funding FWUCformulation.
The former General Directorate of Irrigation, Hydrology and Meteorology established anational policy called Circular No. 1 (hereafter termed CN1) on implementing policy for sustainableirrigation systems without testing and development due to a lack of financial resources. In 1999, theMinistry of Water Resources and Meteorology (MOWRAM) was established, and it collectedreactions to CN1 from farmers and NGOs, The ministry then organized two workshops – a regionalworkshop at Battambang for northwestern provinces and a national workshop in Phnom Penh – toassess participatory irrigation management and sustainable irrigation development, to develop CN1and support documents. The ministry established a steering committee including all concernedMOWRAM senior technical officers a members chaired by the ministry Under Secretary of State. Thecommittee reviewed CN1 to clarify and disseminate information to stakeholders. After endorsementand approval by the Minister of Water Resorces and Meteorology, creation of a Prakash 306 tookplace. Currently, Prokash 306 is endorsed, approved, issued and used for formulation the FWUCs.
Today, the Ministry of Water Resources and Meteorology need the resources to implementCircular No.1 and Prakash 306 in existing irrigation systems by forming FWUCs and supportoperation and maintenance costs for the first phase of five years. These are aimed to experience inproviding a greater role for empowerment of autonomous and self-reliant FWUCs. Other purposes areto make sure on transfer of authority over management and financing irrigation systems.
CORE CONSTRAINTS IN WATER MANAGEMENT
A major constraint on crop production is substantial seasonal and year-to-year differences in wateravailability, which severely limits the ability of rural households to consistently provide for their ownfood needs, much less grow crops for sale. This is due to problems in water management inCambodia, including the abundance of water in the wet season and its shortage in the dry season. Inthe wet season, the main tasks of water management include additional water for supplementaryirrigation, controlling, regulating, and managing floods to protect human lives, property and crops. Inthe dry season, available water resources must be shared, for instance, between domestic use,irrigation, navigation, fisheries, livestock and forestry.
A Mekong River Commission assessment of some irrigation systems built during the KhmerRouge period noted that at least one big dam was built on each tributary of the Mekong, Bassac andTonle Sap. These dams had dual functions, e.g. to store water and to act as regulation structures forthe chess board irrigation schemes. Often they were located in the flat lowlands of the tributaries andcause long lasting inundation with a negative impact on agricultural production. Most have since beenflushed away, or the river has eroded a new riverbed next to the dam. In the flood plains, especiallyaround the Great Lake, many canals have been dug towards the lake, but instead of providingirrigation, they serve to drain water, and at velocities which cause erosion. Much back swamp foresthas been turned into rice fields – with a negative impact on fish production. Most hydraulic structuresfailed because of design defects such as: 1) erosion and scour (no stilling basin, soil protection or cut-off walls were applied), 2) structural problems (concrete structures lacked rebar or rebar was placed in

Investment in land and water in Cambodia…168
the wrong place, concrete was of poor mix, earth was not compacted and the base was not stripped),and 3) hydrology complications (in all known sluices the apron was too high and the width too smallfor the peak flood).
Almost no trained managerial personnel, means, capable organizations or databanks arepresent: a problem that is most strongly felt at provincial and lower levels. Compared to the need, thecapacity of governmental organizations is far too weak, which results in a continued struggle in thefield of water management. Farmers still using traditional water management methods are asdependent on the irregular rains as in the past and are often confronted with new problems associatedwith an altered water environment. Attempts to improve the situation (mostly requested by thefarmers themselves) often fail and many recently built structures will collapse within a few years ifthey have not already done so. Why is this so? The only examples known by the responsible buildersare the structures in their own neighbourhood or their own familiar methods and no other sources ofknowledge are available. As a result, mistakes of the past are frequently repeated while improvementsare achieved in a laborious trial and error process.
TABLE 4Rice cultivated areas by rice ecosystems (1999) and calendar
Rice Type HarvestedArea (ha)
Sow Harvest Yield(t/ha)
Production(t)
Wet Season UplandRainfed Lowland: - early - medium - lateDeepwater
DRY SEASON Irrigated and recession
48 138
371 553838 237529 49556 569
233 000
May
MayMay/JuneJune/JulyApril/May
Jan./Feb.December
October
end OctoberDecemberJanuary
Feb/March
AprilFebruary
1.4
1.61.81.71.3
3.04
67 393.2
594 484.81 508 827900 141.573 539.7
708 320
TOTAL 2 076 992 3 852 706.2Source: Irrigated Agriculture Department, MOWRAM
The key constraint facing investment in agriculture is the poor state of the national economy:the ministry's budget is severely limited. Consequently, there are limited funds for technical surveyand design, construction of irrigation infrastructure and operation and maintenance of existingirrigation schemes.
The main problems in provinces around the Great Lake and Mekong River in using high yieldvarieties of rice and other crop diversification and intensification include: (i) existing irrigationfacilities have insufficient operation and maintenance funding (O&M), (ii) there are existing FarmerWater User Communities (FWUCs) but most farmers still do not understand the core concepts ofO&M participation. While some know about community organization and development there is littleaction and low levels of application. Finally, (iii) such areas face annual floods and droughts.
Previously, there was no mechanism for charging farmers for water (except for pump stationsin which case farmers bought fuel) so that the total cost of construction, operation and maintenancefell upon government. One dilemma facing MOWRAM was that without income from water chargesit was unable to provide maintenance to keep existing systems operational and without good service,farmers were unlikely to be persuaded to pay even minimal water charges.

…Investment in land and water 169
Farmers and local authorities often do not have the knowledge to improve and repair systemsthat are technically unsound. Many structures failed shortly after rehabilitation, e.g. the system did notperform as expected, and caused inundation problems. As a result, farmers are still confronted withwater management problems and their energy and resources are unnecessary wasted. Moreover, thereis no sound basis for sustainable management of the systems: it will be very difficult to incorporatemany such existing schemes into further arrangements for water management and to developconfidence between the system managers and the system users, the farmers.
Landmines. In the aftermath of civil war some fertile agricultural land can still not becultivated due to the presence of mine fields. Although about 3 200 km2 are reportedly mined (thetotal number of mines estimated at about 5 million) most mine fields are not found on riceland. Evenso over one hundred persons are reported killed or injured by landmines each month. The main areasaffected are Kampot and Kompong Speu provinces in the south and Battambang, Banteay Meacheyand Siem Reap provinces in the north, as well as the entire border with Thailand. Mines havefrequently been laid along roads and watercourses to deny access to water. Few minefields arereported east of the Mekong River.
Cambodia ranks 140th of 174 countries and is among the bottom 20 percent worldwide. It is22nd poorest in term of US dollar per capita income. On this basis 43 percent of the rural populationwere living below the poverty line in 1994 – nearly 3.7 million people and 85 percent of all thoseclassified as poor. There is a non-economic dimension to rural poverty. Government policy is clearlyfocused on reducing poverty by improving income and food security. To achieve this, national anddonor investment in the FWUC formulation process is extremely essential for operation andmaintenance the existing working irrigation and drainage systems including flood control becausethese are toward the target of real Agricultural Productivity Development and commercialization ofthe surplus.
AVAILABLE WATER RESOURCES
Some 86 percent of Cambodia lies with the catchments of the Mekong River. Rising in China, theriver passes through or borders Myanmar, Laos, Thailand and Viet Nam before discharging in theSouth China Sea. With a drainage area of 810 000 km2 and a total length of 4 425 km, the Mekong isone of the major rivers of the world. The mean annual discharge entering Cambodia exceeds300 billion m3, and it is estimated that, with the contributions of downstream tributaries, some500 000 m3 is discharged annually to the sea (Table 5).
An important feature of the Mekong system in Cambodia is the Tonle Sap. During the wetseason, as the water level in the Mekong rises, the flow in the Tonle Sap river draining the lake to theMekong reverse and the lake fills, reducing the discharge downstream of Phnom Penh. BySeptember/October, the level of the lake may have risen by 3 to 4 m and the area extended to 10 500km2. As the level of the Mekong falls, the water starts draining back, enhancing downstream dryseasonal flows, and the lake eventually shrinks to about 2 600 km2 and less than 2 m depth in the dryseason. The annual rise in the Mekong causes extensive flooding downstream of Phnom Penh.

Investment in land and water in Cambodia…170
Groundwater
There has to date been no comprehensive investigation of Cambodia's groundwater resources, butthere have been two preliminary studies, both by the US Geological Survey. The first was areconnaissance of the lowlands to determine, among other things, the availability of groundwater fordry season irrigation. The second was a general description and evaluation of groundwater availabilitybased on test drilling data and well records obtained in the course of a USAID rural water-welldevelopment programme at various times between 1960 and 1993. The programme drilled 1 100wells, 72 percent of which were productive. Depths ranged from 2 to 209 m with an average of 23 m.Information is also available from well drilling programmes done since the 1980s by NGOs andothers, in particular OXFAM and UNICEF. The latter drilled more than 5 000 wells countrywide atdepths of 20 m to 50 m. Recently, JICA completed a detailed groundwater survey in Takeo, Kandal,Svay Rieng, Prey Veng and Kampong Speu provinces.
Except for occasional thin sandy beds and lenses, the alluvium is of low permeability, andwater yields are very low, typically 0.2 litre/sec. Yields from sandy layers are higher, typically of theorder of 1litre/sec. Wells yielding more than 3 litre/sec. are rare. Of almost 7 600 wells for whichUNICEF have records, less than 3 percent have yields more than 10 m3/hr. To date no groundwatersources of sufficient potential for large-scale irrigation have been identified. Any use of groundwaterfor irrigation is thus likely to be restricted to small-scale vegetable and fruit gardens, especially thosecropped in the dry season. In Cambodia, wells are categorized as hand tubewells, shallow tubewells,deep tubewells and treadle pump wells.
TABLE 5Hydrological characteristics of Mekong River tributaries
Tributary Catchment
(km2)
Annual
(million m3)
Discharge
(m3/s)
Annual
Runoff (mm)
Natural
Low Flow(m3/s)
Se KongSe SanSre PokPrek PreahPrek KriengPrek KanpiPrek TePreg chhlongStung ChinitStung SenStung StaungStung ChickrengStung StrengStung SisophonSt Mongol BoreyStung BattambangStung PursatPrek ThnotMekong at Kratie
28 50017 10029 4501 5102 4501 1504 1705 7504 13014 0001 9001 0303 2104 3102 7002 1354 4805 050
646 000
32 20017 30029 800
7601 240580
2 5302 9101 3606 190840450
1 1401 9001 9801 9601 6601 560
441 600
1 368547942242918809243
1962714366063625249
13 974
1 3101 0101 010505505505610505330440440440355440730920370310680
4028
1183521033811123311
1 750
Source: Mekong River Commission, 1994.
ClimateCambodia has a tropical monsoon climate with two seasons: the wet season, from May to October,resulting from the southwest monsoon and a dry season from November to April resulting from the

…Investment in land and water 171
northwest monsoon. Usually the wet season is disrupted by a short dry spell during two weeks in Julyor August.
The annual average rainfall is 1 200-1 500 mm and the annual average air temperature 21-350C. The relative humidity ranges from 65-70 percent in January and February to some 85-90percent in August and September. The annual evaporation is 2 000-2 200 mm, being highest in Marchor April at 200-240 mm/month, and the lowest in September or October at 120-150 mm/month. Themonthly average evapo-transpiration is 90 mm during the wet season to 120 mm for the dry season.
PRESENT STATUS OF WATER AND LAND DEVELOPMENT IN CAMBODIA
Modern irrigation systems were first developed over the period 1930 to 1953 during the Frenchcolonial period. These included the Bavel project in Battambang (30 000 ha supplementary irrigation),a number of bunded storage reservoirs, including Kompong Sne in Prey Veng (100 million m3), andBat Roker and Lom Chang in Takeo (30 million and 6 million m3 respectively), and several colmatage(flood recession) canals.
Following independence, between 1953 and 1960, 11 major land and water developmentschemes were undertaken with the assistance of the United States, including partial rehabilitation ofBavel, damaged during World War II, and of a number of other schemes built during the Frenchcolonial period. New projects included 13 000 ha of irrigation based on the largest of the Angkorreservoirs, Barai Occidental, and more than 50 colmatage canals in Kandal and Kompong Cham,bringing the area served to some 17 000 ha. With completion of these projects, the area under formalirrigation amounted to 74 000 ha. The first stage (5 000 ha) of the multipurpose Prek Thnot project inKompong Speu was started in the late 1960s. The project included construction of a dam to provideultimately year-round irrigation of 70 000 ha, but was left unfinished due to the start of the war.Events during the 1975-1979 period have had a major impact on agricultural systems throughoutCambodia. Recognizing the importance of irrigation, Government organized the construction ofdiversion works, bunded reservoirs and other structures, supplying a rectangular grid of canals acrossa large part of the rainfed area. In many cases, however, the works were designed and built with littleregard to basic hydrological and engineering principles. In many instances, traditional waterdistribution and drainage patterns were disrupted, performance was below expectations and structureswere damaged or destroyed by floods.
An inventory of irrigation systems carried out in 1993-1994 by the Mekong Secretariat listedsome 920 schemes totalling 310 000 ha in the country. In rainfed lowland systems, the distinctionbetween irrigated and rainfed area is not, however, well defined; although not supplied through aformal distribution system, much of the rainfed crop receives water additional to direct precipitation.Irrigation of crops other than rice is largely confined to gardens.
In the wet season, supplementary irrigation may be through direct run-of-river diversion,pumping or by means of release of stored surplus runoff. In the dry season, when in the majority ofrivers there is little flow, irrigation is only possible from storage, or by lifting water, either bypumping or by traditional methods, from residual flows, floodwater or on a small scale, fromgroundwater. Pumping from the dry season flows from canals and streams connected to the Mekongor Bassac river is becoming a popular and productive dry season farming systems in Takeo and PreyVeng provinces.

Investment in land and water in Cambodia…172
Development opportunities
Gravity irrigation. The development options for irrigation offering the greatest scope for extensivedevelopment in Cambodia are exploitation of the abundant wet season river and stream flows toprovide supplementary irrigation for the wet season rice crop, and provision of storage facilities toallow carryover for wet season runoff or flood water for irrigation in the dry season. At the otherextreme, the areas which can be supplied from the smaller streams, may be only a few hectares. In thedry season, flows, where they occur, are sufficient to irrigate only a minimal area. Gravity diversionhas low operating costs and reduced reliance on mechanical equipment which, unless properlymaintained, is prone to breakdown. Where channels are incised, however, diversion structures may beneeded to gain command. There is also a need to safely pass flood flows, which can be very muchlarger than the flows which can be usefully diverted.
TABLE 6Principal rice soils of Cambodia
Group Soil Type Area (ha)
Young Alluvial Soils
Leached Acid Soils on Old Alluvium
Poorly Drained Lowland Soils
Imperfectly Drained Lowland Soils
Acid Sulphate Soils
AlluvialsLacustrine Alluvials
Brown Alluvial
Alluvials
Cultural HydromorphicsGrey Hydromorphics
Brown Hydromorphics
Alluvials
1 706 4001,037,300276,000
included above
1 289 6001 725 200
670 100
278 000
Source: Irrigated Agriculture Department, MOWRAM
Pump stations. Pumped abstraction is appropriate where provision of the work necessary for gravitydiversion would not be practical, or in terms of the quantity diverted, excessively costly. However,experience in Cambodia with fixed pump schemes has been disappointing, for a number of reasons,including: inadequate water source or siltation; over-dimensioning or over-sophistication of the pump;use of fuel inefficient Soviet-designed pump; technically unsound irrigation schemes; and lack ofmaintenance. Pump schemes are vulnerable to poor maintenance. While capital costs of pumpabstraction tend to be less than for gravity diversion, annual operation and maintenance costs aresignificantly higher: some US$80/ha/year for pump schemes as against US$20-25/ha/year for gravityirrigation schemes in Cambodia.
Mobile pumps. Averaging 3 hp, mobile pumps are used during the wet season to supplysupplementary irrigation water from a convenient source to small areas of adjacent land that is out ofcommand. In the dry season, they provide water for irrigation of the recession crop, where theyreplace traditional pedal pumps and scoops. They are used to a lesser extent to provide water fromresidual river flows and water stored in canals for irrigation of a second crop on terrace lands, and forirrigating vegetable and fruit gardens.
Shallow bunded reservoirs. Storage for wet season supplementary and dry season irrigation isprovided by bunded reservoirs storing water at a depth of 1 to 3 metres. There are 2 800 suchreservoirs countrywide. The water stored may derive either from upstream runoff or from

…Investment in land and water 173
impoundment of floodwater from rivers. In the wet season, reservoirs commanding terrace lands, aswell as providing storage, serve also as diversion structures. The area supplied is reported as 200 000ha in the wet season, and 65 000 ha in the dry season. Dry season irrigated areas generally range fromvery small to several thousand hectares, with the large areas being flood recession areas.
Colmatage canals. 'Colmatage' or warping canals are cut to bring silt-laden floodwater to low-lyingland behind the levees of the Mekong and Bassac rivers. Set at a relatively high level, these canals areclosed off from the river by a temporary bund until mid-August to allow harvest of the previousseason's crop. The canals are then filled on the rising flood and then, when the flood falls, water isretained at the level of the canal inverted, allowing recession cropping. In some cases, a head gate isprovided, allowing water retained at a higher level. On the lower land, recession crops are grown. Thecanals also serve an important fishery function permitting passage of brood-stock on to the floodplain.
Polders. The flood recession areas offer some of the most fertile soils. Polders to exclude floods couldpermit cultivation in the wet season. High external water levels, however, while facilitatingsupplementary irrigation, would necessitate pump drainage. In addition, excluding flooded land in thepolder would deny it the silt upon which its fertility depends. It should be noted that most farmers alsoown terrace land on which they are already fully employed during the wet season.
Strategies for development of water resources
The use of water resources in general: to prevent conflicts among water uses for different purposesand in different areas, and create an environment conducive to the satisfaction of present andforeseeable demands consistent with environment protection. These include: planning water resourcesuse and development in priority areas; licensing water uses; controlling groundwater abstraction anduse; and cooperation with other parties to the 1995 Mekong Agreement to implement its provisions.
Development process
Irrigation and drainage: to expand irrigated area from 16.62 percent to 20 percent by the year 2003given the high irrigation potential (1 667 300 ha or even more in the future), to enhance food security,provide job opportunities and increase the incomes of the rural population; and through irrigationimprovement, to mitigate the effects of floods and other emergencies. Specifically called for are:rehabilitation of existing irrigation schemes; development of cost-effective, short-gestation,appropriate and private irrigation technologies; development of small-scale gravity irrigation systems;and the improvement and expansion of areas covered by medium and large irrigation systems as theinstitutional capacity for planning, construction and O&M of such systems is enhanced.
Water supply, sewerage and sanitation: to provide sufficient and safe water supplies to urban andrural areas, to protect the health of the urban and rural population, including: improvement of accessto urban water supplies; expanding water service in rural areas; setting drinking water qualitystandards; drinking water quality monitoring; improvement of urban drainage and sewerage;expanding sanitation services, especially in rural areas and organizing health education programmes.
Hydropower development: to exploit the country's potential to improve the standards of lining of thepopulation and reduce the present cost of energy, consistent which environment protectionrequirement, including: review of data and information on hydropower development; investigation ofCambodia's potential for hydropower development and setting priorities; assess project feasibility formultiple uses; planning hydropower development within the framework of overall water resourcesplans; assess the impact of each hydropower development project on the watershed concerned;financial sustainability of hydraulic infrastructure; introduction water use fee concept to cover thecosts of service delivery and O&M; enhancing community participation in the design, construction,

Investment in land and water in Cambodia…174
operation and management of hydraulic infrastructure; introducing user participation in managingrehabilitated and newly constructed irrigation schemes; and promotion of private sector involvementin the construction of hydraulic infrastructure.
Water resource protection: to improve water quality for present and future demands and ensure thatwater bodies have the capacity to sustain aquatic and fish life; to protect human and animal health toprevent water pollution from point sources; prevent water pollution from non point sources; andprevent groundwater pollution.
Control and abatement/reduction of flood effects and other hazards: to prevent damage resulting fromfloods, drought, watershed degradation, erosion and sedimentation; and to protect aquatic and fishresources, including: control of floods and abate/reduce their effects; improve weather forecasting toensure timely warning regarding natural occurrences such as typhoons, floods and drought;preventing watershed degradation, erosion and sedimentation; protection of fish stocks; andcooperation and exchanging information with other Mekong Basin countries to prevent the harmfuleffects of floods, watershed degradation, erosion, sedimentation and drought that might originate inactivities carried out in these countries
Policy, legal and institutional strategies: to create an 'enabling environment' for integrated waterresources management and development, by means of: formulation and adoption of a coherent policyfor the water sector as a whole; formulation of a comprehensive legal framework for water sectorinstitutional coordination; strengthening the MOWRAM data base and information system to facilitatethe integrated management of water quantity and quality and determining balance betweenavailability and demand; strengthening the capacity of ministry staff at central and decentralizedlevels; disseminating information on water resources in public meetings, by radio broadcasts andpublications such as leaflets and posters.
Planning framework
Development activities in Cambodia are planned within the framework of Five-Year Socio-EconomicDevelopment Plans (SEDP), which are prepared by the Ministry of Planning on the basis of sectoralcontributions from line ministries. SEDPs set out RGC policy and strategy and detail sectoralinvestment levels. The First SEDP ran from 1996 to 2000 and the Second SEDP, which is in finaldraft form, will run from 2001 to 2005.
An annual meeting takes places each year between RGC and development partners at whichprogress in the preceding year is reviewed, plans for the future discussed and funding commitmentsreaffirmed. The Council for the Development of Cambodia (CDC), under the Prime Minister's Office,organizes this meeting. Before each annual meeting, CDC prepares the government's statement underthe title Socio-Economic Development Requirements and Proposals (SEDRP), including programmeand project details and their funding requirements for the next three years.
Actual programme and project interventions are listed in a three-year rolling PublicInvestigation Programme (PIP). Each June/July, projects for inclusion in the PIP are discussed in theMinistry of Planning. Executive agencies prepare their annual work plans and corresponding budgetrequests on the basis of programme and project included in the SEDP and PIP, physical progress inprevious year, new projects identified and the availability of funds is determined.
The ministry divides Cambodia into three planning zones, an Upper Area, and CentralFloodplain and Coastal areas in part to facilitate an equitable distribution of development funds. Itissued a Short, Medium and Long Term Strategic Plan in April 1999 including 63 projects (of whicheight were ongoing), at a total cost of US$486 million. MOWRAM prepared a five-year rehabilitationand development plan (RDP) on water resources and meteorology for the Second Five-Year Plan

…Investment in land and water 175
(2001-2005). The plan is an ambitious programme with a comprehensive list of 874 projects costingRiels 2 062 billion (US$528 million) over five years. Annual budget for investing on the developmentof the water resources is illustrated in Table 7.
The PIP 2001-2003 lists 32 ongoing, committed and high priority projects under MOWRAMwith a total value of $113 million, together with two 2000 flood-related rehabilitation project fundedby ADB and World Bank valued at some $20 million.
TABLE 7MOWRAM Short and Medium Term Investment Plan
Projects 1999 2000 2001 2002 2003 2004 2005 2006 2007 2008 2009 2010
Completed /Ongoing
Pipeline
Medium Term
3.90 4.10 17.20
0.50
16.10
7.30
17.30
16.20
6.80
28.60
9.70
6.70
35.10
29.30
5.40
23.00
25.40
0.40
21.00
31.10
21.00
25.00
21.00
27.00
9.00
15.00
TOTAL 3.90 4.10 17.70 23.40 33.50 45.10 71.10 53.80 52.50 26.00 48.00 24.00
Expenditureby Plan Period
$7.5 million (1996-2000) $190.8 million (2001-2005) $200.3 (2006-2010)
Source: MOWRAM, 2001
NATIONAL INSTITUTIONS IN THE WATER SECTOR
In Cambodia, irrigation is the responsibility of the Ministry of Water Resources and Meteorology(MOWRAM), established in 1998 and which previously was part of the Ministry of Agriculture,Forestry and Fisheries. Its main functions are: (i) formulation of water policies; (ii) study andresearch; (iii) technical investigation for multipurpose dams, irrigation, drainage, water supply andriver works; and (iv) planning, design and rehabilitation of existing projects and their operation andmaintenance.
MOWRAM is headed by a minister assisted by secretaries and under secretaries of state. Thereare two divisions, administration and technical, headed by a director general and a Provincial WaterResources Department. The Technical Division has six subdivisions or departments: water resourcesmanagement, hydrology and river works, irrigated agriculture, engineering and design, water supplyand meteorology (Figure 2). The poor state of the national economy means the ministry's budget isseverely limited. As a consequence, there is a lack of funding for technical surveys and design,construction of irrigation infrastructure and operation and maintenance of existing irrigation schemes.
For successful implementation of the irrigation development activities and for the sustainableoperation and management of irrigation systems, the Government has entrusted the Ministry of WaterResources and Meteorology to review and evaluate all irrigation systems having the potential toeffectively serve the development of national economy, standardize the statutes of the Farmer WaterUsers' Community (FWUC) to help facilitate and organize the farmers, to carry out feasibility studiesand construct irrigation systems including diversions, intakes, outlets and canal systems to supplyirrigation water to farmers' fields in an efficient and sustainable manner and to cooperate with theconcerned ministries to create the FWUCs.
FIGURE 2

Investment in land and water in Cambodia…176
Organization structure, Ministry of Water Resources and Meteorology (MOWRAM)
DONOR ASSISTANCE IN THE WATER DEVELOPMENT SECTOR
Donor assistance in development of the irrigation sector in Cambodia has been substantial. Manybilateral and multilateral institutions are involved in irrigation. The Mekong Secretariat (now theMekong River Commission), prepared an inventory of potential hydropower and irrigation projectsand was also responsible for the emergency rehabilitation of key irrigation structures damaged byfloods in 1991 and initiated a longer-term countrywide irrigation rehabilitation study. The AsianDevelopment Bank provided funds for Special Rehabilitation Assistance Projects that includedirrigation. It plans to finance the Stung Chinit Water Resources Development Project, a large-scaleirrigation scheme in Kampong Thom. To generate employment, ILO has instituted a labour-intensiveinfrastructure rehabilitation programme. In the irrigation sector, rehabilitation of canals and minorstructures is being undertaken on the Bavel (Battambang) and Barai (Siem Reap) schemes. Funds arebeing provided by UNHCR, UNDP/CARERE, WFP and the Netherlands.
Japan's International Cooperation Agency (JICA) is providing US$10 million for floodplainarea development and colmatage rehabilitation. The World Bank is extending a technical assistancegrant of US$2 million to increase the capacity of MOWRAM staff. The Food and AgricultureOrganization (FAO) funded a pilot project on water control technologies. The European Union as partof the Programme de Rehabilitation au Secteur Agricole du Cambodge (PRASAC) is developing localcapacities and building farmers association in the provinces close to Phnom Penh. The GTZ has beenproviding support for investigation and study of small-and medium-scale irrigation schemes inKampot and Kampong Thom.
The World Bank-assisted Agricultural Productivity Improvement Project (APIP) hydrologycomponent focuses on capacity-building within MOWRAM nationally and at provincial level inKampong Thom and Kratie provinces. APIP will provide training, technical assistance, vehiclesequipment and staff allowances to develop and support the PSWRAM in Kampong Thom.

…Investment in land and water 177
Non-governmental organizations
NGOs have been providing assistance to the agricultural sector since the early 1980s. Currently, 20are involved with irrigation, providing materials and equipment and/or technical assistance,challenged directly to central, provincial or district authorities. Work has focused on rehabilitation ofexisting irrigation systems including repair of reservoir bunds and outlets works, provision and repairof pumps, and rehabilitation of canal networks and minor control structures. Selection of schemes hasnot been in conformity with a national plan. Schemes have been treated as isolated entries, oftenneglecting complex hydrological features and performance of the facilities created has often beenunsatisfactory. NGOs have been involved since 1991 in organizing and promoting farmers'organizations, in particular water users groups, with a view to encouraging farmers' participation andinvolvement in planning and operation and maintenance of irrigation systems. All NGOs working inCambodia are listed in Table 8.
The water sector potentially can contribute to many of the social, and the government hasrecognized, in the April 2000 Social-economic developments and proposals, "a need to develop awell-defined strategy". In irrigated agriculture, elements of the current strategy include rehabilitatingexisting schemes, promoting the ability of communities to maintains and operate their own facilities,and investing (in the longer term) in multi-purpose reservoirs. The water sector will contribute inother ways to social goals, such as the provision of supplies of water for electricity and irrigation, buttime will be required to develop appropriate goals.
TABLE 8Organizations active in Cambodia's irrigation sector (April 2000)
Organization Location Since Status ActivitiesADRA Siem Reap 1970s On-going Agricultural extension in medium-scale irrigation
system (Barai system)CWS Kandal, Kampong
Thom1979 Phase out Investigation of small-scale irrigation and
drainage, community developmentMWR Various 1979 On-going Ministry responsible for irrigation and water
resource development in CambodiaACR Takeo 1980 Finished Pump irrigation systems, organization of water
user groups ag. extension, support to PLACCAA Takeo,
Banteay Meanchey19801992
On-goingCompleted
Small-scale irrigation and drainage, communityorganization of water user groups
ITC Phnom Penh 1981 On-going Technical University producing rural engineersPLAC Phnom Penh 1981 On-going Agricultural College teaching water resource
technicians, meteorologyAFSC Kampong Chhnang
Pursat19851989
Phase-out Small-to medium-scale irrigation and drainagestructures
SAWACambodia
Pursat, Siem Reap,Phnom Penh
1985 On-going Irrigation and drainage consultants, small-andmedium-scale systems, criteria for Social Fund
MCC Prey Veng 1986 On-going Rehabilitation of network in medium-scaleirrigation system (Kampong Sne), communityorganization of water user groups
CIDSE Svay RiengKampot
19881992
On-going Small-to medium-scale irrigation and drainage,integrated rural development, agriculturalextension
CNMC Phnom Penh 1991 On-going Policy and coordination, informationdevelopment, international agreements
FAO Kampot,Battambang, SiemReap, Takeo,Kampong Thom,Kampong Cham
1991 Completed Special Programme for Food Security (Mlech,Bavel, Barai, Tuk Char, Thot Te Systems andothers)
JICA Floodplains, Kandal,Takeo, Phnom Penh
1991 On-going Floodplain irrigation development projects(colmatage), study of Kandal Stung system,technical assistance to MWR, hydrologic

Investment in land and water in Cambodia…178
gauging, capacity building at MWR (planned)LWS Phnom Penh 1991 Completed Rehabilitation of meteorological network,
technical assistance to MWR, Civil AviationANS Battambang, Stung
Chinit, KampongSaom, KampongThom
1992 On-going Small-scale irrigation and drainage structures,integrate rural development, communityorganization (Prey Nop and Stung ChinitProjects)
CARERE Pursat, Battambang,Banteay Meanchey,Ratanakiri, SiemRiep
1992 On-going Small-to medium-scale irrigation and drainage,ag. Extension, rural development, institutionbuilding, community development
CCDP/HOPE Pursat 1992 On-going Small-scale irrigation and drainage, communityorganization, hydrologic data collection
COR Prey Veng 1992 On-going Promotion of treadle pumpsConcernWorldwide
Banteay Meanchey,Pursat, Siem Reap
1992 Phase Out Small-scale irrigation and drainage
ILO Siem Reap,Battambang
1992 Completed Labour-based medium-scale irrigation anddrainage (Barai & Bovel systems), communityorganization
New Humanity Kampong Speu 1992 On-going Small-and medium-scale irrigation and drainage,ag. extension, community development
VSA Takeo 1992 Completed Integrated Rural DevelopmentWFP Numerous 1992 On-going Food-for-Work repairs to small-and medium-
scale irrigation and drainage systemsBFD Battambang 1993 On-going Small-scale irrigation and drainage structures,
community development, agronomy supportISF Kampong Charm 1993 Completed Small-scale irrigation and drainage development,
community organization of water user groupsMRD Kampot, Kampong
Speu1993 On-going Promotion of groundwater irrigation, small-scale
irrigation and drainage developmentADB Takeo, Prey Veng,
Kampong Cham,Kampong Thom,Phnom Penh
1994 On-going Special rehabilitation assistance loan formedium-scale irrigation development (Tuk Char,Kampong Sne, Thnot Te, O thom-completed),Stung Chinit Water Resources DevelopmentProject (on-going), capacity building in MWR(from 8-2000), Planning Community IrrigationRehabilitation Project
GTZ Kampot, KampongThom
1994 On-going Investigation and study of small-to medium-scaleirrigation systems (Stung Pe), communitydevelopment and agricultural extension support
IDE Prey Veng, SvayRieng, Takeo,Kandal, Kampot
1994 On-going Promotion of treadle pump and appropriatetechnology for irrigation development
CIAP-IRRI Takeo, Kandal,many other pilotlocations
1995 On-going Groundwater irrigation pilot projects, soil andwater management, agronomy research
CAAEP Takeo, Kandal, SiemReap, KampongThom, KampongCham, Battambang,Pursat, BantheayMeanchey
1995 On-going Agricultural extension
EC/PRASAC Kampong Cham,Kampong chhnang,Kampong Speu,Takeo, Prey Veng,Svay Rieng
1995 On-going Medium-scale irrigation and drainagedevelopment, community organization,agricultural extension, credit
JapaneseEmbassy
Various 1995 On-going Budgetary support for MWR rehabilitation ofsmall structures in several provices
AFD Kampong Saom,Siem Riep,Kampong Thom
1996 On-going Medium-scale irrigation development (Prey Nop,Makak and Stung Chinit Systems)
ECTA Kampong Cham,Kampong chhnang,Kampong Speu,Takeo, Prey Veng,Svay Rieng
1996 Completed Technical assistance for food-for-work irrigationand drainage projects in the 6 PRASACprovinces
Social Fund Phnom Penh 1996 On-going Funding small-and medium-scale irrigation-andmedium-scale irrigation and drainage systems
World Bank Phnom Penh, 1996 On-going Agriculture Productivity Improvement Project for

…Investment in land and water 179
Kampong Thom,Kratie
small-and medium-scale irrigation and drainagedevelopment, training data. Northeast RuralDevelopment Project for communitydevelopment (MRD)
Law on water resources management
Cambodia's Law on Water Resources Management details a number of key policies for the watersector, such as:
• All natural resources including water and land are owned by the State and are managed by theGovernment in accordance with the provisions of this Law and the Regulations made thereunder(Article 3);
• Water resources plans shall be formulated by basin, sub-basin or aquifer, and shall be coordinatedby a national plan. Water resources plans shall be aimed at balancing water availability withpresent and foreseeable demands, including measures for the protection of water against pollution(Article 7);
• Everyone has the right to use water resources freely for drinking, washing, bathing and otherdomestic purpose, the watering of domestic animals and buffaloes, fishing and the irrigation ofgardens and orchards in an amount not exceeding that necessary to satisfy the individual andfamily need of the user (Article 8);
• The use of water is subjected to the payment of water use fees... (Article 17);
• The discharge, disposal or deposit of polluting substances...shall be subject to a wastewaterdischarge license... (Article 21); and
• Without prejudice to the principle of Cambodian sovereignty, Cambodia has the right to use,develop and manage international river basins on her territory within her reasonable and equitableshare, consistent with national environment and development policies and with the obligationsstemming from the international agreement to which Cambodia is party (Article 40).
Article 8 provides for "free water uses" for basic household needs, while other articlesprovide for licensing all other uses. After the fall of the Khmer Rouge regime in 1979, localauthorities began allocating land and houses on a wide scale, with a maximum holding of 5 ha. Privateownership of land-use rights (not land itself) was legally reintroduced in Cambodia in 1989, when itwas declared that all Cambodians could own, use and inherit land-use rights granted by thegovernment. The State of Cambodia Land Law (1992) allows citizens to acquire land-use ownershiprights over land they have peacefully occupied for five years. However, the process of land titling hasbeen cumbersome, so that less than 15 percent of applicants have received certificates of ownership(implying, strictly, that the remainder are illegal occupants, which provides them with no protection inthe face of widespread land-grabbing by more powerful people). The poorest half of the populationshares less than one quarter of the cultivable land, one family in six is landless, and there is extensiveland speculation and aggregation by the wealth.
Disparities in access to agricultural land appear to be growing, due to population growth andfragmentation, forced sales to pay debt, usurpation of land by the more powerful and deficiencies inland law enforcement. It is estimated that 15 percent of total land area changed hands from 1993 to1998, with the poor as net sellers and the wealthier as net buyers. Land disputes contribute the secondhighest number of legal cases in Cambodia. There have been further land reforms since 1998, butdisputes are still occurring as a result of insecure tenure and illegal transactions and usurpation.

Investment in land and water in Cambodia…180
Further reform and improvements in administration are anticipated in the government's Socio-Economic Development Requirements and Proposals (Ref. 30) and the Immovable Properly Bill,which would reform the Land Law, is agreed by the National Parliament and Senate, and is approvedand signed by the King of Cambodia.
The formulation of the manner in which the farmer water user community participates inirrigation management is very important. The Farmer Water Users Community (FWUC) is amechanism established by farmers, and has the duty to manage water use in any irrigation system byobtaining due recognition from the Royal Government of Cambodia. The FWUC is leaded by theFarmer Water Users Community Committee under the Board of FWUC as the facilitators (Figure3).
FIGURE 3Cambodia Farmer Water User Committee (FWUC) structure
Irrigation development, rehabilitation or extension programmes shall be implemented only onthe basis of the feasibility and demand of the majority of the farmers. During the planning andimplementation of irrigation projects full participation of organized users shall take place at all levelsfrom the very beginning. Formation of FWUC shall therefore be the primary task leading towards theimplementation of an irrigation project. Upon completion of the project, the responsibility ofoperation and maintenance and the emergency repair shall rest with FWUC gradually:
• in year one: government shares 80 percent and farmer members 20 percent;• in year two: government shares 60 percent and farmer members 40 percent;• in year three: government shares 40 percent and the farmer members 60 percent;• in year four: government shares 20 percent and farmer members 80 percent; and
FWUCCommittee
Main Canal
FWUCBoard
Secondary Canal
Tertiary Canal
Watercourse
SecondaryCommittee
TertiaryCommittee
WatercourseCommittee

…Investment in land and water 181
• in year five: the government shares 0percent and the farmer members 100 percent.
Irrigation service fee (ISF)
The actual irrigation service fee (ISF) is decided by FWUC following this formula:
Y = hectareoneinproductionincreasedtheofAreaServiceIrrigation
XXXXX%2054321 +
+++ +
Where, X is the O&M costs X1 = expenditure on maintenance and repair
X2 = expenditure on fuel (for pumping)X3 = expenditure as the contribution to the Community BoardX4 = expenditure on administrationX5 = expenditure on contingency Y = ISF per hectare
One-fifth of the increased production remains in an FWUC bank account as a fund for emergencyrepairs and maintenance expenditures or for irrigation system and farm water managementimprovements. For simplicity, in the current situation the increased production of wet season irrigatedrice compared to rainfed rice is estimated at about 0.7t/ha. The FWUC will therefore collect annually140kg/ha of rice as its share of 20 percent increase in production. This should be continued for thefirst five years following which, depending on the financial situation, the FWUC may reduce thepercentage (but to not less than 5 percent of increased production). The above expenditures apply onlyfor the irrigation schemes constructed by the government fund and/or the support from internationaland national agencies.
OBJECTIVES OF THE PARTICIPATORY WATER MANAGEMENT PROGRAMME
The government objective in creating the participatory irrigation management programme is: (1) toreceive efficient, sustainable, reliable and environmentally friendly irrigation systems, (2) to promoteirrigated agriculture ensuring food security and national economic growth, (3) to gradually increasethe role and responsibility of organized farmer users in every stage of programme implementationthereby decreasing government responsibility for development of the irrigation sector, includingrepairs, operation and maintenance, (4) to enhance the capability of the farmers and the Farmer WaterUser Community in managing and safeguarding the irrigation systems, (5) to promote awareness ofthe farmers in taking over management responsibility of government managed irrigation schemes andexpedite the transfer process to the FWUCs, (6) to encourage international financing agencies toincrease funding in developing and managing irrigation systems with active involvement of the userfarmers, and (7) to bring about uniformity in the selection and implementation process of irrigationdevelopment and management among the government institutions and supporting national andinternational agencies involved in irrigation extension.
ONGOING PROGRAMMES IN WATER RESOURCES DEVELOPMENT
MOWRAM is involved in the following types of programmes and projects: institution building;policy/strategy/legislation; single/multi-resources surveys; area-specific single/multi-purpose planningstudies; feasibility studies; detailed design and preparation of tender documents; construction; andoperation and maintenance

Investment in land and water in Cambodia…182
A new national programme as a demonstration pilot on participatory irrigation management –including the design of farmer water user communities (FWUC), initial operation and maintenancecost provision to the new FWUCs. The first phase of this programme is five years. The nationalprogramme will cover 11 sites at existing working irrigation systems in 11 provinces. MOWRAM isthe executing agency of this programme under ADB financing. Major programme objectives include:establishing FWUCs in existing working irrigation systems in provinces around the Great Lake andalong the Mekong and Bassac rivers; operating and maintaining existing irrigation systems forincreased agricultural productivity, poverty reduction, and improving food and income security;establishing FWUC support teams; and strengthening MOWRAM capacity building in participatoryirrigation management (PIM), irrigation management transfer (IMT), national FWUC policy,monitoring and evaluating the performance of irrigation systems and FWUCs; and implementing,improving and developing Circular No. 1 of the implementation policy for sustainable irrigationsystems in provincial project FWUCs.
The Rehabilitation Colmatage Canals Project funded by the Japanese Government in KieanSvay district. The objectives of the project are to establish a farmer water user community of thebeneficiary farmers for sustainable irrigation management of the irrigation systems, increaseagricultural production and improve life standard of farmers through rehabilitation of the colmatageirrigation facilities.
The medium scale irrigation system development project funded by France. The project islocated in Prey Nup, Sihanoukville. Its objective is to protect flood protection dykes (polders) fromsea water to increase agricultural production by forming farmer water user communities. The projectalso aims to implement existing national policy on sustainable management irrigation systems,decentralization of services delivery, and empowering the planning and developing process in theoperation and maintenance the irrigation systems.
The PRASAC project is financed by the European Union (EU) to cover 15 medium scaleirrigation schemes in six provinces. The project purpose is to improve the food and income securityvia rehabilitated the existing medium scale irrigation schemes and organize the farmer water usercommunity to sustain the operation and maintenance the rehabilitated irrigation system. Theformation of farmer water user communities process follows existing national policies.
The results of these programmes and projects have illustrated changes and improvement thequality of the irrigation water management from non-discipline, non-effectiveness, and non-efficiencyto discipline, effectiveness, and efficiency. The farmers understand and are interested in participatingthemselves as members of FWUCs. Farmers agreed to pay a substantial water fee to afford the O&Mcosts. Yields rose from 1.8 t/ha to 2.5 t/ha for wet season crops and from 2 t/ha to 3.5 t/ha for dryseason crops. Crops and fruits were of improved quality. MOWRAM established 25 FWUCs with37 739 families for an irrigated area of 40 780 ha. These FWUCs were started using existing nationalpolicies, scenarios and standards. Other data regarding the new programmes are still being researchedand assessed.
RECOMMENDATIONS AND CONCLUSIONS
Cambodia's investment in water resources and land in response to the special programme for foodsecurity (SPFS) is limited. There is a lesser impact of SPFS on agricultural productivity improvementthan might be expected. FAO is not the donor, but it can share existing funding for SPFS with theCambodian government for substantial benefit by using the participatory approach to inform, mobilizeand organize farmer understanding of the importance of FWUCs and the responsibility and ownershipfor further O&M after construction and rehabilitation of the irrigation systems is complete. FWUCs

…Investment in land and water 183
must be established before irrigation rehabilitation and construction. All stages of design or redesignand reshape for construction and rehabilitation of irrigation systems must have FWUC involvement.Let all members of FWUCs know and understand how important the contribution of affordable waterfees for O&M the irrigation systems.
The FWUCs must receive training on all aspects of water management including crop waterrequirement, frequency of irrigation, water distribution, some idea of the importance of participatoryirrigation management, irrigation management transfer, and national policy for FWUCs from themulti-disciplinary support team for FWUCs assisted by the external FWUC experts.
Irrigation system development (O&M) should respond to FRUW requests. FWUCs should beinvolved from the beginning in surveys, planning, implementation of O&M, supervision and alsoduring test checking of the facilities constructed. The proposed irrigation alignments and layoutshould be agreed with the FWUCs: their opinions should receive consideration.
Assessments of water charges must reflect both the value of water – especially in the dryseason – and the cost of supplying it to the field. Farmers who can afford to pay the O&M cost (thewater fee calculation) must follow the guidelines of Mowram Circular No.1. The basic principle ofany pricing procedure is to ensure that water charges cover all O&M costs. All this must be includedin the next investment implementation in water resources and land for SPFS in Cambodia.

Investment in land and water in Cambodia…184

…Investment in land and water 185

…Investment in land and water 187
Report on China's developmentand investment in land and water
INTRODUCTION
China is known as a natural resources deficient country. Quantitatively speaking, water resource percapita is approximately 2 200 m3, only 30 percent of the world average. Arable land per capita is 0.1ha, only 40 percent of the world average. Qualitatively speaking, China's water and land resources arefar from being easily developed and utilized due to the fact of slope land, soil layers, erosion andother problems. Geographically, south China has abundant water but is deficient in land while northChina is abundant in land but deficient in water. The combination of a large population andinsufficient natural resources severely impedes the sustainability of China’s agriculture and socialeconomic development.
In order to increase capital construction in agriculture, enhance the ability to prevent andcontrol disasters, strengthen the foundation of agriculture, facilitate the steady improvement ofcomprehensive agricultural production capacity and ensure the sustainability of agriculture, theChinese government has made significant efforts in water and land development and conservation,which can be reflected in the following aspects:
• comprehensive agricultural development (CAD);• farmland irrigation and water conservancy construction;• construction of commodity bases for grain, cotton, oil products and sugar products;• land resources management;• fertilizer and other agricultural inputs;• ecological construction in agriculture and improvement of the agro-eco system.
Thanks to these unremitting efforts, notable results have been achieved in China’s water andland development. This is demonstrated by the fact that China feeds 22 percent of the world’spopulation with only 10 percent of the world’s arable land. And with per capita availability of grainhaving risen to some 400 kg, 1.3 billion Chinese people now live comfortable lives.
As water and land management in China involves different administrative departments, andthe manner of investment in water and land by the state, collective units and farmers varies, it isdifficult to get accurate statistics on total investment in water and land nationwide. Therefore, we tryto provide information and understanding concerning water and land development and conservationby introducing several major activities and programmes.
_________________________________________________________________________________
Zhou Yinghua, Director, Development Division…Department of Development and Planning…
Ministry of Agriculture, China…_________________________________________________________________________________
Achievement in China’s water and land development

Investment in land and water in China…188
All-round and rapid development in agricultural production
Since China's founding, agricultural production recovered rapidly and developed continuously.Production capacity has risen greatly. In 1978, total output of grain and cotton reached 304.47 milliontonnes and 2.167 million tonnes respectively, increasing by 1.69 and 3.88 times over 1949. During thesame period, livestock inventory was 93.89 million head, an increase of 56.4 percent. Total meatoutput including pork, beef and mutton was 8.563 million tonnes, 2.89 times more than 1949.Fisheries output was 4.653 million tonnes, an increase of 9.4 times against 1949.
TABLE 1Production of major commodities 1949-2000
1949 1952 1965 1978 1980 1995 2000
Grain
(10 000 tonnes)
11 318 16 390 19 455 30 477 32 056 46 662 46 218
Cotton
(10 000 tonnes)
44.4 130.4 209.8 216.7 270.7 476.5 441.7
Livestock
(10 000 heads)
1 149 7 646 8 421 9 389 9 525 15 862 15 152
Meat
(10 000 tonnes)
220 338.5 551 856.3 1 205.4 4 265.3 6 124.6
Fisheries
(10 000 tonnes)
44.8 166.5 298.4 466 450 2517 4 278
The opening-up and reform policy undertaken since 1978 greatly released productivity.Farming, livestock and fisheries production increased tremendously. Compared with perennial farmproduce shortages in the past, farm production today is balanced and even produces a surplus in someyears. In 2000, China's total grain output amounted to 462 million tonnes, an increase of 51.6 percentagainst 1978 and 3.08 times that of 1949. Total cotton output reached 4.417 million tonnes, anincrease of 1.03 times relative to 1978 and 9.94 times that of 1949. Total output of oil productsreached 29.55 million tonnes, an increase of 5.67 times that of 1978 and 10.52 times that of 1949. In2000, total production of pork, beef and mutton reached 61.25 million tonnes, an increase of 6.15times against 1978 and 26.84 times against 1949. Milk output reached 9.191 million tonnes, anincrease of 8.5 times against 1978. Egg output was 22.43 million tonnes, 3.2 times more than 1985. In2000, China's total fisheries output was 4 278 million tonnes, an increase of 8.18 times against 1978and 94.19 times that of 1949.
Farmers’ income and living standards improved
While agricultural production and rural economy achieved continuous development, farmers’ incomelevel has also been upgraded dramatically. In 1978, farmers' per capita net income was only 133.6yuan, but rose to 2 253.4 yuan by 2000.
Rural reform brought about rapid all-round growth of farm production and greatly improvedthe food supply situation. Urban and rural residents have solved subsistence problems and enjoy well-off lives. Dietary variety and quality are notably adjusted and improved. Comparing 1998 with 1978,the grain directly consumed by farmers tended to be stable and other food consumption increased: fats

…Investment in land and water 189
and oil product consumption more than doubled, meat consumption nearly doubled, egg consumptionincreased over four times and fishery products more than three times.
While the quantity and quality of food consumption is improving, other living expenditureswitnessed even faster growth. In 2000, farmers’ per capita living areas was 24.8 m2, a rise of 16.7 m2
compared to 1978. In particular, half timber and concrete housing construction increased significantly.Today, for every 100 rural families, there are 101.71 television sets, an increase of 7.6 timescompared to 1985, 21.58 radio/tape recorder sets and 28.58 washing machines. Appliances such asrefrigerators, video recorders, cameras and air conditioners have become necessities in ordinaryfamilies. In 2000, the Engel’s coefficient of rural residents was 50.1, down by 14.6 percent comparedto 1978.
FIGURE 2Increase of farmers' per capita income 1978 to 1998

Investment in land and water in China…190
TABLE 2Change of farmers’ per capita net income, 1978-2000
Absolute value (yuan) Index (1978 = 100)
1978 133.6 100.00
1980 191.3 138.99
1985 397.6 268.94
1990 686.3 311.20
1995 1577.7 386.67
1997 2090.1 437.44
1998 2162.0 456.78
1999 2210.3 473.54
2000 2253.4 483.48
Agricultural infrastructure conserves water
Agricultural infrastructure focused on farmland water conservancy strengthened agriculture'scapability to fight against natural disasters. China has suffered from frequent floods. In 1949, therewere only six large-scale reservoirs, 17 medium-scale reservoirs and a few small reservoirs and dams.For 50 years, China's government and people have painstakingly built water conserving engineeringworks for flood control, irrigation, drainage and water supply.
While focusing on control on major rivers and lakes, the state also enhanced control ofmedium and small rivers and construction, maintenance and management of reservoirs to buildcapacity to counter both floods and drought. By the end of 1997, embankment projects countrywidetotalled 251 000 km. Some 84 800 reservoirs have been built with a total capacity of 45.83 million m3,of which 3 031 reservoirs are large- and medium-scale – an increase of 3 008 or 130 times that of1949.
TABLE 3Change of farmer per capita net income, expenditure and living areas, 1978-2000
1978 1990 1995 2000
Net income (yuan) 133.6 686.3 1577.7 2253.4
Living expense (yuan) 116.0 584.6 1310.4 1670.1
Food 79.0 343.8 768.2 866.7
Weight (%) 68.1 58.8 58.6 50.1
Living Area (m2) 8.1 17.8 21.0 24.8
In 2000, effective irrigated areas totalled 53.9 million ha, an increase of 2.4 times the 15.93million ha irrigated in the 1950s. Of this, 38 million ha were ensured of harvest irrespective ofdrought or excessive rain. Of areas subject to waterlogging, 80 percent (over 20 million ha) have beenharnessed. Of total saline-alkali farmland areas, 70 percent (over 5 million ha) have been transformed.

…Investment in land and water 191
In the 1990s, water-saving irrigation was widely applied, together with the extension ofdripping irrigation, spraying irrigation, leakage prevention in canals and water transmission pipelines,so that the efficiency of irrigation is largely improved. To date 13 million ha of farmland has beenserved with water-saving irrigation with effective irrigation efficiency up to 34 percent.
TABLE 4Changes in reservoirs and irrigated areas, 1949-2000
1949 1978 1985 1990 1995 1997 2000
Reservoirs (number) - 84 600 83 219 83 387 84 775 84 837 -
Large/medium reservoirs(number)
23 2 516 2 741 2 865 2 980 3 031 -
Irrigated Areas (10 000 ha) 1 599 4 497 4 404 4 740 4 928 5 124 5 385
Water and soil conservation efforts have produced striking results. Through sand control andland transformation projects, some provinces like Shanxi, Ningxia and Xinjiang have become oaseswith beautiful landscapes in the place of formerly harsh agro-ecological environments. Forty percentof areas affected by erosion – over 70 million ha – have been reclaimed.
Basic agricultural production improvements have contributed greatly to better harvests. Theseachievements are closely linked with investment and development in water and land.

Investment in land and water in China…192
REVIEW OF CHINA'S WATER AND LAND DEVELOPMENT AT THE NATIONAL LEVEL
Comprehensive agricultural development (CAD): China's fundamental policy
Basic goal and its policy of comprehensive agricultural development
Comprehensive Agricultural Development (CAD) was initiated in 1989. It is a policy and strategicmeasures to conduct macro agricultural adjustment, improve the stamina of and promote sustainableagricultural development. Its goal is to improve overall production capability of main farm producewith grain as the core, to increase the effective supply of farm produce and strengthen the vigour ofagricultural development through comprehensive development and rational use of water and landresources. CAD is targeting development of water and land resources as well as comprehensivedevelopment and utilization of all other kinds of advantage resources in the development areas.
There are three major methods of water and land resources development: (i) comprehensivemanagement is used to transform mid- and low-yielding cropland to eradicate disadvantage factors forthe yield, to improve production condition, increase material and technical input, rationally adjuststructures of industry and products, improve labour productivity and yield, and to follow a track oftangible development; (ii) pipeline wasteland resources are reclaimed step by step to make up thedecrease of cropland and other land used for agriculture. Through extensive development, a group ofnew agricultural production bases will be shaped; and (iii) through development of advantageresources, exploring multiple business operations and market-oriented pioneer projects based onresource advantages. Industrial development turns out to be the pioneer project motivating productionbases to also promote production of hundreds of households. In this way, agriculture and the ruraleconomic structure will be optimized to improve farmers' income.
The goal of comprehensive agricultural development mainly lies in three aspects: (i) throughcomprehensive management measures, agricultural production and ecological environment will beimproved. Meanwhile, high quality cropland with high and stable yields will be constructed and thecapability of fighting against natural disaster will be enhanced; (ii) through extension of agriculturetechnical achievements, relying on technical advancement, the overall agricultural productioncapability will be steadily improved to ensure the effective social supply of major farm produce withgrain as core; (iii) through multiple business management, market exploration and agriculturaloperations vertical integration will be promoted and farmer incomes in the project sites will begradually increased.
After more than one decade practice, comprehensive agricultural development has become animportant component of policy supported by the government under the socialist market economy.
Investment in comprehensive agricultural development (CAD) and its effects
Statistics indicate that CAD investment from 1988 and 2000 amounted to 115 billion yuan: 33 billionwas CAD funding from central finance, 30 billion was counterpart funding from local finance, 17billion was earmarked funding and 35 billion was contributed by rural collectives and masses.Additionally, farmers provided 9 billion workdays, equivalent to about 50 billion yuan.
During the past ten years, CAD has made remarkable achievements and has contributedgreatly to improved comprehensive agricultural production capability, promoted rural economicdevelopment, expedited the realization of two fundamental changes in agriculture and the ruraleconomy and speeded up the process of agricultural modernization, which can be summarized asfollows:

…Investment in land and water 193
To strengthen infrastructure construction and enhance stamina of agricultural development
Agricultural, water conservancy, forestry, science and technology and biological measureshave been applied in CAD projects. Current land resources have been comprehensivelymanaged in terms of mountain, water, cropland, forest and road. High level basic cropland hasbeen achieved: the land use rate, productivity, and the capacity to resist natural disaster hasimproved remarkably. Through development, standard cropland with stable high yields hasbeen produced which can be irrigated, drained and operated in efficient configurations. Forestbelts, connected canals and thoroughfares are part of expedited agricultural modernization.Signaficant accomplishments were registed during CAD's first 11 years: by 1998, 259 millionmu of mid- and low-yielding land was transformed; 29 million mu of wasteland suitable forcultivation was reclaimed; and 20 million mu of grassland was improved. In addition, 7 119small-scale reservoirs were newly built or enlarged – increasing national capacity by 3.13billion m3; 42 800 thousand drainage and irrigation stations were newly built; 1.14 million kmof canals were built or restored; 314 500 km of farm service roads were built and 782 000cultivators and weeding machines were purchased. At the same time, 226 million mu ofeffective irrigated area were newly expanded and improved; 132 million mu of drained areawere increased and improved and 157 million mu of soil were improved. Apart from theabove, 36 million mu of forest belt for cropland were afforested and cropland forest nets weremade in all completed CAD project sites. Moreover, some components of agro-ecologicalprojects – such as water conservancy projects, shelter forest on the upper reaches of theYangtze river and afforestation on Taihang mountain – were included in the CAD scheme andachieved sound ecological benefits.
To improve overall agricultural productivity for effective supply of staple farm produce
By the end of 1998, the CAD programme had improved grain productivity by 47.72 milliontonnes accounting for 40 percent of the total newly increased grain production in the sameperiod. Meanwhile the newly increased cotton, oil-plant, meat and hay productivity was 1.11million tonnes, 2.35 million tonnes, 4.56 million tonnes and 3.9 million tonnes respectively.This has played an important role in reliving the contradiction of supply and demand of ourmajor farm produce, especially promoting the grain production to a higher level.
To explore the effective way of "two essential transforms" in the economy of rural China to activelycreate advantage conditions of realization of agricultural modernization
Comprehensive agricultural development (CAD) not only adhered to land development andmanagement practice, but also stressed technical level improvements. Five percent of totalinvestment was allocated for technical funding in development areas in most provinces whichhad accumulated 2 billion yuan in the past 11 years. Some 768 000 mu of quality seed basewere constructed, 19 500 agricultural technical service systems were installed, 83.35 millionman time of farmer technicians were trained to promote technical achievement applications inagriculture and improving the level of intensive agriculture. Project sites fully utilized allkinds of agricultural resources to actively develop multiple business operations andprocessing industry of farm produce and by-products, to explore effective ways on verticallyextending agricultural integration and increasing the added value of farm produce. Verticalagricultural integration is market oriented, focusing on benefits, making arrangementsregionally, industrially managing, operating in large scale and serving society are graduallybecoming the direction of project sites development in future. In 11 years, 4.48 million mu ofcash forests were afforested, 1.88 million mu were developed for aquaculture, more than118.35 million livestock and poultry had been raised and 2 586 processing enterprises forfarm produce and by-products were established.

Investment in land and water in China…194
Farmer incomes in the project sites increased remarkably and speeded the process of achievingeconomic and material well-being
Comprehensive agricultural development not only increased the effective supply of farmproduce, but also substantially improved farmers' income. Per capita farmer's income in theproject sites is 260 yuan higher than in non-project sites (500 to 600 yuan). The highest evenreached 1 000 yuan. In this way the development goal of increasing production and incomewas achieved. Furthermore, the projects emphasized efficient grass roots social serviceorganization and established varied economic entities and pioneer enterprises to enhancesocial service functions, improve the strength of the collective economy and promotedevelopment of relevant industries. The proposals made important contributions to absorbinglarge numbers of rural surplus labour, increasing farmers' income, further stabilizing thehousehold responsibility contract system, perfecting combined and separated double trackoperation systems, speeding up the timeline toward being well-off and achieving this goal.
Achievements of cropland and water conservancy infrastructure in the Ninth Five-Year Plan
Irrigation areas were increased and pump irrigation and drainage was improved. Sixty-four million muof irrigation area was added, with an annual increase of 12 million mu – the most rapid period since1980. There was 820 million mu of effective irrigation area in 2000: 5 683 irrigation areas reached to10 000 mu countrywide to a total irrigated area of 367 million mu – of which 402 are large irrigationareas covering 290 million mu. Irrigation pumping power capacity in China was developing steadilyand rose to 74 million kW irrigating 553 million mu. Some 3.98 million pumping wells were dugcovering 226 million mu of irrigation area. Efficient irrigation facilities, strengthened servicefunctions and newly and largely increased irrigation areas enhanced the capacity of agriculture againstdrought, distinctly improved production conditions and promoted agricultural structure adjustment,increasing agricultural production and farmer income.
Existing irrigation facilities were transformed to water saving types. Some 115 million muwas covered by newly increased water saving engineering in the Ninth Five-Year Plan period whichreached 250 million mu by late 2000. Meanwhile, 250 million mu adopted new scientific irrigationmeasures and water saving methods, such as the shallow/wet/basking method for paddy rice andirrigating the crop itself in the cultivated land instead of flooding irrigation along furrows and surfaceof the land. In order to support development of water saving irrigation, subsidy and interestdiscounted loans were offered by the government to encourage farmers to adopt water savingtechniques and equipment.
Waterlogging and salinized cropland management. China has 367 million mu of waterloggedcropland. By the end of 2000, the primarily controlled area reached 314 million mu (85 percent), ofwhich 182 million mu had one waterlogging incident in five years. Initially transformed salinizedareas reached 88 million mu (76 percent).
Rural drinking water supply nearly resolved. The problem of drinking water supply for 51million rural Chinese was resolved during the Ninth Five-Year Plan with 1.25 times more than in theEighth Plan. Some 7 600 water supply engineering projects were built for towns and townships with adaily water supply capacity of 17 million tonnes and 70 million beneficiaries. Rural water supplydevelopment has improved water supply for the rural population, expedited poverty eradication andsmall town construction and promoted overall development of society and the rural economy.
State investment in agricultural water conservancy totalled 7.4 billion yuan in the Ninth Plan:Some 3.6 billion yuan was used for water saving engineering projects and 3.8 billion yuan was for

…Investment in land and water 195
human and animal drinking water. A further 23 billion yuan was spent on water conservancyconstruction in CAD projects (calculated in the investment).
TABLE 5Effective irrigation areas to indicate changes by different years
Year Effective irrigation area (10 000 ha) Year Effective irrigation area (10 000 ha)
1949 1599.0 1993 4864.6
1965 3203.6 1994 4875.9
1975 4612.1 1995 4928.1
1980 4488.0 1996 5038.1
1985 4403.6 1997 5123.9
1990 4740.3 1998 5229.6
1991 4782.2 1999 5315.8
1992 4859.0 2000 5385.1
Construction of production bases of grain and other farm produce
Since 1978, the household responsibility contract system was generally applied in rural China, greatlymotivating the production enthusiasm of farmers. Grain production rapidly jumped to 350 and 400billion kg from 300 billion kg. However, from 1985, fluctuations occurred. It was urgent to explorealternatives to further develop agriculture, to improve overall agricultural productivity and to increasethe commodity rate of farm produce.
From 1983, the state invested 300 million yuan in pilot commodity grain base construction in60 counties of 11 provinces with better grain production conditions, e.g. Heilongjiang, Jilin, InnerMongolia, Hunan, Hubei and Jiangxi. This was the starting point of agricultural commodity baseconstruction.
As pilot base construction was initiated during an important transition period of agriculturaldevelopment, it was endowed with a development opportunity by China's history. A new way wasfound to further expand agricultural production.
By 2000, state investment amounted to 2.079 billion yuan for building 1 397 agriculturalcommodity bases: 1 212 million yuan for construction of 1 009 grain production base counties; 558million yuan for 252 quality cotton production base counties; 175 million yuan for 77 sugarproduction base counties and 140 million yuan for 59 oil plant production base counties.
Through unremitting efforts in the 16 years, a remarkable achievement was made in buildingagricultural commodity base counties, which mainly embodied a gradual efficiency of agriculturalinfrastructure, distinct improvement of agricultural production conditions, resistance capacity greatlyenhanced against natural disasters, gradually completed quality seed breeding and agriculturaltechnical extension. The base construction strongly promoted the steady growth of major farmcommodities such as grain, cotton, oil and sugar. The commodity rate was gradually raised. Theestablished commodity grain base area accounted for 46 percent of total commodity grain areas sownnationwide, however, grain production took up 56 percent of the total. The commodity grain providedby the bases accounted for 65 percent of the total in China. The cotton base growing area andproduction was 70 percent and 80 percent respectively of China's total. The yield per mu was 5 kg
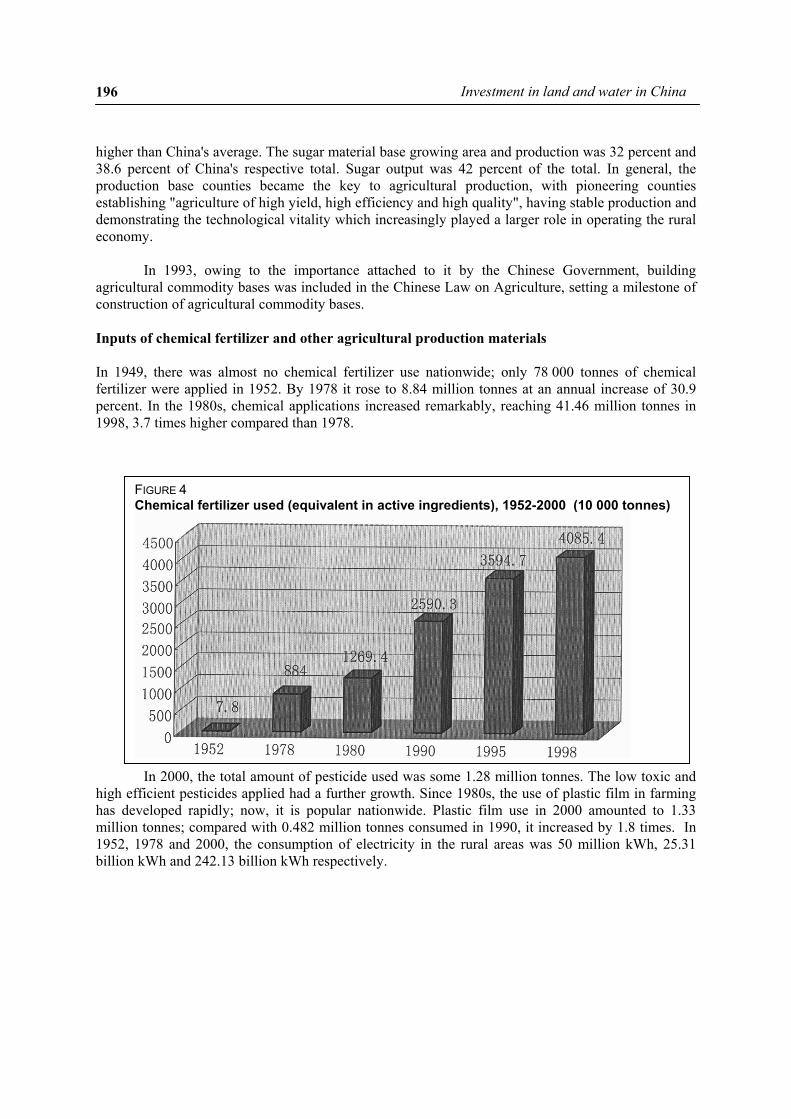
Investment in land and water in China…196
FIGURE 4Chemical fertilizer used (equivalent in active ingredients), 1952-2000 (10 000 tonnes)
higher than China's average. The sugar material base growing area and production was 32 percent and38.6 percent of China's respective total. Sugar output was 42 percent of the total. In general, theproduction base counties became the key to agricultural production, with pioneering countiesestablishing "agriculture of high yield, high efficiency and high quality", having stable production anddemonstrating the technological vitality which increasingly played a larger role in operating the ruraleconomy.
In 1993, owing to the importance attached to it by the Chinese Government, buildingagricultural commodity bases was included in the Chinese Law on Agriculture, setting a milestone ofconstruction of agricultural commodity bases.
Inputs of chemical fertilizer and other agricultural production materials
In 1949, there was almost no chemical fertilizer use nationwide; only 78 000 tonnes of chemicalfertilizer were applied in 1952. By 1978 it rose to 8.84 million tonnes at an annual increase of 30.9percent. In the 1980s, chemical applications increased remarkably, reaching 41.46 million tonnes in1998, 3.7 times higher compared than 1978.
In 2000, the total amount of pesticide used was some 1.28 million tonnes. The low toxic andhigh efficient pesticides applied had a further growth. Since 1980s, the use of plastic film in farminghas developed rapidly; now, it is popular nationwide. Plastic film use in 2000 amounted to 1.33million tonnes; compared with 0.482 million tonnes consumed in 1990, it increased by 1.8 times. In1952, 1978 and 2000, the consumption of electricity in the rural areas was 50 million kWh, 25.31billion kWh and 242.13 billion kWh respectively.

…Investment in land and water 197
OUTLOOK OF DEVELOPMENT OF WATER AND LAND RESOURCES IN CHINA
Since the late 1990s, agriculture and rural economy have had the following major developments:
Supply of farm produce: Farm produce has progressed from an overall shortage to a general balancewith relative surpluses of structural and regional natures;
Growth pattern: Agricultural development has shifted from being labour intensive to capital andtechnology intensive;
Development target: Agricultural development has shifted from seeking maximum farm production tomaximum returns from both domestic and overseas markets;
Income generation: Ways and means of farmers’ income generation have shifted from relying mainlyon increased production and higher prices of farm produce, especially that of grains, to relying mainlyon a diversified economy in agriculture and non-agriculture.
This shows that the development of agriculture and the rural economy has entered a new stage.Agriculture with higher returns and ecological development have been given top priority. Thegovernment has formulated important action plans to develop and protect water and land resources.
Comprehensive agricultural development (CAD) at a new stage
Direction of development
To meet requirements for developing agriculture and the rural economy at this new stage, the SecondJoint Meeting on Comprehensive Development of National Agriculture was held in May 1999 anddetermined the following changes in CAD guidelines:
• The practice of taking a combination of transforming low- or medium-yielding farmland withopening up wasteland suitable to farming as the major means to raise crop yield will be changedto taking the transformation of low- or medium-yielding farmland as the major means to improvecrop yield while minimizing reclamation of wasteland or trying not to open up any land. To thisend, CAD should be combined with protection of ecology and the environment;
• The practice of seeking higher production of major farm produce shall be changed into activerestructuring of agriculture for developing “high yielding, good quality and high efficiencyagriculture” by relying on progress in science and technology. CAD emphasis should be placedon four priorities: developing production bases for quality grain and for quality feed grain, water-saving farming and ecological development.
According to principles established at the Second Joint Meeting, the Office of ComprehensiveDevelopment of National Agriculture (OCDNA) made three adjustments to future CAD priorities:
• Comprehensive agricultural development will focus on infrastructure development totransform low- and medium- yielding farmland as the key element. It was further decidedthat higher grain production alone should not be overemphasized, but that more attentionshould be given to consolidating and improving CAD production capacity to lay a solidfoundation for agricultural restructuring. Starting from 2000, reclamation in CAD projectareas is forbidden;
• CAD projects will focus on developing the production basis of quality wheat and foddergrain as well as on water-saving farming and ecological development; and

Investment in land and water in China…198
• Increased attention will be given to applying research programme results. To makegreater use of progress in science and technology, and to explore effective use of agro-high technology in agricultural production, demonstration projects were set up beginningin 1999, including projects for seed improvement, water saving, facilitating horticultureand precision agriculture. OCDNA also decided that a proper share of the additionalfinances allocated annually during the Tenth Five-Year Plan will be identified for thesedemonstration projects.
Arrangement of development zones and focuses
Key state zones of comprehensive agroresources development with farmland as their focus include:
• Three key state development zones. The first is located in the middle and lower reaches ofthe Yangtze and Huaihe rivers, and consists of the Jiang-Han plain (Yangtze andHanshuir river basins), the Dongting Lake basin, the Boyang Lake basin, the Jiang-Huaibasin (Yangtze and Huaihe river basins), the Taihu Lake basin and the Sichuan basin.This zone has a subtropical climate, optimum water supply and sunlight for producinggrain, cotton, oil crops and fruits. The largest gain producer, it has double cropping of riceand wheat, or double cropping of rice, or triple cropping of paddy rice and dryland riceannually. However, grain production levels vary from area to area within the zone. Lowbiased to medium- or medium biased to low-yielding farmland is of higher potential inincreasing output and optimum cost-effectiveness. In addition, most medium-yieldingfarmland and some low-yielding farmlands are in some basic condition for transforminginto stable, high yielding farmland. Such land could produce more commodity farmproduce so long as vigorous efforts would be made to do so.
• The second zone is in the Huang-Huai-Hai basin (the Yellow, Huaihe and Haihe riverbasins), consisting of plains in front of Yanshan and Taihang mountains, low-lying plainsin Hebei, Shandong and Henan provinces (including the Yellow river delta) and theHuang-Huai plain (the Yellow and Huaihe river plain). This zone is mainly a temperatemonsoon climate. One of China's major producers of grain, cotton, oil crops and animalproducts, it is characterized by dryland farming of two crops a year. Water shortages are avery serious problem. Grain yields may be raised by 50 to 100 kg through waterconservancy, water-saving farming and transformation of low- or medium-yieldingfarmland. It is also possible to raise animal husbandry to a new development stagethrough developing feed crops and the comprehensive use of stalks and straws.
• The northeast China plain is the third region – including two national key developmentzones, the Songhuajiang and Liao He river plain and the three-river plain (Nenjiang,Helongjiang and Mudanjiang rivers). Located in a mild climate zone with properprecipitation and mild temperatures suitable for crops such as wheat, corn and soybean, itis an important commodity grain-producing area. Single cropping productivity is not asgood as in the regions above, but the land area is relatively large and per capita arableland and barren land suitable for agriculture is abundant and the commodity productionrate is high. Flood and low temperatures are serious concerns here. Crop cultivation isextensive; if land here is improved and its management strengthened, it would have greatpotential for yield increases.

…Investment in land and water 199
Key provincial zones of comprehensive agricultural resources development based on arable land:
This zone includes 19 development areas of the mid- and lower reaches of the Pearl river, theFenhe and Weihe river valleys, Ningxia and Inner Mongolia irrigated areas, Hainan island,central and southern Guangxi, central Yunnan and Guizhou, the Hehuang area of Qinghai, theYaluzhangbu Jiang river region, the Nujiang and Lanchangjiang rivers in Tibet, corridor areasof the Yellow river, the plains of Nanyang, Gangdi in north Hubei, Jinqu plain-Xiaoshouningarea of Zhejiang, the northwest area of Fujian, hilly areas of central Jiangxi, the hilly areas ofcentral Hunan, Panxi area, the northern Weihe river and eastern Gansu and the Yili-Taibeiirrigated area of Xingjiang. These areas are dispersed in 531 counties of 20 provinces andautonomous regions: Sichuan, Guangdong, Guangxi, Shaanxi, Shanxi, Inner Mongolia,Ningxia, Hainan, Yunnan, Guizhou, Qinghai, Tibet, Gansu, Jiangxi, Hunan, Hubei, Henan,Zhejiang, Fujian and Xingjian.
The development target is: (i) to improve low and medium yielding farm fields. The majortypes of existing low or medium yielding croplands are characterized by drought and shortwater supply, poor land and slope land. The emphasis of land improvement development issmaller areas and projects with potential for increased yields and basic conditions forimplementing relevant regional improvement projects, (ii) to improve low yield watersurfaces with a focus on suburbs of large and medium sized cities, (iii) the integratedexploitation, utilization and improvement of land focusing on integrated construction of farmfields, water, forests, roads and villages.
Key grassland resource development zones:
This region includes eight development zones in overlapping agriculture and animalhusbandry areas of northeast China, e.g. the grasslands of northern Inner Mongolia, Ganzhi,Aba, southern Gansu, Qinghai Lake, Yili and Alietai. The region involves 113 counties ineight provinces and autonomous regions: Inner Mongolia, Liaoning, Jilin, Helongjiang,Sichuan, Gansu, Qinghai and Xingjiang. Usable natural grasslands cover 1.264 billion mu and1.088 billion mu in animal husbandry and semi-animal husbandry areas (28.6 percent and33.1 percent respectively).
Yili has the highest quality grass. Its high quality/high yielding and medium quality/highyielding grassland is over half its area. High quality/low yielding and high quality/mediumyielding grassland comprise much of the overlapping areas of agriculture and animalhusbandry in the northeast China and northern Inner-Mongolia grasslands (30.5 percent and15.4 percent). Medium quality/medium yielding grassland takes a big share in the grasslandsof Aba, Ganzhi and Gannan (36.1 percent). Medium quality/low yielding grassland is a largeproportion of Qinghai Lake grassland (38.8 percent), followed by high quality/low yieldinggrassland (24.9 percent). Quality grass in Alietai is the poorest: low yielding grassland (42.4percent), high quality/low yielding grassland (29.7 percent). The grazing capacity per unitarea in Aba, Yili and Ganzhi is highest; the overlapping agriculture-animal husbandry area innortheast China and southern Gansu ranks second while the northern Inner Mongolia,Qinghai Lake and Alietai grasslands are poorest.
Major measures for development: are to improve pasturage and to develop high standardsown pasture in agricultural areas where soil and water conditions are rather good with easyaccess to transportation. Where conditions permit, grasses can be introduced into farm fields,a combination of agriculture and animal husbandry. It is to adopt the measures of "agriculturefosters animal husbandry" and "cattle fattening at different locations" to promote economicdevelopment of animal husbandry areas.

Investment in land and water in China…200
Key development zone of subtropical hills:
This region encompasses three development zones in hills south of the Yangtze River, thehills of Zhejiang and Fujian and the hills of Nanling. This region involves 285 counties in 8provinces and autonomous regions: Hebei, Anhui, Zhejiang, Jiangxi, Hunan, Fujian,Guangdong and Guangxi. Total land area is about 602 000 km2. Within this region, hillscomprise over 80 percent while forest covers 550 million mu. Only 20 million mu of land hasbeen used while 50 million mu has potential for further development. There are abundantforest and fruit resources: it is an ideal growth zone for subtropical perennial forest and fruitand important production basis of tea, citrus, tung oil, fir and Mao bamboo.
Exploitation should be based on securing grain production and transforming slopes to fullyuse the resources of gentle slopes to engage in vertical development of tea, fruit, economicforest, fast growing forest and water and soil conservation forest, and to upgrade andtransform low yielding poor orchards and gradually develop new orchards. It is to encouragethe relocation fruit trees from fields where it is suitable for grain production to the slopes, inorder to resolve the contradiction of land use by grain and by fruit. It is to actively developpasture, and to improve the natural pasture in a coordinated way and step by step. It is todevelop with great effort fast growing and high yielding forest in order to realize the strategicadjustment of lumber production to the southern part of the country and to alleviate theecological and forest resource crisis in northeast, southwest of China and Qinghai-TibetPlateau.
Coastal shoal development zone:
The region encompasses 184 coastal counties in 11 provinces and autonomous regions,namely, Liaoning, Hebei, Tianjing, Shangdong, Jiangsu, Shanghai, Zhejiang, Fujian,Guangdong, Guangxi and Hainan. The total area of shoal is 53 million mu, of which 20million mu is shoal above tide, the utilized and to-be-utilized areas are 40 percent and 60percent respectively. The shoal located in the interval areas of tide is 33 million mu, and theutilized and to-be-utilized areas are 30 percent and 70 percent respectively.
The development of shoal should uphold the principle of "three combinations" of cropfarming, animal raising (especially acquaculture) and protective forest system along thecoastal line and to fully tap the advantages of resources. The key areas to be reclaimed are thecoastal areas of northern Jiangsu Province, the gulf areas around Bohai sea, the delta area ofthe Yellow River, the southern coast of Qiangtangjiang River mouth, the delta area of PearlRiver and the delta area of Liaohe River. The key areas to develop acquaculture in shallowsare Liaodong peninsular, Shangdong Peninsular and Bohai Sea, the gulf of Zhejiang andFujian and the coastal areas of Guangdong, Guangxi and Hainan. The construction of coastalprotection forest will focus on the coastal lines of southeast and south China.
Tropical crop development zone:
In China, the tropical and the south of subtropical climate zone include 5 provinces andautonomous regions, namely, Hainan, Guangdong, Guangxi, Yunnan and Fujian, with 191counties and a total land area of 460 000 km2, which is a treasure land for tropical crops thatis not easy to have. The total acreage of tropical crops in China is over 11 million mu whilethe major crops are rubber, coffee, cocoa, coconut, palm, cashew nuts, spices, medical herbs,kenaf, pepper and cassava. Sugarcane is the major advantageous cash crop with acreage of 14million mu accounting for 75 percent of the national total. The major tropical and subtropical

…Investment in land and water 201
fruits and economic forest are banana, pineapple, logan, lychee, citrus fruits and other tropicalfruits unique to tropical areas.
The development of tropical crops should base on the domestic market while aiming at theinternational market, and focus of this endeavor is to develop those products that haveconsiderably significant shortage of supply in the domestic market, that have comparativelyhigh efficiency and that can yield high return of foreign currency. The coastal areas shouldtake fully advantage of the economic and technological conditions and use high qualityproducts to participate in the international competition. While in the hinterland, it is to focuson the construction of production basis and to develop those products that have a short supplyin the domestic market, and when conditions permit, to actively participate in competition ofthe international market.
Key development zone of poverty alleviation and ecological improvement
This region includes four zones of the hilly and gullies areas of loess plateaus, Qinglin-Bashan mountains, Wulingshan mountains and the limestone mountains of southwesternChina. This region encompasses 302 counties in 12 provinces, namely, Shanxi, Shaanxi,Ningxia, Gansu, Henan, Hubei, Hunan, Sichuan, Chongqing, Guizhou, Yunnan and Guangxi.Among the 302 counties, 109 national poverty counties have been listed in the national"Eight-Seven" (using eight years to eradicate poverty over seven million population) PovertyAlleviation Programme.
These four areas suffer the gravest soil erosion in China. Erosion in the gully areas of theloess plateaus accounts for 80 percent of the total while the erosion scale is 2 000-20 000tonne/km2 annually, and in some places, it reached 35 000 tonne/km2 yearly. In the Shanxiand Shaanxi sections of the eastern Losses Plateau, the density of gullies is usually 5-7km/km2 while the gully area takes up 40-50 percent of the total area. In the Ningnan-Longzhong areas of the western loess plateau, the density of gullies is 2-5 km/km2, andgullies take up 30-40 percent of total area. In Qingling-Bashan mountains, arable land withslopes greater than 25 degrees comprise 40 percent of total arable land. In Shanglou ofShaanxi province, eroded soils comprise 80 percent of total land area while in southernGansu, soil erosion accounts for 62 percent of total land. In Wulingshan mountain, soilerosion worsened 3 to 4 times than that of 50 years ago. Soil erosion in the limestone areas ofsouthwestern China caused serious stone desertification (coverage of forest and grass lessthan 30 percent) accounting for one tenth of total land area. Semi stone desertification (forest,bush and grass coverage of 30 to 70 percent) accounts for 13 to 20 percent and in some placesreaches 45 percent. The four zones are located in the upper and middle reaches of the Yellowand Yangtze rivers, so there is great strategic significance to strengthen water and soilconservation and river management.
The main tasks for the development and harness are as follows: actively carrying out thetransformation of middle and low-yielding farmland with the emphasis on turning slop landinto terrace in order to realize the goals of per capita basic farmland of one mu or more thanhalf mu for high and stable-yielding land; conducting three-dimensional development forhilly area and develop diversified operation with forest and animal husbandry as well aseconomic forest as the priority areas; strengthening construction of shelter-forest andproactively carrying out the integrated control of small drainage area.
MANAGEMENT OF LAND RESOURCES
Due to the fact that our country suffers a serious shortage of cultivated land in terms of per capita, theper capita cultivated area in coastal areas has been lower than warning line of 0.8 mu set by FAO.

Investment in land and water in China…202
Therefore, with respect to the protection of land resources, our Government has adopted even moresevere measures. The main practices are as follows:
Specialized departments are established. In 1998, the Ministry of Land Resources wasestablished to strengthen the management of state land resources with an emphasis on land resourcesprotection.
Great attention has been attached to the policies. Since our country is in serious shortage ofnatural resources on average per capita basis, therefore our Government sets the principles likepreciously and rationally use of land as well as truly protect of the cultivated land as the basic statestrategies. All these have played an important role in the following aspects, namely: correctly handlethe relationship between economic development, protection of cultivated land and ecological system,further strengthen the protection of land for agricultural purpose, especially protection of cultivatedland, strictly control the total amount of land used for construction and optimize the land usestructure, enhance the intensive use level of land resources, stabilize and increase grain productivityas well as guarantee the land use requirements for economic development.
Procedures for basic farmland protection should be strictly observed that balance on the totalamount of cultivated area be maintained. By 2005, the projection that the total cultivated area inChina will be not less than 128 million ha and total basic farmland area be not lower than 108.6million ha can be guaranteed. The new mechanism to protect cultivated land should be in place andperfected. The guidance and constraint mechanism on the relationship between land supply and landdemand should be established and the planned quota for diverting farmland is distributed in a rationalmanner, so as to increase the use of reserved land. During examination and approval of divertingfarmland, the plan for making up land and the implementation of financial resources must beexamined. Therefore, the regulation of making up another piece of land for occupying one piece offarmland should be rigorously observed and the establishment of cultivated land reserve system beexplored in an active way. In accordance with the quota of total acreage defined in "Overall Planningon Land Use", the responsible systems of leaders’ objective for protecting cultivated land at differentlevels should be set up and the policies of rewards and penalties in connection with the landprotection and benefits carried out at various local government levels. It is our task to implement theregulations on readjusting the land benefits contained in the “Law on Land Administration”. Theforecast and warning system for protecting cultivated land is requested to be set up and the socialmonitoring mechanism on land use and management is formed.
Land use for construction of key water conservancy, transportation and energy projects is tobe guaranteed. At present, projects which have strong government support, such as water conservancybuilding for agriculture and forest, development of transportation and communication, urbaninfrastructure construction, improvement of electric network in urban and rural areas, economicalhousing construction and ecological development. The land use requirements for all of that shall beguaranteed. General construction projects should make full use of the preserved land for constructionpurpose and idle land. It is to strictly carry out the state industry policies, such as: “Catalogue on theBan of Land Supply” and “Catalogue on the Constraints of Land Supply”. The standard system onland use for construction projects will be gradually perfected and implemented in order to avoidduplicated construction at low level. Pre-examination of land use for construction projects should bewell conducted and the principle of guiding the construction projects for not occupying or occupyingless cultivated land be promoted.
The reform and improvement of the land use system in urban and peri-urban areas shall bepromoted so as to push forward the urbanization progress. An overall plan for construction by stageswill promote and accelerate the transformation of old cities. Through readjustment of land usestructures and by making full use of existing available land, the circumstance of low efficientcy in theuse of land in urban and peri-urban areas can be changed. It is to carry out well the management of

…Investment in land and water 203
land use for construction in small cities and towns and rigorously control the occupation of farmlandand forestland for construction purpose in villages and townships. Under the precondition ofprotecting cultivated land and ensuring the legitimate rights of farmers, a rational solution to the issueof land use in cities and towns is to be found. Rural residents will be guided to move to the centralareas of villages and townships, while township enterprises are encouraged to locate themselves to thesmall industry areas. It is to promote the integrated system for villages. And, the management on thecombined development of cities and townships as well as the land use for the development districtsshould be strengthened.
The advantages of regional resources are to be brought into full play and land use structureand pattern readjusted in a rational manner. In accordance with the different land requirements forindustrial areas, highly concentrated areas for cities and towns, specialized farm products bases andecological protection areas, it is requested to rationally readjust the land use structure and pattern. Bystrengthening the guidance and monitoring management on land use for agricultural productionstructure readjustment, it is to form the mechanism on readjustment and utilization of agricultural landin a reasonable and orderly way, so that the destruction on cultivated land can be avoided. The areasfor over cultivation and inning should be returned into forest, grass and lakes in a planned way. Thecultivation in slope areas along big rivers and other fragile ecological areas should be totally andquickly returned. It is to actively carry out the sand prevention and control measures.
In future, an annual investment of about 200 million yuan will be used for monitoring landresource changes, land leveling and preparation as well as resumption of cultivation.
FERTILE SOIL PROGRAMME
Agriculture and rural economy in our country have stepped into a new development period. To ensurethe state food security, increase tangibly the farmers’ income, enhance the efficiency and benefits ofthe utilization of water and land resources and intensify the sustaining-strength of agriculturalsustainable development are the main objectives and tasks for the agricultural development in the newstage. However, the present situation of cultivated land quality, scientific fertilization technology andthe level of infrastructure facilities as well as the establishment of laws and regulations are far moreinadequate in terms of pushing forward the agricultural production and development. The mainconstraints are: firstly, the serious imbalance between the use and maintenance of cultivated land,which results in the obvious decline of soil fertility; the average content of organic matter in soil ofcultivated land across the country is only 1.8 percent, while that of organic matter in dry land soil isonly 1 percent. In the fragile ecological areas of the west and northeast, soil fertility decline is evenworse; secondly, the input benefit of fertilizer has not been raised dramatically. Total fertilizer volumein China ranks first worldwide. However, due to the irrational structure of varieties and big differencein fertilization in different regions, the utilization rate of fertilizer during the season is alwaysstaggering at around 30 percent, which has big difference in compare with the world advanced level.The issue of waste is also serious; thirdly, due to the fact that farm land and water environment areseverely polluted, the difficulty of raising agricultural products’ quality is becoming bigger.
For the above reasons, the country, therefore, decided to carry out the Fertile Soil Programme.The main objectives are to comprehensively strengthen the building of cultivated land quality andincrease soil fertility; optimize fertilization pattern in order to enhance the utilization rate of fertilizer;integrated use of waste resources and improve the farm land environment; equip with soil andfertilizer analysis facilities and improve the socialized service system.
Guiding principles and objectives

Investment in land and water in China…204
Guiding principles
The principles of overall planning, emphasis on key and pilot projects and steadily extension are to becarried out. With a view to the problems of cultivated land utilization and fertilizer application in ourcountry, efforts shall be made in order to realize the following directions: by optimizing allocationand rationally utilizing of soil and fertilizer resources, through the means of the progress of scienceand technology and innovation, with the realization of technology commercialization and socializedservice as the effective way, and by strengthening the cultivated land quality, extending balancedfertilization and enhancing the facilities’ level of basic equipment for soil and fertilizer, an integratedservice system for soil testing and formula, compound fertilizer, supply and application of fertilizerwill be gradually set up. An overall plan for the utilization benefit of cultivated land quality andfertilizer application as well as the enhancement of agricultural product production and its quality canbe realized, so as to promote the sustainable agricultural development.
Object
The first object is to realize ‘two transfers’ for the utilization model of soil and fertilizer resources.Cultivated land resources will be transferred from extensive operation into intensive operation of highefficient development, utilization and fertilizer accumulation. Utilization of fertilizer will be shiftedfrom low effectiveness modal to high effective and accurate modal. The second object is to realize‘four enhancements’ for the effect of soil and fertilizer utilization, namely, soil fertility will beincreased by one grade, utilization rate of fertilizer by 10 percent productivity of grain by one gradeand the share of soil and fertilizer in the contribution to the agricultural production by 10 percent. Thethird object is to adopt ‘four measures’ for soil and fertilizer, namely, the network of informationmonitoring and processing on soil, fertilizer and soil moisture, scientific formula of fertilizer,specialized formula fertilizer production and the whole process of technical service.
Priority tasks
The implementation of “Fertile Soil Programme” places its emphasis on the strengthening ofcultivated land quality building, extension of balanced fertilization technology, basic facilities foranalyzing soil and fertilizer and the role of state project demonstration.
Cultivated land quality building.
First, the input of organic fertilizer should be increased. The emphasis will be on organicaccumulation, production and basic facilities establishment, in order to push forward thespecialization, commercialization and mechanization production of organic fertilizer. Second, thelevel of scientific fertilization should be enhanced and the rate of fertilizer utilization increased. Thekey is to combine the organic and inorganic fertilizer together, guide the fertilization through testingsoil and providing formula, extension of new variety of fertilizer and deep placement of fertilizer.Third, efforts shall be made to improve the middle and low-yielding farmland, reform tillage system,transform the slope land and build high standard of farmland. As for the transformation for the mostdifficult middle and low-yielding farm land, the overall ability of the cultivated land for degradationresistance and production level can be raised through the building of permanent farm works andintegrated control as well as increasing the capacity of soil for preserving moisture and fertility.Fourth, soil degradation and farmland pollution should be prevented. The priority work is to conductthe soil fertility testing and monitoring, intensify the management of pollution for the farm land,collect and reuse the plastic film residue, make good use of human and animal wastes and stalkresources in order to protect ecological environment in agriculture.
Extension and application of technology of balanced fertilization.

…Investment in land and water 205
To do this, first, a nutrition investigation on arable land is required to indicate the quality of our arableland and primary productivity of the soil, which will be in service for soil improvement, fertilizercultivation, returning the farm land to forest and grassland and soil degradation management,especially for the extension of balanced fertilization technology. Secondly, more effort needs to begiven to promote a comprehensive social service system in terms of technology and materials, inwhich strengthening management for special fertilizer is a major task. This requires us to providefertilizer varieties needed in agricultural production in due course and places through fertilizerdistribution stations (plants) as well as to offer good after-sale service, such as technical guidance onfertilizer application. Thirdly, establishing a number of key demonstration zones for balancedfertilization technology helps us promote and extend this technology vigorously and make betterperform out of fertilization model plots areas.
Preliminary conditions for soil and fertilizer development.
The key parts are “two systems and one comprehensive demonstration base”—National NetworkSystem for Soil Chemical Content Monitoring and Information Management, National Trial Systemfor New Varieties of Fertilizer and New Technology for Soil & Fertilizer Development, and acomprehensive demonstration base for national “Fertile Soil” Project.
This project needs to be treated as follows: In region’s distribution, based on different laws ofsoil distribution, climate features and cropping and application patterns, the guidance given under thisproject should be varied in different categories and regions determined by the project constructionplan. In terms of processing, it needs to be carried out in a way of trial base first, breakthrough in keyparts second, and comprehensive promotion last. An estimated 100 million RMB of investment willbe made for this project in the next 5 years.
BUILDING AGRICULTURAL WATER CONSERVANCY IN THE TENTH FIVE-YEAR PLAN
Objectives of the Tenth Five-Year Plan
Water-saving is the focus in agricultural water conservancy in the Tenth-Five- Year Plan. With theaim to assist readjustment in agricultural structure and increase farmer’s income, more work needs tobe done in innovation and reform of current water facility technology and agricultural watermanagement system as well as operational mechanism to increase utilization efficiency on agriculturalwater, to improve rural service function for water conservancy, and to push agricultural waterconservancy development forward into a new stage.

Investment in land and water in China…206
Main tasks
The first is to increase land area of water-saving irrigation by 100 million mu to 350 million munationwide, to make a further reduction of 16 m3/mu in national average water consumption per unitin accordance with the Ninth Five-Year Plan and to cut down water consumption on land withagricultural production value of 10 000 RMB by 450 m3. The second is to increase the new irrigatedarea by 30 million mu so as to make the total irrigated area reach 850 million mu nationwide. Thethird is to complete transformation of water-saving facilities with the focus on water efficiency inlarge irrigation areas. About half of those areas will be enabled to be fully equipped with water-savingfacilities and to benefit from water-saving farming, production increase and efficiency improvement.The fourth is to transform 50 million mu of waterlogging-prone, saline and alkaline land and to takecontrol of waterlogging frequency to as low as once per five years in most areas vulnerable towaterlogging. The fifth is to build a total of 13 million of water cellars, pools and water tanks toensure water supply for average farming land per capita (0.5 mu) in case of drought in westernregions. The sixth is to basically solve the drinking problem for 24 million people, which is notaddressed successfully in the Poverty Alleviation Programme (the programme involves the plan tomake 80 million people get rid of poverty by using 7 years). The seventh is to increase water supplycapacity for villages and towns by 35 million tonnes/day and enable 75 percent villages and towns touse supplied water through newly-built and transformed water supply facilities in those areas. Theeighth is to expand irrigation area of fodder grass, cultivated pasture and natural grassland by 5million mu, and to establish a number of water-conserving demonstration projects in pastoral areas.
BUILDING NATIONAL ECO-ENVIRONMENT
Eco-environment is an important factor for human existence and development as well as thefoundation for economic and social development. In order to restore and protect our eco-environment,according to actual condition of our eco-environment, the central government formally issued the“National Plan for Eco-environment Building” in November 1998. As a long-term plan of 50 years, itindicates the tasks and objectives for eco-environment building campaign in three different stages.This is the most comprehensive plan ever issued by the State Council in terms of eco-environmentbuilding with the longest enforcing period. This plan is of great significance in terms of trees & grassplanting, soil erosion management, desertification prevention, natural forests & grassland protectionand eco-agricultural development. This is a substantial readjustment in the strategy of ourmodernization drive, and an actual act to carry out relevant international agreements.
It is stated in the plan that China’s eco-environment building will experience three stages –short-, middle- and long-term. The respective goals in these stages are:
Short-term goals
That is to use 10 years (2001-2010) to take control of man-made factors to avoid newly-emerged soiland water erosion and to restrain desertification. The specific objectives are: by 2010, to make anextra area of 600 000 km2 affected by soil and water erosion get controlled; to improve desertifiedland of 2 200 ha, and to increase the percentage of forest cover to above 19 percent (measured atabove 0.2 in canopy density), to transform sloping land of 6.7 million has and to returning farmingland of 5 million ha to forest; to develop farming land with high standard and forest network of 13million ha; to grow a total of 50 million ha of newly cultivated and improved grassland; to establish anumber of water-saving, dryland farming and ecological agricultural projects; to improve inhabitingenvironment for wildlife and plants and to make natural reserves take up 8 percent of the totalterritory. A preventive monitoring and protection system in key eco-environmental zones will beestablished.

…Investment in land and water 207
Mid-term goals
After eco-environment deterioration gets contained, this goal requires us to try every effort to make asubstantial improvement on national eco-environment within 20 years (2011-2030). The majorobjectives during this period are: to bring above 60 percent of manageable land with problem of soiland water erosion under control in different grades and to make a remarkable progress in the key areasof soil and water erosion treatment, such as the upper and middle reaches of Yellow River andYangtze River; to improve desertification area of 40 million ha; to increase forest area by 46 millionha and to make the percentage of forest cover as high as above 24 percent; to make natural reserves ofdifferent categories account for 12 percent of the total territory; to ensure popularization of thetechnologies for dry-land water-saving farming and eco-agriculture; to realize 80 million ha of newlycultivated and improved grassland and to restore about half of grassland affected by degradation,desertification, and alkalization. The eco-environment in the key treatment zone will be on the trackof benign circle.
Long-term goals
That is to use another 20 years (2031-2050) to establish a benign ecosystem to basically meet thedemand of sustainable development. Its major objectives are: to ensure primary treatment of allmanageable areas affected by soil and water erosion, afforestation on all land appropriate forcommercial forestry, a rational mix of woods and trees varieties and a percentage of national forestcover of over 26 percent; to transform most sloping land to terraces; and to realize overall restorationof grassland affected by degradation, desertification and alkalization. The national eco-environmentwill see an obvious improvement and beautiful mountains and rivers will appear in most regions.
In the Ninth Five-Year Plan, the central government invested 34 billion RMB in infrastructureconstruction for eco-environment, nine times more than the 3.65 billion RMB applied in the EighthPlan. It is estimated that the financial investment made in the Tenth Plan will be no less than that inthe Ninth Plan.
CONCLUSION
Although a new period begins when the current global economy is under dual restrictions from bothresources and markets, the resource economy is still playing a decisive role. Under the consistentstrategy of sustainable development, it is important to be fully aware of our actual condition andpotentials of agricultural resources and the evolution of agricultural eco-environment and to transformthe resource advantage to economic and market advantages, which will be very much significant toincrease farmer’s income, promote sustainable agricultural development and ensure the food securitynationwide.
We will intensify the effort in the development and protection of agricultural resourcescontinuously in the days to come. Meanwhile, foreign investors are welcome to take part in ourecosystem construction and resources exploitation, especially in the development of western regions.

…Investment in land and water 209
INTRODUCTION
The Democratic People’s Republic of Korea (DPRK) is located on the Korean peninsula ofcontinental northeastern Asia. The peninsula has a total area of 222 209 km2, of which the DemocraticPeople’s Republic of Korea holds 122 762 km2 or more than 55 percent. The DPRK shares borderswith China and Russia on the north bounded by the Amnok and Tuman rivers respectively.
The population of the DPRK is 22 550 000 and it has an annual growth rate of about 1.5percent. The population in unevenly distributed, being concentrated primarily on the western plains.Two-thirds of the population live in cities and the rest in rural areas. The majority of the rural peoplework on cooperative farms. Life expectancy is 66.8 years. The primary school enrolment rate for bothgirls and boys is 100 percent. The secondary school enrolment rate is 100 percent for girls and 100percent for boys. All adults are literate: 100 percent of both men and women.
The DPRK's gross domestic product is US$10.273 billion while per capita GDP is US$458.The Government of the Democratic People's Republic of Korea has consistently put the attainment ofself-sufficiency in food production as a primary task – by developing agriculture (mainly byinvestment in land and water) – and has directed every effort to carrying out this task.
At the beginning of the year 2000 the government called on its people to make decisiveprogress in building a strong and prosperous country and announced national priorities regardingagriculture, power generation and transport. The government emphasized that the highest priorityshould be given to the development of science as one of the means for a breakthrough in the country'scurrent economic difficulties.
Agriculture is intensively managed, but has always been constrained by the fact that Korea islargely mountainous, with only 20 percent of its land suitable for agricultural production. Winters areharsh and the growing season is short.
The economic problems that affected industry at the beginning of the 1990s also affectedagricultural production during the decade. Although government made efforts to counter suchlimitations through appropriate research, planning and intensive management, ageing agriculturalinfrastructure, equipment and fuel shortages also negatively affected production.
________________________________________________________________________________
Mun Jong Nam, Counsellor and Permanent Representative to ESCAP…Embassy of the DPR Korea, Thailand…
_________________________________________________________________________________
Investment in land and waterin the DPR Korea

Invesntment in land and water in DPR Korea…210
But the economic problems that affected industry in the early 1990s also affected agriculturalproduction due to political and economic sanctions, pressure from outside forces and continuednatural disasters. Fertilizer production from local plants, for example, virtually ceased because of theshortage of inputs and energy. This in turn drastically affected agricultural yields.
SUCCESSIVE NATURAL DISASTERS CAUSE SIGNIFICANT LOSSES IN ALL SECTORS
Since 1995 shortages have been exacerbated by a series of natural disasters caused significant damageto DPR Korea's agriculture and to its capacity to feed its people. Natural disasters from 1995 to 2001occurred in unfortunate succeession, one after another:
- In 1995, floods caused overall damage estimated at US$15 billion by DPR Koreagovernment officials. Of this amount, US$925 million was damage to the land itself,US$1 billion in damage to irrigation facilities; US$225 million in damage to pumpingstations and agricultural structures; US$1.3 million in damage to rivers and streams;US$1.575 million n losses to forests; and 1.9 million tonnes of grain lost;
- In 1996, flood damage was lower than in 1995 but still severe with an overall loss valuedat US$2.27 billion. Of the total, the agricultural sector sustained US$782 million inlosses, with 29 760 ha of arable land submerged, 27 300 ha of land lost to erosion and15 000 ha of land rendered unusable by being covered over by low quality siltation;
- Drought was the problem in July 1997 with 465 862 ha of arable land sustaining damage.Of this 107 000 ha were paddy fields while 358 700 ha of general agricultural land wasrendered non-productive, Grain damage of 1.7 million tonnes was registered, togetherwith the loss of 80 000 head of livestock. So severe was the drought that 40 617 ha ifforest cover was lost;
- Some 2.8 million people were affected only a month later (August 1997) when a severetidal wave damaged 288 800 m of sea dykes, and seawater flooding damaged 107 625 haof arable land and ruined 0.7 million tonnes of grain;
- Floods occurred again in 1998, with overall damage calculated at US$2 billion, includingUS$862 million in the agricultural sector and damage to 14 817 ha of arable land and355 000 tonnes of grain;
- May 2000 brought drought again – and damage to 400 000 ha of arable land. Paddy fieldsamounting to 160 000 ha were damaged by drought, while serious insect infestationaffected 530 000 ha and 0.96 million tonnes of grain were damaged.
- A typhoon followed in August 2000, with overall damage amounting to US$6.1 billion.The agricultural sector sustained US$165 million in damages while arable landsregistering US$136 000 in damage together with 400 500 tonnes of grain damage.
- The chronicle of disaster culminated in August 2001 by heavy rainstorms that resulted inUS$4.8 billion in rain and water damage. Some 85 000 ha of grain (including 58 000 inpaddy) was lost (180 000 tonnes) and 28 000 m of river dyke infrastructure;
The historically catastrophic losses of 1995 – US$15 billion – impacted arable land, irrigationfacilities, pumping stations and agricultural infrastructure to flooding, effectively destroying Korea'soverall economy. Moreover, from 1995 to 2001 natural disasters ranging from flood, drought and

…Investment in land and water 211
typhoon, compounded by frozen, heavy rain and tidal waves annually was responsible for some US$2to US$6 billion in agricultural field losses.
PERFORMANCE ON INVESTMENT IN LAND AND WATER
Difficulties in agriculture brought on by economic problems continue to seriously undermine DPRKorea's domestic food production. The effects of these tragedies have accumulated over several yearsand are now probably more significant than in the past in constraining production.
There are serious problems in the provision of electricity and fuel, which in turn have greatlyreduced the capacity of farms to reserve and deliver adequate supplies of water, while mechanizationand the provision of transport have also been severely curtailed and there is a chronic shortage offertilizers and other agrochemicals.
These in turn have severely limited necessary farm operations reducing the ability of co-operatives to cover water shortages, through increased irrigation, in adverse years and reducedpotential productivity.
Machine hours are declining as more and more become irreparable, constraining keyagricultural operations, while aggregate fertilizer use has dropped in recent years to well bellow basicrequirements to maintain reasonable soil nutrient levels.
Although the international community has assisted the country bilaterally and through UNagencies to rehabilitate agriculture and through donations of fertilizers and other inputs, the levelshave been well short of what is required to maintain agriculture and food production sustainability.
In view of all these problems, the output of rice and maize has fallen sharply. Thecorresponding decline in fertilizer use and production of paddy and maize in illustrate in Chart 1 andFigure 1, which clearly indicate the direct relationship between limited fertilizer supply and theDPRK's falling rice and maize harvests since 1989.
Available land resources
Arable land in the DPRK is extremely limited due to the topography of the country. Of some 12million ha of land overall, 80 percent is mountainous and unsuitable for agriculture. The main landuse systems comprise: (i) annual cropland; (ii) perennial cropland; (iii) permanent meadows andpastures; and (iv) forests and woodlands.

Invesntment in land and water in DPR Korea…212
About 1.85 million ha of land are used for agriculture, of which 300 000 ha are underpermanent crops (fruit, mulberries), 600 000 ha are used for paddy production, 650 000 ha for maizeand 200 000 ha for vegetables.
Of the remaining area, 50 000 ha are under wheat, buckwheat and barley and 40 000 ha areplanted in potatoes. The area under cereals covers over 80 percent of Korea's arable land. The limitedavailability of arable land and the government policy of food grain self-sufficiency has led DPRKorea to opt for high intensity agriculture. Soils are poor (pH 5 to 7, with organic matter only at 0.5 to1.5 percent) – and the risk of erosion is high in uplands.
All flat land is irrigated for paddy production. Sloping land below 16 is planted in maize and otherfield crops, while steeper hillside land (16 is planted to mulberry and fruit trees. Hilltops are usuallyforested. Each rural household is entitled to a plot of up to 90 m2 for its own use. Such plots areintensively cultivated with beans, potatoes, cabbage, and maize and support poultry and smalllivestock.
National plans for current and future land needs
Field reconfiguration permits high-efficiency mechanization of agriculture
In order to cope with these circumstances, the Government of the DPRK together with the UnitedNations Development Programme (UNDP), initiated the Agricultural Recovery and EnvironmentalProtection (AREP) programme which targets the replacement of emergency humanitarian aid withdevelopment cooperation by the year 2002 by producing three times more food (6 million tonnes).
The AREP proposals were formulated by an FAO/UNDP Sector Studies and ProjectFormulation Mission in 1998. AREP costs were estimated at US$344 million over three years (1999-2001) including a food-for-work programme in forestry. In addition, the government would investUS$374 million – of which 287 million in hard currency is mainly for feedstock and fertilizer imports.So far since the formulation of AREP in 1998, approximately US$130 million has been deliveredbilaterally through UN agencies and NGOs.

…Investment in land and water 213
The government proposed improving field configurations as an important policy for therevolution in agriculture and also concentrated efforts on the land readjustment in such granaryprovinces as Kangwon, North Pyongan and South Hwanghae from 1999 through the year 2001 toexpand and standardize arable land for high efficiency application of farm machinery.
As a national campaign with farmers, workers from all provinces and the Korean People’sArmy, the government completed reconfiguration projects for 300 000 ha of fields in Kangwonprovince in 1999 and 500 0000 ha in North Pyongan province in 2000 and 500 000 ha in SouthHwanghae province in 2001.These provinces are in mountainous places with high yielding soils buterosion, soil fertility depletion, salinity, alkalinity and acidic soils were increasingly unable to meetthe challenge of producing the required yields.
Improving agricultural field and crop design and layout in this manner is a greattransformation of nature for the prosperity of the country, a patriotic work of lasting significance.Land rezoning is essential for boosting gram production. This is a good way to increase grainproduction in countries with limited arable land. Proper realignment of fields is also important foreffecting comprehensive mechanization of rural agricultural economies.
The government invested heavily not only in field layout projects during construction but alsoby providing hundreds of tractors for the three provinces and enough organic and chemical fertilizerso that each province produced 2.5 to 4 times the crop yield compared to the previous year.Economies have been realized by minimizing the amount of fuel necessary for transporting food grainfrom other provinces.
To increase grain production where farming areas are limited, the government put forward anew policy of double cropping. The two-crop farming system is based on growing different short-growth-period crops in different periods on the same land in one year. Introduction of the two-cropfarming system has increased Korea's land utilization rate as well as per unit area of land. In parallelwith the above activities, the government promoted initiatives for quality seed production. Potatocultivation was also expanded in consideration of the characteristics of each region and its soils on theprincipal of right crop on the right soil at the right time.
Government targets were relatively constant during the past decade: an annual target ataround 580 000 ha for rice – although in 2000 the target was reduced to 535 000 ha – which producedfrom 4.5 tonnes/ha in good soil, allowing 45 000 ha to be diverted to other low yielding crops, such asbuckwheat, sorghum and millets, which are less susceptible to drought.
For example, in 1999 the government reported a significant fall in the area of maize plantedfrom an average of around 650 000 ha in the early 1990s to 496 000 ha. The decline was attributed tosubstitution of potatoes for maize. Together with double cropping, such substitution is generallyviewed as an important strategy to increase food supplies, particularly during the lean seasonbeginning in June.
The targeted area to be planted under the 1999-2000 double crop programme was 100 000 haof winter wheat/barley and 23 000 ha of spring barley/wheat.
The target for potato cultivation in 2001 was 187 000 ha of which 103 000 ha was planted asthe main crop and a further 77 000 ha as a double crop, though low yields were anticipated because ofthe continuing heavy drought.
At the same time, the government ensures production of organic fertilizer as the first andforemost method for improving soil fertility. With a correct understanding that producing organic
Invesntment in land and water in DPR Korea…214
fertilizer in quantity is essential for increasing crop yields, the government is producing organicfertilizer to enrich by the application of rich organic fertilizer through a mass movement and to applyit to the newly realigned fields as planned. Government agricultural authorities are also giving moreattention to the supply of chemical fertilizers to every province.
Available water resources
Water resources are abundant in the DPRK. Renewable water volume is estimated at 23 000 millionm3, the surface flow at 13 000 million m3. Substantial investment has been made in reservoirs, canalsand pumping systems for irrigation of paddy and maize. Some 1.46 million ha (79 percent ofagricultural land or 94 percent of arable land) has infrastructure for irrigation but only half of thedesign area is on average irrigated. Not more than 1.2 billion m3 water is actually used for irrigation.Operation of the important West Sea Barrage which serves 300 000 ha is hoped to be a majorcontribution towards this objective.
Irrigation is primarily from surface water. All but 300 000 ha of irrigation areas are served bypumping from rivers. This involves considerable lifts using large amounts of electrical and dieselenergy. Groundwater is rarely used. Paddy land is irrigated by flood basin, uplands by both furrowand sprinkler. Furrow irrigation in uplands is often done on sloping land favouring erosion.
National plans for current and future water needs
In order to reach its goal of self-sufficiency in rice and maize, the DPRK Government has focused oninvestment in water development. Water supply is critical to this effort.
As one step toward solving DPR Korea's water supply challenge, the government is carryingout a large-scale project of 150 km to streamline natural waterways from Kaechon to Lake Taesong inthe western part of the country. From an engineering standpoint it is a challenging project, and it wasundertaken under difficult economic conditions from the year 2000 as a national campaign project.The Kaechon-Lake Taesong waterway project would increase grain production by 300 000 tonnes inSouth Pyongan province. With its completion, water will flow naturally into paddy and nonpaddyfields, making many pumping stations unnecessary. It would make it possible to dispense with manyelectric motors, transformers and water pumps and considerably economize in electric power.
In the Kaechon-Lake Thaesong waterway project, it is important to concentrate on diggingwater tunnels and finish them as soon as possible. Tunnelling takes a long time to complete andtherefore heavy equipment for tunnelling is mobilized.
To cope with energy shortages, construction of small-medium hydro power stations wassuccessively conducted in the eastern and northern parts of the country, enabling rural areas to benefitfrom power for heating and irrigation.
The government has conducted to built thousands of reservoir and irrigation ponds so on inevery where in the country while repairing irrigation facilities damaged by consecutive naturaldisaster.
POLICY DIRECTION IN AGRICULTURE
In the economic sector, the government in early 2000 called on its people to make decisive progress inbuilding a strong and prosperous country, announcing the national priorities of agriculture, powergeneration and transport. It emphasized that the highest priority should be given to the development ofscience as one of the means for breaking through the current economic difficulties.

…Investment in land and water 215
The great leader of the Korean people, General Kim Jong Il, always pays deep attention tosolving the problem of food supply for the Korean people. While on frequent on-the-spot guidance torural areas, he sits together with peasants to share views on farming and teaches them the ways andmeans to increase agricultural production.
The government is establishing strategies to solve the food problem mainly by investment inland and water, revitalizing and modernizing the national economy in a short period, and increasingexpenditure for their implementation. The government also directs great effort to reforestation work toprovide favourable agricultural environment.
Taking full notice of diversified agricultural development, Democratic Korea is constructingfish farms and breeding high productivity fish, wherever government has water sources, andvigorously pushing ahead with a movement to increase the production of livestock including grazinganimals.
CONCLUSION
In the year 2001 as well, the government is striving to clear away the consequences of continuingnatural disasters, such as drought and unseasonably high temperatures, to raise agricultural productionby investment in land and water.
Thanks to the fighting sprit of the Korean people advancing in unity with the leader under anydifficulties, agricultural production will soon reach the levels achieved in the pre-disaster period.
The DPRK Government appreciates and thanks the United Nations Food and AgricultureOrganization for Asia and the Pacific for the sincere support to the Korean people in their striving tonormalize agricultural production and solve the country's food problem with about US$23.3 million offarming materials and technical aid from 1980 to 2001.
The Korean people’s struggle to raise agricultural production to the normal level will surelyproduce good results.

…Investment in land and water 217
INTRODUCTION
India continues to be a predominantly agrarian economy with the majority of its population dependingon agriculture for livelihood. The agriculture sector contributes about one-fourth share in GDP.Population growth and fragmentation of limited agricultural land on the one hand and limitations toincreasing productivity through traditional methods of cultivation on the other, posed a severeconstraint to agricultural growth in India's first decade of independence. The Green Revolutionbrought in by introducing high yielding varieties and systematically developing irrigation led to abreakthrough in raising productivity to meet the food demands of the increasing population. Per capitaavailability of food grains improved from 395 grams per day in 1951 to 459 grams per day in 1999(Agricultural Statistics, 2001). But the challenge of maintaining the momentum in growth of foodproduction keeping pace with population growth and making agriculture a viable source of incomegeneration in the wake of globalization of the economy continues to receive serious attention of allconcerned with agriculture. Ensuring accessibility of food to all citizens is another dimension of thechallenge to be tackled simultaneously by augmenting avenues of employment, especially in ruralareas.
Agriculture being the major occupation in rural areas, available land must be optimallyutilised to increase production and provide livelihood to the people. Agricultural land consists ofcultivated areas, fallow land, cultivable wasteland and land under miscellaneous trees has remained at184 million ha for several years. The net planted area expanded from 118 million ha in 1950-1951 to142 million ha in 1997-1998 by bringing more land under cultivation. Yet some 24 million ha ofcultivable land are kept fallow year after year due to delayed and insufficient rainfall or due to lack ofresources for cultivation (Land Use Statistics, 2001). Thus, there is scope for increasing net plantedarea to increase production and create additional employment.
Net irrigated area has increased from 21 million ha in 1950-51 to 55 million ha in 1997-1998and gross irrigated area grew from 23 million ha to 73 million ha. Cropping intensity was 133 percent.Gross cropped area increased from 132 million ha in 1950-1951 to 191 million ha in 1997-1998.Overall cropping intensity with reference to 142 ha of net sown area is 134 percent and is almost thesame as the cropping intensity of the irrigated area. This is contrary to the expectation that multiplecropping would be more prevalent in irrigated areas.
________________________________________________________________________________
Hemendra Kumar, Special Secretary…Ministry of Agriculture, India…
________________________________________________________________________________
India's population crossed the billion mark at the turn of the millennium, rising from 361million in 1950-1951. Population growth picked up momentum at the dawn of independence due to
Investment in land and water:India's experience

Investment in land and water in India…218
reduced mortality rates owing to better health facilities and improved living conditions. Consequently,cultivated land became more fragmented and the average size of an operational holding declined to1.57 ha in 1990-1991 (Agricultural Statistics, 2001). This trend will lead to operationallyinconvenient land parcels unless the proportion of the agricultural work force also decreases in accordwith reduced share of agriculture in GDP, as expected in a developing economy. According to censusdata, the proportion of agricultural workers in the total work force declined from 69 percent in 1951 to59 percent in 1991.
Net Value Added (NVA) is the value of output less intermediate consumption anddepreciation. Agricultural per-worker NVA has risen from Rs. 566 (US$12) per annum in 1951 toRs. 12 423 (US$264)2 in 1991. The corresponding increase in the non-agricultural sector is from Rs.975 (US$21) to Rs. 32 287 (US$686) during the same period (Annex I) (National Accounts Statistics,2001; National Accounts Statistics-Back Series). Apart from disparity in earnings betweenagricultural and non-agricultural workers, agricultural labourers get a smaller share of NVA as wages,which further reduces per capita income. As agricultural labourers are also observed to have moredependants to feed, poverty and food insecurity are often more pronounced in the case of rurallabourers.
Food production in India is greatly influenced by the vagaries of monsoon and other weatherconditions. About two-thirds of cultivated land depends on rain for water, and annual fluctuations areextreme. Considerable investment in agriculture and rural infrastructure is required to offsetfluctuations in production due to aberrant weather conditions and to ensure achieving the target levelof growth in production. Assured irrigation is a key factor in bringing about stability in production.Thus, investment in water in the form of implementing major, medium and minor irrigation projects,and development of watersheds in rainfed areas assumes primary importance in agriculturalinvestment. Apart from increasing productivity and production, these investments help in providingemployment to the rural population and increase their income.
INVESTMENT IN LAND AND WATER
Investment leads to capital formation consisting of additions to fixed assets and increases in stocks ofinventories. Additions to fixed assets (also called fixed capital formation) are assets produced asoutputs from production processes that are themselves used repeatedly or continuously in otherproduction processes for more than one year. Accordingly, land is not a fixed capital asset because itis not an output of a production process. Improvements made to non-produced assets such as land andcosts associated with transfer of landownership are also taken as fixed capital formation. Anothercomponent of capital formation, a change in inventory stock, is change in the inventory ofintermediate goods, finished goods and semi-finished goods held by an enterprise. Fixed capitalformation and changes in stock constitute Gross Capital Formation (GCF).
The National Accounts Statistics is India's central source for information on capital formation.Capital formation in private sector agriculture includes minor irrigation work, construction of bundsand farmhouses, machinery and equipment acquisition, increments to livestock, and development oforchards and plantations. Public sector investment in agriculture is predominantly in irrigationprojects. Capital formation in land reclamation, soil conservation, afforestation and watersheddevelopment are undertaken by the public sector, and constitutes about 20 percent of publicinvestment. Such items are shown in National Accounts as capital formation in public administration, 2 A conversion rate of Rs. 47 per US$1 is used throughout.

…Investment in land and water 219
and are not included under agriculture according to accounting procedure (Sources and Methods,1989). Public sector investment in developing rural infrastructure, e.g. building rural roads, ruralelectrification, agricultural markets, storage facilities, education, training and extension work, alsoinduces private investment in agriculture. Such investments provide employment to the ruralpopulation to earn their livelihood during the off-season. Though these expenditures arepredominantly meant for agricultural development and progress increasingly over the years, they arenot included as capital formation in the agriculture sector in the National Accounts. To get a clearpicture of agricultural investment, a committee is identifying all investment components, which assistcapital formation in agriculture. However, the trend in agricultural capital formation according to thenational accounting procedure in the past is as follows.
The GCF in agriculture rose from Rs. 52.58 billion (US$1.119 billion) in 1960-1961 toRs.213.88 billion (US$4.551 billion) in 1999-2000 at 1993-1994 prices. The share of agriculture inthe overall GCF of the economy decreased from 21 percent in 1951-1952 to 8 percent in 1999-2000(Table 2). In comparison with the agricultural share of about 25 percent in the GDP, its share of 8percent in GCF is disproportionate (National Account Statistics, 2001; National Account Statistics-Back Series).
TABLE 1 Gross capital formation in agriculture at 1993-1994 prices
The private sector has a major share in agricultural investment as indicated in Table 1. Thepublic sector contributed almost half of the investment in the initial decades of independence becauseof major irrigation development activities undertaken by the government. Since 1981, the publicsector share has declined significantly. The contribution of the private sector keeps increasing tooffset the decline in the contribution of the public sector. However, the necessity for increasing publicinvestment in irrigation and infrastructure development has been emphasized in the NationalAgricultural Policy and the approach to the Tenth Five-Year Plan.
Total Public Sector Private SectorYear
Rs.(billion)
US$(million)
Rs.(billion)
US$(million)
Rs.(billion)
US$(million)
Public SectorShare (%)
1960-1961 52.58 1 119 24.00 511 28.58 544 45.6
1965-1970 72.30 1 538 32.76 697 39.54 841 45.3
1970-1971 85.87 1 827 32.16 684 53.71 1 143 37.5
1975-1976 112.23 2 388 41.85 890 70.38 1 497 37.3
1980-1981 142.33 3 028 73.01 1 553 69.32 1 475 51.3
1985-1986 141.32 3 007 62.13 1 322 79.19 1 685 44.0
1990-1991 164.16 3 493 49.92 1 062 114.24 2 431 30.4
1995-1996 178.84 3 805 53.19 1 132 125.65 2 673 29.7
1999-2000 213.88 4 551 52.12 1 109 161.76 3 442 24.4

Investment in land and water in India…220
DEVELOPMENT OF IRRIGATION
Government's role as regards irrigation is to provide common facilities for the community. In directagricultural investment, its main activity is creation of irrigation facilities. The multi-purposehydrological projects executed in the initial decades of independence made possible the use of large-scale irrigation by farmers. Table 3 indicates changes irrigation since independence.
TABLE 2Agricultural gross capital formation in 1993-1994 prices, terminal years of plan periods
Plan period GCF of the economy(Rs. billion)
Agricultural GCF(Rs. billion)
Agricultural %of GCF
I Plan (1951-1956) 266 49 18.4
II Plan (1956-1961) 402 53 13.2
III Plan (1961-1966) 536 72 13.4
Annual Plans (1966-1969) 502 85 16.9
IV Plan (1969-1974) 722 103 14.3
V Plan (1974-1978) 834 131 15.7
Annual Plan (1978-1980) 980 174 17.8
VI Plan (1980-1985) 1 280 149 11.6
VII Plan (1985-1990) 1 595 134 8.4
Annual Plans (1990-1992) 1 729 150 8.7
VIII Plan (1992-1997) 2 526 183 7.3
IX Plan (1997-2000)* 2 685 214 8.0
* Figures for 1999-2000
TABLE 3Net area irrigated according to source (thousand ha)
Year CanalsTanks/other
sources Tubewells Other wellsNet irrigated
area
Grossirrigated
area
Croppedirrigated
area
Croppingintensity
overall (%)1950-1951 8 295 6 580 n.a. 5 978 20 853 22 563 108.2 111.1
1960-1961 10 370 7 001 135 7 155 24 661 27 980 113.5 114.7
1970-1971 12 838 6 378 4 461 7 426 31 103 38 195 122.8 118.2
1980-1981 15 292 5 733 9 531 8 164 38 720 49 775 128.6 123.3
1990-1991 17 453 5 876 14 257 10 437 48 023 63 204 131.6 129.9
1995-1996 17 120 6 585 17 894 11 803 53 402 71 352 133.6 131.8
1996-1997 17 262 6 969 18 410 12 408 55 049 73 246 133.1 132.8
1997-1998 17 093 6 591 18 434 12 448 54 566 72 784 133.4 134.3n.a. = not available
Area irrigation by canal has steadily increased from 7 million ha in 1950-1951 to 17 million ha in1997-1998. Irrigated area through tanks, tubewells and other wells, which are the sources of minorirrigation, increased from 13 million ha to 37 million ha. The share of minor irrigation in the netirrigated area is 70 percent. Areas irrigated by tubewells and other wells have increased remarkably in

…Investment in land and water 221
the minor irrigation sector. There is still an ample scope for increasing the use of tank and othersources of irrigation by developing watersheds. As already indicated, cropping intensity in irrigatedareas and unirrigated areas remains almost the same. A possible reason is that water from irrigationsources is not available in all seasons for multiple cropping in most irrigated areas.
Investment in irrigation shows itself as capital formation in construction. While investment bygovernment and individual farmers is covered in capital formation estimates in National Accounts,capital formation due to watershed development by non-governmental organizations (NGOs) andprivate agencies is likely to be omitted.
SOIL CONSERVATION
Land degradation takes place due to water erosion, wind erosion, ravine formation, waterlogging,shifting cultivation, forest degradation and other special problems. According to a survey conductedby the Indian Council of Agricultural Research (ICAR) 174 million ha of India's total 329 million haare affected by land degradation. Water erosion is observed to be the major cause of land degradation.Government is implementing varied soil conservation schemes. It also helps to develop watersheds.The important schemes are described in the following paragraphs.
PROGRAMMES AND EXPENDITURES ON IRRIGATION AND SOIL CONSERVATION
Major, medium and minor projects
Government has undertaken various major, medium and minor irrigation projects, command areadevelopment and flood control measures during various plan periods. Expenditures incurred in theseprojects, including external aid received from donors such as the World Bank, EEC, JBIC-Japan,KfW-Germany, France and the Netherlands, are given in Box 1. External assistance received since1997-1998 was Rs.7.46 billion (US$159 million) in 1997-1998; Rs.7.09 billion (US$151 million) in1998-1999; and Rs.6.23 billion (US$133 million) in 1999-2000.
Sporadic studies in different parts of India conducted to assess agro-economic impacts andemployment potential created with reference to particular projects reveal significant employmentgrowth in the target areas. It was found that more labour was employed in irrigated areas as comparedto unirrigated areas. The ratio of cultivators to labourers tilted in favour of labourers. The wage ratewas found to be higher in the command areas as compared to unirrigated areas.
Most expenditures on major, medium and minor irrigation projects are spent on creation ofcapital formation in the form of construction. These expenditures are closer to capital formationfigures due to public sector given by the National Accounts and as such they directly contribute toincrease in capital formation in agriculture.
Land improvement and watershed development in rainfed areas
There is no denying the fact that green revolution of the 1960s has centred mainly on irrigated areas,and yield gaps between irrigated and rainfed areas are quite substantial. But evidence indicates thatHYV technologies have been adopted even by farmers in rainfed areas, particularly where there isassured rainfall and the occurrence of floods and droughts are minimal. Nevertheless, the yieldresponse to technology adoption in rainfed areas is much less, as compared to that in irrigated areas.Also, the yield variability is relatively higher. In fact due to low and uncertain yield response to newtechnology as well as low capital absorption capacity, rainfed areas have lagged behind in terms of

Investment in land and water in India…222
both technology adoption and productivity growth. As a result, the rainfed areas are associated withhigher incidence of poverty. However, the facts that there is a limit beyond which irrigation potentialcannot be increased and that irrigated areas have already reached a plateau in the adoption of availablenew technology, do compel us to look for alternative sources of agricultural growth, particularly inrainfed areas. In fact, India will have to increasingly harness the potentials of rainfed agriculture forensuring the food and nutritional security of its growing population. Although the present food supplysituation looks sustainable, the growing demand for foodgrains due both to population growth andrising income of the poor may compel us to look for alternative sources and areas of food production.
India's irrigation potential was estimated at 93 million ha for 1997-1998, of which 73 millionha of gross cropped area was already utilised. However, only 55 million ha of net sown area of thetotal 142 million ha are currently irrigated. For small irrigation projects, the average cost per hectareof irrigation potential created has risen sharply from Rs. 566 (US$12) in the First Five-Year Plan toRs. 10 051 (US$214) in the Eighth Plan. The corresponding increase for large/medium projects wasfrom Rs.1 200 (US$26) to Rs. 98 495 (US$2 096). This acts as a constraint to further augmentation ofirrigation potential. In fact, all major irrigation projects are heavily subsidized. Their water use
BOX 1Major, medium, minor irrigation projects; command area development and flood control
Plan Major & medium Minor irrigationprojects
Command AreaDevelopment
Flood Control Total
Rs. US$ Rs. US$ Rs. US$ Rs. US$ Rs. US$I Plan(1951-1956)
3.76 80 0.66 14 - 0.13 3 4.55 97
II Plan(1956-1961)
3.80 80 1.42 30 - 0.48 10 5.70 121
III Plan(1961-1966)
5.76 123 3.28 70 - 0.82 17 9.86 210
Annual Plans(1966-69)
4.30 91 3.26 69 - 0.42 9 7.98 170
IV Plan 12.42 264 5.12 109 - 1.62 34 19.16 408
V Plan 25.16 535 6.30 134 - 2.99 64 34.46 733
Annual Plans(1978-1980)
20.78 442 5.02 107 - 3.30 70 32.73 696
VI Plan(1980-1985)
73.68 1 568 19.79 421 7.78 166 7.86 167 109.13 2322
VII Plan(1985-1990)
11.07 263 31.18 663 14.28 304 9.42 200 165.95 3531
Annual Plan(1990-1992)
54.59 1 161 68.80 1 464 6.15 131 4.61 98 82.15 1748
VIII Plan(1992-1997)
216.69 4 610 62.82 1 337 21.84 465 18.59 396 319.95 6807
IX Plan(1997-2002)(target)
429.68 9142 93.70 1994 28.87 614 29.39 625 581.64 12375

…Investment in land and water 223
efficiency is also very low because of low water rates, poor management and the inability toundertake further necessary investments to improve water use efficiency. In view of this, thewatershed development approach seems to hold promise to irrigate rainfed land and provide othereconomic and ecological benefits.
A watershed is generally defined as a geohydrological unit or land area, the runoff of whichflows in defined surface drains or streams to a common drain point. The watershed approach todevelopment recognizes the interrelationships between soil and water and between upstream anddownstream areas in development of water harvesting and conservation, appropriate land use,vegetative cover and other potentials of natural endowments to promote the socio-economic welfareof the people. All the while, ecological balance and sustainability is maintained.
Several governmental agencies, NGOs and external agencies promote watershed developmentprojects in various rainfed areas. There are at least 13 major government programmes watershed andsoil conservation development (see Table 2 on areas covered and budgets) including six operated bythe Ministry of Agriculture:
• National Watershed Development Project for Rainfed Areas (NWDPRA);• Soil Conservation in Catchments of River Valley Projects (RVP);• Soil Conservation in Catchments of Flood-prone Rivers (FPR);• Reclamation of Alkali Soils;• Alkali Land Reclamation and Development Project with EEC assistance; and the• Watershed Development Project in Shifting Cultivation Areas (WDPSCA)
The Ministry of Rural Development operates three programmes: the Drought Prone AreaProgramme (DPAP), the Desert Development Programme (DDP), and the Integrated WastelandsDevelopment Programme (IWDP).
The Ministry of Forests and Environment has two programmes: Integrated Afforestation andEcodevelopment Schemes (IAES) and the Area Oriented Fuelwood and Fodder Project Scheme, whilethe Planning Commission operates two programmes itself: the Hill Area Development Programmeand the Western Ghats Development Programme.
State governments implement many programmes for watershed development and soilconservation. There are a number of externally aided projects assisted by the World Bank, EEC, KfW,DANIDA, SDC and ODA. Nearly 300 NGOs are engaged in environmental work, includingwatershed development. Funds are also provided by the National Bank for Agriculture and RuralDevelopment, commercial banks and cooperative societies for developing watersheds.
National Watershed Development Project for Rainfed Areas (NWDPRA)
The National Watershed Development Project for Rainfed Areas (NWDPRA) was launched duringthe Eighth Plan (1992-1997) in 25 states and two Union Territories and continued to be implementedduring the Ninth Plan (1997-2002). During the Ninth Plan, it is proposed to treat an area of 2.30million ha. The broad development objectives are (i) enhancement of agricultural productivity in asustainable manner, (ii) restoration of ecological balance in the degraded and fragile rainfedecosystems by greening these areas through appropriate mix of trees, shrubs and grasses, (iii)reduction in regional disparity between irrigated and rainfed areas and (iv) creation of sustainedemployment opportunities for the rural poor. Impact evaluation studies both on the ground andthrough remote sensing techniques have shown that watershed based interventions have led toincreases in groundwater recharge, increase in number of wells and water bodies, enhancement ofcropping intensity, changes in cropping pattern, higher yields of crops and reduction in soil losses.

Investment in land and water in India…224
Agro-economic research centres in the ministry of agriculture and other agencies in each statewhere the project is being implemented did detailed impact evaluation studies. They revealed that theproject substantially helped increase productivity and provided additional employment to the localpeople (Compendium).
Soil Conservation in Catchments of River Valley Project (RVP)
Soil conservation in this programme commenced in 1961/1962 during the Third Five-Year Plan. Thetarget catchment area is 71.2 million ha and total treatable area is 17.7 million ha implemented inAndhra Pradesh, Assam, Bihar, Gujarat, H.P., Jammu and Kashmir, Karnataka, Kerala, Maharashtra,Punjab, Orissa, Rajasthan, Sikkim, Tamil Nadu, Tripura, Uttar Pradesh and West Bengal. The mainproject objectives are: (i) enhancement of productivity of degraded land; (ii) prevention of soil lossfrom catchment areas (iii) improvement of land capability and moisture regime; (iv) creation ofawareness for catchment core; and (v) optimization of resources for socio-economic upliftment.
Soil Conservation in Catchments of Flood-prone Rivers (FPR)
Beginning in the Sixth Five-Year Plan (1980-1985), the total extent of catchment area covered is 20.0million ha and the treatable area is 7.4 million ha. The scheme is being implemented in Bihar,Haryana, Himachal Pradesh, Madhya Pradesh, Punjab, Rajasthan, Uttar Pradesh and West Bengal. Itsmain objectives are (i) reduction of runoff from the catchment to reduce peak flow, (ii) prevention ofsoil loss from watersheds, (iii) improving land capability and moisture regimes, (iv) creation ofawareness for catchment cores and (v) optimization of resources for socio-economic upliftment.
Reclamation of Alkali Soils
Beginning in 1985-1986, this programme has been implemented in Gujarat, Rajasthan, MadhyaPradesh, Haryana, Punjab and Uttar Pradesh where there are alkali soils estimated at 3.6 million ha.Its objectives are to (i) reclaim alkali lands for increasing crop production, (ii) improve landproductivity, (iii) raise horticulture production, (iv) increase production of fuelwood and fodderspecies and (v) to generate employment opportunities in rural areas.
Alkali Land Reclamation and Development with EEC assistance
Commencing in 1993-1994, ALRD is being implemented in Bihar and Uttar Pradesh to improve theincomes of disadvantaged and marginal farmers by reclaiming potentially fertile alkali land.
Watershed Development Shifting Cultivation Areas (WDPSCA)
From 1994-1995 WDPSCA began work in a 2.3-million ha area in nine states of which thenortheastern states account for 2.0 million ha. The scheme is implemented in Arunachal Pradesh,Assam, Manipur, Meghalaya, Mizoram, Nagaland and Tripura. Its objectives are to: (i) protect the hillslopes of jhum areas and to reduce further land degradation, (ii) settle jhumia families by providingdeveloped productive land and improved cultivation packages, (iii) improve the socio-economic statusof ethnic minority (tribal) families and (iv) reduce the jhum cycle for mitigation of the ill effects ofshifting cultivation and to preserve the eco-environment.

…Investment in land and water 225
Integrated Wastelands Development Programme (IWDP)
Under implementation since 1989-1990, this scheme seeks to develop non-forest wastelands throughthe holistic development of watersheds. It aims at checking land degradation, putting wastelands tosustainable use and increasing bio-mass availability – especially fuel wood and fodder. The schemestrives to increase rural employment and to ensure people’s participation in wastelands developmentat all stages. Major activities include soil and moisture conservation measures, plantation, agro-forestry, horticulture, training and awareness campaigns.
Drought Prone Area Programme (DPAP)
A large scale government initiative, the Drought Prone Areas Programme (DPAP) was launched in1973-1974 to deal with the special problems faced by fragile areas continuously affected by severedrought. The responsibility of planning, executing and maintaining their watershed projects isentrusted to local peoples’ organizations formed for the purpose.
The basic objective of the programme is to minimise the adverse effects of drought on cropand livestock production, land productivity, water and human resources thereby ultimately leading tothe drought proofing of the affected areas. The programme also promotes overall economicdevelopment and socio-economic improvement of the resource poor and disadvantaged in theprogramme areas. Some 961 blocks of 180 districts in 16 states are covered: Andhra Pradesh, Bihar,Chhatisgarh, Gujarat, Himachal Pradesh, Jammu and Kashmir, Jharkhand, Karnatake, MadhyaPradesh, Maharashtra, Orissa, Tamil Nadu, Rajasthan, Uttar Pradesh, Uttaranchal and West Bengalwhere 11 738 watershed projects in an area of 5.9 million ha have been targeted for development inthe next 4-to-5 years at a cost of Rs. 23.48 billion (US$500 million) with an average project size of500 ha.
Desert Development Programme (DDP)
As recommended by the National Commission on Agriculture (1976), the Desert DevelopmentProgramme (DDP) began in 1977-1978 in both hot desert areas of Rajasthan, Gujarat and Haryanaand the cold deserts of Jammu and Kashmir, and Himachal Pradesh. Since 1995-1996, coverage hasbeen extended to few additional districts in Andhra Pradesh and Karnataka. The programme focuseson mitigation of the adverse effects of desertification and adverse climatic conditions on crops, humanand livestock populations, and combating desertification. The programme also aims at restoringecological balance by harnessing, conserving and developing natural resources, i.e. land, water,vegetative cover and raising land productivity.
Since its inception until 1994-1995, over 550 000 ha were treated under the core sectors ofland development, water resource development and afforestation/pasture development. Presently, 232blocks of 40 districts in seven states are covered: Andhra Pradesh, Haryana, Gujarat, HimachalPradesh, Jammu and Kashmir, Karnataka and Rajasthan. Currently DDP has targeted 5 353 watersheddevelopment projects over a 4 to 5 year period.
Integrated afforestation and ecodevelopment projects
State forest departments, autonomous bodies, research institutes and universities implement projects.The main objectives of the scheme are the (i) regeneration and ecodevelopment of degraded forestsand adjoining areas on a watershed basis, (ii) augmentation of availability of fuelwood and fodder and(iii) employment generation for the most needy sections of society. About 227 000 ha were planned tobe covered in the Ninth Plan.

Investment in land and water in India…226
Area oriented fuelwood and fodder project scheme
This scheme (i) augments production of fuelwood and fodder through regeneration of degradedforests and adjoining lands, (ii) promotes practices for efficient use of fuelwood and (iii) encouragespeople’s participation in planning, implementation and management of projects. An area of 341 000ha is to be covered in the Ninth Plan (1997-2002).
Hill Area Development Programme and Western Ghats Development Programmes
These programmes started in the Fifth Plan with a focus on watershed development and are beingimplemented in designated hill districts of Assam, West Bengal, Uttar Pradesh and Tamil Nadu.
MANAGEMENT OF LAND AND WATER DEVELOPMENT PROJECTS
The government manages major and medium irrigation projects. Individual farmers maintain mostminor irrigation facilities. Regarding watersheds, there is provision for the establishment of watershedassociations comprising all adult members residing within the watershed area. If a project area coversonly one village, the Gram Sabha (local council) will be designated as the watershed association. Awatershed committee of 10 to 12 members representing various sections of society (nominated by theassociation) is primarily responsible for carrying out projects. In addition, there is a full timesecretary, preferably a local graduate (from the same village or a nearby village) who is assisted bylocal volunteers to implement the watershed development project at the village level.
Another mode of developing and maintaining watersheds is to set up a Friendly FarmersForum by village consensus to conduct the work of training farmers, reviewing watersheddevelopment progress and helping form self-help groups. NGOs are involved in training self-helpgroups and in watershed maintenance.
Watershed development programmes undertaken thus far have mixed story of success andfailure. It is understood that these projects cannot succeed without full participation of projectbeneficiaries and careful attention to issues of social organization. This is because success depends onconsensus among a large number of users. Moreover, collective capability is required for managementof commons and for new structures created during the project.
BENEFITS OF INVESTMENT IN LAND AND WATER
The primary purpose of investment in land and water is to increase production and productivity.Employment generation with a view to providing livelihood to the rural people and maintenance ofecological balance are the other benefits expected of these investments. Studies undertaken to assessthe impact of implementing major, medium and minor irrigation projects have shown increasedemployment potential and income generation in the command areas. In the case of watershedmanagement and soil conservation, studies have also revealed a significant increase in landproductivity, employment generation and improvement in the living conditions of local population.Budgets for these projects are mainly wage payments to local people engaged in construction anddevelopment work. The resultant structures are additions to capital formation in the economy. Otherecological benefits such as biomass creation and groundwater recharge follow as a consequence ofwatershed creation.
The Ministry of Agriculture assessed the impact of irrigation on increasing foodgrainsproduction. It found that a 1 percent increase in the irrigated area would increase production by 4

…Investment in land and water 227
Box 2
What is the Poverty Line?
A poverty line divides the poor from the non-poor. It is the minimum required consumptionlevel of essentials such as food, clothing,shelter, transport and health care. A PlanningCommission Task Force in 1977 defined thepoverty line as a per capita consumptionexpenditure level which meets average dailycalorie requirement of 2 400 kcal in rural areasand 2 100 kcal in urban areas and a non-foodexpenditure minimum. The monetaryequivalent of this caloric intake wasdetermined using data on food itemconsumption and expenditure from NSS 28th
Round (1973-1974). Using a monetaryequivalent for 1973-1974, implicit price indiceswere used to extrapolate the values for thecurrent year. Subsequent NSS survey resultswere used to indicate the percentage ofpopulation below the poverty line.
In the revised procedure, monetaryequivalents are obtained for individual statesfor the base year and updated for subsequentyears by using state specific Consumer PriceIndices for Rural Labourers. The state specificresults of NSS on income distribution are thenused to identify the population below thepoverty line.
million tonnes (if the area and production technology continued as before and fertilizer use increasesat the same rate as in the recent past). The study shows that a major contribution to increase inproduction is attributable to expansion of irrigation facility. Therefore, continued efforts in the past toincrease irrigation facilities in conjunction with technological improvements and increased input usehave increased the agricultural GVA from Rs.811 billion (US$17.26 billion) in 1950-51 to Rs.2903billion (US$61.76 billion) in 1990-2000. Foodgrain production increased from 51 million tonnes to209 million tonnes during the same period and a major part of increase in it can be attributed toincrease in area under irrigation. The corresponding increase in per capita availability of foodgrainswas from 395 grams per day to 470 grams per day (Table 4).
TABLE 4Increase in agricultural production and work force
Year GVA(Rs. billion)
GVA(US$ billion)
Foodgrainproduction
(million tonnes)
Per capitafoodgrainavailability(grams/day
Agriculturalworkers(million)
1950-51 811 17.3 51 395 97
1960-61 1 093 23.3 82 469 131
1970-71 1 373 29.2 108 455 126
1980-81 1 593 33.9 130 410 148
1990-91 2 231 47.5 176 473 185
1999-00 2 903 61.8 209 470 Not Available
The poverty line is defined as the level of expenditure below which it is not possible for aperson to meet basic energy requirements and other needs. India's Planning Commission beganidentifying the poverty line and numbers of people below it in 1973-74, based on the results ofNational Sample Surveys on consumer spending. These measures show that the percentage of peoplebelow the poverty line has declined from 55 percent in 1973-74 to 26 percent in 1990-2000 (Box II,Table 5).
IMPACT OF POLICY ON INVESTMENT TREND AND PERSPECTIVE PLAN
(US$4.55 billion) in 1999-2000 (Table 2) its share in the total GCF has declined due to faster growthof investment in other sectors. The National Agriculture Policy adopted in 2000 (NationalAgricultural Policy, 2001), recognizes the inadequacy of agricultural investment. The policy proposesto create a climate conducive for increasing private sector investment in agriculture. Ruralelectrification, development of marketing infrastructure, augmentation of irrigation resources, fullerutilization India inherited a stagnant agriculture at the time of independence in 1947. The first task ofthe Indian Government in the immediate post-independence period was, therefore, to initiate growthin agriculture. A planning framework governed agricultural policy. The quantum of the Plan outlay,its financing and the targets set for the agricultural sector were all decided through the planningprocess at State and Central levels. The first three five-year Plans concentrated on growth with someinstitutional changes including abolition of intermediaries in agriculture, like Zamindars andJagirdars. In the mid-1960s, a new technology in the form of high yielding varieties (HYVs) wasintroduced for cereals. Apart from the new technology, public investment in agriculture particularly inirrigation rose significantly. The public sector played an important role in promoting agriculturalresearch and education. Large investments were made for the development of research system underthe aegis of the Indian Council of Agricultural Research (ICAR) and the State AgriculturalUniversities (SAUs). Simultaneously, a well-designed extension network was created fordisseminating new technologies to farmers. The administered price policy has provided incentives to

Investment in land and water in India…228
the farmers. Successive Five-Year Plans aimed at improving infrastructure through irrigation,stepping up the use of fertilizers, improved varieties of seeds, implements and machinery and supplyof credit. All these measures encouraged and induced the farmers to increase investment in land andwater, and consequently the private investment in agriculture started moving upwards at a faster pace.
Though Gross Capital Formation in agriculture increased from Rs. 49 billion (US$1.04billion) in 1955-1956 to Rs. 214 billion of the irrigation potential, and setting up of agro-processingunits in the producing areas are specified in the policy. Further, the National Water Policy adopted in1987 emphasises among other things, the importance of watershed management.
Growth with equity and sustainability is the basic principle underlying National AgriculturePolicy as well as the approach to the Tenth Five-Year Plan beginning in 2002-2003. Reducing thepoverty ratio by 5 percent and providing gainful employment to the added labour force by the end ofthe plan period are included in the targets. It is intended to increase production by increasinginvestments in agriculture sector. Diversification of agriculture, increasing cropping intensity, rainwater harvesting, development of watersheds and development of rural infrastructure such as roadsand electrification are important elements of the approach to Tenth Five-Year Plan.
A perspective plan indicating targets in respect of major, medium and minor irrigationprojects and required expenditure is not yet finalized. However, in respect of watersheddevelopment, the committee on the Perspective Plan for Development of Rainfed Areas hasfixed the following targets for 20 years covering arable and non-arable lands, considering therequirements of varied agro-economic zones.
To increase agricultural production at more than 4 percent per annum as envisaged in theNational Agricultural Policy, total investment in agriculture must also increase at the same rate underthe assumption that incremental capital-output ratio remains constant in the future.
COMPLEMENTARITY BETWEEN PUBLIC AND PRIVATE INVESTMENT
Public sector investment in agriculture is directly or indirectly expected to increase private sectorinvestment. In India it has been observed that public investment was higher than private investmentuntil 1980, but its share began to decline in subsequent years. However, private sector investment hasbeen increasing continuously. This may raise doubt regarding the positive relationship between thetwo sectors. However, a closer look would reveal that the phenomenon is due to the time lag betweenpublic investment and the induced private investment. There is a strong correlation between publicand private investment if we take the delayed effect into consideration. Further, public investment inelectrification and rural infrastructure (not included in agriculture GCF) also influences privateinvestment. The National Agriculture Policy and the approach to the Tenth Plan have rightlyemphasized increasing public investment in irrigation and land development along with thedevelopment of rural infrastructure.

…Investment in land and water 229
TABLE 5Number of Indians below poverty line
Rural Urban CombinedYear
Millions ofpersons
Populationbelow
povertyline (%)
Millions ofpersons
Populationbelow
povertyline (%)
Millions ofpersons
Populationbelow
povertyline (%)
1973-74 261 56 60 49 321 55
1977-78 264 53 65 45 329 51
1983 252 46 71 41 323 44
1987-88 232 39 75 38 307 39
1993-94 244 37 76 32 320 36
1999-00 193 27 67 24 260 26
TABLE 6Costs associated with five-year Plan periods
Total cost (1994-1995 prices) Five-Year Plan Period Area (million ha)
(Rs. billion) (US$ million)
Tenth Plan (2002-2007) 15 45.0 957
Eleventh Plan (2007-2012) 15 42.0 894
Twelfth Plan (2012-2017) 15 39.0 830
Thirteenth Plan (2017-2022) 15 37.5 798
CONCLUSION
Land development and irrigation have been given high priority in India's various Five-Year plans.Areas under cultivation and irrigation have increased significantly. Foodgrain productivity increaseddue to irrigation and the introduction of high yield varieties. Per capita foodgrain availabilityincreased from 395 grams per day in 1950 to 470 grams per day in 1999. Incomes also increased,enabling people to fulfil their calorie requirements of food. This resulted in reducing the percentage ofpersons below the poverty line from 55 percent in 1973-1974 to 26 percent in 1999-2000. However, itis necessary to step up investment in land and water to increase production substantially, ensure foodsecurity in the wake of population increase and make agriculture a viable occupation in the globaleconomy.
DRAFT STATEMENT ON INVESTMENT IN LAND AND WATER
India continues to be a predominantly agricultural economy with almost two-thirds of its populationdepending on agriculture for livelihood. The growth of agriculture in recent decades – particularlyfoodgrains production – has been spectacular. India has not only become self sufficient in foodgrainsbut has begun to produce exportable surpluses. Development policies and schemes have led to risingincome levels of the population and the incidence of poverty has reduced substantially. Growth in the

Investment in land and water in India…230
agricultural sector has been possible because of such policies as significant public investment in landand irrigation facility development, emphasis on research and development, and new technologies.
Indian agriculture is only 40 percent under irrigation and remains heavily dependent onmonsoon rainfall. A significant proportion of land is degraded requiring substantial investment for itsimprovement. Overall agricultural productivity is still far below its potential. About 80 percent of allfarmers belonging to small farmer and marginal categories and have limited capacity themselves toinvest in improving productivity.
Public investment in agriculture has declined. It is recognized that the decline must be haltedand investment stimulated, particularly in irrigation and land development for the diversification ofagriculture, improving cropping patterns and increasing productivity for food security. The greenrevolution must be extended to rainfed areas.
India recently prepared a long term National Agricultural Policy to achieve an annualagricultural growth rate of 4 percent by using the untapped potential of Indian agriculture for food andnutritional security and strengthening rural infrastructure to support faster agricultural development.This would accelerate the growth of agribusiness, create employment in rural areas, secure a fairstandard of living for farmers and agricultural workers, help eliminate poverty and discouragemigration to urban areas. It would also help the agriculture sector face challenges arising fromeconomic liberalization and the adverse affects of globalization.

…Investment in land and water 231
REFERENCES
Central Statistical Organisation, 2001. National accounts statistics 2001, Government of India. New Delhi.
Central Statistical Organisation, 2001. National accounts statistics - back series, Government of India. NewDelhi.
Central Statistical Organisation, 1989. National accounts statistics - sources and methods, Government ofIndia. New Delhi.
Directorate of Economics & Statistics, 2001. Agricultural statistics at a glance 2001, Ministry of Agriculture,Government of India. New Delhi.
Directorate of Economics & Statistics, 1998. Land use statistics at a glance 1996-97, Ministry of Agriculture,Government of India. New Delhi.
Directorate of Economics & Statistics, 1999. Land use statistics at a glance 1997-98, Ministry of Agriculture,Government of India. New Delhi.
Department of Agriculture & Cooperation, Compendium of impact evaluation studies of national watersheddevelopment project for rainfed areas, Ministry of Agriculture, Government of India, New Delhi.
Government of India, 2000. National agriculture policy, Government of India, New Delhi..

…Investment in land and water 233
BACKGROUND
The agriculture sector in Indonesia is considered by government to be strategic and is a main core ofthe national development programme. Some arguments for this consideration are as follows:
• land and water resources are abundantly available as basic resources to develop more productiveagricultural activities;
• agriculture plays an important role as a main pillar to sustain and to provide staple food for thepeople of Indonesia;
• most Indonesians are engaged in agriculture;• Indonesia's agriculture mainly uses domestic materials and fewer imported raw materials;• Indonesia's agriculture has great potential to produce high value commodities for export to
increase national foreign exchange earnings; and• agriculture in Indonesia demonstrated its survivability and was a driving force to turn the 'wheel'
of the grassroots economy when the monetary and economic crisis hit the country in 1997..
Indonesia's 1945 National Constitution stipulates that “Land and water and all naturalresources underneath are under the control of the government and [are to be] exploited as much aspossible for the prosperity of the whole nation." (Article 33)
The statement “under the control” does not mean physically authorized by the government.Rather that all exploitation of natural resources by any individual or group in the community,including land and water having economic value and social function, will be controlled by thegovernment. Exploitation is undertaken on a sustainable basis and for the maximum prosperity of allIndonesian people.
The agricultural development paradigm took on a new life during Indonesia's recent era ofreformation, with a significant transition to cope with the new needs. The paradigm centres in threebasic principles: (i) agricultural development should reflect democracy, transparency, accountability,good governance and decentralization; (ii) agricultural development should put first priority oncommunity-based participation, e.g. the role of government is restricted to that of being a regulator,facilitator, catalyst and dynamic force; and that (iii) agricultural development is carried out inaccordance with the right or authority as stipulated in District/Regional Autonomous Law No. 22,1999 including its implementation regulation (Government Regulation No. 25, 2000).
________________________________________________________________________________
Ato Suprapto, Director General…Agriculture Infrastructure…
Ministry of Agriculture, Indonesia…________________________________________________________________________________
LAND AND WATER RESOURCESDEVELOPMENT IN INDONESIA

Investment in land and water in Indonesia…234
POTENTIAL OF LAND AND WATER RESOURCES
Land resources
Indonesia's total land area is approximately 192 million ha (Puslitanak, 1992). Although the countryhas an extremely large land resources potential for agricultural development, in fact significantchallenges must be faced.
According to the National Statistical Bureau (1998), total agricultural land use in Indonesia –paddy fields, household gardens and orchards, rainfed uplands and drylands, open grass, brackish andfreshwater fishponds, swamps, state and private plantations – is about 66 million ha.
Paddy rice accounts for about 11 million ha of Indonesia's total area (Ministry of PublicWorks, 1998). Depending on the source of water and the provision of irrigation facilities, land isclassified as technical irrigation areas (3.4 million ha or 31 percent), semi-technical irrigation areas(1.12 million ha or 10 percent), simple irrigation areas (0.77 million ha or 7 percent), village irrigationareas (2.29 million ha or 21 percent), inland and tidal swamp (1.677 million ha or 15 percent) andrainfed areas (1.77 million ha or 16 percent).
In addition to paddy rice areas, Indonesia also has vast dryland and non-irrigated areas. Thetotal area of dry land in Indonesia is about 57 million ha and is commonly used for such purposes ashousehold yards, rainfed agriculture, upland/plantation and open grassland, while the remainder isneglected as dormant or 'sleeping' land.
WATER RESOURCES
Water is a central input for agricultural production. Potential water resources include rainwater,groundwater and surface water.
The amount of water in Indonesia fluctuates by season and is distributed differently amongthe regions. In general, most Indonesian regions have an annual rainfall of about 2 000-3 500 mm (60percent). Some areas (3 percent) have annual rainfall over 5 000 mm and others having rainfall of lessthan 1 000 mm annually. This data indicates that Indonesia with its humid tropical climate getsuncountable natural abundance in the form of high rainfall, though in certain areas occasional watershortages or drought takes place.
Indonesia has a total territory of 1.9 million km2 and has an average annual rainfall of 2 700mm. Of this, only an average of 278 mm (10 percent) infiltrates and percolates as groundwater. Theremaining (larger) portion flows as runoff or surface water (1 832 mm). If this water – groundwaterand surface water – can be managed properly, it would be readily available with a total amount ofabout 2 100 mm annually or equal to the discharge of irrigation water of about 127 775 m3/sec.
Total water storage capacity in terms of area in Indonesia is about 13.75 million ha –consisting of lake storage (1.777 million ha or 13 percent), dam and reservoir storage (50 000 ha or0.4 percent), rivers (2.895 million ha or 21 percent) and inland swamp/polder (9 million ha or 65percent).

…Investment in land and water 235
FACING PROBLEMS OF LAND AND WATER RESOURCES DEVELOPMENT
Land resources
To utilize land resources optimally for more productive agriculture, Indonesia must face some crucialproblems. Those problems are determined in six different categories:
Transformation of productive agricultural areas into critical land. Critical land formation takes placeas a result of mismanagement of productive agricultural areas by ignoring soil and water conservationin farming practices.
Critical agricultural areas in Indonesia have reached approximately 8 million ha (Ministry ofForestry, 1997), consisting of potential critical land of 4.712 million ha (50 percent), semi critical landof 1.893 million ha, critical land of 1.247 million ha (16 percent) and an extremely critical land areaof 224 000 ha. The growing impact of agricultural land degradation is seen in the increasing declineof land productivity, reduced hydrological function, and increasing sedimentation that gradually cancause the shallowing process of dams, rivers and irrigation canals.
Marginal land. Generally speaking marginal land is less productive, whether dry- or wetland, due toits formation process and its nature and properties. In Indonesia, marginal wetland is found in swampypeaty land and acid sulfic soils under tidal swamp ecosystems with a total area of about 24 million ha,while marginal dry land is easily obtained in acidic red or yellow podzolic and oxisol soils (about 47.5and 18 million ha respectively).
Sleeping land. 'Sleeping land' is temporarily uncultivated or neglected land that does not match itspreviously allocated land use planning classification such as for agriculture, housing, industry andpublic services. According to the National Land Agency (1988), the total amount of sleeping land inIndonesia is about 1 132 000 ha consisting of uncultivated agricultural land of 1 026 000 ha (55percent), housing area of 24 000 ha (14 percent), industrial area of 15 000 ha (8 percent), service andothers of 9 500 ha (6 percent). The presence of sleeping land is mainly due to factors such as ashortage of labour during land preparation, careless landowners who work in off-farm sectors, distantresidence of the landowner, low land productivity and failures of harvest due to pest outbreaks andfloods.
Conversion of paddy rice land The rapid process of development has implications for the increasingunavoidable demand for appropriate land. Paddy rice areas are not exceptions. The conversionfunction of land from agriculture (in this case paddy rice) to non-agricultural land undoubtedly bringsabout a significant loss to the country, e.g. reducing fertile land, idle use of high cost investment inirrigation infrastructure, the disappearance of rural job opportunities for landless farmers, decliningfood crop production, and a threatened national food security system.
Ministry of Agriculture data indicates that from 1981 to 1985 and from 1998 to 1999 theconversion of paddy rice land to non-paddy or non-agricultural land affected approximately 246 000ha. Those conversions are, consecutively, to resettlement (housing): 30 percent, industry: 7 percent,dry land: 20 percent, plantation: 25 percent, fish ponds: 3 percent and others 15 percent. During thefive years noted above it clearly deminstrates that the conversion rate is almost 50 000 ha annually.Unfortunately, the majority of rice field conversions (90 percent) takes place in Java (West Java,Yogyakarta and East Java provinces) which account for 60 percent of national rice production. Tocompensate for the loss of fertile land in Java by developing new land elsewhere (on other islands)outside Java is not easy. In addition to the budgetary burden, most land outside Java is not asproductive as that in Java.

Investment in land and water in Indonesia…236
Land fragmentation One reasons why agricultural practices in Indonesia are becoming more marginaland difficult to improve efficiency of farming practices is the tendency toward land fragmentation.This fragmentation has caused landholding averages to decrease to only 0.3 ha per household in Javaand 0.5 ha per household outside Java.
Land fragmentation tends to occur because of traditional community inheritance systems andis closely related to existing socio-cultural and customary norms or communal values. If the tendencycontinues, average landholdings will become too small, eventually making them more susceptible toconversion to non-agricultural purposes.
Infrastructure development of optimal irrigated area According to the Ministry of Public Works(1988) it is reported that Indonesia has:
• some 204 000 ha of paddy rice with undeveloped or insufficient primary (main) irrigationsystems, on-farm canals or other irrigation infrastructure and facilities;
• about 366 000 ha of existing paddy fields are served by completed main system irrigationfacilities, but are without on-farm (distribution) facilities;
• available land of 287 000 ha has main system facilities built but the land has not been convertedto rice field due to the absence of on-farm irrigation facilities;
• about 13 million ha of village irrigation command areas have not been rehabilitated and furnishedwith on-farm level irrigation facilities;
• approximately 1.39 million ha of swampy areas have been developed to paddy rice field equippedwith main canals but having no on-farm or micro irrigation systems;
• some 1.8 million ha of rainfed paddy field have no available irrigation infrastructure; and• some 1.291 million ha of dry land and upland has potential to be developed into paddy rice fields,
but irrigation infrastructure and facilities, both main and on-farm, have not been constructed.
From this it can be seen that there is about 6.3 million ha of unproductive agricultural areas because ofthe unavailability of irrigation infrastructure and facilities.
Water resources
Even though Indonesia is a humid tropical country with high annual average rainfall, its problems ofwater resources are still prominent. Some of main problems are:
Rising water demand. There is a strong community demand for water that satisfies the public in termsof quantity – and quality tends to increase. Conversely, because the quantity of available water isrelatively constant, competition among sectors such as agriculture, domestic, municipalities andindustry for limited water is becoming more intense. Therefore, a policy that wisely arranges the useand distribution of water is indispensable.
Lack of upland/upstream land management. Land management in the upper catchments withoutconsideration to soil and water conservation tends to create critical lands, causing devastating floodsand drought in the lower areas. Indonesia at present has approximately 8 million ha of criticalagricultural land.
Erosion-related degradation. Water functions such as lakes, rivers, or dams as well as irrigationcanals tends to decrease along with an increasing rate of soil erosion creating siltation and shallowingprocesses.
Population growth. Water pollution tends to increase with population increase and sectoraldevelopment that produces pollutant or byproducts.

…Investment in land and water 237
Inefficient irrigation water management due to irrigation facility damages and inappropriate irrigationwater application at on-farm levels can cause uneconomic or over-use of irrigation water.
Extreme climatic change can give rise to flood and drought disaster. Such disasters are often causedby abnormal global climatic changes such as El Nino or La Nina. Long drought periods destroyinghundreds of thousands of hectares of paddy rice field occurred in 1991, 1994 and 1997.
Over-pumping of groundwater without considering discharge capacity has created intrusion of seawater and groundwater pollution.
Weak water user associations have reduced the effectiveness of irrigation water management at theon-farm level. To illustrate, it is reported that of 39 000 existing or newly-created water userassociations, only 11 000 units (28 percent) were in fact developed enough to function properly.
POLICY ON LAND AND WATER RESOURCES DEVELOPMENT
We have described that the potential of land and water resources is quite available, but in reality thereare many complex problems still to face to develop more productive use of land and water resources.
Indonesia's Ministry of Agriculture has determined a vision to cope with the recent nationalagriculture development policy, e.g. to establish agribusiness systems with competitive power andwhich are "people oriented, sustainable and decentralized”. This vision must be manifestedoperationally in viable policies to make the agricultural sector become the core of all sectors ofnational development.
To enforce the establishment and accomplishment of this vision, strong support from land andwater resources development are strategically critical and determine success or failure. Based on thesecircumstances, the Indonesian government launched a set of general and specific policies on land andwater resources development. Evaluating the effectiveness of these policies is continuous, to improvetheir substance and content depending on actual situations and conditions.
Policy on land resources development
Critical land The policy to prevent the growing increase of critical (degraded) land in Indonesia is tointroduce and to develop upland farming conservation practices to farmers. This farming practiceemphasizes the maximum use of land throughout the year by considering soil conservation norms andapplying soil conservation techniques to improve soil productivity, sustainability and farmer income.This policy is basically taken to recover, maintain and increase the hydrological function, increaseagricultural production and improve farmer income on a sustainable basis. This policy and futureactions will be continued and improved since its impact is positive and it has multiplier effects.
Marginal land Government policy aims to manage marginal land and carry out land improvementand amelioration to increase land productivity both in uplands and wetland. This policy implementedthrough some programmes has a certain target – technology transfer and know-how to farmer throughintensive extension and training. It is strongly expected that farmers be able to apply the technologyby themselves. In future this policy will be developed and improved so that farmers can effectivelymanage marginal land.
Sleeping land Increasing areas of sleeping land in Indonesia cannot be separated from three factors:the limited (low) availability of labour, land or agrarian law and soil productivity. Therefore, the

Investment in land and water in Indonesia…238
problem solving approach taken is first to carry out a transmigration programme either for local orgeneral participants, second to develop mechanized agriculture as a comcerpt by using farmequipment and machinery. This policy will be carried out in future by giving strong notice andemphasis on law enforcement (land reform laws) particularly regarding abandoned land. Despite thisconcern to not let land lie unused, it is necessary for Indonesia to develop an agro-estate approach,that is to develop new land for cultivattion with high economic value crops, owned by commercialcompanies employing local farmers. In addition to giving guidance and direction, the role ofgovernment is to provide credit at appropriate (reasonable) interest. If the potential of 'awakening'sleeping land in Indonesia can be developed effectively, undoubtably the agricultural sector will growquickly and create new job opportunities.
Conversion of land function The occurrence of land conversion implies fast development in variousother sectors requiring land. Nevertheless, if the land required is agriculturally fertile every suchconversion will threaten the sustainability of Indonesia's agricultural sector and farming practices.Therefore prevention of land conversion must be seriously considered.
Current government policy to compensate for the loss of fertile land is to develop newagricultural land/riceland outside Java. This effort appears to be minimally effective as the rate of newlands being opened does not keep pace with land which is lost. In addition, the availability of labouroutside Java is so limited that land utilization not optimal. Another limiting factor is that developingnew agricultural land is quite costly. In considering these constraints, it becomes clear that in futurethe policy can be improved by developing new agricultural land/rice fields more selectively, and thatboth newly-irrigated areas and swampland can become productive. In spite of this hopeful policy, amore strict law enforcement policy on land use planning will be adopted.
Land fragmentation Land fragmentation means that with holdings growing progressively smaller andsmaller, farming tends to become inefficient in scale. A recent policy step is to consistently apply lawsor regulations for not further fragmenting small parcels. Community and government intervention isrequired. Another approach to counter land fragmentation is to introduce land consolidation through“corporate farming” in which farmers with small farms can join with others to make larger plots andso become more efficient, but without changing their landownership rights.
Staged infrastructure development toward irrigated land. Agricultural land that has not beencultivated optimally due to the absence of irrigation infrastructure will be developed throughprogrammes and projects step by step. Such programmes include new construction and rehabilitationof irrigation networks not only their main system but also on farm level. For upland and rainfedagriculture, pumps, ponds and storage will be introduced.
Water resources development policy
To resolve problems water resources development, Indonesia has taken the following policyinitiatives:
To conserve water including preventing water losses and improving the water holding capacity of soil.This is to maximize infiltration and percolation of rainwater into the ground and to minimize loss ofrainwater as surface runoff. Percolated rainwater can be stored as groundwater and surface water canbe stored in dams or other water storage. Future policy will be directed to increase the number ofsmall-scale dams and ponds to serve as water reservoirs to supply irrigation water during the dryseason.
To encourage a national water saving movement with all members of the community as water users.The movement aims to avoid wasteful use of water in all phases of distribution or conveyance.

…Investment in land and water 239
Therefore, the water saving movement is principally an effort to change the attitudes, habits orcustoms of all levels of the community as well as government employees in order to use water moreefficiently. It is not easy to change a certain communal or social habit, therefore the success of thewater saving movement will take time. Implementation of this policy will be continuous andconsistent to allow attitudes to change.
To carry out reforestation and regreening in upper catchments and to implement soil conservationfarming in slope areas.
To improve the operation and maintenance (O&M) of all irrigation infrastructure for optimalfunctioning. In implementing O&M, the active involvement of farmer or water users' associations ismaximally encouraged in order to create a sense of belonging among all users of irrigationinfrastructure and facilities that have been built.
To prevent water resources pollution from domestic and industrial waste. Future policy will be lawenforcement in the form of a measure to all activities against law and regulation that tends to createpollution problems to the environment/water resources. Dangerous and toxic pollutants fromindustrial waste must be treated and protected with strong laws or regulations.
To increase the efficient use of irrigation water, efficient water use technology and managementshould be implemented and developed. Technology that farmers might adopt includes pressurizedirrigation (either sprinkler or drip irrigation). In addition, increased water efficiency at the rice plotlevel of continuous flooding or submersion must be changed to intermittent methods. By applyingthese techniques crop productivity is not smaller than when continuous flooding is used despite lesswater being used.
To anticipate climatic changes particularly global climatic abnormalities creating long droughtperiods (El Nino) and high rainfall or flooding (La Nina), The Early Warning System is beingintroduced to develop actions and prevention efforts in anticipation of an unexpected disaster so thatlosses and damage can be minimized. Anticipation approaches include strategic, tactic and operationalapproach.
To prevent groundwater pollution and seawater intrusion, groundwater pumping must be donecarefully in consideration of the recharge capacity. Supervisory systems should be established forimplementation by authorized government institutions at provincial, district or municipal level.
To improve the performance of water user associations in managing irrigation water, the efforts takenmust empower water users' associations in such ways that eventually autonomous, socio-culturallyrooted, and environmentally, oriented are established.
INVESTMENT IN AGRICULTURE AND ITS CONTRIBUTION TO NATIONAL FOOD SECURITY
Since the first five-year development plan (PELITA), positive growth of the agriculture sector hasbeen a focus of attention in the overall development of Indonesia. The government vigorously acted toreduce food (rice) dependency from imports and the world market. In the 1960s and 1970s Indonesiawas well known as a major rice importing country. At the time of former President Soeharto, it wasrealized that economic development was much more important than simple political euphoria whenthe majority of the people were poor – and some were starving.
During the first four development plans (PELITA), investment in land and water resourcesdevelopment mainly emphasized agricultural development, especially food crtops and rice self-

Investment in land and water in Indonesia…240
sufficiency. Thousands of hectares of paddy rice areas were developed throughout Indonesia onislands outside Java focusing as major developing area. Land and water resources development isessentially inseparable, and have been developed simultaneously. Hundreds of existing irrigationnetwork with facilities and infrastructure not functioning well have been rehabilitated andreconstructed. Many new irrigation networks have also been constructed. In order to manageoperation and maintenance irrigation facilities on farm level thousands of existing water userassociations have been strengthened and new ones were established.
To ensure the sustainability of water storage capacity of irrigation works, most catchmentsnationwide were protected through a national regreening project. Many degradated catchment areashave been rehabilitated, reducing erosion and improving their hydrological condition.
Together with land and resource development, other agricultural development policies relatedto increasing food crop production have been vigorously strengthened. The main focus of policy wason increasing agricultural production through improved agricultural technology based on a selectedpackage of improved seeds and varieties, fertilizers and pesticides. Designing and providing suchimproved technology packages was done through a national mass guidance programme. Adoptiingtechnology at the field level was facilitated by appropriate financial packages and subsidized creditchanneled through village cooperative units. A large-scale agricultural extension programme usingthousands of well-trained field extension workers was introduced to reach people near major-roadnetworks.
Using such land development, irrigation, construction and rehabilitation, and cropintensification schemes, Indonesia achieved rice self-sufficiency in 1984. Government investment inthe irrigation sector in fiscal year 1994/1995 reached 338.8 billion rupees or some US$300 million.Rice self sufficiency was maintained until 1993, despite temporary government measures to importsome rice as a national buffer stock for market operation in case of rice scarcity – especially duringthe dry season.
As Indonesia gained confidence in securing its national food supply, attention graduallybegan to include the industrial sector. Government strategy for promoting industrial developmentemphasizes both export promotion and import substitution. Looking to the industrial sector as adriving force in the national economy is intended to be supported by a strong agricultural sector.Therefore since the end of the 1980s, government investment in land and water resourcesdevelopment as well as other use of agricultural production inputs has gradually decreased. Since thebeginning of the 1990s investment in land and water resources has been mainly focused on improvedoperation and maintenance of irrigation infrastructure and facilities.
Due to the rapid rate of fertile agricultural land conversion to non-agricultural use reachingsome 50 000 ha per year, prolonged drought and flood periods because of global climaticabnormality, environmental degradation, reduced subsidies of agro-inputs and agricultural extensionactivities, Indonesia's rice self sufficiency began to be unstable. Although rice self-sufficiency wasachieved in 1984, rice imports gradually increased. In the 1990s the level of rice imports have grown,reaching some 6 million tonnes in 1998 – or some 20 percent of domestic consumption. Such importsjoined the pre-existing monetary and economic problems and growing political instability.
To regain food self-sufficiency, Indonesia has given renewed attention to production,allocating substantial funds both from national budget and from international lenders. Starting fromthe 1995/1996 fiscal year investment from national budget financed a substantial land and waterresource development projevc in Central Kalimantan, the so-called One Million Hectares of TidalSwamp Development Project. This ambitious environmental project achieved worlwide notoriety byabsorbing one billion rupees from the national budget to provide new land to substitute for significantand rising losses of fertile paddy ricefields in Java. However, the project yield is little compared to its

…Investment in land and water 241
expectations. While basic land and water resource development has been attempted what remains ismostly environmental degraded land. This is Indonesia’s worst lesson in what can go wrong in landand water resource development.
In addition to many small projects financed through the national budget, there are many landand water development projects financed by international donors such as the IBRD, JICA/JBIC andthe ADB. Since 1990 there have been many major donor supported programmes for agriculture andrural development including land and water resources development projects, such as the IBRD-financed Groundwater Development Project, implemented in 11 provinces from 1993 to 1999; and theIntegrated Swamp Development Project conducted in 1994 to 2000 in three provinces.
The Asian Development Bank-financed Upland Farming Development Project was conductedin four provinces from 1995 to 2000. It also financed programmes such as the Second IrrigationSector Project from 1994 to 2000 and the Sulawesi Rainfed Agriculture Development Project from1994 to 2000 in four provinces in Sulawesi. All the projects have an objective to increase productivityof land and food crop production by introducing varied techniques, inputs, practices and farmmanagement to contribute to agricultural development, increase farmer income and alleviate povertyin rural areas.
To alleviate rural property commonly inherent with upland areas, a more attention graduallybeing paid to upland areas that during the last decade getting less attention than lowland/paddy ricearea. The policy of focusing rice field as a target of agriculture development tends to cause that aregion dominated with lowland generally become more prosperous than that of upland areas. Manyvillages classified as poor are situated in upland areas. Introduction of integrated upland conservationpractices through the Sulawesi Rainfed Development Project exemplifies government efforts toreduce poverty, particularly in rural areas. By this integrated project, high value economic crops andother agricultural commodities such as livestock, estate crops and poultry are introduced. At the sametime, rural infrastructure such as farm and village road, drinking water facilities, checkdams and othersoil and water conservation structures were constructed on a communal and participatory basis toensure sustainability of the project activities.
In fact, poverty is also present in urban and suburban areas that grew rapidly during themonetary and economic crisis. Since the rate of economic grow was very low and the exchange rate ofthe US dollar was so high, many private companies using imported raw materials could no longersurvive. Job opportunities became very limited; many people lost their jobs. To provide jobopportunities and to alleviate poverty, land (particularly 'sleeping land' around urban or suburbanareas) was cultivated extensively by planting short growth period-high value economic crops. Thisfarming practice is usually called peri-urban agriculture.
In terms of national food security, though the investment on land and water resourcesdevelopment is not as big as that of allocated budget in fiscal year 1994/1995, national rice productionin the year 2000 has surprising surplus over 2 million tonnes. This surplus mainly resulted fromimproved intensification, favourable climate and weather conditions, increased cropping intensity andrice planting area and declining national per capita rice consumption (below 120 kg per year).Therefore, rice import policy questions are currently not so urgent, or if so for some reason, it wouldnot likely be during harvest.
CONCLUSION
National food security on quantity basis meaning self sufficiency of rice remains a major concern ofthe government until recently. It is realized that investment on land and water resources development

Investment in land and water in Indonesia…242
has gradually decreased since the achievement of rice–self sufficiency in 1984 in accordance with thestaring policy of placing industrial sector as a driving force of national economic growth.Unfortunately, the sufficiency of rice did not last longer indicated by growing import of rice since1993.
To obtain again sufficiency of rice a strong struggle has been made by the government. Alongwith overcoming land and water resources problems, some national actions were taken such asincreasing the quality of intensification, increasing cropping intensity, expanding planting area,improving agriculture infrastructure and facilities – including improvement of irrigation networks andimproving food diversification. Eventually in 2000 and 2001 there was sufficiency of rice with asurplus of more than 2 million tonnes. However, in anticipation of the growing national food demandin the twenty-first century with an annual population increase of about 2 percent, significant budgetmust be invested in the agricultural sector including on land and water resources development.

…Investment in land and water 243
BACKGROUND
The Lao People’s Democratic Republic (Lao PDR) is a small landlocked country located in theIndochina Peninsula. It is increasingly being recognized that landlocked can be interpreted as land-linked, changing the emphasis from regional exclusion to regional inclusion. The country's total areais 236 800 km2. About 20 percent of the land area is flatland (70-200 msl); the other 80 percent issloping hillsides and mountains (200-2 820 msl). The Lao PDR has a tropical monsoon climate:annual rainfall averages 1 000-1 500 mm in most of the country. While there is an abundance of forestand water resources with potential for development, both floods and drought are commonlyexperienced. The population is about 5 million persons with a growth rate of about 2.5-2.8 percent perannum. Lao is a multi-ethnic country having some 48 ethnic groups.
From 1975 to 2000, the development of the socio-economy of the Lao PDR improvedsignificantly. Agriculture is the main sector of the national economy and has shown marked success,especially from 1997 to 2000, in spite of the negative impact of the financial crisis of 1997 and after.Agriculture's share of GDP was about 51 percent in 2000, with an average growth rate of 4 to 5percent annually. Nevertheless the pace of change has been quite uneven. Along the Mekong corridor,market forces now drive the agricultural economy. In the mountainous sloping lands away from theMekong, subsistence agriculture and acute rural poverty predominate. Economic growth has hadsignificant effect in raising urban living standards but its impact in remote rural areas was marginal.
In 1986, the Government of the Lao PDR (GOL) made a drastic policy reform, shifting from acentrally planned economy to a market oriented system by introducing the New EconomicMechanism (NEM). The reforms included price decontrol, liberalization of trade and paymentsystems, introduction of a two-tier banking system, freeing all but agriculture-related interest rates,initiation of civil service reforms, introduction of a legal framework to support a market economy andan extensive privatization programme. Considerable progress has been achieved in structuraltransformation and macro-economy that contributed to the growth of real GDP at the robust rate of6.3 percent per annum from 1990 to 1994, and per capita income rising at a 3.2 percent rate over thesame period. Growth accelerated to 8.1 percent in 1994, continuing at 7.1 percent in 1995 and anestimated 6.9 percent in 1996, led by the strong recovery of agricultural production and a continuedboom in manufacturing, construction and services. In 1997 the Lao PDR joined the Association ofSoutheast Asian Nations (ASEAN) and the ASEAN Free Trade Area (AFTA).
________________________________________________________________________________
Mr. Anonth Khamhung, Director General, Department of Planning…Ministry of Agriculture and Forestry, Lao PDR…
_________________________________________________________________________________The effects of the crisis were significant, with real GDP growth in 1998 falling to 4 percent in
contrast to rates of almost 7 percent in the previous two years. However, lowered GDP growth was
LAND AND WATER INVESTMENTIN THE LAO PDR

Investment in land and water in the Lao PDR…244
not very serious in comparison with other countries, because agriculture continued to perform wellowing to relatively high prices of rice and other major crops. Paddy production increased by 18percent from 1996 to 1998 because of increased irrigation by heavy investment in the National PumpInstallation Management Project (NPIMP), while industrial sector GDP, particularly the textileindustry, dropped by half from 1996 to 1997. The best performing industrial subsector washydropower whose output increased by more than 60 percent in 1998, while the constructionsubsector showed a 18 percent fall in 1998 – obviously affected by the crisis.
AGRICULTURAL PRODUCTION AND NATIONAL FOOD SECURITY
Food security is still and will be the Lao PDR's highest priority strategy to stabilize economicdevelopment and socio-political security. The overall objective of national food security is to stabilizefood production and maintain growth rates to meet domestic demand and overcome the basic problemof food distribution and circulation in difficult areas and at the same time increase average householdfood security.
As rice is the staple for the Lao people, its production must be stabilized at a high level.Increased paddy production is to be achieved through intensified production in the six major plainsand expansion of cultivated areas for paddy in mountain valleys with adequate water. Rice productionreached 2.2 million tonnes in 2000 compared to 1.4 million tonnes in 1995. This remarkable increasewas mainly due to the rapid development of an irrigation system for dry season rice production since1997.
Average production of paddy rice per capita has increased from 310 kg in 1995 to 430 kg in2000. For the last five years the annual growth of rice production was 9.2 percent and other foodstuffssuch as maize, roots and tuber crop, soybean, vegetables, eggs, poultry and meat products alsoincreased. These annual growth rates exceeded the annual population growth rate of about 2.5 percent.However production of food and foodstuffs is still insufficient and unevenly distributed. Production isstill not very stable due to frequent natural events, e.g. calamitous floods and drought, and limitedagricultural infrastructure. There is also a wide variation in food production from region to region andamong provinces. The main food producing areas are concentrated in the main plains along theMekong River and account for 60 to 70 percent of food output. In the mountains where over half thepopulation lives, food output was only some 30 to 40 percent of total output.
FOOD INSECURITY AND POVERTY
Government statistics (Lao Expenditure and Consumption, 1997/98) indicate that nearly one-third(30.6 percent) of the population can be classified as poor, below the low or food poverty line, while39 percent are below the high poverty line. However, there are large differences in the incidence ofpoverty across urban and rural areas and across regions. The incidence of poverty is 43.8 percent inrural areas and 15 percent in urban areas.
Food circulation and distribution between regions is at present a great challenge to betterensure national food security. Half the provinces (nine of 18 provinces and cities) face frequent fooddeficit situations; most are located in mountainous regions where difficult transportation conditions(mainly in the north) obstructs food distribution.

…Investment in land and water 245
GOVERNMENT STRATEGIES AND POLICIES
The strategies and policies of the Government of the Lao PDR toward development in the openingyears of the twenty-first century are: (i) to completely exit the group of least-developed countries bythe year 2020, to basically eradicate poverty by the year 2010, and to reduce poverty for half of thepoor by the year 2005; (ii) to achieve these goals, the government continues to implement the NewEconomic Mechanism (NEM) in both economics and politics. This consists of continuing the in-depthtransformation towards a market economy through state adjustment, promotion of all economicsectors and the exploitation and use of our resource potentials in an efficient and sustainable manner.Furthermore, (iii) government intends that national development will take place within the prioritiesof national programmes outlined in its current Socio-economic Development Plan: food production;stabilization and reduction of shifting cultivation; commercial production; infrastructure development;improved socio-economic management and foreign economic relations; and rural development andservices development.
In this respect agriculture and forestry will play the key role in developing the nationaleconomy in the context of sustainable resource use and poverty alleviation. Most the poor are farmersin rural and mountainous areas: household food consumption in Laos strongly depends on homeproduction. In poor rural households, food accounts for 75 percent of total household expenditure andhome production contributes nearly 80 percent. Nationally, food accounts for 62 percent of totalhousehold spending, with self production contributing more than 60 percent. The poor – includingboth the food-poor and the undernourished – are largely rural people who depend on agriculture. Farmhouseholds have the highest incidence of poverty (52.4 percent) of all occupations. Food securityissues are thus related to low farm productivity. Therefore government food security targets for thefarming population are designed to increase productivity and participation in the market.
Government objectives and programmes for the agriculture sector include: (i) achieving foodself-sufficiency; (ii) increasing agricultural exports through cash crop diversification and thecommercialization and processing of livestock and forest products; (iii) stabilizing slash-and-burnagriculture (by land allocation for upland farmers, terracing and supporting alternative agriculturalactivities including agro-forestry and livestock); (iv) irrigation development programme (to increaserural incomes and stabilize food availability by expanding irrigated area in both wet and dry seasonsand improving operation and maintenance); (v) agriculture and forestry research programme (toconduct study and surveys of agriculture and forest land and water researches, rehabilitate researchstations; cooperate with international research institutions to develop new technology); (vi) humanresources development programme (upgrade technical and political skills of staff, agriculturalvocational school).
Government’s sectoral strategic vision
The six programmes of the Ministry of Agriculture and Forestry (MAF) named above relate to seventhemes of this sector's strategic vision, beginning with an overview of the dual economies of LaoPDR, e.g. the flat lands along the Mekong corridor and sloping lands. The thematic approaches are:MAF planning and decentralization; human resources development; business regulatory adjustment;external trade; flat land transformation; sustainable sloping land development and environmentalmanagement/shifting cultivation stabilization; and irrigation.

Investment in land and water in the Lao PDR…246
The planning approach: MAF planning decentralization
Policies: area-based integrated agricultural development to better respond to "focal site" ruraldevelopment; fully decentralized "bottom up" participatory planning within the governmental system;indicative planning based on comparative advantage and rural socio-economic indicators; integratedarea-based natural resource management centred on watersheds/river basins (at national and regionallevels); local government management of funds, projects and integrated development resources; andfully decentralized "bottom-up" participatory planning with the governmental system.
Strategies: implementation through flatland and sloping land programmes to adjust fordifferent agro-ecological concerns using area-based planning; flatland and sloping land programmesare of equal importance, planned and developed in parallel to allow for upstream and downstreamlinkages and interactions. Flatland priority is on maintaining the pace of market driven-growthassisted by supportive regulatory systems in parallel with consolidation food security and acceleratingthe pace of cash crop diversification and intensified livestock and aquaculture development for thelocal market and for export growth; emphasis in sloping land areas accords high priority to area-baseddevelopment centred on integrated watersheds/river basins. Primary goals: to achieve stabilization ofshifting cultivation and sedentarization of sloping land land-use systems with parallel emphases onsupporting infrastructure, e.g. roads and tracks, small-scale irrigation and markets and service centres,followed by livestock and fisheries, forestry, annual and perennial improvement, soil fertility andwater and nutrient management and natural resource management; provincial governments continueto plan and implement development in a fully integrated manner; farmer-demand driven appliedresearch and extension; and rotational cycles of farming system.
Human resources development
Policies: MAF to become a farmer service organization in a market economy; district and DistrictAgriculture and Forestry Office (DAFO) are primary links in MAF 'chain' because of interactionswith villages/farmers; farmer demand driven adaptive research and extension, problem solving;technical support in applied research, extension and natural resource management provided by newNAFRI, AEA, at central levels; new department of planning and M&E to provide focus of integratedfarming systems development.
Strategies: reorganizing DAFO staff as mobile farming systems extension workers (FSEW);reorganizing PAFS as subject matter specialists to support FSEW; transfer redundant and excess stafffrom flatland areas to sloping land areas; NAFRI, AEA, DOP and DME to provide central focus ofintegrated farming systems and natural resource management development; form a participatoryapplied research/extension synergy by strengthening linkages among public and private sector alongthe lines of successful transformation models (see Table 5).
Business regulatory adjustment
Policies: commitment to market agricultural transformation under "umbrella" of improved regulatorysystem as tangibly demonstrated by agricultural development progress in the Mekong corridor;support for short to medium-term regulatory revision to bring supportive regulations; and support forparallelism of business regulatory revision among partners.
Strategies: review and revise existing regulations over the short to medium term to adjust toprevailing economic environment; and review and coordinate regulatory reform measures with LaoPDR regional trading partners.

…Investment in land and water 247
External trade
Policies: full support for trade liberalization and regional economic integration with minimal controlson export/import in concert with tangible trade liberalization measures by regional trading partners;and gradual formalizing of informal cross border flows.
Strategies: closely monitor tangible progress of regional trading partners inreducing/removing import/export permits and licenses and eliminating effective quantitative controlover imports through licensing; move toward trade liberalization in concert with parallel moves byregional trading partners; operate, in concert with regional trading partners, to move many agriculturalproducts and inputs to the AFTA inclusion list
Flatland transformation
Policies: maintain pace of Mekong corridor market-driven changes; ensure food security andaccelerate the process of cash crop diversification and intensified livestock and aquaculturedevelopment for the local market and for export growth.
Strategies: development centred on rehabilitating and expanding irrigation schemes,strengthened local and community-based management of irrigation systems, improved agriculturaland farming systems, increased and intensified cash crops, livestock and fisheries production.Increased investments in improving post-harvest technology and establishment of value-added smalland medium processing enterprises.
More specific strategies include: increased and intensified irrigated dry season agriculturaldevelopment in Mekong corridor with participatory, community management of systems; agriculturaland farming systems research, with special consideration to environmentally friendly practices (e.g.IPM and organic fertilizer use); prioritizing adaptive research, trials and demonstrations; ratingappropriate and more integrated technologies suitable for specific flatland environments; testing andintroducing new plant/animal species; technology testing and extension of forage production andpasture systems; technology testing and extension of improved aquaculture systems; FSEW/SMSformation and training for bottom-up farmer demand-driven extension; gradual formalizing ofinformal trade channels in concert with liberalization of border trade with regional trading partners;streamline licensing procedures for agribusiness; continue to let market forces operate under the“umbrella” of improved regulatory system; market-determined interest and competitive environmentfor rural credit mechanisms; establish public sector market information channels; and set productgrades and standards.
Sustainable slopeland development and environmental management/shifting cultivation stabilization
Policies: shift to an area-based and decentralized on integrated watershed/river basins; rural povertyalleviation; shifting cultivation stabilization.
Strategies: expand and strengthen government and MAF multi-sectoral approach to achievesedentarization of slopeland agricultural communities and tenure through participatory planning; land-use zoning based on biophysical (e.g. slope and land capability) and socio-economic parameters;participatory land allocation and land-use occupancy entitlement; promotion of communitymanagement of natural resources; farming systems diversification and agro-forestry developmentthrough adaptive research, trials and demonstration on farmer’s fields; expansion of communitymanaged irrigation systems; farmer demand driven extension; sustainable land use management withsoil erosion control, afforestation, and conservation management; rural savings mobilization andcredit extension; rural finance development based on market determined interest rates and open

Investment in land and water in the Lao PDR…248
competition (generally) among private and public sector rural finance mechanisms with somespecialized subsidized lending activities (specific cases) to accelerate and cushion the risks of farmingsystems diversification among poorest social strata; upgrade capacity and legal framework of SOCBsin commercial and banking transactions; opening community market access through feeder roadupgrading and expansion and market information delivery.
Irrigation
Policies: allocation and provision of water, on a sustainable basis, for agro-forestry systems (insloping lands) and for existing and new agricultural areas (in flatland areas); diversification of waterresources for irrigation and management for sustainable utilization; improve water resourceproductivity, marginal values; improve maintenance of irrigation systems and strengthen O&M;maintain watersheds and mitigate environmental degradation; alleviate rural poverty; and acceleratecash crop production for exports and import substitution.
Strategies: continue to focus investment on most economical viable schemes, consolidate andexpand irrigated areas; continue to strengthen community participation and initiative in projectplanning work and maintenance; encourage beneficiary financing in development and O&M ofirrigation systems; strengthen farmer driven extension focus on cash crops, marketing and improvingmarket access; target irrigation development on reservoir and systems; transfer ownership andmanagement of schemes to beneficiaries through local WUAs. Empower water user associations atscheme level to set and collect irrigation O&M Irrigation Service Fees (ISF) commensurate withactual individual scheme characteristics, real scheme O&M costs and with beneficiary capacity to paybased on their gross margins from farming operations.
Master plan for integrated agricultural development
Master plan objectives are to formulate an action plan and an implementation programme thatcontributes to more effective agricultural development promotion, based on the Strategic Visionframework as the Lao PDR agricultural development strategy and Vision 2020 as basic developmentpolicy; and identify priority programmes and projects.
"Towards the Year 2020", an integrated agricultural development action plan, aims at tensubsectors: land and water resource development; institution and organization; human resourcedevelopment; field crop; livestock and fisheries; stabilizing shifting cultivation; marketing andagroprocessing; rural finance; rural development; and irrigation.
LAND RESOURCE DEVELOPMENT
Land area and resources
The Lao PDR covers an area of 23.68 million ha of which forests occupy 45 to 47 percent, potentialforests and other wooded areas (including recovering shifting cultivation areas of about 2 million ha):41 percent, permanent and temporary arable agriculture, 8 percent, grass and pasture land 4 percentand the remaining areas 2 percent. Comparative estimated land use in three time periods is given inTable 1.

…Investment in land and water 249
Land suitability
There is considerable information on the soils and land condition. The Soil Survey and LandClassification Center (SSLCC) of the National Agricultural and Forestry Institute (NAFRI) isresponsible for soil surveys as well as agricultural and forest land classification, research on themanagement of agricultural land and fertilizer application. Soil maps and land suitability maps havebeen produced for the main agricultural areas and for the remaining areas data are now beingproduced.
TABLE 1Land use for 1982 and 1989, with estimates for 2000
Land use groups/land/use & vegetation types Area (000 ha)
YEAR 1982 1989 2000
Forest 11 636.8 11 167.7 10 700Dry dipteropcarp 1 235.1 1 206.5 1 155Lower dry evergreen 88.6 85.5 82Lower mixed deciduous 893.0 866.0 830Upper dry evergreen 1 105.9 1 061.0 1 017Upper mixed deciduous 7 492.4 7 448.4 7 136Gallery forest 90.7 87.5 84Coniferous 138.3 132.3 127Mixed coniferous/broadleaves 293.2 280.5 269Potential forest 7 956.7 8 323.3 8 530Bamboo 1 457.0 1 531.9 1 260Poorly stocked, including recovering shifting cultivation areas 6 499.7 6 791.4 7 270Other wooded areas 1 545.4 1 444.4 1 300Savannah/open woodlands 974.0 912.5 820Heath & scrub forest 571.6 531.7 480Arable Agriculture 1 306.1 1 475.1 1 810Sedentary agriculture 708.7 849.5 1 130Shifting cultivation & other upland systems 597.4 625.6 680Grasslands 804.4 822.8 860Other land areas 430.6 446.7 480Barren land/rock 109.9 116.1 116Urban 82.2 84.2 113Swamps 34.1 35.4 35Water 204.4 210.9 216TOTAL 23 680.0 23 680.0 23 680Land use groups/use & vegetation typesPopulation (000) 3 346 3 977 5 234Forest land per person (ha) 3.48 2.81 2.04Potential forest & other wooded area per person (ha) 2.83 2.46 1.88Arable agricultural & per person (ha) 0.39 0.37 0.35
Source: DOF 1992. Forest cover and land use in Lao PDR. Report No.5 1992. MOAF. NAFRI 2000.

Investment in land and water in the Lao PDR…250
To conserve and sustainable manage the land and soil, it is important to have information onslope, elevation, soil and existing land use. Knowing these factors, land use planning can beundertaken and an orderly switch from one from of land use to another appropriate form can occur.Information exists on slope, topography and altitude classes as well as existing land uses. Table 2gives data on land use by sloping classes. This is taken from a nationwide reconnaissance survey ofland use in Laos in 1989 with estimates for 2000. Information on slopes will not change over time,only on the land use.
Nearly all permanent agricultural land is in areas having slopes less than 5 percent, whereas70 percent of shifting cultivation land and other upland farming is on slopes greater than 20 percent.This is a main reason why government is trying to stabilize shifting cultivation by 2010 and todemonstrate more sustainable land-use alternatives. Also, in many upland areas, the soil is unsuitablefor annual crops. Land with a slope greater than 20 percent should not be farmed without measures tocounter erosion, such as contour ploughing, strips of grass and/or trees along the contours atappropriate intervals, as well as terracing.
Sustainable use of forest and natural resources
The sustainable development of natural resources is not only national importance, but it is alsosignificant from a regional and global perspective. Laos is rich in bio-diversity and has considerableareas of pristine forest: these are important globally. The forests are a source of much timber andmany non-timber forest products, including wild animals and aquatic mammals. Such wildlife isimportant to rural communities for both subsistence and income generation. The forests are alsoimportant cattle grazing areas. There are 64 watersheds: 55 river systems contribute 35 percent of thewater to the lower Mekong River system – while the remaining nine flow directly into Viet Nam onthe northeastern border. Protecting these watersheds is of regional as well as national importance,particularly for lowland agriculture and fishing. Many watersheds are rich in biodiversity. Thegovernment recognizes their global importance and created 20 National Biodiversity ConservationAreas (NBCAs) and two corridors connecting three of these areas covering 3.4 million ha. Thesecontain rare and newly discovered plants and animals and are the last remnants of large areas ofunique forest types. Most NBCAs have populations living in them practicing shifting cultivation.Stabilization of this land-use system is, therefore, of paramount importance.
Over the past 20 years thousands of hectares of forest have been cleared and some wetlandsdrained for agricultural expansion. Some of this land was unsuitable for agriculture or should havebeen maintained in its original state. Thus, considerable pressure is being placed on natural resourcesand forestland to meet the increasing needs of and expanding population and to satisfy thegovernment policy of improving living standards. The major objective of government is to properlymanage both renewable and non-renewable natural resources so as to help meet their goals. However,especially in the agricultural sector, this has to be done in a sustainable and environmentally friendlyway. Having a large forest area and a relatively low population density there is a considerablequantity of wood available to the population
Trees and their importance to farmers
Trees and forests are important components of the farming system and are essential for shiftingcultivation. They supply fuel, building materials, food, fibre, medicines and many other NTFPs. Theyalso contribute the bulk of grazing and browse to farm animals and are a significant source of non-farm income for rural people. While forest trees supply most of the products that farmers require, treesoutside the forest, especially trees on farm are becoming more important especially as a way togenerate income and as an input to sustainable agricultural development. Most arable and pastoralfarming systems have trees as an integral component, the exception being lowland paddy production.

…Investment in land and water 251
But even here, farmers plant tree/bamboo in some areas to at least provide shade, but usually toprovide food, fibre and fuel.
TABLE 2Lao PDR 2000: Estimated land use by slope and classification
Slope classes (%)Land use
0-5 6-19 20-30 31-59 60
Total Area
(ha)
Forest 2.35 462 3 731 3 030 962 10 700
Degraded forest, bamboo &other wooded area
1 548 593 4 046 2955 688 9 830
Shifting cultivation, otherupland and fallow areas
139 56 313 138 25 680
Permanent agriculture 1 100 26 4 0 0 1 130
Grassland 126 27 332 297 78 860
Other land 319 29 47 38 47 480
Total 5 567 1 382 8 473 6 458 1 800 23 680
Percentage 24% 6% 36% 27% 7% 100%
Note: A slope of 100 percent is equivalent to 45 degrees.Source: Nationwide Reconnaissance Survey: Report 5, 1992.MAF (DoF), modified to 2000 land use data.
Through the Shifting Cultivation/Agroforestry Research programme, the NTFP project, theEU micro-projects, the Lao-Swedish Forest programme and several other private and publicinitiatives, planting trees on farms has increased. Agroforestry initiatives, NTFPs and planting trees,bamboo and bushes for food, fruit, nuts, raw silk, paper bark, poles and timber are gainingmomentum, especially where there is a developed market for these products.
Forest rules and regulations
On the one hand government and donors are encouraging tree planting. In the Forest Laws (Article34: Promotion of Tree Planting), tree planting is promoted through various incentives, subsidies andregulations, including credit and tax incentives and the provision of planting material usually fromimproved stock. There is also an annual National Tree Planting Day June 1st when the population atlarge is encouraged to plant trees (Article 46, Forest Laws). Article 47 of the Forest Law specifiesestablishment of a forest and forest resource development fund to promote tree planting, among otherthings. However, to date the fund has only been established: through the Lao/ADB PlantationProgramme, money can be borrowed to invest in planting.

Investment in land and water in the Lao PDR…252
Assessment of agriculture potential
Agriculture potential is assessed in terms of lowland rice, upland crops, tree crops and grazing lands.The assessment was done using existing digital data on forest cover and land use, soil, climaticcondition, topographic condition, and unexploded ordnance (UXO). The extent of agriculturepotential area for each crop group and grazing land is seen in Boxes 1 and 2. This data shows that thetotal potential area for annual and perennial crops is some 3.1 million ha compared to 1.0 million haof existing cultivated area.
WATER RESOURCES DEVELOPMENT
Introduction
The rivers of the Lao PDR contribute about 35 percent of total water volume to the lower Mekongriver system. Protecting these watersheds is therefore of regional as well as of national importance,particularly for lowland agriculture and fisheries. During the past 20 years thousands of hectares offorest have been cleared for agricultural expansion. Considerable pressure is thus placed on naturalresources and forests to meet the increasing needs of an expanding population and to satisfygovernmental policy of improving living standards. Therefore, emphasis will be placed on ensuringproper land use planning and sufficient land allocation for all rural people; protecting catchment areasto reduce erosion and ensuring a more even flow of water.
BOX 1Assessment of agricultural potential (%)
Potential area for crops 3 120 000 ha 13.2
Potential area for grazing land 1 093 000 ha 4 6
Less agriculture potential area 19 467 000 ha 82.2
Total 23 680 000 ha 100.0
BOX 2Extent of UXO risk areas (%)
….. High 630 000 ha 2.7 Probable 3 260 000 ha 13.8 Minimal 19 790 000 ha 83.6 Total 23 680 000 ha 100.0

…Investment in land and water 253
Surface water
The main rivers of the Lao PDR consist of the primary and secondary tributaries of the MekongRiver. There are about 39 main tributaries in the Mekong River basin. There are ten main rivers withcatchment areas exceeding 5 000 km2: the Nam Tha, Nam Ou, Nam Xuang, Nam Khan, Nam Ngum,Nam Kading, Xe Banfai, Xe Bang Hiang, Xe Done and the Xe Kong rivers. The total watershed areaof the main tributaries is estimated at about 183 000 km2.
On the other hand, only two main rivers, namely the Nam Ma and the Nam Ka are locatedoutside the Mekong River Basin. They expand into the eastern areas of Houaphan and Xieng Khuangprovinces and flow directly into Viet Nam. Their total watershed is approximately 15 000 km2. TheNam Ngum River has a large dam and reservoir in Vientiane province. Its total storage capacity is7 billion m3 and its surface water area attains 370 km2 during the rainy season.
Monthly rainfall is estimated at each rain gauge station. Based on statistical analysis of thecollected data monthly rainfall ranges widely from 1 240 mm to 3 770 mm overall. Total annualrunoff of main rivers is estimated at 229.9 billion m3 in an ordinary hydrological year, Annual runoffof the main Mekong River tributaries is estimated at 214 billion m3 accounting for 93 percent of thetotal annual runoff. Annual runoff greater than 1 billion m3 are identified in larger Mekong Rivertributaries such as the Nam Ngum, the Nam Kading, Xe BangHiang and Xe Kong. The annual runoffof rivers flowing directly into Viet Nam is estimated at 7.185 billion m3 for the Nam Ma River and8.196 billion m3 for the Nam Ka River.
Groundwater
The only hydrogeologic information currently available for the Lao PDR overall is the PreliminaryAppraisal of the Hydrogeology of the Lower Mekong Basin published by the Interim MekongCommittee in 1986. It shows that the Lao PDR is divided into two geological areas, the Annamianstrata occupying most northern and eastern regions and the Indosinian sediments, mainly along theMekong River. The Annamian region includes granites, metamorphics and palaeozoics. TheIndosinian region consists of sandstones, siltstones, shales, mudstones, limestones, conglomerates andbasalt.
There are three different aquifer systems. The Annamian aquifers occur at random. They arelocal systems that discharge locally into the river or its tributaries. As local flow systems, they are notpart of regional flow systems and will not carry pollution into the regional groundwater system.Potential water supply from groundwater in northern Lao is considerable in view of the high amountof recharge available. Water quality should be reasonably good and for the most part potable butwater will be iron rich. Yields up to 5 litres/sec can generally be anticipated.
The Indosinian group of aquifers, which have regional flow, includes rock strata of theIndosinian Moyennes and Superieures and is relatively young. They are mostly freshwater sediments,although three are horizons of brackish water, and one major zone of saline water yields of 12 to 24litres/sec can be developed. Alluvial aquifers associated with Mekong River sedimentary deposits arenot rated highly as aquifers.
Limestones in the central region are strictly Annamian in age, but their location places themlogically in the Indosinian flow system. It has been described as having enormous groundwaterresources. No notable investigation and study on the groundwater appears to have been conducted inthe Lao PDR. In the early 1990s, the Mekong Secretariat conducted a project ‘Review ofGroundwater Data in the Lower Mekong Basin’ and installed 18 observation wells: ten were installed

Investment in land and water in the Lao PDR…254
in the Vientiane plain and the rest along the Mekong River. The observation revealed the interestingfact that the Mekong River has very little influence on aquifers in the Vientiane plain.
TABLE 3 Development policies related to water & water resources
Sector Development Policy
HydropowerReduce imported fuel
Support rural development & reduce regional power imbalanceEncourage private investment in hydropower developmentEarn foreign exchange for socio-economic development
Minimize environmental impacts &Develop watershed management
IrrigationAchieve food self-sufficiency, increase commodity production, reduce shifting cultivation
Involve all stakeholders in irrigation development & managementCoordinate irrigation schemes with other means of increased agricultural production
Protect against flood damage
NavigationMaintain current transport capability by river
Improve navigation aids & information for safety travelEncourage use of river transport in wet season instead of poor roads
Protect riverbanks from erosion
FisheriesCollect information on the extent an nature of capture fisheries
Develop infrastructure & human resources in fisheries managementPromote development of aquaculture & regulate fishing activities
Urban water supply& water disposal
Increase amenities in urban areas by providing affordable & quality servicesin commercial water supply & sanitation
Rural water supplyImprove water supply & environmental health in rural areas
Focus on inaccessible, poverty-ridden areasEncourage private water supply & sanitation ventures in easy-to-reach areas
Groundwater will be further developed as the main source of urban and rural water supplyand small-scale irrigation in lowland areas far from surface water resources, such as southern andwestern Champassak province and the hinterlands of the Sebang Fai, Sebang Hieng and Sedone rivervalleys.
…Investment in land and water 255
Water quality
Monitoring of water quality on the Mekong River and its tributaries is the responsibility of the waterquality laboratory of the Department of Irrigation in the Ministry of Agriculture and Forestry (MAF).Monitoring began in 1985. At present there are 34 monitoring stations in operation: four on theMekong and 15 on nine major tributaries. The remaining ten stations are at various locationspotentially exposed to water quality degradation downstream of existing reservoirs and the ThatLuang wetland in Vientiane municipality. Water samples are usually collected monthly for chemicaland biological analysis.
In general the water quality of rivers within the Lao PDR and the Mekong is considered goodrelative to global environment monitoring standards: the level of oxygen is high and the nutrientconcentration is low. Sediment loads in the tributaries vary considerably from 41 tonnes/km2/year to345 tonnes/km2/year. High levels of suspended sediment occur during the rainy season. Tributariesand river reaches with high sedimentation are the Sebang Hieng, Sedone, Nam Ou and the upper andlower stretches of the Mekong river.
The water and water resources law
The Water and Water Resources Law of 1996 defines principles, rules and measures in theadministration, use and development of water and water resources. The law has 10 provisions and 49articles focusing on the protection of water resources and watersheds, water resources planning andprevention of water pollution. Ministries active in water resources have been instructed to formulateministerial regulations to reflect the intent of the law.
In setting the legal framework for water and water resources, government established theWater Resources Coordination Committee (WRCC) in April 1998 as a national apex body to improvecoordination of multi-sectoral activities involving water use and to define and manage waterallocations. The Asian Development Bank (ADB) provided the government with technical assistancein 1997-1998 to institutionally strengthen the WRCC. The vice-chairperson of STEA is the WRCCchairperson and representatives of seven organizations nominated by the Prime Minister’s office. TheMinister of Agriculture and Forests is WRCC vice-chair, Ministry of the Interior, MCTPC, Ministryof Public Health, Ministry of Justice, Lao National Mekong Committee (LNMC) and STEA. TheWRCC has its own secretariat within STEA.
Water resources policy
There has been no clear overall water sector policy in the Lao PDR, but it could be gradually set upby augmenting and adjusting individual policies of water related sectors with the WRCCestablishment. Government is further developing the legal and regulatory framework for water andwater resources and for preservation of the environment to reduce conflicts between the sectorscaused by development. The water-related sectors are hydropower, irrigation, navigation, fisheries,urban water supply and waste disposal, and rural water supply. The respective sector developmentpolicies related to water and water resources are briefly summarized below.

Investment in land and water in the Lao PDR…256
TABLE 4Proposed programmes and projects for land and water resource development
Project/Programme
Objective Component
Strengthening LUP& LA & land titling inrural area
Strengthen existing LUP/LA systemthrough synthesis of macro-levelplanning based on nationaldevelopment goals micro-levelplanning based on local areadevelopment needs
Improve monitoring & evaluation(M&E) of LUP/LA to encouragevillage management of agricultural,forestry & other resources
Develop LUP/LA information storageprocedure to facilitate future landtitling & registration
Networking of relevant governmentagencies in LUP/LA
Development of National ImplementationPlan based on criteria for prioritization
Follow-up activities for LUP/LA villages Extension of field tested methodologies Implementation of training programme for
national, provincial & district staff Refining M&E procedure Information storage system development
T/A on NationwideShared WaterResourcesManagement
Develop water use & distribution planfor agriculture, urban, industry &power sectors
Monitor quality & quantity of water fordifferent end-users
Establish optimum water use amongaffected sectors.
Establish adequate environmentallysustainable water resources developmentplans
Provide adequate water & soil testingequipment & methodologies
WatershedManagementProgramme
Sustain water resources for waterrelated social & economic activities:hydropower, irrigation & fisheries
Protect people & their properties &lands from floods & soil erosion
Maintain sustainable agriculturalproduction in all areas
Establish procedures for integratedwatershed management by development& implementation of watershedmanagement plans where water projectshave been developed or are planned
Provide adequate water & soil testingequipment & methodologies
Agro ZoneClassification, LandManagement &Farming SystemDevelopment
Develop agro-zone classificationmaps
Assist land use planning & croppingpattern
Use remote sensing to help with landclassification & land use.
Expand land classification & cropsuitability maps
Establish feedback system for groundtruthing to upgrade GIS data.
Reconcile GIS & agriculture census data. Develop agro-zone classification maps
Soil & WaterConservationTechnologyResearchProgramme
Develop appropriate technologies forsoil & water management.
Review completed & ongoing projectsconcerned with soil conservation
Develop a soil technical support system
Irrigation WaterManagementResearchProgramme
Develop appropriate technologies forirrigation water management
Develop irrigation water managementsystem for lowland & upland crops.
Research effective participatory irrigationwater management.
Provide technical staff training (on job &in-country research courses).
Rehabilitation &Expansion of Meteo-hydrology Stationsfor Agricultural
Strengthen weather forecast foragriculture development, increasefood crop production & floodforecasting to mitigate agriculturaldamage
Rehabilate hydrometerogical stationsincluding agro-meteorology stations &renewal of instrument/equipment.
Build new hydrometereologal stationsincluding agro-meteorological station.

…Investment in land and water 257
Development &Flood Control
Provide modernized communicationequipment
Provide computer LAN system to upgradecollection-transferring-compilation-filing &analysis
Improve weather & flood forecasting Build facilities to calibrate hydrological
instrumentst & equipment test lab Institutional Improvement of operations &
management Train DMH & Provincial Meteo-hydrology
Office staff in participatory survey,planning, supervision of construction &overseas training
Prepare educational programme for DMH& Provincial Hydromet Office
Support STEA forEnvironmentalFriendly AgricultureDevelopment
Implement community basedresource & land management groups
Improved environmental datacollection
Assist formulating environmentalimpact regulations for agriculture,forestry & fisheries to supportprovincial environmental initiatives
Promote community group formation Establish participatory data collection &
analysis system Enhance reporting arrangements to STEA
& agro-service industries.
StrengtheningWeather ForecastSystem forAgriculture &Disaster Operation
Secure agricultural production &mitigate disaster damage
Build weather surveillance radar stationsin northern & southern regions for realtime tracking of tropic storms
Construction of upper-air stations inVientiane
Upgrade weather & flood forecastingsystems
Install telecommunication system &establish network system
Institutional improvement of operation &management
Educational upgrading programme forDMH & provincial meteo-hydrologicalservice office
Irrigation development
Background
The history of Lao irrigation can be traced back several centuries in the northern mountains. Theseirrigation systems are based on primitive water intake made by logs, soil and/or stone, and have beenmanaged well by communities. From the 1960s, modern irrigation systems with concrete weirs andwell-designed canals have been built with technical and financial assistance from foreign donors. Laoirrigation is classified by region in three types: (i) community managed gravity irrigation in thenorthern mountains (with a range of service area from one to over 300 ha); (ii) pump irrigation in theVientiane plain and (iii) recently introduced pump irrigation along the Mekong River where most ofthe plain is flood-prone.
Current progress of irrigation development
As of 1999/2000 there are 19 170 irrigation schemes with a service area of about 295 000 ha in thewet season and 197 000 ha in the dry season. The irrigation area in dry season has rapidly increasedfrom 29 000 ha in 1996 to 197 000 ha in 2000. Most irrigation schemes are of traditional weir type inthe northern and central regions where the mountains prevail, while pump irrigation is concentrated inthe southern region.

Investment in land and water in the Lao PDR…258
TABLE 5Proposed programmes & projects for irrigation development
Project/Programme Objective Component
CommunityManaged IrrigationSector Project-2(CMISP-2)
Increase agricultural production onsustainable basis
Increase food security & incomes Improve watersheds by reducing
shifting cultivation & promoting treeplanting in northern rural areas thoughIrrigation Management Transfer (IMT)
Select priority project from provinces Mobilize community to project activities Rehabilitate & develop community
managed irrigation schemes Construct rural infrastructure including
rural water supply & district feeder roads. Institutional & financial support including
setting up village development Support income generating activities
DecentralizedIrrigationDevelopment &ManagementProject (DIDMP)ADB & Francefinanced)
Facilitate full transfer of irrigationschemes to farmers as pilotschemes
Assist users though WUA to organize/joinin irrigation systems rehabilitation & O&M
Provide appropriate extension services Rehabilitate existing schemes in
cooperation with WUA Provide PAFS/DAFO capacity building Provide gender initiatives in development
programmes Support VDF processor cost recovery
AgricultureDevelopmentProject (ADB) (WBfinanced )
Enhance agricultural productivity &encourage crop diversification &thereby increase overall agriculturalproduction
Target small & low incomesubsistence farmer, to improvesmallholder food security & increaserural incomes in sustainable manner
Rehabilitate irrigation facilities Construct & rehabilitate village access
tract Construct village water supply facilities Establish Village Investment Funds (VIF) Enhance agricultural services for
institutional strengthening Project implementation support
TA on AcceleratedIMT
Establish a data base on existingirrigation schemes
Establish a data base on potentialcommunity managed irrigationschemes
Provide the necessary information &recommendation for accelerating &supporting irrigation
Management transfer ( IMT) process
inventory of existing irrigation schemescovering natural & human resourcesconditions, constraints & needs forimprovement in agricultural production,irrigation area facility condition need &costs & other necessary information
Inventory potential community managedirrigation schemes for natural & humanresources conditions, agriculture
Review & recommend schemas formanagement system including improvedO&M, WUA capacity building, education& training of WUA members, IMT process& VDF management
Prioritize existing schemes forrehabilitated, improved & potentialschemes to be developed, prepared forshort-medium-long term implementation
CommunityManaged Small-scale IrrigationProject
Increase agricultural productivitythough crop diversification & increaseoverall agricultural production onsustainable basis
Increase food security & income Improve watersheds by reducing
shifting cultivation & management inmountain areas
Assist users though WUAs to organize toparticipate in rehabilitation or newconstruction & irrigation system O&M
Provide appropriate extension service Rehabilitate existing schemes in
cooperation with WUA Construct new irrigation schemes on a
community participation basis. Implement IMT Provide capacity enhancement to PAFSs
& DAFOs Provide systematic gender initiative in
development programme Support VDF process for cost recovery

…Investment in land and water 259
TA of WaterResourcesDevelopment inNorthern & CentralRegion
Provide technical solutions &investment processes to stabilizerural agriculture & other sectors innorthern & central regions, ensuringsufficient food in some areas &surpluses in others
Study irrigation & domestic waterresources, flood control, & environmentin northern & central regions
Prioritize projects & prepareimplementation schedule
TAs for BestIrrigation Use ofExploited WaterResources forDiversifiedAgricultureDevelopmentProject
Increase agricultural productivity,encourage crop diversification &thereby increase overall agriculturalproduction on a sustainable basis.
Increase food security & incomesthough intensive farming systems
Development study on medium & largescale irrigation schemes in cooperationwith communities though best utilizationof exploited/exploitable water resourcedevelopment projects such ashydropower, water supply, flood control
Study providing, building flood protectionfacilities for sustainable use of flood-prone areas
Review & recommend managementsystems including improved O&M, WUAcapacity building, education & training ofWUA members, IMT process & VDFmanagement
Study providing appropriate extensionservices
Study PAFS/DAFO capacity building
Best Irrigation Useof Exploited WaterResources forDiversifiedAgricultureDevelopmentProjects
Increase agricultural productivity,encourage crop diversification toincrease overall agriculturalproduction on sustainable basis
Increase food security & incomesthrough intensive farming systems.
Rehabilitation & construction of medium &large scale irrigation schemes incooperation with the community.
Provision & construction of floodprotection facilities for sustainable use offlood-prone sera
Rehabilitate existing schemes incooperation with WUA
Implement IMT Provide appropriate extension services Provide PAFS/DAFO capacity building Support gender initiatives Support VDF management for
sustainable project management.
GroundwaterIrrigationDevelopment &Management
Promote high value commodity cropsby best use of groundwaterresources
Investigae groundwater potential Provide pilot groundwater irrigation
schemes Extend groundwater irrigation schemes
link to rural development programmes
TechnicalCooperation forUpland CropIrrigationEngineering Center
To extend research institutions toupland irrigated crops
Construction of an upland crops irrigationengineering center & pilot areas
Provide necessary data & research fordevelopment of upland crop farming.
Establish training curricula to trainconcerned staff & farmers
Flood DisasterMitigation
Secure agricultural production &properties at flood-prone areas alongMekong River tributaries in wetseason flooding
Detail assessment of damaged area bywet season flooding
Selecting priority areas Planning flood mitigation measures such
as flood protection dykes, flood controlgates, drainage pumps & otherconceivable effective measures
Rehabilitation & upgrading of floodprotection facilities
Rehabilitation & upgrading of existingriver observatory system

Investment in land and water in the Lao PDR…260
An on-going major irrigation scheme is the Community Managed Irrigation Sector Project(CMISP) funded by ADB and OPEC. CMISP aims to improve more than 40 existing irrigationschemes in the central and northern regions. The communities are responsible for managing theimproved facilities by organizing water user associations (WUAs). CMISP is expected to continue theproject on a phased basis. Two similar schemes are to start in 2001: the Decentralized IrrigationDevelopment and Management Sector Project (DIDMP) funded by ADB and France and theAgricultural Development Project (ADP) funded by the World Bank (WB). DIDMP is characterizedas a pilot project exercising the IMP process, focusing on pump irrigation schemes in six selectedprovinces. ADP, covering four southern provinces, is really a rural development project including notonly improvement of irrigation systems but also market oriented community development usingvillage investment funds.
Irrigation management transfer (IMT)
Knowing that traditional irrigation systems have been efficiently managed by farmers’ communitiesand also as from economic necessity the government must reduce agricultural sector subsidies, it setup a policy to transfer ownership and associated costs of irrigation to farmer users. Encouraged by theSIRAP experience, the government issued Prime Minister’s Order No. 26/PM on transferringirrigation projects to community organizations (1998). The purposes of the decree are to: promote andsupport the role and responsibility of WUAs in the management of irrigation systems; assist in thereduction of the responsibilities of government agencies in the routine management of irrigationsystems; ensure the smooth transition of the full transfer of ownership of all irrigation infrastructure toWUAs; and improve the efficiency of operations, management and water distribution on all irrigationsystems.

…Investment in land and water 261
Water development forirrigated agriculture in Pakistan:
past trends, returns and future requirements
AVAILABLE WATER RESOURCES
Precipitation
Incident precipitation and river flows are the two major sources of surface water used to meet therequirements of agriculture and other sectors. Mean annual rainfall in Pakistan varies from less than100 mm in Balochistan and parts of Sindh provinces to over 1 500 mm in the foothills and northernmountains. About 60 percent is received during the July to September monsoon. Most summer rainsare not available for crop production because of rapid runoff during torrential showers. Thecontribution of rainwater to crops in the Indus Basin Irrigation System (IBIS) is about 16.5 billion m3,some 10 percent of the mean annual river flow (Ahmad, 1993a).
The current drought was so severe that snowfall during the 2000-2001 winter season wassignificantly less than in normal years. Snow records are not available prior to 1999, but it is expectedthat snowfall might be less than the historical minimum or very close to that. Thus snowmelt availableduring the coming Kharif season will be much less than the mean flows.
Surface water resourcesPre-storage resources
Glacier melt, snowmelt, rainfall and runoff constitute the river flows. Inflow measurement facilitieshave been established at the rim of the Indus River tributaries and are thus referred to as rim stationinflows. The rim stations for the western rivers are located at Tarbela, Attock, Mangla and Marala forthe Indus, Kabul, Jhelum and Chenab rivers, respectively. The rim stations for the eastern rivers arelocated at Balloki and Sulaimanki for the Ravi and Sutlej rivers.
River flows are limited in the Rabi season because of limited glacier- and snowmelt and lowrainfall during in the winter season. Western rivers provided 173 billion m3 surface water in anaverage year during the pre-storage period of 1937 to 1967. The bulk of the river flow was during theKharif season, with more than five times the flow of the Rabi season. Variability in flows of theeastern rivers was even higher than the western rivers. Before the Mangla and Tarbela storage damswere built, the eastern rivers contributed 26 billion m3 of water to the Indus River system in anaverage year – of which 84 percent was during the Kharif season (Table 1).________________________________________________________________________________
Hafeez Akhtar Randhawa, Federal Secretary…Ministry of Food, Agriculture and Livestock, Pakistan…
________________________________________________________________________________

Investment in land and water in Pakistan…262
The contribution of the eastern rivers to the annual total inflow of the Indus River system was 13percent, and 11 percent during the Rabi season – a significant contribution (as seen in Table 1).
Post-storage resources
Seasonal and annual river flows in the Indus river system are highly variable (Warsi, 1991; Kijine andVander Velde 1992; Ahmad, 1993a; Mohtadullah, Rerman and Munir 1991). Analysis of daily andmonthly flows indicated a similar trend (Bhatti, 1999). This variability restricts the assessment of the realcontribution of storage in regulating flows of the river system; however, data were analyzed to evaluatethe effect of key influences on the river flows in both western and eastern rivers.
TABLE 1Variability of rim-station inflows to Indus River system (pre-storage period)
Rim-station Inflows (billion m3) for Pre-storage Period 1937-67
Western Rivers Eastern RiversProbability
(%) Kharif Rabi Annual Kharif Rabi Annual
Total
Minimum 111.0 19.1 134.5 9.6 1.7 11.3 145.8
10 123.9 22.8 143.9 15.6 1.9 17.5 161.4
25 136.2 24.2 163.1 17.9 2.9 22.3 185.4
50 144.5 26.3 173.0 22.1 3.3 26.2 199.2
75 155.3 30.5 184.9 27.4 4.9 35.2 220.1
90 166.8 32.6 198.2 32.2 8.6 38.1 236.3
Maximum 192.7 40.7 231.7 39.3 18.1 44.5 276.2
Data Source: Water Resources Management Directorate, WAPDA.
River flows were limited in the Rabi season because of limited glacier- and snowmelt and lowrainfall in winter. The western rivers provided 162 billion m3 of surface water in an average yearduring the post-storage period, 6.4 percent less than the pre-storage period. The bulk of the river flowwas during the Kharif season, which was five times the flow in the Rabi season. Variability in easternriver flows was even higher than in the western rivers. After the construction of the Mangla andTarbela storage dams, the eastern rivers contributed about 10.7 billion m3 of water to the Indus Riversystem in an average year – 77 percent in the Kharif season (Table 2). The eastern rivers contribute 6percent of annual total inflows – just 5.6 percent in the Rabi season.
Variability in river flows is a major limitation in the development of run-of-river typeirrigated agriculture in the Indus Basin, especially to meet crop irrigation requirement during low flowperiod of the Rabi season and early and late Kharif season.
The recent drought was so severe that annual river flows downstream of the Kotri barrageduring 2000-2001 were expected to be less than the historical minimum of 118.5 billion m3 since1922. This has created a situation of water crises in Pakistan and deepens interprovincial waterconflicts.

…Investment in land and water 263
Flows to the Arabian Sea (downstream of the Kotri barrage)
Annual variability of river flows downstream of the Kotri barrage has been very high. In normal years(50 percent probability), annual flow was reduced from 95.4 to 48.4 billion m3 during pre- and post-Tarbela periods. The percent reduction in annual flows in the dry years (10 percent probability) washigher than during normal years, when flows were reduced from 31.6 to 13.5 billion m3 during pre-and post-Tarbela periods (the probability of a dry year was one in five years in the pre-Tarbelaperiod). The percentage reduction in wet year annual flows (>50 percent probability) was relativelyless than in normal and dry years (see Table 3).
TABLE 2Variability of rim-station inflows to Indus River System (post-storage period)
Rim-Station Inflows (billion m3) for Post-Storage Period 1968-1996
Western Rivers Eastern RiversProbability
(%) Kharif Rabi Annual Kharif Rabi Annual
Total
Minimum 94.0 19.9 114.9 2.3 0.0 3.6 118.5
10 111.6 20.4 135.5 3.7 0.9 5.3 140.8
25 124.2 24.0 153.2 5.1 1.1 7.1 160.3
50 136.0 27.1 162.1 8.2 1.6 10.7 172.8
75 18.5 9.5 80.9 12.7 2.4 15.4 196.3
90 15.7 2.8 89.6 18.5 3.4 20.1 209.7
Maximum 182.0 37.8 206.0 20.4 7.7 23.8 229.8
Data Source: Water Resources Management Directorate, WAPDA.
TABLE 3Flow variability to Arabian Sea (downstream Kotri Barrage), pre- and post-Tarbela periods
Flow Downstream Kotri Barrage (billion m3)
Pre-Tarbela Period (1940-75) Post-Tarbela Period (1975-98)
Probability
(%)
Kharif Rabi Annual Kharif Rabi Annual
Minimum 10.0 0.0 10.0 11.6 0.05 11.9
10% 31.3 0.3 31.6 13.5 0.1 13.5
25% 61.3 2.7 62.3 23.1 0.5 33.2
50% 80.6 7.1 95.4 41.4 1.7 48.4
75% 99.3 13.0 112.5 55.2 4.5 65.3
90% 115.8 20.3 130.8 85.4 6.9 99.5
Maximum 133.8 25.5 159.0 108.9 15.2 113.4
Data Source: Water Resources Management Directorate, WAPDA.
Rabi season flows in normal years (50 percent probability) were reduced from 7.1 to 1.7billion m3 during pre- and post-Tarbela periods, respectively. The effect was more pronounced in dry

Investment in land and water in Pakistan…264
years, where seasonal flows were even less than 0.5 billion m3 in one of every four years. Reductionin seasonal flows was also observed during the wet years (>50 percent probability).
In summary, construction of the Kotri barrage reduced seasonal and annual flows below theKotri due to the canal diversions. Seasonal and annual flows were further reduced during post-Manglaand post-Tarbela periods due to further increases in canal diversions at the Kotri barrage. Canaldiversions at the Kotri barrage were increased from 5.42 to 10.8 billion m3 (a 100 percent increase)during the post-Tarbela period. The probability of dry years was doubled after Tarbela compared tothe pre-Tarbela period – a serious concern for downstream flows to maintain the delta ecosystem. Therecent drought was so severe that annual river flows downstream of the Kotri Barrage in 2000-2001will be less than the historical minimum flows of 10 billion m3 since 1922.
Groundwater resources
Pre-storage resource picture
The Indus Basin represents an extensive groundwater aquifer covering a gross command area of 16.2million ha. The water table was well below the surface and the aquifer was in a state of hydrologicalequilibrium before the development of the canal irrigation system. The recharge to aquifer from riversand rainfall was balanced by outflow and crop evapotranspiration. When the canal irrigation systemwas introduced, percolation to the aquifer increased in irrigated areas of the Indus basin resulting inthe twin menaces of waterlogging and salinity.
Although, there are disadvantages in having a high water table, it was used for irrigation bytubewells in fresh groundwater zones. The groundwater contribution for irrigation was 12 billion m3
in the pre-storage period, 11 percent of the total water available for agriculture.
Post-storage resource picture
Estimated recharge to groundwater in the Indus Basin is 56 billion m3, of which 36 billion m3 occursin areas of usable groundwater (Zuberi and Sufi 1992). The additional conveyance losses in the IBISdue to Tarbela contributed 10 percent to the overall recharge of groundwater (Ahmad 1993b). The1979 WAPDA basin-wide survey indicated that the water table in 42 percent of the Indus Basin wasless than 3 m and was classified as waterlogged, and the water table in 22 percent of the area was lessthan 2 m. In Sindh province about 57 percent of areas where the water table is less than 3 m (Table 4)was affected by waterlogging.
The 1979 basin-wide surveys were actually conducted from 1976 to 1978 and thereforerepresent early post-Tarbela conditions. Although, groundwater use has increased significantly in thelast two decades, waterlogging still affects large tracts of land. About 22 percent of the Indus basincommand area has a water table within 1.5 m. This rising water table indicates a worsening situationbut it cannot be seen solely as a result of the Tarbela and Mangla reservoirs. Mangla/Tarbela-relatedincreased waterlogging could be attributed to the lack of appropriate drainage facilities and inadequateimprovements in irrigation management. The major reason was the failure or transition of SCARPprojects and 10 percent added recharge to groundwater due to additional surface supplies fromTarbela.
Additional water supplies from the Mangla and Tarbela storage dams diverted to the newlyconstructed canal commands also contributed to recharge of groundwater. One example is theChashma Right Bank Canal (CRBC) command area, where a rise in the water table has been observedto create a freshwater aquifer (Alurrade, 1998). However, for sustainability purposes, subsurface

…Investment in land and water 265
drainage has to be provided to control water table depth. In fact the rise in water table was faster thanexpected and required an additional loan to introduce drainage.
TABLE 4Indus plain provincial trends of water table depths and areas affected
Percent Area under Water Table Depth in metresProvince Total Area
(mha) <1 1-2 2-3 >3 Misc.
Total
<3 m
Punjab 10.17 7 11 17 63 2 35
Sindh 5.57 6 24 27 40 3 57
Balochistan 0.35 1 6 9 84 0 16
NWFP 0.62 6 12 6 66 10 24
Total 16.71 7 15 20 55 3 42NOTE: mha=million hectares
WATER QUALITY
Surface water quality
The water of the Indus River and its tributaries is of excellent quality. Total dissolved solids (TDS)range from 60 to 374 ppm, safe for irrigated agriculture, domestic and industrial uses (Bhutta 1999;PWP 1999).
TDS in the upper reaches at various rim stations ranges from 60 ppm during high flow toabout 200 ppm during low flow. Water quality deteriorates downstream but remains well withinpermissible limits, with TDS at Kotri barrage in the lower reaches of the Indus ranging from 150 to374 ppm. However, the TDS of tributaries such as the Gomal River at Khajuri, the Touchi River atTangi Post and the Zhob River at Sharik Weir range from 400 to 1 250 ppm (IWASRI 1997).
Indiscriminate, unplanned disposal of agricultural drainage effluent (polluted with fertilisers,insecticides, pesticides), untreated sewage and industrial waste loaded with heavy metals and othertoxic materials, is flowing into rivers, canals and drains, causing water quality deterioration indownstream waterways and water bodies. In 1995 an estimated 34 billion litres of untreated water wasdischarged daily into rivers, canals, drains and water bodies (Saleemi 1993). It was estimated that 350and 250 million gallons per day (mgd) of raw sewage was produced in Karachi and Lahore,respectively, and that most was discharged untreated into varied waterways (Hussain 1995).Downstream this polluted water is consumed by people and causes numerous water-borne diseases.
At current growth rates, Pakistan's population is estimated to increase from 139 million in1998 to 208 million in the year 2025, an increase of nearly 48 percent (Bhutta 1999). If no remedialmeasures are taken, the quantity of untreated sewage and industrial effluents will grow by at least thesame proportion, further polluting surface waters so vital to meet the needs of human beings, livestockand plants. Pakistan's need to control pollution of surface water and to improve its quality is urgent.

Investment in land and water in Pakistan…266
Groundwater quality
Total annual groundwater potential in Pakistan is estimated at 67.9 billion m3. The annualgroundwater pumpage has increased from 4 billion m3 in 1959 to 59 billion m3 in 1996-1997. About79 percent of the Punjab and 28 percent of Sindh have fresh groundwater suitable for agriculture(Afzal 1999; Bhutta 1999). Since most of the easily exploitable surface water resources have alreadybeen tapped, the future demand of water for agriculture, people and nature will have to be met largelythrough water conservation and further exploitation of already over mined groundwater resources.
Quality of groundwater varies widely, ranging from less than 1 000 ppm to more than 3 000ppm. Some 5.75 million ha are underlain with groundwater having salinity less than 1 000 ppm, 1.84million ha with salinity ranging from 1 000 to 3 000 ppm and 4.28 million ha with salinity more than3 000 ppm.
Although investments in drainage have been significant in Pakistan during the last twodecades, waterlogging still affects large tracts of land (World Bank 1994). Salinity and sodicity alsoconstrain farmers and affect agricultural production. These problems are further exacerbated by theuse of poor quality groundwater (Kijne and Kuper 1995). In fresh groundwater areas, excessivepumping by private tubewells leads to mining of the aquifer (NESPAK 1991) and redistribution of thegroundwater quality (Zuberi and Sufi 1992; WRRI, MONA and IIMI 1999).
Recharge to the freshwater zone due to the additional supplies from Tarbela has contributedsignificantly in maintaining groundwater quality. However, recharge to the brackish groundwaterzone created serious quality concerns for the disposal of the saline effluents despite creating a toplayer of potable water for the concerned population (Ahmad 1993a). This problem was mainly due tothe approach followed for drainage of area under the SCARPs in brackish groundwater zone, wheresaline groundwater (SGW) was pumped from deeper depths (Ahmad 1990).
Mining of groundwater, which is presently occurring in many areas, will cause intrusion ofsaline groundwater into the fresh groundwater areas. In addition, seepage of water from farmland willadd dissolved fertilisers, pesticides and insecticides to groundwater. This will further increasepollution of groundwater and deteriorate its quality. The use of polluted groundwater for drinkingmay cause serious health hazard and its use for irrigated agriculture may adversely affect productionpotential of irrigated lands due to aggravation of the problem of salinity, sodicity and specific ioneffects on crops and plants. It is essential to minimise groundwater pollution to improve its quality asfar as possible through regulation of groundwater extraction and/or increasing the recharge in areaswhere mining of groundwater is taking place.
PAST TRENDS IN WATER USE
Agricultural water use: surface water
Indus Basin canal diversions
Canal diversions represent the total amount of water diverted at all barrages constructed on IBISrivers. Water diverted to individual canals at their offtake from the barrages is a good indicator of thecontribution and effect of the storage reservoirs (Mangla and Tarbela) including the IBP. Aconsiderable increase in canal diversions of about 9 billion m3 was observed during the post-Manglaperiod. A further increase of 12 billion m3 was observed during the post-Tarbela period. Of this, themajor increase was in the Rabi season (9.6 billion m3 per annum) as shown in Table 5.

…Investment in land and water 267
The contribution of the Tarbela dam to canal diversions during the Rabi season was almost 26percent, significant because most staple food is grown then. However, the main objectives of theTarbela dam were to provide storage for replacing water of existing canal commands of 1.8 million hadependent on eastern rivers flow and improvement of supplies to canals off-taking from the Indusmain channel commanding 6.9 million ha.
However, there was variability in the canal diversions in both the seasons. The percentvariability between the highest and lowest post-Tarbela canal diversions was 25 and 17 percent duringthe Kharif and Rabi seasons, respectively. This shows that the stochastic nature of the river flows alsohas an effect on the canal diversions, in addition to the reduced storage capacity of the Tarbela (Table6). This information along with shortages and surpluses can be used for planning new irrigationprojects (Ahmad and Kutcher 1992).
TABLE 5Historical canal diversions to IBIS under key influences
Canal Diversions (billion m3)Key Influences Period
Kharif Rabi Annual
Pre-Partition 1940-1947 58.5 24.9 83.4
Partition 1947-1948 57.0 27.6 84.6
Dispute 1948-1960 63.4 30.4 93.8
Pre-Mangla 1960-1967 74.2 34.0 108.2
Post-Mangla 1967-1975 80.3 37.1 117.4
Post-Tarbela 1975-1980 83.7 47.0 130.7
Post-Tarbela 1980-1985 84.1 45.9 130.0
Post-Tarbela 1985-1990 81.6 46.4 128.0
Post-Tarbela 1990-1995 81.5 47.3 128.8
Post-Tarbela 1975-1995 82.7 46.7 129.4
Data Source: Water Resources Management Directorate, WAPDA.
The recent drought was so severe that annual canal diversions during 2000-2001 will be lessthan the historical minimum diversions of 116.5 billion m3 in the post-Tarbela period (1975-2001).The reduced canal diversions to the extent of 30 percent of the mean are expected, which might besome 90 billion m3. This reduction in canal diversions during the Rabi season 2000-2001 hasadversely affected crops such as wheat, chickpeas, sugarcane and vegetables, as well as orchards. Thedrought was continuing and might be severe during April-June 2002, which will further affectsugarcane and also adversely affect the planting of cotton and rice crops.
Irrigation system losses and overall irrigation efficiency
The Indus River flows through alluvial plains and thus its losses and gains assume greater importance thanwould otherwise be the case (Ahmad 1993b). In its system losses generally occur in the rising stage fromApril to July. During falling flows, covering the periods from end of July to September and from Octoberto March, the rivers usually gain water. Analysis of annual historic gains and losses was conducted usingthe data between the period from 1940-1941 to 1993-1994 for the Kharif and Rabi seasons (Table 7).

Investment in land and water in Pakistan…268
Earlier studies revealed that conveyance losses in canals varied between 15 to 30 percent(Ahmad 1993b; Harza 1963; IACA 1966; LIP 1966). The Water Sector Investment Planning Study(WSIPS, 1990) provided a synthesis of the work done by WAPDA (1979) on canal conveyance lossesfor 24, 5 and 14 canal commands in the Punjab, NWFP and Sindh provinces, respectively. Theaverage canal losses computed were 23, 12 and 20 percent for the canal commands of the Punjab,NWFP and Sindh provinces, respectively. These losses were about 21 percent for the whole basin.
TABLE 6Variability of post-Tarbela canal diversions in IBIS
Canal Diversions (billion m3)Probability (%)
Kharif Rabi Annual
Minimum 70.7 43.0 116.5
10 72.2 43.7 118.9
25 76.0 44.4 122.1
50 81.0 46.9 126.4
75 84.2 47.6 130.6
90 87.7 48.6 134.6
Maximum 88.0 50.3 135.4
Data Source: Water Resources Management Directorate, WAPDA.
TABLE 7River gains and losses in the Indus River System
River Gains and Losses (billion m3)Period
Kharif Rabi Total
Pre-Mangla 1940-1967 -20. 23 5.71 -14.52
Pre-Tarbela 1967-1976 -10.80 3.64 -7.16
Post-Tarbela 1976-1998 -14.36 1.02 -13.34
Average 1940-1998 -16.54 3.61 -12.93
Data Source: Water Management Directorate, WAPDA
Systematic work on watercourse loss measurement was initiated jointly by Colorado StateUniversity and WAPDA. Based on two systematic studies of 40 and 61 watercourses, actual losseswere 47 and 45 percent, respectively. Field application losses were about 25 percent (Ashraf, 1977;WAPDA 1979; Trout and Kemper 1980; PARC-FAO 1982). Average losses of 21, 40 and 25 percentwere used to compute losses from canals, watercourses and fields, respectively, in this paper. Theselosses provided canal, watercourse and field application efficiency of 79, 60 and 75 percent,respectively. Thus the overall irrigation efficiency is 36 percent (Ahmad 1990).
System losses corresponding to canal supplies in IBIS ranged from 82.5 to 84 billion m3
during the post-Tarbela period, or about 64 percent of water delivered to IBIS (Table 8). In freshgroundwater areas, this induced recharge resulted in accelerated installation of tubewells to exploit theresource.

…Investment in land and water 269
Groundwater
Groundwater contribution
From 1976 to 1997, the groundwater contribution to irrigated agriculture has doubled, rising from31.6 to 62.2 billion m3 (GOP 1998). The country has made considerable progress in the developmentof innovative and indigenous tubewell technology. However, with higher electricity tariffs and dieselfuel prices and soil salinity in marginal quality zones, there was a decline in groundwater pumpageduring 1997-1998. It was about 50 billion m3 – a significant decrease (Table 9). However,groundwater contributed 38 percent of surface water available at the canal head.
TABLE 8Irrigation system losses corresponding to canal supplies to IBIS
Annual System Losses (billion m3)Description of Losses
1975-80 1980-85 1985-90 1990-95
Canal Conveyance losses 27.4 27.3 26.9 27.0
Watercourse Conveyance Losses 41.3 41.1 40.4 40.7
Field Application Losses 15.5 15.4 15.2 15.3
Total Losses 84.2 83.8 82.5 83.0
Total Canal Diversions 130.7 130.0 128.0 128.8
Overall Irrigation Efficiency (%) 36 36 36 36
Another contributing factor was the transition of public tubewells under SCARPs, wherecommunities refused to take over deep tubewells because of high O&M costs. SCARP transitionprojects were aimed at reducing public involvement in the groundwater sector by closing down ortransferring public tubewells to the water users (World Bank 1988).
Droughts during 1999-2000 and 2000-2001 forced farmers to install tubewells to meetshortfalls in canal supplies. It is expected that canal supplies during 2000-2001 will be significantlyless than the historical average. Thus the groundwater abstraction was much more than the recharge;rather in certain areas farmers faced problems of the lowering of the water table.
Tubewell development
Enhanced power generation from Tarbela and the government policy of price incentives for electricpower motivated farmers to install electric tubewells. Consequently, there was more than threefoldincrease in the number of tubewells in 1990-91 as compared to the situation before Tarbela. Theinnovative and low cost development of tubewell technology in the country further motivated thefarmers to install diesel-operated tubewells.
Progressive increases in electricity tariffs starting in the early 1990s resulted in stagnation ofthe growth of electric tubewells. However, a twofold increase in diesel tubewells was observed during1990 to 1995. This is a clear indication of the effect of Tarbela and power policy of the governmentduring the late 1970s and 1980s on the growth of tubewells and development of innovative tubewelltechnology (Table 10).

Investment in land and water in Pakistan…270
The drought of 2000-2001 was so severe that farmers in the Punjab and Sindh provinces haveinstalled tubewells at a very rapid rate. It was expected that about 60 000 tubewells or lift irrigationsystems were to be installed in 2001 to meet the historical shortfall in canal supplies.
TABLE 9Pre- and post-Tarbela groundwater contribution to irrigation water supplies
Key Influences Period GroundwaterContribution(billion m3)
Increase in GroundwaterContribution
(%)
Contribution as Percent ofthe Canal Diversions
Pre-Mangla 1965-66 11.3 - 10.0
Post Mangla 1967-68 14.5 28.3 12.4
Post Mangla 1970-71 21.6 91.2 19.7
Post-Tarbela 1975-76 31.6 179.6 25.2
Post-Tarbela 1980-81 40.2 255.8 29.6
Post-Tarbela 1985-86 48.3 327.4 39.6
Post Tarbela 1990-91 54.3 380.5 39.2
Post Tarbela 1995-96 61.0 439.8 46.9**
Post Tarbela 1996-97 62.2 450.4 47.8**
Post Tarbela 1997-98 49.6 338.9 38.2**
Source: Agricultural Statistics of Pakistan, Ministry of Food, Agriculture and Livestock, 1998.* Base year of 1965-66 is used for computations.** Average value of canal diversion of 130 billion m3 is used for computations.
TABLE 10Tubewell development in Pakistan
Number of Tubewells Percent IncreaseKey Influences Period
Electric Diesel Total Electric Diesel Total
Post-Mangla 1970-71 36 921 60 301 97 222 - - -
Post-Tarbela 1975-76 60 386 100 569 160 955 63.6 66.8 65.6
Post-Tarbela 1980-81 83 855 115 818 199 673 127.1 92.1 105.4
Post-Tarbela 1985-86 99 224 158 058 257 309 168.7 162.1 164.7
Post-Tarbela 1990-91 113 635 226 205 339 840 207.8 275.1 249.6
Post Tarbela 1995-96 113 823 369 962 483 785 208.3 513.5 397.6
Source: Agricultural Statistics of Pakistan, Ministry of Food, Agriculture and Livestock, 1998.
Domestic water supply
The water supply and sanitation sector in Pakistan is characterised by an extremely low level ofcoverage, particularly in rural areas. Presently, 80 percent of the urban population have access topiped water supply, whereas only 11 percent of the rural population benefits from this facility (PWP1999). Table 11 shows the present water supply to various urban centres in Pakistan.
Water supply systems in Pakistan's urban centres are based on either using surface water orgroundwater abstraction through tubewells. The cities which depend on surface water for their

…Investment in land and water 271
drinking water needs include Islamabad, Karachi and Hyderabad. Lahore, Peshawar, Faisalabad,Abbotabad and Quetta are mostly supplied by groundwater.
Nearly all cities depending on surface supplies face moderate to acute shortages, but Lahoreand Peshawar are somewhat better off due to a high yielding aquifer.
Rural areas depend on groundwater for domestic water where available, but in irrigated areasunderlain with saline groundwater, canal waters are used to satisfy domestic requirements. Outside thecanal commands, where groundwater cannot be depended upon, rural water supply depends on theavailable stream flows in upland areas or on rainfall collected in natural depressions, such as Tobas inthe Cholistan desert. In such arid locations, the local populace must travel long distances to procuredrinking water – a task assigned to women.
TABLE 11Estimated water and sewage flows in cities
Water Supply Sewage Flow City
Population1998
(million)Rate
(gpcd)Total(mgd)
Ratio(%)
Rate(gpcd)
Total(mgd)
Islamabad 0.525 80 4 200 80 64 3 360Karachi 9.269 60 55 616 80 48 44 492Lahore 5.063 80 40 508 85 68 34 432Faisalabad 1.977 50 9 886 80 40 7 909Multan 1.182 50 5 912 80 40 4 730Hyderabad 1.151 50 5 756 80 40 4 605Gujranwala 1.124 50 5 624 80 40 4 499Peshawar 0.988 60 5 928 80 48 4 742Quetta 0.560 40 2 241 80 32 1 793Sargodha 0.455 40 1 821 80 32 1 457Sialkot 0.417 45 1 879 80 36 1 503Sukkur 0.329 50 1 646 80 40 1 317Mardan 0.244 50 1 223 80 40 978Kasur 0.241 40 967 80 32 773
* gpcd–gallons per capita per day** mgd–million gallons per day
It is estimated that present water demand for combined domestic and industrial uses is 3 302mgd, whereas available water for the purpose is 2 369 mgd (PWP 1999; NESPAK 1998). Therefore,there is a net deficiency of 22 percent of total domestic water requirement.
Severe drought has affected domestic water supply availability. Surface water availability inthe Simly dam in Islamabad has fallen to 40 percent of the requirement: the Capital DevelopmentAuthority is rationing water on alternate days to the citizens of Islamabad.

Investment in land and water in Pakistan…272
Sanitation and sewerage
Pakistan's coverage for sanitation services is lower than the water supply coverage, i.e. only 60percent and 13.5 percent in urban and rural areas, respectively. In most cities, wastewater from themunicipal areas as well as industrial effluent is disposed untreated to natural surface water bodies.Table 11 shows the sewage generation of several urban centres.
In urban areas, sewerage consists of sewage collection and a disposal system. In cities sewageis collected through RCC pipes and open drains. Collected sewerage is disposed of in nearby waterbodies through gravity or by inducting sewage pump stations in the system. In areas where sewagecollection system is non-existent, sewage is discharged into groundwater through soakage wells,sometimes even without passing through septic tanks.
In rural areas, proper collection and disposal is almost non-existent. Sewage is collectedthrough open drains and disposed of in open fields, where it usually forms huge ponds.
At present, there is little treatment of effluent in municipal areas. Only a few cities in Pakistanhave proper treatment facilities. According to a recent study, most plants are not in operation.
Industrial water use
Few industries have proper effluent treatment facilities. Generally multinational or export-orientedfactories are forced to have treatment facilities.
Major industrial estates are found in Lahore, Faisalabad, Karachi, Hyderabad, Peshawar,Hattar, Kasur and Sialkot. The estates discharge effluent without treatment into nearby streams, toflow by river to the sea. Disposal of untreated industrial waste from isolated plants is allowed in openfields or nearby water bodies. Such ponds can be seen in various industrial estates.
Past trends and returns in irrigated agriculture
Irrigated and cultivated areas in IBISIn the pre-Tarbela period, there were considerable water shortages and the actual water application tocrops was only about three-fourths of the actual irrigation requirement. The transfer of Indus water topriority areas aimed to increase canal flows up to the limit of canal capacities. The irrigated areaprojected for the years 1975, 1985 and 2000 was 14.1, 16.4 and 17.9 million ha, respectively. Thetotal cultivated area projected for those years was 19.4, 22.0 and 23.8 million ha respectively (Table12).
Analysis of projected and actual areas in IBIS indicates that actual irrigated areas during1997-1998 was 18.0 million ha, slightly higher than projected for the year 2000 by the LieftinckReport of 1968. The actual cultivated area during 1997-1998 was 22.0 million ha, 7 percent less thanprojected for the year 2000 by the Lieftinck Report. This shows that the irrigated area target has beenachieved (Table 12) but the total cultivated area target was not achieved as per projections for thepost-Tarbela period.
As a result, there was a considerable expansion in canal irrigation in the Indus basin from10.1 million ha in 1974-1975 to 14.7 million ha in 1997-1998. The 4.6 million ha increase during thepost-Tarbela period can be attributed to additional supplies from the Tarbela dam and other diversionschemes. Tubewell irrigation increased from 2.8 million ha in 1974-1975 to 3.2 million ha in 1997-1998 (only tubewell commands). In addition, within the 1997-1998 canal command area (6.9 million

…Investment in land and water 273
ha), tubewells provided water to supplement canal supplies, while in 1974-1975 this facility was notavailable. Tubewell installation within the Punjab canal command area was concentrated in theMangla command.
TABLE 12 IBIS projected and actual, irrigated and cultivated areas
Irrigated Area (mha) Cultivated Area (mha)Period
Projected Actual Projected Actual
1975 14.1 13.3 19.4 19.6
1985 16.4 15.3 22.0 20.6
2000 17.9 18.0 23.8 22.0
NOTE: mha=million hectares. Source: Lieftinck Report, Vol. I, 1968; Agricultural Statistics of Pakistan, Government of Pakistan.
Cropped areas in IBISAt the macro level, a significant change in cropping patterns resulted from increased availability ofwater from the Tarbela dam. Increased cropped areas of food grains and cash crops such as wheat (36percent), rice (39 percent), cotton (44 percent) and sugarcane (52 percent) were reported, whilecropped areas of coarse grains and conventional oilseeds decreased. The overall increase of croppedareas was 39 percent (Table 13).
Although cropped areas were not in the Lieftinck Report, it can be estimated from croppingintensity. Thus actual cropped area was less than projected in the post-Tarbela period.
TABLE 13Cropped area of selected crops in Indus Basin irrigated agriculture
Cropped Area (mha)
Crops 1971-1975 1976-1980 1980-1985 1986-1990 1990-1995Increase (%)1971-1975 to
1990-1995Wheat (R) 5.93 6.49 7.24 7.60 8.06 36
Cotton (K) 1.92 1.91 2.22 2.53 2.76 44
Rice (K) 1.51 1.88 1.98 2.01 2.10 39
Sugarcane (A) 0.61 0.76 0.90 0.82 0.93 52
Oilseeds (K&R) 0.59 0.53 0.41 0.41 0.61 4
All Fruits (A) 0.20 0.26 0.36 0.44 0.50 150
Total Area 10.76 11.83 13.11 13.91 14.96 39Source: Agricultural Statistics of Pakistan, Government of Pakistan.R = rabi; K = kharif; A = annual.
Land in the Indus basin is not a limitation. Irrigation is essential for crop production becauseof an arid environment, where rainfall contributes 10-20 percent of crop evapotranspiration in majorparts of the IBIS. However, increased number of tractors, availability of planting machinery, creditsupport helped to increase cropped area. The increase in population was another reason, whichinfluenced the increase in cropped area.

Investment in land and water in Pakistan…274
The major rabi crops in the Tarbela command area are wheat, fodder and horticultural crops.Sugarcane also needs irrigation during rabi season and thus competes for water with rabi crops. Thetrend of rabi crop areas in Tarbela shows considerable increases in area under wheat, fodder,sugarcane and horticultural crops. Wheat is a leading food grain for human consumption, while itsstraw is a source of cheap roughage for livestock. Generally, farmers consider water as a key input;with sufficient water availability; they normally increase cropped area.
Increased planting of sugarcane is primarily due to availability of additional irrigation waterfrom the Tarbela reservoir as it is a high water demand crop. Other factors that contributed towardsthis increase were the development of the sugarcane industry and the road infrastructure, bothproviding necessary backward and forward linkages for growth.
Cropping intensity
In the Lieftinck Report, projected cropping intensities were given for Punjab and Sindh provinces,instead of the Indus Basin as a whole. In the Punjab irrigated area, actual intensity was 122 and 117percent in 1985 and 1998, respectively, compared to projected values of 131 and 150 percent. InSindh, actual cropping intensity was 124 and 132 percent in 1985 and 1998, compared to theprojected 115 and 137 percent (Table 14). Increased cropping intensity in the post-Tarbela period wasless than projected. The low cropping intensity could be attributed to problems of waterlogging andsalinity, marginal quality groundwater use, increased areas of high water demand crops andinsufficient improvements in irrigated agriculture.
As a result of increased canal diversions from 95 billion m3 in 1960 to 126 billion m3 at presentand changes in the macro-economic environment, Indus basin farmers have increased their annualcropping intensities from the original design of 50 to 70 percent (over 100 years ago) to an average120 percent in 1993-1994 (John Mellor Associates and Asianics, 1994). The present study confirmsthese observations – a cropping intensity of 117 percent was achieved by Punjab province in 1998.Pubjab represents about 70 percent of Pakistan's cropped area.
TABLE 14Projected and actual cropping intensity in the IBIS
Cropping Intensity (%)
Punjab Province Sindh ProvincePeriod
Projected Actual Projected Actual
1965 95 - 90 -
1975 114 105 100 116
1985 131 122 115 124
2000/1998 150 117 137 132
Source: Lieftinck Report, Vol. I, 1968; Agricultural Statistics of Pakistan, Government of Pakistan.
Increased cropping intensity has intensified pressure on surface water resources (cheapfreshwater) and translated into a significant interference of upper and middle reaches water users intothe operation of the irrigation distribution system. Therefore, farmers – particularly at the tail end –have installed many private tubewells to tap fresh groundwater resources for flexibility in wateravailability to meet their demand.

…Investment in land and water 275
FUTURE WATER NEEDS AND AVAILABILITY
Future water needs for irrigation and non-irrigation sectors were computed for 2010. The irrigationsector includes water needs for agriculture, farm forestry, aquaculture, livestock and wetlands. Thenon-irrigation sector includes largely the domestic and industrial water needs. Present and futurewater needs and availability is presented in Table 15.
Present and future irrigation water needs
Net irrigation water requirement for crops in Pakistan is about 100 billion m3 for the year 2000.Rainfall was disregarded in estimating net irrigation water requirements, but it was assumed that a 10percent contribution of rainfall in the basin is required for leaching to maintain the salt balance in theroot-zone.
The agriculture growth rate targeted by the Ministry of Food, Agriculture and Livestock forthe next decade (2000-2010) is 5 percent per annum. This would be achieved through increasing thecropped area by 0.5 percent per annum and raising productivity by 4.5 percent per annum for the nextdecade. The increase in cropped area of 0.5 percent per annum will be achieved by providingadditional water to increase cropping intensity in irrigated area of the Indus basin. Increasedavailability of additional water will be mainly through saving water from existing losses; new storagereservoirs will not be available during the next decade, even if the construction started now. Insteadthere will be reduced available storage capacity in the basin due to continuous sedimentation of theTarbela and Mangla reservoirs.
Increased productivity of 4.5 percent per annum would also require more reliable andadequate availability of water. Additional water requirement will be about 1 percent (1.26 billion m3)of existing canal supplies per annum. In addition, the annual loss of storage reservoir capacity isestimated as 0.30 billion m3 per annum.
Current mean annual canal diversions to the Indus command area total 126.4 billion m3.Additional canal supplies required to meet 5 percent growth in agriculture and to meet annual loss oflive storage capacity of existing reservoirs due to sedimentation come to 1.56 MAF.
For the next decade, the additional irrigation water required to achieve 63 percent growth inagricultural production is 13.3 billion m3 (based on 1.26 billion m3 per annum), which is aconsiderable amount of water. Systematic efforts are needed to find new resources of water throughimproved management of water in the Indus basin and areas outside the basin. The future netirrigation water requirement for crops for the year 2010 is 113.3 billion m3 (Table 15).
The assumption was made that no additional storage will be available for the year 2010compared to the year 2000. Construction of large storage reservoirs would require a period of 10 to 12years. Water management will be the only workable option for the next decade.
The water budget presented in Table 15 seems quite different than budgets presented by otherauthors, including the Water Vision 2025 (PWP 2000). Actually the problem arises when expertsentered into the estimation of gross water requirement, which is a function of efficiency and improvedoperational management of canals and efficient water use. Thus water budget must be seen in thecontext of the net water requirement. The budget made on the basis of gross water requirementsupports the need for further water development and underestimates the potential for improved watermanagement.

Investment in land and water in Pakistan…276
TABLE 15Pakistan water requirement and availability, 2000 and 2010
YearRequirement/Availability
2000 2010
Net Water Requirement
Net Irrigation Water Requirement
Net Non-Irrigation Water requirement
Total Net Water Requirement
100.0
7.3
107.3
113.3
10.7
124.0
Net Water Availability
Mean Annual Canal Diversions
Canal Water Availability for Consumptive Use
Groundwater Availability for Consumptive Use
Total Surface and Groundwater Availability
126.4
44.9*
50.0
94.9
126.4
51.3**
50.0
101.3
Shortfall 12.4 22.7*Based on 79, 60 and 75 percent of canal, watercourse and field application efficiencies.**Based on 85, 65 and 80 percent of canal, watercourse and field application efficiencies.
Present and future non-irrigation water needs
The gross water requirement for non-irrigation needs was 7.3 billion m3 for the year 2000. This willincrease to 10.7 billion m3 for the year 2010, based on a growth rate of 4 percent per annum forincreased non-water needs due to a growth in population and coverage of domestic and industrialwater supplies (PWP 2000). Details are provided in Table 15.
NATIONAL PLANS FOR CURRENT AND FUTURE WATER NEEDS
National plans and programmes
Shortfall in water use would increase from 12.4 billion m3 to 22.7 billion m3 in the next decade(2000-2010) even with an increase in overall irrigation efficiency of 44 percent compared to thecurrent efficiency of 36 percent. Thus water resources development and management in the nextdecade will not make the country self-sufficient in irrigation and non-irrigation water needs. Onthe one-hand, intra-sectoral demand for additional water is increasing rapidly while on the other,opportunities for further development of water resources or maintaining their use to existinglevels are diminishing faster than the expected pace. Thus the challenge for the next decade willbe the effective implementation of a state of the art management cum development strategy.
Approach encompassing the development of additional reservoirs, integrated watermanagement and use, introduction of water efficient techniques, containment of environmentaldegradation, institutional strengthening, capacity building and human resource development willhave to be implemented (Planning Commission 2001).

…Investment in land and water 277
Issues and objectives
The Planning Commission of Pakistan in its water sector strategy outlines water-related issues as:
• water shortages;• seasonality in water availability and in-flexible canal irrigation system;• inequities in water distribution;• inadequate O&M funding and poor cost recovery;• increased waterlogging and salinity hazard due to poor maintenance;• excessive groundwater pumpage in certain regions and resulting in secondary salinization;• effluent disposal and related environmental issues;• absence of conducive environment required to introduce and implement water efficient irrigation
techniques and practices;• lack of private sector participation;• deteriorating institutional capacity of key water sector institutions; and• poor linkages among water, agriculture and rural development policies and strategies.
Objectives for the next decade (2000-2010) are to have sustainable development and integratedmanagement of water resources and use, to meet the anticipated shortfall in water availability and need.This would be achieved through a comprehensive strategy of development cum management in the lightof key issues identified for the sector. The specific objectives would address the key issues.
Planned options for meeting water shortages
Options outlined by the Planning Commission can be divided into two broad categories, the firstincluding augmentation measures such as:
• constructing new reservoirs;• raising the level of the Mangle dam;• desilting the Tarbela dam;• constructing carry-over dams;• constructing small and medium size dams;• harnessing hill-streams; and• exploiting remaining groundwater potential.
Second category options include conservation and management measures:
• lining canals/watercourses with a priority to brackish groundwater areas;• changes in cropping pattern to adjust for water availability; and the• using high efficiency irrigation techniques.
Targets of the three year plan
Planning Commission has prepared a three-year plan considering the above-mentioned objectives andthe options available. The physical targets of the three years programme of the water sector are:
• installing 660 SCARP tubewells;• transition of 3 000 SCARP tubewells;• rehabilitation/remodelling of 1 226 km of surface drains;• constructing 728 km of new drains;

Investment in land and water in Pakistan…278
• building 301 km of flood embankments and 83 spurs;• improving 15 000 watercourses; and• precision land levelling of 45 000 ha.
THE VISION FOR 2010
Challenges
Agriculture sector
Research and development community is facing three challenges. The first challenge faced by irrigatedagriculture is to raise production and productivity in favoured environments. Second, the challenge is toenhance production and productivity in less favoured environments such as the Balochistan valley, Rod-Kohi, the Barani lands and riverine areas. The third challenge faced by the country is that in the process ofproductivity enhancement the resources have to be upgraded rather degradation.
Population by the end of 2010 will be 171 million based on medium projections. A 30 percentpopulation increase will require at least the same increase in food and fibre production to meet nationalrequirements. Coupled with Pakistan's objective of increasing exports and reducing imports, it is morerealistic to achieve 63 percent increase in agricultural production.
Targeted 63 percent increase in agricultural production would demand 13.3 percent increase inwater availability. This additional water will come solely through savings of existing losses.
Domestic and industrial sectors
Urban and industrial sectors’ development community is facing three challenges. The firstchallenge faced by the urban and industrial sectors is to raise level of quality of service and reliability inwater supply in large metropolitans and industrial states. Secondly, the challenge is to extend the access topiped water supply in small towns and rural areas and isolated settlements. Third challenge faced by thecountry is that in the process of provision of safe water supply to the urban areas and industrial states thewater resources have to be upgraded rather degradation in terms of environmental concerns likemanagement of sewage and industrial effluents. Rather the sources of sanitary and industrial effluentshave to be blocked prior to entry into freshwater ways.
Population by the end of 2010 will be 171 million based on medium projections. The increase of30 percent in population would require at least same level of increase in domestic water supply to meet thecountry's requirement. Coupled with country's objective of alleviating poverty and quality life, it is morerealistic to achieve a level of 48 percent increase in access to safe water supply.
Targeted 48 percent increase in provision of safe water supply would demand 10.4 billion m3 ofwater for urban and industrial sectors. This additional water will come mainly through savings of existinglosses.

…Investment in land and water 279
Scenario
Vision 2010 is to increase agricultural contribution to GDP from Rs. 150 billion to Rs. 244 billion, a 63percent increase. This would require increasing agricultural production by at least 50 percent with moreemphasis on high value commodities such as milk, meat, vegetables and fruit to provide balanced nutrition tothe population.
The driving issues which affect this scenario are population, economic growth, technologicalprogress, social process, environmental concern, awareness and education and management levels.
RECOMMENDATIONS
Unresolved issues were identified which need to be addressed in the next decade. It is inappropriate to buildrecommendations for the irrigation subsector without considering the water sector as a whole (irrigation andnon-irrigation sectors). Therefore, some tentative recommendations are:
• Comprehensive planning of the water sector coupled with integrated development and management ofirrigated agriculture is essential to achieve self-reliance in agricultural production and sustainability ofthe resource base.
• Efficiency of water conveyance must be seen in the context of groundwater quality, as any loss ofwater in the brackish groundwater zone is not retrievable in terms of quality. Therefore, canal andwatercourse lining programmes should be given priority in the brackish groundwater zone.
• Research/development of low-cost, effective linings for canals and watercourses should bestrengthened.
• Local development of pressurised irrigation systems (including development of water and energyefficient pumping systems) should be encouraged. Private sector irrigation companies should beencouraged to provide services to farmers on a turnkey basis. Unemployed agricultural engineersshould be trained to begin irrigation companies which can also provide domestic water supply andsanitation in urban areas.
• Productivity and sustainability research should address issues of water scarcity and inequity.• Pilot projects in all major canal commands should be initiated to address issues of canal operational
management, institutional reforms, productivity and sustainability.• Farmers’ organizations at the distributary canal level should be given authority and financial
autonomy. Agriculture extension must reposition activities to be more responsive to farmers'organizations. The irrigation system is managed on the basis of irrigation districts, whereas agricultureextension is organised by administrative boundaries. There is a need to organise irrigation andagriculture sectors both on the basis of irrigation districts in the Indus basin and valley basis in themountainous areas.
• Provincial on-farm water management programmes should address both surface and groundwaterissues. They must reorient their technical backstop support system to respond to farmers'organizations.
• Surface water resources especially the small dams used for provision of domestic water supply have tobe increased to meet future needs. The losses of pipeline supply systems have to be decreased toprovide additional water. Mass awareness programmes have to be initiated to motivate domestic andindustrial water users’ in conservation of water.
• Emphasis should be given to recycling and re-use of water including wastewater management; and.• Research on low-cost and low O&M treatment plants for sewage and industrial effluents should be
initiated on an urgent basis.

Investment in land and water in Pakistan…280
REFERENCES
Afzal, M. 1999. Water for agriculture. Paper for Water Vision Pakistan.
Ahmad, S. 1990. Soil salinity and water management: Keynote address. Proceedings, Indo-Pakistan workshopon "Soil Salinity and Water Management", IWASRI, UNDP and PARC, Islamabad. Vol. II, p. 3-18.
Ahmad, S. 1993a. Viability of agriculture resource base: A critical appraisal. In agricultural Strategies in the1990s: Issues and options. Pakistan Association of Agricultural Social Scientists, Islamabad. p. 449-466
Ahmad, N. 1993b. Water resources of Pakistan. Publisher Shahzad Nazir, Gulberg, Lahore, Pakistan.
Ahmad, M. and G.P.Kutcher. 1992. Indus basin model III, preliminary discussion and results from 1990 base case.water shortages and surpluses in ranking study on new irrigation projects, World Bank, Washington, D.C.
Alurrade, J.C., C.A. Gandarillas and G.V. Skogerboe. 1998. Application of crop based irrigation operations toChashma Right Bank Canal, International Irrigation Management Institute, Report No. R-66, Lahore.
Ashraf, M., W.D. Kemper, M.M. Chaudhary, B. Ahmad and T. Trout. 1977. Review of watercourse lossmeasurement in Pakistan. MONA Reclamation Experimental Project, MONA, Bhalwal. Pub. No. 71.
Bhatti, M.A. 1999. Water resource system of Pakistan: status and issues. Pakistan Science Foundation,Islamabad, ISBN:969-8040-14-5, 72 p.
Bhutta, M.N. 1999. Vision on water for food and agriculture: Pakistan’s perspective. South Asia regionalmeeting on water for Food and Agriculture Development. New Delhi.
GOP 1998. Agriculture Statistics of Pakistan. Economic Wing of the Ministry of Food, Agriculture andLivestock, Government of Pakistan.
Harza Engineering Co. Ltd. 1963. Distribution Losses.
Hussain, M. 1995. Environmental pollution.
IACA. 1966. Lower Indus Project Report. Harza International Agricultural Consultants Association.
IWASRI. 1997. Integrated surface and groundwater management programme for Pakistan. Surface WaterInterim Report No. 98/1.
John Mellor Associates, Inc. 1994. Institutional reforms to accelerate the development of irrigated agriculture.Special studies, Volume I & II, Islamabad.
Kijne, J.W. and M. Kuper. 1995. Salinity and sodicity in Pakistan's Punjab: A threat to sustainability of irrigatedagriculture. Water Resources Development, Vol. 11.
Kijine, J.W. and Vander Velde, E.J. Jr. 1992. Irrigation management implications of Indus basin climatechange, Case Study, International Irrigation Management Institute, Lahore.
LIP. 1966. Lower Indus Report. Part two, Hunting Technical Services and Sir Mac Donald and Partners
Mohtadullah, K., A. Rehman and C.M. Munir. 1991. Water use and misuse. NCS, Islamabad.
NESPAK. 1991. Contribution of private tubewells in development of water potential: Final Report, Ministry ofPlanning and Development, Islamabad.
NESPAK. 1998. Subregional water supply on private sector involvement in the development and managementof water supply and sanitation system. Pakistan Country Report.

…Investment in land and water 281
Pakistan Agricultural Research Council-FAO. 1982. Farm water management. Proceedings of ExpertConsultation on Farm Water Management, Islamabad.
Pakistan Water Partnership and Swiss International Development Agency. 1999. Watershed management. In:National Workshop to Formulate Pakistan Water Vision. Global Water Partnership.Islamabad.
Pakistan Water Partnership. 2000. Framework for action for achieving the Pakistan Water Vision 2025.Islamabad.
Pakistan Planning Commission. 2001. Three year Plan for the Pakistan Sector Development Programme..
Rosegrant, M.W. and M. Svedsen. 1993. Irrigation investments and management policy for Asian food productiongrowth in the 1990s.
Saleemi, M.A. 1993. Environmental pollution: Keynote address, International Symposium on EnvironmentalAssessment and Management of Irrigation and Drainage Projects for Sustained Agriculture Growth.Lahore.
Trout, J.T. and W.D. Kemper. 1980. Watercourse improvement manual. Water Management Technical ReportNo. 58, Colorado State University, Fort Collins, Colorado
WAPDA. 1979. Revised action programme. Master Planning and Review Division, WAPDA, Pakistan.
Warsi, M. 1991. Indus and other river basin of Pakistan, Stream flow records. Case Study Report, WAPDA.
World Bank, 1988. SCARP Transition Pilot Project Project Implementation Report. Washington, D.C.
World Bank, 1994. Pakistan irrigation and drainage: issues and options. Report No. 11884 Pak, Washington,D.C.
WRRI, MONA and IIMI. 1999. Spatial analysis of groundwater in SCARP areas. a case study of the MONAUnit. Water Resources Research Institute, MONA Reclamation Experimental Project and IIMI, Islamabad.
WSIP. 1990. Water sector investment planning study. Volume IV. WAPDA.
Zuberi, F.A. and A.B.Sufi. 1992. State of art of groundwater exploration, exploitation, management andlegislation. IWASRI, WAPDA, Lahore.
…Investment in land and water 283
Investment in land and waterin the Republic of Korea
INTRODUCTION
For the Korean government, ‘food security’ has been a centrally important agricultural policy. Thecritical importance of food security was widely understood when people went through the KoreanWar during the 1950s. In 1990s, it was issued again under the pressure of WTO system of opening theKorean rice market and of increasing movement of international grain prices.
Korea has the lowest grain self-sufficiency rate among OECD members. In 1996, Korea’sself-sufficiency rate of all grains dropped to the lowest rate of 26.4 percent (excluding those for feeduse, 52.4 percent) since 1970s. After the 1970s, the self-sufficiency rate of rice, the most importantcrop in Korea, has been relatively increased at an annual average of 95 percent. It’s mainly due to theconsistent efforts of Korean government for increasing and maintaining self-sufficiency of rice. Therate has been above 100 percent since 1999 and the inventory level of over-stocked rice is currently atissue in Korea.
For the goal of rice self-sufficiency, the Korean government has focused on the constructionof farmland systems, and the investment in agricultural land and water development. Therefore, themain aim of the investment in agricultural land and water development in Korea can be said to“Mobilize Resources to Fight Hunger” one of two themes for the forthcoming World Food Summit:five years later (WFS: fyl).
The main purpose of this paper is to explain the historical contents of the agricultural land andwater development projects in Korea. In addition, this paper will discuss the economic returns andlessons from the projects with the related systems and policy directions.
OVERVIEW OF CURRENT AGRICULTURAL LAND AND WATER DEVELOPMENT PROJECTS
Outline of main projects
Under the WTO system, the government regards “agricultural land and water development projects(investment in land and water)” as the most fundamental way to boost agricultural competitivenessand to maintain self-sufficiency of rice. The MAF (Ministry of Agriculture and Forestry) assignsabout 30 percent of the agricultural budget for the agricultural land and water development projects.________________________________________________________________________________
Kim, Hong-Sang, Research Fellow…Korea Rural Economic Institute, Seoul …
________________________________________________________________________________

Investment in land and water in the Republic of Korea…284
The main projects, among all of the agricultural land and water development projectsexecuted by Korean government, are land consolidation, irrigation water development, uplandimprovement, on-farm road improvement, drainage improvement, repair of irrigation facilities, largescale area development, and soil improvement project.
Land consolidation
The main purpose of land consolidation is enlarging lot size by collectivizing small lots of arable landwhich are irregularly scattered around, building irrigation canals and drainage canals, and improvingon-farm roads. Land consolidation project is classified into two types: small-scale land consolidation(general type of land consolidation in Korea) and large scale land consolidation.
Small-scale land consolidation is the most general and oldest way of land consolidation inKorea. It aims at constructing the base for rice self-sufficiency by increasing land productivity andreducing labour hours for farming. It is classified into several types by size of lot such as 0.1ha,0.2ha, 0.3ha, 0.4ha and 0.5ha.
Large-scale land consolidation is a newly adopted policy since 1994 under the changedenvironment of rice production. Although this policy has same goal, it aims at increasing theefficiency of farming machines use. For this, the size of already consolidated early lots was doubledto its previous size. This change of lot size allows easy access of large farming machines withenlarged farm roads. The minimum lot size of large-scale land consolidation is 1 ha (in 1999, theaverage farm size per household of the Republic of Korea was 1.37ha, and the average rice paddyfield size per household was 1.0ha). This project costs about 25 million won (US$20 000) /ha. Thefinancial source of large-scale land consolidation is special government tax named by “Special TaxAct for Rural Development.” This tax has been enforced since 1994 to cope with the pressure ofWTO scheme.
In addition to small- and large-scale land consolidation projects, there is a third type of landconsolidation. Recently, simple land consolidation is being tested. Its goal is reducing the size of idleland such as unfavourably suited arable land. The cost of this project is generally about one-fifth thatof other land consolidation projects. However, it is very difficult to achieve good results.
Irrigation water development
Irrigation water development project is used to increase the utility of agricultural water supply and thepercentage of irrigated paddy fields. To this end, reservoirs and pumping stations are built in areas offrequent drought. This project can be categorized into two projects such as “large scale waterdevelopment” and “small-scale water development.”
Large scale water development projects means developing agricultural irrigation facilities infrequent drought areas where the size is more than 50 ha to establish an agricultural basis.Meanwhile, small-scale water development includes small-scale surface water development and waterdevelopment against drought. The main target of small-scale surface water development is additionalfacility patch on an irrigation benefited area. On the contrary, the target of water development againstdrought is partially irrigated paddy fields.
Drainage improvement
The drainage improvement project is for improving surface and ground water drainage. To avoidwater flood damages of agricultural products, improving the surface and ground water drainagefacilities (such as drainage pumping stations and drainage canals) are playing a key role in agriculture.

…Investment in land and water 285
Obviously, these projects support additional increasing returns of farmland by making vinyl houseagriculture and the like possible.
Repair of irrigation facilities
Repair of irrigation facilities is replacing outdated or inefficient facilities to prevent damage and tosave enough agricultural water flow. Dredging reservoirs is included in this project.
Upland improvements
Upland improvement projects help farmers voluntarily respond to the growing demand for uplandcrops and to strengthen the competitiveness of these crops. This project especially ensures theabsolute size of paddy fields. Due to the upland improvement project, farmers don’t need to discardtheir rice planting on paddy field for a high economic return from upland crops. Thus this projectcould be interpreted as a policy for stabilizing rice production. This project deals with irrigationfacility development, on-farm road improvement, upland consolidation and so on.
On-farm road improvement
On-farm road improvement project is related to mechanization trend of agriculture. Improved on-farmroad would facilitate an access of various agricultural devices. In addition, this project allows promptconnection between production fields and food processing fields. This project is usually conductedon already consolidated farmland.
Comprehensive land and water development initiated by local autonomy
This project concerns wide variety of agricultural water uses based on locally owned river basin.Under the project, each local river basin is widely upgraded to improve agricultural productivity. Inaddition, beside of agricultural water uses, this project concerns residential and industrial water uses.Thus, this project includes a lot of various policy issues and specified plans.
Soil improvement
Soil improvement project is executed to increase land productivity and improve quality of product byinputting soil conditioners on acidified arable land. This project needs relatively less cost than otherprojects.
Recent annual budget of main agricultural land and water development projects
The budget of agricultural land and water development projects increased until 1998 (see Table 1). In1998, the annual budget of agricultural land and water development projects was about 2 290 billionwon (about US$2 billion). However, the total budget has decreased from 1999. During the 1990s, thebudget for land consolidation was considerably decreased but the budget for irrigation facilities hasbeen increased continuously since 1994.

Investment in land and water in the Republic of Korea…286
TRENDS AND OUTCOMES OF AGRICULTURAL LAND AND WATER DEVELOPMENT PROJECTS
Agricultural land and water development projects have been continuously executed by the Koreangovernment since 1946. These projects have contributed to increase the productivity of arable land.As of the end of 1999, 878 000 ha of paddy field were irrigated and 802 000 ha were consolidatedfrom Korea’s total paddy field of 1 153 000 ha (76.2 percent and 69.6 percent of total paddy filedrespectively). From 1946 to 1999, slopeland reclamation projects were executed on 189 000 ha andcontributed to enlarging uplands to 746 000 ha.
Tables 2 and 3 summarize the executed main agricultural land and water developmentprojects and their cost from 1946 to 1998 (repair of irrigation facilities, surveys and natural disastersare excluded). From Tables 2 and 3 show that irrigation water development projects were the focusuntil the 1970s while land consolidation projects were emophasized during the 1980s and 1990s.
Trends in Korean agricultural land and water development projects since 1945 are as follows:
The 1950s (1945 to 1959)
Korea experienced social changes such as independence from Japan (1945) and the Korean War(1950-1953). During this period, war and the following baby boom led to a severe food shortagethroughout the country. Agricultural land and water development projects succeeded previousirrigation water development projects operated by the Japanese (from about 1910 to 1945).
The 1960s (1960 to 1969)
In 1961 the first “Law of Farmland Improvement” was registered for a new farmland improvementproject. During this period, farmland extension projects (such as slopeland reclamation and tidelandreclamation) were executed with previous irrigation water development projects for paddy fields.
The cost of farmland extension projects was about 27.1 percent of total farmlandimprovement project’s cost. An annual average of 15 000 ha of new paddy fields were established bythese projects during 1960s.
The 1970s (1970 to 1979)
The 1960's economic development movement and following drastic economic growth forced disparitybetween urban and rural area. A drastic economics growth needed massive labour forces from ruralarea. Thus, in the agricultural sector, the improved productivity of labour and farmland weredesperately needed to substitute for lack of labour power.
In 1970, a new law allows use of foreign funds for the agricultural land and waterdevelopment projects. With the aid of foreign funds, diversity of agricultural land and waterdevelopment projects were successfully on the track. During the period, self-sufficiency of rice andrural modernization were achieved. Also, large scale agricultural irrigation water developments forfive main river basins were heavily conducted during this period. These figures were mainly camefrom an availability of foreign funds.

…Investment in land and water 287
TABLE 1Annual budget: agricultural land and water development projects (1994-2000) (million won)
The 1980s (1980 to 1989)
The range of agricultural land and water development projects was widely expanded during 1980s.The huge decreasing of agricultural labour needed a help of mechanized agriculture. This trendenforced land consolidation project as a main part of agricultural land and water developmentprojects. Following the “General Rural Policy” in 1986, the annual cost of projects was more than100 billion won and over 200 million won in 1989.
The 1990s (1990 to 1998)
This period could be classified as the total crisis of agriculture. Decreasing farmland and self-sufficiency rate in food, unexpected climate change, and the growing pressure for food marketopening were main factors of the agricultural crisis. Under the circumstances, several policies wereexecuted to reduce production cost and improve productivity. One policy was “Rural StructureImprovement Policy” in 1992. For this policy, 42 trillion won was scheduled to be spent until 2001.In 1993, the timetable of the policy was reduced to 1998 with different investment lists. A recentpolicy was “Rural Development Policy” in 1994. This policy constructed agricultural responsescheme against WTO system with focusing on improving rural living environment. From this policy,the scope of government was changed.TABLE 2
1994 1995 1996 1997 1998 1999 2000Land consolidation 414 515 513 645 604 290 832 240 744 675 465 889 300 119
Upland improvement 39 660 38 500 158 600 158 600 159 995 124 482 124 482
On-farm road improvement - 15 060 162 400 162 400 170 560 150 451 155 444
Drainage improvement 63 000 78 000 106 000 154 411 164 500 162 500 218 100
Repair of irrigation facilities 67 816 95 309 142 502 218 354 256 724 224 727 284 762
Irrigation water development (large scale) (small-scale)
152 919
(116 767)(36 152)
231 266
(195 000)(28 648)
279 215
(240 344)(38 871)
390 695
(352 913)(82,482)
525 202
(443 022)(82 180)
351 465
(301 465)(50 000)
360 322
(308 322)(52 000)
Large scale area development
29 000 55 500 63 672 96 000 80 949 73 541 92 500
Comprehensive land and water development
- - - - 1 769 3 592 19 820
Seadyke construction 88 000 98 100 135 038 154 279 88 000 96 000 76 400
Water quality improvement - - - - - 940 466
Land and water survey - - 529 6 606 7 641 6 834 6 777
Support FIA 120 126 102 056 106 491 111 891 91 682 72 169 64 341
Total 975 036 1 277 436 1 758 208 2 146 476 2 291 697 1 732 590 1 342 711
Note: US$=1 300 Won (1960-1990s: US$=800 ~1 100 Won)Source: Ministry of Agriculture & Forestry (MAF)

Investment in land and water in the Republic of Korea…288
Main agricultural land and water development projects executed (ha)
TABLE 3Costs of main agricultural land and water development projects (million won)
Total 1945-1949 1950s 1960s 1970s 1980s 1990s
Total 2,041,116 15,756 164,241 594,048 525,953 309,215 431,903
Irrigation water development 898,172 15,520 158,308 337,171 214,648 82,627 89,898
Drainage improvement 73,700 16,526 25,783 31,391
Land consolidation 659,562 95,935 196,972 160,759 205,896
(paddy field) 639,970 95,935 196,972 160,759 186,304
(upland) 19,592 � � � 19,592
Large scale area development 179,599 68,707 30,362 80,530
Slopeland reclamation 189,473 2,514 152,833 27,550 4,646 1,930
Tideland reclamation 40,610 236 3,419 8,109 1,550 5,038 22,258
Sources: Ministry of Agriculture & Forestry (MAF), Korea Agricultural & Rural Infrastructure Corporation,Yearbook of Agricultural land and Water Development Statistics.
Total 1945-1949 1950s 1960s 1970s 1980s 1990s
Total 15,282,070 7 8,501 50,872 613,601 3,118,104 11,490,985
Irrigation water development 4,424,106 6 7,848 27,451 202,418 898,502 3,287,881
Drainage improvement 908,390 10,439 186,419 711,532
Land consolidation 6,761,628 9,662 109,166 969,024 5,677,776
(paddy field) 6,128,162 9,662 109,166 969,024 5,040,310
(upland) 637,466 637,466
Large scale area development 2,001,602 259,158 863,371 879,073
Slopeland reclamation 53,155 44 8,269 23,775 21,067 �
Tideland reclamation 1,129,189 1 609 5,490 8,645 179,721 934,723
Note: US$=1 300 Won (1960-1990s: 1 US$ = 800-1 100 Won)Source: Ministry of Agriculture & Forestry (MAF), Korea Agricultural & Rural Infrastructure Corporation, Yearbook
of Agricultural land and Water Development Statistics, 2000.

…Investment in land and water 289
COST SCHEME OF AGRICULTURAL LAND AND WATER DEVELOPMENT
The implementation status of agricultural land and water development projects was changed by needof specific periods. The implementation was affected by political and economical support. After thelong period of focusing on agricultural irrigation water development, the main goal of agriculturalland and water development projects was moved to “Large scale area development project” (1970s),“Farmland consolidation project” (late 1980s), and recent “Upland improvement project” and “Repairof irrigation facilities project.”
Until the 1980s, farmers had to pay a certain amount of money to the rural infrastructureimprovement projects with specific rates (see Table 4). Thus, rural infrastructure improvementprojects have difficulties to complete the project with a full satisfaction of participants. From 1989, allthe cost of “Agricultural land and water development projects” was assigned to government subsidy.Due to this surprising change, farmer’s cost burden was considerably decreased. However, in somerural area, low level of local government subsidy prevents timely development.
OPERATION AND MAINTENANCE OF IRRIGATION WATER FACILITIES
Local government and the local Farmland Improvement Association (FIA) manages each facility builtfrom agricultural land and water development projects. The responsibility of management is decidedby the size of facilities. Usually, FIA manages facilities constructed by Rural DevelopmentCorporation (RDC). “Benefited pays principal” was traditionally the main rule to control facilities’administration costs but government subsidized current expenses deficit to relieve farmer’s burdensince 1987.
As mentioned, continued irrigation water development project improved the ratio of irrigatedpaddy to 76.2 percent in 1999. FIA administrated irrigation facilities in 58.2 percent of irrigatedpaddy fields and local government administrated the other irrigated paddy fields being controlled byfarmer’s autonomy (see Table 5). The 46.2 percent of the latter paddy fields (about 169 000 ha) haveFarmland Improvement Clubs (FIC) operated by farmers. Table 6 also shows total irrigated area byirrigation facilities in 1999.
In 2000, FIA, RDC, and Federation of Farmland Improvement Association (FFIA) havemerged in Korea Agricultural and Rural Infrastructure Corporation (KARICO). The establishment ofKARICO changes methods of agricultural land and water development projects and administratingirrigation facilities. This change of irrigation facilities administration method mainly affected farmerbehaviour. Under the scheme of FIA, the participation of farmer was frequently made but farmers'voluntarily activity for administrating irrigation facilities was decreased after the launch of KARICO.
From Table 7, from 1990 to 1996, the average irrigation facility maintenance cost was35 6000 won/10a to FIA and 3 750 won/10a to FIC. In spite of the high cost of FIA compared to FIC,FIC could charge only average of 5 400 won/10a to facility users. Including government subsidy(average of 18 300 won/10a) with this water charge income, average total FIA income was only 67percent of its total managerial cost. The farmland improvement association law regulated the amountof water charge, and that water charge compensated only 15 percent of FIA’s managerial cost.Government possibly change the amount of water charge considering an inflation and other factorsbut actually changing water charge is difficult to conduct with a lot of barriers. Furthermore, thissituation is going worse than before. In 2000, abolishment of the Farmland Improvement AssociationLaw makes no water charge system for farmer. Thus, KARICO took all the cost burden of irrigationfacility administration.

Investment in land and water in the Republic of Korea…290
TABLE 4Government subsidy & total cost of agricultural land & water development projects (%)
1980s1945-1949 1950s 1960s 1970s
First half Latterhalf
1990s
Irrigation water development 50 50 60 70
- large scale 70 100 100
- small-scale 70 90 100 (30)
- ground water 100 100 100 100 100
Drainage improvement 100 100 100 100
Land consolidation
- (small-scale) 40 80 (30) 80 (20) 90 (20) 100 (20)
(large scale) 100- On-farm road improvement 100
- Upland improvement 100 (20)
Conversion to arable land
- Slopeland reclamation 50 60 60 60 60 0
- Tideland reclamation 50-55 50 80 80 80 100 100
Large scale area development 80 80 100 100
Repair of irrigation facilities- Operated by FIA 100 100
- Seadyke 80 100 100
Note: 80 (30) means that 50% is government subsidy, 30% is local government (local autonomy), and 20% ischarged to farmers.Source: Ministry of Agriculture & Forestry (MAF)
OUTCOMES/PROBLEMS OF AGRICULTURAL LAND AND WATER DEVELOPMENT PROJECTS
Positive outcomes from agricultural land and water development projects
Establishment of basis for self-sufficiency of rice
Rapid economic growth and urban expansion has contributed to a falling grain self-sufficiency ratesince 1970 with decline of the crop production area. The self-sufficiency rate of all grains droppedfrom 93.9 percent in 1965 to 29.4 percent in 1999 (excluding those for feed use). The self-sufficiencyrate for rice, Korea's most important crop, has been relatively high at an annual average of 95 percentafter the 1970s thanks to consistent efforts. The rate has been over 100 percent since 1999 (Table 8).

…Investment in land and water 291
TABLE 5Change in irrigated paddy field area (000 ha, %)
TABLE 6Irrigated area by irrigation facility (as of the end of 1999) (ha, %)
A key factor for stable commodity prices in national economy
The economic crisis resulting from the IMF and and WTO system boosted unstable commodity pricesin Korea. The stable supply of domestic agricultural commodities contributed to lessening socialturmoil and economic stabilization. From 1986 to 1991, annual average agricultural product pricesincreased about 8.5 percent and its high increasing ratio brought the pressure of inflation. However,since 1992, after massive investment in agricultural land and related development projects, theaverage price of agricultural products decreased considerably, by 5.5 percent. Table 9 shows theconsumer price indexes of selected food items. The consumer indexes of vegetables and fruits show
Irrigated paddy fieldTotal paddy field(A) FIA Non-FIA Total (B)
Percentage of B/A
1970197519801985199019951999
1 2841 2771 3071 3251 3451 2061 153
317364424471512504512
428426469477475403366
745790893948987907878
58.062.068.072.073.475.276.2
Source: Ministry of Agriculture & Forestry (MAF), Korea Agricultural & Rural Infrastructure Corporation, Yearbook of Agricultural land and Water Development Statistics, 2000.
Total Facilities operated by FIAFacilities operated byNon-FIA (Si and Gun)
No. of Facilities Irrigated area No. of Facilities Irrigated area No. of Facilities Irrigated area
TotalReservoirs
Pumps & drain stations
Weirs,Infiltration Galleries
Tubewells
63 54717 9566 398
18 3203 739
17 134
814 348510 969149 366
101 17819 75533 079
12 0253 2773 449
3 844463992
507 598370 356119 697
14 2773 195
73
51 52214 6792 949
14 4763 276
16 142
306 750140 61229 669
86 90216 56033 007
Note: Out of 10 878 ha project area and area irrigated by other facilities 53 268 ha are excluded.Source: Ministry of Agriculture & Forestry (MAF), Korea Agricultural & Rural Infrastructure Corporation,Yearbook of Agricultural land and Water Development Statistics, 2000.

Investment in land and water in the Republic of Korea…292
mostly decreasing figures among other categories. Again, this result was from agricultural land andwater development projects.
TABLE 7
Note: Farmland Improvement Association (FIA) and Farmland Improvement Club (FIC) guided by local autonomyStatus of water charge assessed by operator of irrigation facilities (won) (Si and Gun).Source: Ministry of Agriculture & Forestry (MAF)·Korea Agricultural & Rural Infrastructure Corporation, Yearbookof Agricultural land and Water Development Statistics, 1990-1997.
TABLE 8Self-sufficiency rate of rice and all grains (%)
Enhancing the efficiency use of agricultural land
The agricultural land and water development projects enhanced efficiency of agricultural land usewith introducing mechanization methods. This project also saved labour input and opportunity cost ofagricultural production. Thus, finally, this project has achieved low cost production and farmer’spositive attitude toward continuous farming.
Table 10 shows the results of a survey conducted by MAF. Following agricultural land andwater development projects, rice production has increased about 5 percent, and rice production costand total farming labour hour reduced 16.2 percent and 33.4 percent respectively. After drainageimprovement projects, total agricultural field production increased by about 23 percent.
Area commanded by FIA Area commanded by FIC
Cost per 10a(A)
Assessment(B)
B/A×100Cost per 10a
(C)Assessment
(D)D/C×100
Average1990199119921993199419951996
35 60035 80030 50031 80032 80034 50039 90044 300
5 3754 6995 0765 4395 5975 5975 4825 737
15.113.116.617.117.116.213.713.0
3 7503 7403 5303 9103 8103 8103 7603 700
4 7024 6374 7244 9144 8194 6874 6604 470
125.4124.0133.8125.7126.5123.0123.9120.8
1965 1975 1980 1985 1990 1995 1996 1997 1998 1999
Rice 100.7 94.6 95.1 103.3 108.3 91.4 89.9 105.0 104.5 96.6
All grains 93.9 73.1 56.0 48.4 43.1 29.1 26.4 30.4 31.4 29.4
All grains(excluding feed use)
98.8 79.1 69.6 71.6 70.3 55.7 52.4 58.0 57.6 54.2
Source: Ministry of Agriculture & Forestry (MAF), Major Statistics in Agriculture and Forestry, 2000

…Investment in land and water 293
TABLE 9Changes in Price Index
Preventing the spread of idle land
Due to the limited available arable land for Korea’s dense population, government needs slopelandreclamation and tideland reclamation for arable land expansion. It also exerted all possible efforts toprevent the spread of idle land. According to an MAF survey, the main reason for converting paddyfield into idle land was unfavourable farming conditions for the farmer. Thus, MAF regards land andwater improvement projects as the most influential means to prevent spread of idle land.
Problems in agricultural land and water development projects
Mood of avoidance to investment in agricultural land and water development
Financial experts and government officers argue that government should cut down its expenditure onagriculture, especially on land and water development budget, to put emphasis on the efficientinvestment. With respect to this opinion, government tends to put less weight on agricultural land andwater development projects. It is easily shown that current agricultural investment project moreemphasize on agricultural marketing improvement projects than agricultural land and waterdevelopment projects.
Each time period has different goals to achieve from agricultural investment. Until the early1980s, agricultural investment emphasized that the improvement of productivity, while more recentlyreducing production cost with reduced labour has been the focus. However, recent agricultural landand water development projects face the limit of maximized outcome.
TABLE 10Economic returns from land consolidation: rice production (%)
rate of rise(%)`86 `91 `92 `95 `96 `98
`86-'91 `92-'95 `96-'98 `92-'98
Total commodities
58.4 80.9 86.0 100.0 104.9 117.8 6.7 5.1 6.0 5.4
Foods 53.4 80.3 85.2 100.0 103.9 117.3 8.5 5.5 6.2 5.5
Grains 64.1 85.6 88.3 100.0 115.7 128.5 5.9 4.2 5.4 6.4
Meat 62.9 98.7 98.4 100.0 98.8 100.9 9.4 0.5 1.1 0.4
Vegetables 44.1 75.6 78.5 100.0 104.2 120.3 11.4 8.4 7.4 7.4
Fruits 37.2 77.8 81.6 100.0 86.3 99.6 15.9 7.0 7.4 3.4
Others 61.5 81.3 86.3 100.0 105.4 118.1 5.7 5.0 5.8 5.4
Source: Ministry of Agriculture & Forestry (MAF)
Japan KoreaLand productivity Increase effect 5.7 � 5.0 �
Production Cost down effect 19.9 � 16.2 �
Labour hours reduction effect 31.8 � 33.4 �
Source : Ministry of Agriculture & Forestry (MAF)

Investment in land and water in the Republic of Korea…294
Lack of matching funds from local autonomy
The launch of local autonomy by the previous central government provokes urgent need for locallyfocused investment projects with locally planned policies. However, most local government facesdifficulty in conducting such projects with limited funds.
For land consolidation projects, the central government is supposed to support 80 percent ofthe project cost while local government pays 20 percent. In spite of original cost schedule, localgovernment paid more than 20 percent and this figure has been gradually increased in each year (26percent in 1996, 29 percent in 1997, 32 percent in 1997, 36 percent in 1999, and 38 percent in 2000).This increasing cost burden of local government forced to reduce size of land consolidation project.Thus, unbalanced development and low level achievement is expected in some local areas.
Manpower problem for irrigation facilities operation and maintenance
KARICO was intended to attain economy of scale, reduce farmer debt, and operate rationally.However, initiation of KARICO faced difficulty in proper operation of its irrigation facilities due to a30 percent reduction of irrigation facility workers. KARICO also faced the problem of fallingvoluntarily participation by farmers in maintaining canals and drainage. The economics free ridingproblems were evolved in use of irrigated water.
POLICY DIRECTIONS
Basic policy directions
Some observations made be may regarding basic policy directions:
• because of financing difficulty, government must increase the efficiency of investment in land andwater development;
• it is time to change the agricultural policy goal from quantity- to quality-focused;• it is necessary to introduce environmentally friendly methods of development;• the operation and maintenance of exiting irrigation facilities should be emphasized more than
development of new water irrigation facilities;• Removing the entry barriers of private construction companies to enter the agricultural land and
water development project to allow competition between constructors.
Current issues and policy directions
Secure stable project funds
Agricultural land and water development projects need long term investment to attain desirableoutcomes. To this end, securing sufficient, stable funding is very important.
Apposite project schedule and cost actualization
The goal of the project should be fully considered subject to available funding. Also, governmentrealizes the geographical differences of each area and actualizes the cost for development project.

…Investment in land and water 295
An alternative policy for reducing project cost
An alternative policy is needed to reduce the cost of development projects. For example, alternativeprojects such as on-farm road construction and exiting irrigation canal improvement project could beselected in specific area instead of large scale development projects to get a partial improvement. Inaddition, several projects may be bundled (packaged) to reduce additional costs under the long termplan. Introducing advanced techniques and methods could reduce project cost. To this end, developingnew methods and technology is very important.
Improving system management methods
Agricultural irrigation water development project has focused on installing new facilities or upgradingexiting facilities. However, the capacity for drought and efficiency were continuously doubted. Toreduce this uncertainty, irrigation water management systems should be changed to integrate existingsmall facility capacity with revised management. Also, it is necessary to put more emphasis onrepairing and maintaining existing irrigation facilities.
Developing and maintaining information
Most previous development information was not systematically nor continuously managed. From the1960s, government conducted many national surveys. However, the information from such surveyswas not used for other purposes but forgotten. A more systematic approach to exiting data should beconducted to increase its capacity. This procedure could reduce additional cost for time and labour.
REFERENCES
FFIA·KREI, Rice Farming and Water Management in East Asia, Seoul, Korea, 1995.
FFIA, Irrigation Water Management in East Asia, Seoul, Korea, 1996.
KARICO Rural Research Institute, 2000, A Study on the Performance of Agricultural Infrastructure Projects
and the Measures of Efficient Rural Development, Ansan.
KCID·RDC, Water in Asia in 2000s-Demand and Supply of Rural Water and its Efficient Management, Seoul,
Korea, 1996.
Kim, Hong-Sang, Cost Share on the Management of Irrigation System among Government, Local Autonomy
and User, KCID Journal, Vol.8 No.1, 2001.6.
Kim, Hong-Sang, et al., An Analysis of the Effect of Upland Improvement Project, Korea Rural Economic
Institute, 2000.
Kim, Hong-Sang et al., Feasibility Study on the Agricultural Land and Water Development in Youngsan River 4
Project Area, Korea Rural Economic Institute, 2000.
Kim, Yong-Taeg et al., The Improvement of the Government Subsidy Program for the Irrigation Water
Management System, Korea Rural Economic Insititute, 2000.
Ministry of Agriculture and Forestry, Agriculture and Fishery Statistical Yearbook, Kwachon.
Ministry of Agriculture and Forestry, Major Statistics in Agriculture and Forestry, Kwachon.
Ministry of Agriculture and Forestry, Data of Public Affairs, Kwachon.
Ministry of Agriculture and Forestry -KARICO, Yearbook of Agricultural Land and Water Development
Statictics, Kwachon.

Investment in land and water in the Republic of Korea…296
OECD, Sustainable Management of Water in Agriculture ; Issues and Policies – The Athens Workshop, 1998.

…Investment in land and water 297
WATER SECTOR DEVELOPMENT
Historical perspective
Sri Lanka has one of the world's oldest civilizations based on water sector development, beginningover 2000 years ago. The ancient kings build hundreds of major reservoirs and thousands of minorreservoirs to harvest rain water and conserve water for agriculture development. Most reservoirs werelocated in the country's north central, northwest and northeastern dry zone regions.
Nearly 700 years ago the seat of the kingdom shifted to the central hill country because ofvaried foreign invasions and a malaria epidemic that let the impressive water tank systems fall intoabandonment and disrepair. Restoration work on some tanks began during British rule. Restoration ofthe major Kalawewa reservoir with a capacity of nearly 145 million m3 was done from 1885 to 1887.Restoration work on our ancient tank systems was accelerated after independence from British rule in1948.
Traditionally irrigation water was used to grow rice. Introduction of improved varietiesaccompanied by the provision of irrigation facilities helped to increase rice production since 1950. Itis also observed that the average yield of rice in major irrigation schemes was far above the rainfedrice cultivation.
Large areas of well-drained land on the upper slopes of the catena became irrigable after thisnew development work. The lands were found to be more suitable for upland crops than ricecultivation due to high rates of infiltration and poor retention of water for flooding. Due to additionalirrigation facilities available and better markets established the country showed a dramatic increase inproduction of other crops during the period 1970 to 1988. The import restrictions imposed on thesecommodities helped farmers get a good price for their products. With the liberalization of tradepolicies in the 1980s, there was a downward trend in OFC production but rice remained a majorsource of income for the farmers.
________________________________________________________________________________
Henry Gamage, Additional Director…Ministry of Agriculture, Sri Lanka.…
________________________________________________________________________________
Land and water sector development in Sri Lanka

Investment in land and water in Sri Lanka…298
Irrigation systems management
Irrigation systems commanding more than 80 ha categorized as medium or major reservoirs (80 ha-40 000 ha) are constructed, operated and maintained by the Irrigation Department (Table 1). There aremore than 300 major irrigation systems in operation at present. Several selected major irrigationsystems (Table 2) are managed jointly by the Irrigation Department and the Irrigation ManagementDivision (IMD) of the Ministry of Irrigation under the Integrated Management of Major IrrigationSettlement Schemes (INMAS) programme. Minor irrigation systems (irrigation systems commandingless than 80 ha) are constructed or renovated by the Irrigation Department but managed by theAgrarian Services Department.
According to an FAO estimate there are 7 758 village tanks. The Freedom from HungerCampaign estimates 18 000 village tanks. Another source reports some 12 000 tanks in abandonedstate while 8 500 working tanks are functioning in the dry zone. Altogether there are about 600 000 haof irrigable land in the country under different categories: Irrigation Department. 294 640 ha of majorirrigation; Mahaweli Economic Agency, 115 960 ha of major irrigation; Agrarian ServicesDepartment, minor irrigation areas of 180 000 ha. Also, see Tables 1 and 2.
Table 1Irrigation systems under the Irrigation Department
Size of systems (ha) Number of systems Total area (ha)
80 to 600 223 41 480
600 to 1 000 27 19 160
1 000 to 1 200 29 40 320
1 200 to 4 000 23 61 680
Over 4 000 13 132 000
Total 315 294 640Source: Perera, K.D.P. (1986).
Table 2Mahaweli Economic Agency irrigation systems
Irrigated area (ha)
System 87/88 Maha 88 Yala
Net irrigable areafull development
System “H” 24 954 17 056 25 240
System “G” 4 171 3 917 3 327
System “B” 8 655 8 192 47 414
Walawe 12 451 10 887 55 320
System “C” 13 579 8 539 22 243
Total 63 810 48 591 115 960Source: Mahaweli Engineering and Construction Agency, Structure Plan/MEA StatisticalDivision, Mahaweli Statistical Annual (Files 1988).

…Investment in land and water 299
Farmer participation in irrigation management
In major irrigation systems field level irrigation management is done through irrigation engineers,technical assistants, work supervisors and irrigation labourers. A technical assistant is responsible forabout 2 000 ha, while work supervisors and irrigation labourers are responsible for 1 000 ha and 200ha respectively. Water distribution and allocation is determined by the farmers at the seasonal (kanna)farmers' meeting scheduled prior to every cultivation season at which officers and farmers collectivelytake decisions on water distribution and cultivation. In IMD schemes management of field channels isgiven to farmer organizations. They are allowed to collect operation and maintenance (O&M) taxesand carry out maintenance themselves. Technical officers provide necessary support. The programmeis now being implemented as a pilot programme and shown some success so far.
Cost of irrigation systems
Most large-scale irrigation infrastructure development is associated with power generation. Sri Lankahas an installed capacity to generate 1 135 MW of electricity through a hydropower network of 16hydropower stations. The water resources still available for further exploitation is diminishing andbecoming more expensive. Thermal energy is now being pursued. However, there is high potential todevelop rural electric generation plants making use of small stream flows and the available steepgradients.
Investment in several major irrigation works – new construction, rehabilitation and operation
and maintenance from 1950 to 1988 – is given in Table 3 and Figure 1. Another estimate of the costof rehabilitation is given in Table 4. The capital cost of some new irrigation systems is given in Table5. The cost of providing irrigation water to the Mahaweli area, for example, is estimated at nearlyUS$14 000 to 25 000 per/ha. The development cost of small to medium irrigation works is relativelylow compared to Mahaweli but still is considerable. However, this amount will fall when the benefitsderived from power generation are deducted. Government investment from 1988 to 1992 on capitalexpenditure is given in Table 6. Investment for irrigation increased tremendously during the last 40years, rising to 30 percent of public investment in 1983. From 1988 to 1992, a significant investmentwas made in irrigation infrastructure development. This is mainly because of the acceleratedMahaweli Development Programme. Investment in irrigation other than the Mahaweli Programmedecreased by 70 percent from a high figure of Rs. 1.322 billion in 1989 to Rs. 390 million in 1992
FIGURE 1 Changes in irrigation investments in Sri Lanka, five-year moving averages, 1950-1986 (1986 prices)
0
0.5
1
1.5
2
2.5
3
3.5
4
1950 1955 1960 1965 1970 1975 1980 1985 1988
Type of investment
Rs.
Bill
ions Operation & maintenance
Rehabilitation
Construction

Investment in land and water in Sri Lanka…300
(Table 6). Since then it has shown a downward trend but remains a significant component ofgovernment investment. At present investment in irrigation is about 10 percent of public investment.
Table 7 shows investment in village irrigation schemes from 1950 to 1982. Irrigation
investment in the Public Investment Programme (PIP) is given in Table 9. Its data was reported in astudy made by the IMMI, Sri Lanka, titled "Irrigation Investment Trends in Sri Lanka: NewConstruction and Beyond" from various information sources.
Current cost of irrigation development
Details of one project likely to be approved for implementation (now in planning) is given below todemonstrate current level of water sector development investment. The "Potential Rehabilitation ofIrrigated Agriculture in the Dry and Intermediate Zones of Sri Lanka" (Main Report 2000, NipponKoei, JICA and the Ministry of Irrigation and Power).
TABLE 3Irrigation investment by type, government budget, total public investment, 1950-1988*
IRRIGATION INVESTMENT (Rs. million) Share of totalirrigation investment (%)
in
NewConstruction1
Rehabilitation2 Operation &Maintenance3 Total
Governmentbudget
Total publicinvestment
1950 907(96)
- 34(4)
941(100)
8 47
1955 859(96)
- 38(4)
897(100)
6 29
1960 601(83)
- 121(17)
722(100)
3 19
1965 619(91)
- 62(9)
681(100)
3 15
1970 994(93)
- 78(7)
1 072(100)
3 16
1975 1 116(89)
5(1)
127(10)
1 248(100)
2 13
1980 3 023(89)
225(7)
137(4)
3 385(100)
6 21
1985 2 270(82)
451(13)
154(5)
3 375(100)
6 18
1988 1 676(80)
308(15)
102(5)
2 086(100)
3 NA
NOTE: (1) Five-year averages centring on years shown, except 1988, indicated in 1988 prices. Figures inparentheses are percentages; (2) Investment for constructing new systems or restoring abandoned old systems;(3) Major rehabilitation and modernization of existing systems. NA = not available.
The proposed project is still in planning and is envisaged to rehabilitate eight major reservoirschemes, eight medium reservoir schemes and 80 minor schemes comprising 18 200 ha and 25 300

…Investment in land and water 301
farm households. The goal of the project is to improve agricultural productivity, farm income,irrigation facilities, farm roads and farming systems. The project is estimated to cost nearly Rs. 2667million (US$37 million at US$1= Rs.71). The area of the eight major schemes is 14 167 ha, eightmedium schemes at 1 519 ha and the area under minor schemes is 2 509. The estimated cost ofdevelopment is US$1 370, US$1 070 and US$620 respectively, for major, medium and minorschemes. The project is expected to be implemented by the Irrigation Management Division of theMinistry of Irrigation and Power.
TABLE 4Cost of Rehabilitation (1987 prices)
Size of system Rs/ha US$/ha
Large 31 290 1 063
Medium 21 335 725
Small 14 225 483SOURCE: Ministry of Lands and Land Development.
Recovery of irrigation costs from farmers
In ancient Sri Lanka farmers paid for water received in labour services called Rajakariya. Farmerswere obliged to work for the king in return for the services received to cultivate his land. The servicesmainly covered the supply of land and water.
TABLE 5Capital cost of irrigation systems (1987 prices)
System Rs./ha US$/ha
Mahaweli 426 500 - 711 150* 14 490 -24 150
Kirindi Oya 284 450* 9 660
Nagadeepa Project 1 217
Puburattewa Project 5 636***
Tank Irrigation Modification 51 080**
Kibulwanana Project 4 332***
Inginimitiya 125 200* 4 250
Medium-scale projects 36 950* 1 255
Small-scale projects (VIRP) 22 800* 775
SOURCE: (*) Ministry of Lands and Land Development; (**) irrigation Department; (***) Atukorala &Atukorala (1990)
The British who ruled after 1815 did away with the traditional Rajakariya system. After someyears, having realized the importance of the ancient system, they reintroduced it and imposed six daysof annual compulsory labour for repair and upkeep of roads and irrigation works. Irrigation OrdinanceNo. 21 of 1867 introduced an irrigation rate to recover the cost of improving irrigation facilities. In1984 an attempt was made to recover part of the cost – calculated as Rs. 500/ha of irrigation – fromfarmers who were initially were asked to pay Rs. 250/ha. It was proposed to increase the rate annuallyby Rs. 50/ha as it was found that the O&M fee collection was unsatisfactory.
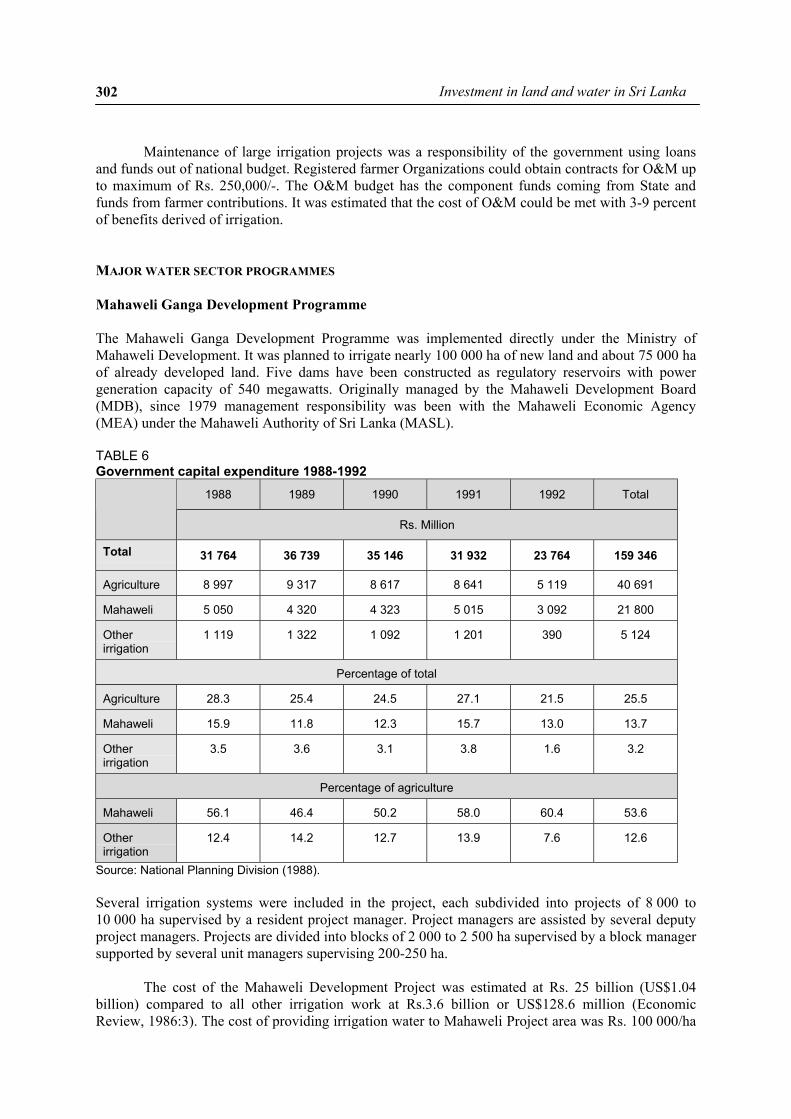
Investment in land and water in Sri Lanka…302
Maintenance of large irrigation projects was a responsibility of the government using loansand funds out of national budget. Registered farmer Organizations could obtain contracts for O&M upto maximum of Rs. 250,000/-. The O&M budget has the component funds coming from State andfunds from farmer contributions. It was estimated that the cost of O&M could be met with 3-9 percentof benefits derived of irrigation.
MAJOR WATER SECTOR PROGRAMMES
Mahaweli Ganga Development Programme
The Mahaweli Ganga Development Programme was implemented directly under the Ministry ofMahaweli Development. It was planned to irrigate nearly 100 000 ha of new land and about 75 000 haof already developed land. Five dams have been constructed as regulatory reservoirs with powergeneration capacity of 540 megawatts. Originally managed by the Mahaweli Development Board(MDB), since 1979 management responsibility was been with the Mahaweli Economic Agency(MEA) under the Mahaweli Authority of Sri Lanka (MASL).
TABLE 6Government capital expenditure 1988-1992
1988 1989 1990 1991 1992 Total
Rs. Million
Total 31 764 36 739 35 146 31 932 23 764 159 346
Agriculture 8 997 9 317 8 617 8 641 5 119 40 691
Mahaweli 5 050 4 320 4 323 5 015 3 092 21 800
Otherirrigation
1 119 1 322 1 092 1 201 390 5 124
Percentage of total
Agriculture 28.3 25.4 24.5 27.1 21.5 25.5
Mahaweli 15.9 11.8 12.3 15.7 13.0 13.7
Otherirrigation
3.5 3.6 3.1 3.8 1.6 3.2
Percentage of agriculture
Mahaweli 56.1 46.4 50.2 58.0 60.4 53.6
Otherirrigation
12.4 14.2 12.7 13.9 7.6 12.6
Source: National Planning Division (1988).
Several irrigation systems were included in the project, each subdivided into projects of 8 000 to10 000 ha supervised by a resident project manager. Project managers are assisted by several deputyproject managers. Projects are divided into blocks of 2 000 to 2 500 ha supervised by a block managersupported by several unit managers supervising 200-250 ha.
The cost of the Mahaweli Development Project was estimated at Rs. 25 billion (US$1.04billion) compared to all other irrigation work at Rs.3.6 billion or US$128.6 million (EconomicReview, 1986:3). The cost of providing irrigation water to Mahaweli Project area was Rs. 100 000/ha

…Investment in land and water 303
or US$1 775/ha (Economic Review, February 2001).
Anuradhapura Dry zone Development Project (ADZAP)
ADZAP was implemented in Anuradhapura district Sri Lanka's dry zone of Sri Lanka. Financial andtechnical assistance were provided by the ADB, IFAD and the Government of Sri Lanka. The projectwas implemented from 1981 to 1988 at a total cost estimated at Rs. 690 million (US$24 million). Itfocused on rehabilitating minor tanks and developing adjacent uplands, agricultural infrastructure,livestock and support services. The major objectives of the project were to increase food productionand productivity, employment, improved rural income generation by optimum use and developmentof available resources and also to ensure equitable land and water distribution. It also aimed atimproving farming systems, including integrated agriculture. About 200 minor tanks were restored,covering nearly 3 000 ha of irrigable land and about 14 000 ha of rainfed land.
Sustainability and lessons learned
A study conducted by Jayasena (1988) reported that project objectives were partially achieved.Integrated agriculture goals in the highlands did not occur, as most farmers did not live in the newlyallocated lands. Limited fodder and dry season water could not sustain livestock. Shifting cultivationwas eliminated and road networks were improved as lasting positive achievements, but lowland andupland development did not meet expectations. The project evaluation recommended closercooperation and more careful planning by involved agencies in future projects. The scheme had noproper project evaluation system. Some rehabilitated tanks did not meet minimum criteria andbeneficiaries were not selected systematically. Some outsiders gained land and used it improperly andthere was no proper water management to make the best use of available water. Also, the project didnot distribute good milk cows to the beneficiaries and failed to achieve a proper fodder developmentprogramme.
Village Irrigation Rehabilitation Project (VIRP)
A World Bank loan funded the Village Irrigation Rehabilitation Project (VIRP) coveringrehabilitation of 1 200 village tanks and modernization of another 500 small tanks in 14administrative districts. Implemented between 1980 and 1989 at a total cost of Rs.784 million orUS$28 million (World Bank, 1981) at an estimated cost of Rs. 12 350 (US$441) per/ha at 1980prices. Cost of new development was Rs. 24 700/ha (US 880/ha). The estimate for 1980 was increasedto Rs.21 600 (US$771) and Rs.43 225 (US$1 554), respectively in 1987.
Benefits and lessons learned
In terms of encouraging farmer involvement in the rehabilitation and management process VIRP wasnot successful. However, a study conducted by the Agrarian Research and Training Institute (ARTI)has shown 63 percent of farmers reporting improved water supply after rehabilitation. It also reportedthat channel damaging and illegal water supply have declined significantly after implementation.
Tank Irrigation Modernization Project (TIMP)
The first major irrigation rehabilitation project in contemporary Sri Lanka, this project aimed atrehabilitating five major tanks: Mahawilachchiya (1 053 ha), Mahakanadarawa 2 429 ha), Padaviya(5 061 ha), Pawattakulam (1 781 ha) and Vavunikulam (2 429 ha). The project objective was toincrease cropping intensity through timely cultivation with proper allocation and distribution of water.The project began in 1976 and was completed in 1984. It has given more emphasis to engineering

Investment in land and water in Sri Lanka…304
aspects and less attention to institutions and agricultural extension. Its total cost in 1986 prices wasRs. 651 million (US$23 million).
TABLE 7 Capital expenditure in village (minor) irrigation schemes
Period Amount (Rs. million)
1950-1954 16.4
1955-1959 11.0
1960-1964 6.4
1965-1969 23.3
1070-1974 70.4
1975-1979 196.0
1980-1982 285.00
Benefits and lessons learned
No definite increases to cropping intensity and rice yields were observed though it was an objective(Abeysekera, 1984). Despite improved water conditions, no systematic cropping intensity wasobserved by Murray, Rust and Rao (1987). The simultaneous rehabilitation of the minor tanks in thewatershed area of Mahakanadarawa tank contributed to poor water availability and consequent lowcropping intensity. Some of lessons learned included the need for advance planning of works, whichprevented improvement of minor tanks above the catchment area. The project ought to have givenmore emphasis to agricultural extension and institutional strengthening.
Major Irrigation Rehabilitation Project (MIRP)
MIRP represented a continuation of the programme commenced under TIMP. Funded by USAID andIDA loans, the project aimed at improving irrigation facilities and improving agricultural productionin seven major irrigation systems in the dry zone. It also aimed to introduce integrated managementthrough rehabilitation and farmer involvement. The project dropped implementation of three systemsdue to civil strife in the vicinity. Overall project cost to rehabilitate the Nachchaduwa, Huruluwewa,Rajangana and Kantalai irrigation systems was nearly US$39 million. The programme also funded theIntegrated Management of Major Irrigation Systems (INMAS) to ensure proper O&M of the irrigationsystems and complementary programming of agricultural activities and inputs.
The project objectives have been partially achieved according to the Project CompletionReport (PCR), 1994. Rehabilitation works have been carried out as planned and the INMAS concepthas been made operational. It appears to have obtained nearly 80 percent of its expected paddyproduction of 32 400 tonnes, but its programme to popularize growing other crops ended with limitedsuccess due to farmers preference to grow paddy and the lack of extension support and credit.
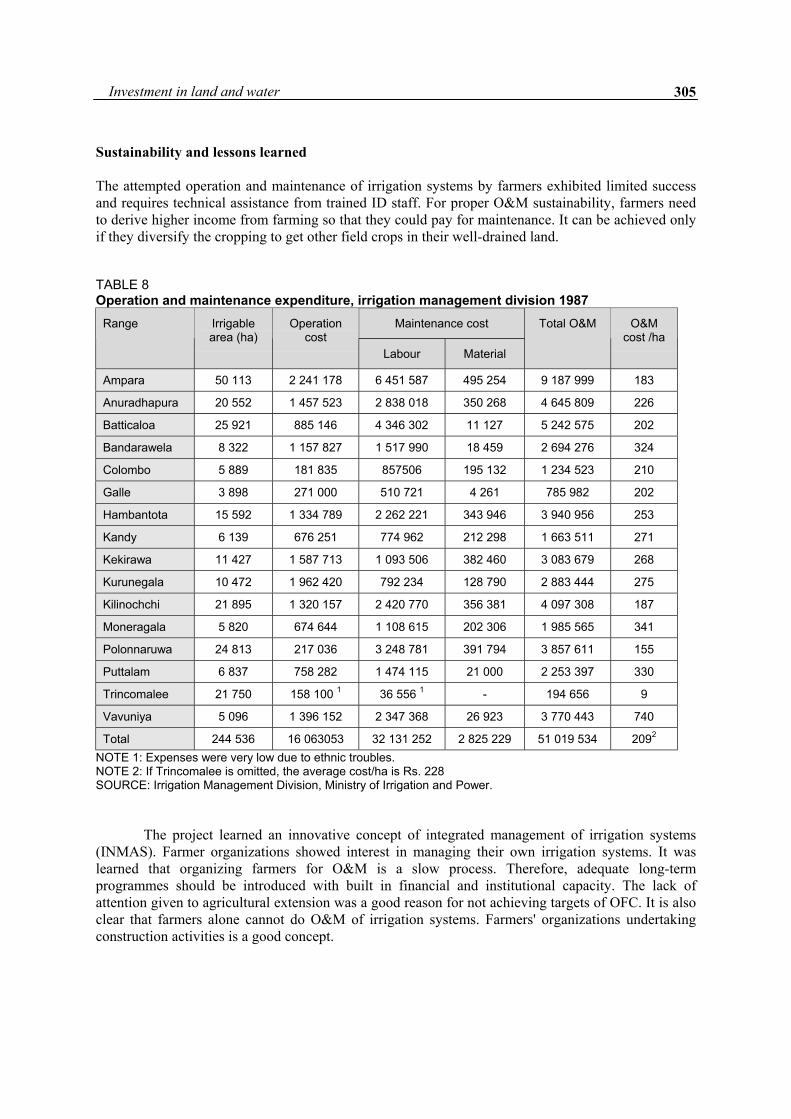
…Investment in land and water 305
Sustainability and lessons learned
The attempted operation and maintenance of irrigation systems by farmers exhibited limited successand requires technical assistance from trained ID staff. For proper O&M sustainability, farmers needto derive higher income from farming so that they could pay for maintenance. It can be achieved onlyif they diversify the cropping to get other field crops in their well-drained land.
TABLE 8Operation and maintenance expenditure, irrigation management division 1987
Maintenance costRange Irrigablearea (ha)
Operationcost
Labour Material
Total O&M O&Mcost /ha
Ampara 50 113 2 241 178 6 451 587 495 254 9 187 999 183
Anuradhapura 20 552 1 457 523 2 838 018 350 268 4 645 809 226
Batticaloa 25 921 885 146 4 346 302 11 127 5 242 575 202
Bandarawela 8 322 1 157 827 1 517 990 18 459 2 694 276 324
Colombo 5 889 181 835 857506 195 132 1 234 523 210
Galle 3 898 271 000 510 721 4 261 785 982 202
Hambantota 15 592 1 334 789 2 262 221 343 946 3 940 956 253
Kandy 6 139 676 251 774 962 212 298 1 663 511 271
Kekirawa 11 427 1 587 713 1 093 506 382 460 3 083 679 268
Kurunegala 10 472 1 962 420 792 234 128 790 2 883 444 275
Kilinochchi 21 895 1 320 157 2 420 770 356 381 4 097 308 187
Moneragala 5 820 674 644 1 108 615 202 306 1 985 565 341
Polonnaruwa 24 813 217 036 3 248 781 391 794 3 857 611 155
Puttalam 6 837 758 282 1 474 115 21 000 2 253 397 330
Trincomalee 21 750 158 100 1 36 556 1 - 194 656 9
Vavuniya 5 096 1 396 152 2 347 368 26 923 3 770 443 740
Total 244 536 16 063053 32 131 252 2 825 229 51 019 534 2092
NOTE 1: Expenses were very low due to ethnic troubles.NOTE 2: If Trincomalee is omitted, the average cost/ha is Rs. 228SOURCE: Irrigation Management Division, Ministry of Irrigation and Power.
The project learned an innovative concept of integrated management of irrigation systems(INMAS). Farmer organizations showed interest in managing their own irrigation systems. It waslearned that organizing farmers for O&M is a slow process. Therefore, adequate long-termprogrammes should be introduced with built in financial and institutional capacity. The lack ofattention given to agricultural extension was a good reason for not achieving targets of OFC. It is alsoclear that farmers alone cannot do O&M of irrigation systems. Farmers' organizations undertakingconstruction activities is a good concept.

Investment in land and water in Sri Lanka…306
LAND SECTOR DEVELOPMENT
Historical perspective
With the increasing land-man ratio the competition for land became quite acute during past 100 to 120years. Due to this, the vast extent of forest that was formerly in existence was depleted, from a high of88 percent in 1884 to less than 20 percent today. Loss of forest cover and encroachment of state landby the landless has led to an accelerated rate of land degradation by water erosion. Slash and burncultivation is widespread in Sri Lanka's dry and intermediate zones. Land degradation has been acontributing factor for poverty and unemployment and a threat to food security. In order to mitigateland degradation and combat poverty country has launched several land sector developmentprogrammes.
TABLE 9Irrigation investment in the Public Investment Programme (PIP)
1978 1979 1980 1981 1982 1983 1984 1985 1986
Rs. Million at current prices
Total PIP 5 449 7 809 12 044 11 765 16 056 16 708 19 521 23 633 27 589
Irrigation
Mahaweli 279 823 1 879 2 218 4 100 4 260 NA NA NA
Other 68 307 489 508 632 895 798 1 043 949
Totalirrigation
347 1 130 2 368 2 726 4 732 5 155 NA NA NA
As percentage of total Public Investment Programme
Irrigation
Mahaweli 5.1 10.5 15.6 18.9 25.5 25.5 NA NA NA
Other 1.2 3.9 4.1 4.3 3.9 4.6 4.1 4.4 3.4
Totalirrigation
6.3 14.4 19.7 23.2 29.4 30.1 NA NA NA
SOURCE: Central Bank of Sri Lanka. Review of the Economy (various years).
There has been extensive national planning of sectoral programmes for land and watershedmanagement. Watershed management is a prominent issue in the National Environment Action Plan(NEAP) of 1992-1996 and 1997-2001.These five-year plans are based on national priorities and on anassessment of resources availability. Components of the plan are incorporated into action plans of theimplementing agencies responsible for various sectors covered.
MAJOR LAND SECTOR PROGRAMMES
Upper Watershed Management Project (UWMP)
Funded by a loan from the Asian Development Bank and government counterpart funds, the ADBforeign exchange component was US$4.9 million and the local currency component was US$11.7million. Sri Lanka's contribution in local currency was US$6 million with additional beneficiarycontribution of US$1.1 million. The total bank loan contribution was US$16.73 million (Rs. 1 223

…Investment in land and water 307
million) and local component US$28.20 million (Rs. 2 144 million). The loan was effective from1998 and last till 2005. The Ministry of Forestry and Environment will have overall responsibility forproject implementation.
TABLE 10Investment in land sector projects
Project Foreign component Local component Loan/grantorganization
UWMP US$ 16.6 million US$28.2 million ADB LOAN
UMWMP 10 million DM - GTZ TechnicalAssistance
FORLUMP 2 million poundsSterling
- ODA TechnicalAssistance
LUPPP NA NA ADB
EA1P US$ 17 million NA WB/IDA
SCOR US$7 million - USAIDSource: Project documents
TABLE 11Public investment in environment related programmes
PIP % GDP %
1996 (actual ) 12 1.2
1996 desired level 20 2.0
Source: NEAP 1998-2001
The objective of the project was sustainable management of critical watersheds, improveincome of project beneficiaries and also to facilitate to develop a watershed management policy. Themain concerns of the project are soil conservation, off farm conservation, establishment of peakwilderness buffer zones, sanctuary management and forest management. It also consists of training offarmers and institutional strengthening component.
The project covers three watersheds: the Uma Oya, the Upper Kalu Ganga and theUdawalawe basins. Originally planned to protect 4 500 ha, the Uma Oya basin was expanded toestablish forest plantations in the upper Udawalawe watersheds and peak wilderness buffer zones inthe upper Kalu Ganga area. In the Uma Oya basin, 4 500 ha will be protected and increased overallcrop production on farmlands is targeted. These interventions will help to reduce the rate ofsedimentation in reservoirs and will benefit 40 000 farm families and sanctuary conservation of22 000 ha.
Upper Mahaweli Watershed Management Project (UMWP)
The Mahaweli Authority of Sri Lanka (MASL) implemented the UMWP with financial aid from GTZfor soil conservation and watershed management of the Upper Mahaweli watershed in coordinationwith other implementing agencies. Activities included promotion of SALT technology, sericulture,drafting conservation plans and promoting mixed farming of crops and livestock.

Investment in land and water in Sri Lanka…308
The introduction of vetiver and SALT appear to be successful in some areas. Due to poormaintenance of hedgerows many are also in neglected state. The project managed to distributeconsiderable planting material to large number of users and there is potential to promote vetiver inother areas if there is national-level interest.
TABLE 12Capital expenditure of the Forest Department
Programme Title Actual 1992 Rs. Million Estimated 1994 Rs. Million
Rehabilitation of capital assets 7.6 6
Management of protected areas 3.6 2
Participatory Forestry Project 72
Forestry Extension 6 4Management & orotectionof forest resources
2.1 7
Forestry research 2 7
Reforestation and development 0.7
Total capital expenditure 22 93
Total recurrent 53 73Source: Forest Department
Forest Land Use Mapping Project (FORLUMP)
Implemented by the Mahaweli Authority of Sri Lanka, the Forest Land Use Mapping Project(FORLUMP) included a TA from ODA and was promoting sustainable management of the UpperMahaweli Watershed. Its goal was to integrate watershed conservation with development activities.Land use and vegetation studies and mapping of forest areas in the upper Mahaweli watershed areas inthe country using GIS technology and satellite imagery. It developed a comprehensive databaseincluding 1:10 000 scale land use maps, slope maps, erosivity and erosion hazards.
ADB funded Land Use Planning Project
Funded by the ADB to strengthen the capacity of the Land Use Policy Planning Division (LUPPD).The Land Use Planning Project is to assist carrying out its functions and land use planning in thedistricts.
Environment Action 1 Project (EAIP)
Initiated in 1996 with World Bank/IDA loan assistance, the Environment Action 1 Project (EA1P)was implemented by the Ministry of Forestry and Environment. Of its US$17 million investment,only US$2.37 million was allocated for the land component while the balance was for infrastructuredevelopment and Ministry of Environment and Environment Authority human resourcesdevelopment. The provincial council of the central province, with active participation of various othergovernment organizations, implemented the land component. The secretary of the Ministry ofEnvironment chairs the land component steering committee while the Chief Secretary of the provincechairs the provincial steering committee. A technical committee advises on implementation oftechnical activities. Micro Catchment (MC) is the centrepiece of the organization structure and amicrocatchment planning team headed by the area divisional secretary. An MC catalyst officer assistsin organizing the farmers.

…Investment in land and water 309
Ten pilot test sites (later reduced to nine) – ranging from 5 000 to 7 000 ha with varyinggradients, rainfall and soil conditions – were selected to implement appropriate technology andtreatments/farming system models. Project implementation is through an interactive planning process,in which implementing agencies work together with villagers to prepare and implement developmentand cropping plans.
Shared Control of Natural Resources Project (SCOR)
Shared Control of Natural Resources (SCOR) was implemented as a component of the NaturalResources and Environment Policy Project (NAREPP) funded by USAID. It was estimated to costnearly US$7 million. The project target was US$6.5 million of USAID and US$0.5 million usergrants plus a country contribution of US$0.15 million. The project began in 1994 and terminated in1999. Implemented by the Ministry of Irrigation, Power and Energy, the participatory action researchproject aimed to develop and test holistic interdisciplinary approaches to integrating environmentaland conservation concerns with production goals in the watershed context. The SCOR approach wastested in two pilot projects, Huruluwewa in North Central Province and Nilwala in the SouthernProvince. SCOR strategy was based on farmers' capacity to organize to obtain the benefit of naturalresources equitably for both production and protection by implementing a selected package ofpractices. The SCOR strategy is based on understanding of hydrological, socio-economic and otherinteractions between different segments of the watershed, experience in group economics and naturalresources management and tenurial security.
During its implementation the programme showed some improvement regarding farmers'management of natural resources to improve their livelihoods, but the programme failed to expandbeyond its geographic limits and failed to sustain project impacts even within the project area. Theconcept of farmer companies introduced by the project has gained momentum in some ISMP areas.The failure of the project interventions to survive in the project area or to spread to other areas wasattributed to the high level technical assistance provided, unrealistic under the normal management.
Reforestation and Watershed Management Project
Implemented by the Forest Department (FD), with USAID financial assistance, the project objectivewas to develop the FD institutional capacity to undertake watershed management in hilly regions andenhance timber and fuel wood production. Under this programme, the FD restored 10 000 ha ofdegraded land in the Upper Mahaweli Watershed. The project also covered forestry extension,forestry research, training and fire protection.
FAO Watershed Management Project
Implemented by the Department of Agriculture with the FAO assistance, the Watershed ManagementProject began in 1975. Several pilot study sites were used to evaluate the degree of soil erosion. Theproject also helped to develop human resources of the Soil and Water Research Division of theDepartment of Agriculture.
Private Investment in Land and Water Development
Private sector investment in water sector development is rare. Several programmes commenced in theMahaweli System C area during the last three or four years for large scale investment in drip irrigationusing Mahaweli water to grow bananas, papaws and coconuts. These programmes covered an area ofabout 500 ha.

Investment in land and water in Sri Lanka…310
Private investment in land improvement is significant in private sector tea, rubber and coconutplantations, in large plantations as well as smallholder tea and rubber plantations. Though governmentprovides some subsidy for soil conservation, the major share of expenditures is met by the landownersthemselves.
The Ceylon Tobacco Company (CTC) conducted the only significant involvement in landsector development in a project in hill country tobacco growing areas. Originally the company gavefinancial assistance to contract growers to establish stone walls for soil conservation. With theintroduction of the Sloping Agricultural Land Technology (SALT) about 10 years ago CTC launcheda campaign to introduce SALT technology in the Uma Oya catchment and other major hill countrytobacco growing areas. The company reported introducing more than 1 000 ha to the system.
A condition for the contract growers to establish SALT before tobacco planting was that themajority of farmers must adopt the system. However, due to various reasons only a few farmersestablished and maintained the SALT system properly and their effectiveness as soil conservationmeasures was unsatisfactory on many occasions due to the poor maintenance of SALT hedgerows.
RECOMMENDATIONS
Water sector
Investment for medium and minor irrigation could be more effective in achieving poverty alleviationand food security than investment for major irrigation projects. The cost of investment per unit area ismuch high in major irrigation projects than in minor irrigation systems. This factor cannot be ignoredin decision making on water sector investment. There is an appreciable change in investment policyon irrigation. The investment in major and new projects is decreasing and rehabilitation costs havereached 25 percent in recent times.
Farmer organizations often are not properly established or effectively organized to manageirrigation systems. Transferring irrigation systems management to farmers must be done moresystematically and will need to be done slowly. The farmers alone cannot satisfactorily manageirrigation systems: continuous technical support from irrigation staff is necessary.
Contracting maintenance works to farmer organizations has shown promising results. Hence,it should be further pursued.
The farmer company concept has shown some promising results, which must be strengthenedin future programmes.
There is a need for state intervention in rehabilitation of village irrigation systems. Selectionof tanks for rehabilitation must be through a proper watershed and water balance study. Furthermore,there is a need to have farmer involvement in decision-making and implementation.
Village community capacity must be fully exploited in village irrigation rehabilitation andmanagement. Farmers practised an effective management of village irrigation systems by indigenousstrategies that prevailed for centuries.
It may be more economical to improve and enhance the quality of existing irrigation systemsthan to invest on new irrigation systems. Rates of new irrigation systems is relatively much higherthan rehabilitation of old irrigation systems.

…Investment in land and water 311
A lack of investment in O&M has been responsible in the poor performance of irrigationsystems. Investment in O&M has not appreciably improved despite having increase in newconstruction and rehabilitation costs over part four decades.
Land sector
Recommendations in the land sector include national action to:
• finalize national land use policy;
• provide economic incentives for integrated land management;
• implement regulatory measures and create research, training and awareness to arrest landdegradation;
• strengthen Department of Agriculture institutional capacity to implement the Soil ConservationAct and technical assistance services;
• create a suitable environment for private sector investment in soil conservation and other longerterm management measures. This is well established in plantation agriculture and tobaccofarming; and
• promote tree crops such as tea, rubber, coconut and export agricultural crops to reduce pressureon natural forests and increase cover against soil erosion.
REFERENCES
Agricultural and Social Sectors Department (West), Forestry and Natural Resources Division. 1998.Upper Watershed Management Project Administration Memorandum. Colombo.
Aluvihare. P.B. and Kikuchi Masao. 1991. Irrigation investment trends in Sri Lanka: newconstruction and beyond, International Irrigation Management Institute, Colombo.
IMMI, 1989. Financing the cost of irrigation: study on irrigation systems rehabilitation and improvedoperations and management. Vol. 3 Activity C. Colombo.
IMMI, 1995. Shared Control of Natural Resources (SCOR) Project: Technical Proposal. Colombo.
Jayasena, W.G. 1988. The Anuradhapura dry zone agricultural project: a socio-economic study of theproject beneficiaries, ARTI, Colombo.
Ministry of Mahaweli Development. 1985. Mahaweli projects and programme. Colombo.
Medagama, J. 1986. State intervention in Sri Lanka’s village irrigation rehabilitation programme,Proceedings of the seminar on public interventions in farmer managed irrigation systems.IMMI, Colombo.
Ministry of Forestry and Environment. National Environment Action Plan, 1998-2001 Colombo..

Investment in land and water in Sri Lanka…312
Nippon Koei, JICA and Sri Lanka Ministry of Irrigation and Power. 2000. Potential rehabilitation ofirrigated agriculture in the dry and the intermediate zones of Sri Lanka. Main Report.Colombo.
Perera, J. 1986. Researching village irrigation system in Sri Lanka, Proceedings of the seminars onpublic interventions in farmer managed irrigation systems. IIMI, Colombo.
World Bank. 1996. Staff appraisal report, Sri Lanka environment action 1 project, 1996. Washington,DC.
World Bank. 1994. Sri Lanka major irrigation rehabilitation project: project completion report.Washington, DC.

…Investment in land and water 313
INTRODUCTION
Thailand is an agricultural country situated in Southeast Asia having a total area of approximately 51million ha. About 70 percent of the north is mountainous, while most of the northeast consists of highplateau which has been deforested and has become mainly agriculture. Eastern Thailand is marineterrace of which 80 percent is agricultural. The southern peninsula has forests, rubber plantation andmining. Land is an important factor and is the foundation for agricultural production in Thailand.
The agricultural growth rate during the past decade has been achieved largely throughexpansion of cultivated land. Agricultural expansion was mainly achieved by clearing forest to createnew farmlands, not through major increases in productivity. This has led to serious land pressures.Forests in Thailand have declined steadily and are now at a critical level, while agricultural land isover-exploited and increasingly degraded. Improper use of land resources has brought about problemsof the loss of soil organic matter – soil erosion as well as land abandoned due to acidification andsalinization. Such problems tend to be increasingly serious and affect the social and economic climate.Consequently, land development is an investment in maintaining and enhancing the futureproductivity of the soil. This paper provides an overview of Thai government land developmentprogrammes.
DIFFERENT PLAN PERIODS
From the early 1960s when the first National Economic and Social Development plan was initiatedthrough the year 2001, when the Eighth plan ended, Thailand progressively conducted a variety ofland management activities. Building institutional and public awareness of natural resource concernsas well as collecting and analyzing land resource information has helped the country identify andrespond to land resource problems. Research activities conducted over many years have providedperspective to help address problems of soil quality and suggest how to increase agricultural yields.Technology transfer through varied training courses and demonstration projects has encouragedfarmers to be aware of the importance of sustainable land development and use.
________________________________________________________________________________
Boonkerd Budhaka, Natural Resources Economics Specialist ..Manu Srikajorn, Soil and Water Conbservation Specialist…
Ministry of Agriculture and Cooperatives, Thailand …________________________________________________________________________________
Investment in land development in Thailand
Investment in land in Thailand…314
However, land development has generally been weak and poorly funded. When compared tothe problems affecting land resources in Thailand, service work can cover only small area. The totalbudget allocated to major land management activities from 1964 through 1992 was US$120 million,but investmnent stepped up in the following years. During the Seventh Plan (1992-1996) US$207million was invested, and during the Eighth Plan (1997-2001), investment rose to US$305 million.Thailand also received external assistance to launch land development projects in the form oftechnical cooperation and grant aids.
In general, during the period Thailand's land development target activities included:
Collection of data for a land database Land use planning and soil suitability maps for cash crops wereestablished. Moreover, the development of MIS, RIS and GIS database systems provide Thailand withthree valuable soil databases – a soil database detailing soil series and related information, a land usedatabase and a database of forest reserves.
Soil improvement and rehabilitation Compost and green manure are applied to improve soil over anarea of 0.9 million ha. Problems such as saline soil and acid soil over an area of 0.86 million ha aresuccessfully managed.
Soil and water conservation Soil and water conservation systems were established over an area of 0.8million ha or 3.7 percent of the affected area. Vetiver grass is promoted as ground cover to be plantedto prevent soil erosion in 0.19 million ha, and a land and water utilization system has been initiated inmore than 76 000 ha.
Research activities During the period 1994 to 2002, government agencies conducted 1 892 landdevelopment research projects. The data and assessments realized through those projects have beendistributed to the public through via computer network. Moreover, the agencies produced soilmanagement reports classifying 62 soil series to be used as a manual for solving soil problems.
Information transfer Government agencies conducted training courses to transfer knowledge anduseful information on land development to local staff and farmers. In addition, 1 007 landdevelopment villages were designated as information centres for transferring proper land developmenttechnology in their locality.
MANAGEMENT APPROACH
The following management approaches have been conducted:
Soil and water conservation measures
Soil and water conservation measures are extremely important for arable area in the country whosemain occupation of the people is agriculture such as Thailand. This is due to losses of soil nutrientsmainly by erosion process on the nuded area with no soil conservation measure applied.Consequently, no more soil nutrients left for plant growth as erosion process go on continuously for along period of time. This will result in poor crop production at the long last. It is not possible toexploit the land for producing crop anymore.
The operation of soil conservation on farmland is being done by regional service centresthroughout the country. The soil conservation practices have been implemented both structural andagronomic types. The most common of the former of soil conservation measure in the field terracehas been widely used in low slope area. Bench terrace is less common measure. Hillside ditches of the
…Investment in land and water 315
Taiwanese type seem to be more potential. At present, various types of agronomic practices areimplemented. These are compost application, green manuring, cover cropping, cropping systems,mulching, tillage practices, tree planting and agroforestry.
Soil conservation measures have been accepted and adapted relatively well in the alleycropping system. The problem of the technique is that it may affect crop yield. The only structuralmeasure being widely adopted now is the small contour platform for growing rubber trees somewhatsimilar but smaller than the hillside ditches of the Taiwan style which is being used to a limited extentfor growing cash crops in the north.
In the past three decades, it can be concluded that soil conservation measures are only suitablefor Thailand's sloping land: high sustainable potential includes green manuring and cover cropping,alley cropping with contour hedgerows of leguminous bushes and agroforestry systems. Of mediumsustainable potential is mulching, strip cropping and crop rotation, alley cropping with contour grassstrips or trash strips and fertilizer application. Conservation tillage, contour cultivation, hillsideditches, terracing, and individual basins have low sustainability in Thailand.
Level of participation of people, farmers associations and NGOS
Most farmers, chief of village, district official and research official in local area.
Technical backup
Depletion of fertility in cropland is brought about by the combined action of many factors such as theremoval of large amount of nutrient materials by annual cropping, losses of soluble constituentsthrough leaching processes, and by the rapid rate of organic matter decomposition as a result ofmicrobial activity in cultivated soils. In addition, the process of erosion is now recognized as one ofthe most serious forces in the rapid depletion of fertility and productivity of cultivated land.
Soil under natural condition with ample vegetation like forest and grassland erodes atnegligible rate. But due to the demands of man for food, fibre, and other necessities that are acquiredmainly through the use of land, some of the forestry and grassland are needed to be removed andreplaced by the demanded crops, which mostly are intertilled or rowcrops. The intertilled crops affordlittle protection to the soil so that erosion has proceeded unchecked. Rowcrops production especiallyon highly eroded land year after year without proper soil conservation, therefore cause serious erosionthen the land will become unproductive.
Ecological restoration
Soil conservation measures can help prevent environmental pollution by means of reduction ofsedimentation. Since soil is slightly eroded due to proper soil conservation measure, many metals bothheavy and light in the soil will not transport to some other places especially to many water resourcessuch as river and brook.
Levels of project success and failure
Soil conservation projects have been implemented for nearly 40 years. At their inception in the early1960s, soil and water conservation stations and units were set up throughout the country, especially inthe north and northeast where erosion was not serious. Initially, terracing was introduced as a freeservice to farmers, linked with ploughing their fields without charge. Farmers were willing to acceptthe new methodology due to the free ploughing service. Later they removed the terraces because ofthe reduced cultivation area. Today, however, some farmers have come to realize the long term

Investment in land in Thailand…316
benefits and accept some soil and water conservation measures and adopt them in their lands(especially in the north).
The obstacles to accomplish such activities may be due to (i) the lack of basic data andinformation needed for establishing appropriate soil conservation measures for the respective area, (ii)present work standards of extension workers do not allow for sufficient contact with farmers, (iii)approaches to farmers has been inappropriate as most projects are of a top-down nature, and (iv) thelack of adoption of soil and water conservation.
Organic matter and waste products
Some 36 million ha (70 percent) of total area can be classified as deteriorating areas with unfertilesoils and limited plant nutrients. Similarly is approximately 31 million ha (60 percent) of lands areclassified as areas facing a serious problem of low level of soil organic matter.
Soil degradation is caused by loss of soil organic matter including the failure ofimplementation to maintain satisfactory organic matter levels. Soil organic matter plays a major rolein soil functions and quality such as a source of nutrients, promotion of favourable soil physicalcondition, soil biotic population and plant nutrients absorption. These beneficial effects to soil organicmatter imply that the maintenance of satisfactory level of organic in soils is essential for sustainablesoil management. Organic recycling for soil improvement project was set up to serve the resolutionof farmers poverty in rural area of Thailand. The project was conducted in the rural developmentcomponent of national development plans, beginning with the Fifth National Economic and SocialDevelopment Plan (1982-1986) until the present Its implementation consists of training, programmein compost making for farmers, field demonstration and extension of compost making and also greenmanure application and its seed production, and some research activities on organic fertilizers as well.It was launched in 38 provinces in the initial stage of the Fifth National Economic and SocialDevelopment Plan and later was extended to 76 provinces. To date, there is a project for sustainableagriculture established by the collaboration between Thailand and the DANCED project.
Most farmers, compost producers, development, environmental and energy-related NGOsparticipate in the organic recycling project.
Technical backup-up
Organic fertilizer is recommended to increase crop yields. Some experimental results conducted ineastern and northeastern Thailand showed that the application of organic fertilizer combined withchemical fertilizer would appropriately raise the crop yield (Figure 1).
Composting is the process of decomposition of waste products from farmlands andbyproducts of agro-industry microbial activities. At present, LDD1 is an effective micro-organism forthe decomposition process selected and isolated by government technical specialists. There are plentyof agricultural waste products such as rice straw, cornstalks and corncobs, soybean pods which can beused as raw materials for compost. Up to now, agro-industry has released various kinds of wasteproduct such as bagasses, rice hull, sawdust and coconut dust which could be converted to organicfertilizer and are included a lot of animal waste in Thailand. Nevertheless, some legumes can beapplied as manure by planting and incorporating in flowering stage to make the soil fertile, theseplants are known as green manure such as Sesbania are recommended for lowland or paddy fieldmean while Crotalaria juncea and Vigna and Canavalia ensiformis are suitable for upland areas.Ecological restoration
Compost can reduce environmental problems due to agricultural waste and industrial waste productsby means of recycle processing from raw materials to organic fertilizer, reduces burning of rice straw

…Investment in land and water 317
in paddy fields and decreases bad odour, insects and pathogens from organic garbage, diminishesenvironmental problems from various kinds of industrial waste such as bagasse, distillery waste, filtercakes from sugar factories and wastewater from canneries. Making compost from water hyacinth cansolve water pollution due to concentrations of water hyacinth clogging canals, rivers and otherwaterways. Compost can maintain the balance of environmental ecology system.
Levels of project success and failure
The Organic Matter for Soil Improvement Project was set up in 1982 to encourage farmers living inunfertile areas, particularly in rural poverty area in 32 provinces to make 50 000 tonnes of compost.Implementation of the project target was achieved because farmers accepted the concept of organicfertilizer. However, the project in the Eighth National Economic and Social Development Plan hadbeen present continuously from the Fifth Plan. Since 1982, 3 889 000 tonnes of compost wasproduced and 41 120 ha of green manure utilization was done by demonstration and extension.Recently, commercial companies have manufactured microbial accelerators for compost making andproduced compost for commercial purposes.
SALINE SOILS MANAGEMENT
Two major measures, (i) prevention and (ii) improvement and reclamation were implemented in salt-affected areas.
Improvement measures are mostly applied in slightly and moderately saline areas. Adoptedtechnology packages, e.g. salt-tolerant plant varieties, compost, organic matter, green manure, and soilamendment are used to improve soil properties and increase yields.
Prevention and reclamation measures are used in strongly saline soils areas. In the Northeastwhere strongly salt-affected soils occur, biological control as reforestation which include screening ofsuitable salt-tolerant varieties of plants with deeper rooting system and high consumptive use of waterare recommended to prevent spread of soil salinization. These plants have been grown in rechargeareas to reduce amount of excess water that percolated to the water table. This lowers the salinegroundwater table to the depth that capillary rise will not bring saline water up to the soil surface.Reforestation minimized salt-affected area in the project site by a proportion of 5:1.
In the coastal areas where saline soils are formed from marine or brackish water sediment andsubjected to inundation of sea water or brackish water during high tide, constructing of dykes orpolders has been recommended to prevent the encroachment of sea water or brackish water and toleach salts from root zone with rainwater or water of lower salt concentration.
Reclamation processes usually required soluble calcium for replacing exchangeable sodium.Desalinization of these soils showed that at the depth of 0-100 cm the average EC was reduced by 40percent, while the highest desalinization occurred at the depth of 20-40 cm.
Level of participation of people, farmers’ associations and NGOs
In northeast Thailand's Nakonrachasima province, inappropriate land use resulted in soil salinizationfrom the movement of saline ground water, and reduction of arable land and forest areas. A pilotproject on reforestation for prevention of soil salinization was operated. Seventy percent of farmersfrom 31 villages agreed to participated and have their land reforested to prevent soil salinization.
Technical backup

Investment in land in Thailand…318
Soil and crop management techniques, biological and engineering control measures have beenconducted to assist in the prevention, improvement and reclamation of lands affected by salinity.Moreover, legislative measure, sometime is needed to protect deterioration of cultivated lands.
Monitoring land salinization was conducted by using satellite imagery in conjunction withground verification. As salt-affected soils are dynamic, monitoring must be a continuing activity. Thisis useful in research, in preparing saline soil maps and, in particular, salinization control. Studies inthe northeast and central plain regions helped classify salt-affected lands and in identifyingimprovements and control measures and research, e.g. programmes in reforestation, increasing cropyields in salt-affected lands and in influencing the effect of shrimp farming in fresh water areas.
Ecological restoration
Environment become important in terms of soil salinization problems. Although inappropriate landusesuch as salt-making and brackish water shrimp farming give farmers high profit, they can causeserious impact on adjacent areas and the environment. This includes the reduced capacity of the landto provide long term economic value, the increased investment cost and the problem of soil and watermanagement. In the northeast, inland saline soils are constantly expanding. Inappropriate land useresults in soil salinization from the movement of saline water, and reduction of arable land and forestareas.
The improvement and rehabilitation of these areas led to the use of marginally suitable andunsuitable land which will result in ecological restoration including sustainable use of land.
Watershed management
The problems of catchment area of major rivers which are being largely degraded by forestencroachment and agricultural exploitation are now the serious situation of the country. The effectshave caused severe erosion and sediment transportation downstream as well as many other changes inhydrological characteristics. The crisis has become more serious in this decade from consequenteffects of flash flood alternate with water shortage. Then the need of watershed management becomesmore imperative and should be taken into consideration.
PROGRAMME ACHIEVEMENT IN TERMS OF FOOD PRODUCTION AND SECURITY
Government has conducted many activities to help farmers solve soil problems and get more foodproduction, including (i) the improvement of low to moderate saline soils by using African Sesbaniaand other kinds of green manure resulting in rice yield per rai increases of 225-300 kg/yr, (ii)improvement of acid soils in the central plain and acid and saline soils in the south by usingagricultural lime with major crop yields increasing by 255 kg/yr and (iii) soil improvement by usingcompost and green manure helps increase major crops by 20 percent and decrease chemicalapplications by 20 percent.

…Investment in land and water 319
Income and employment generation
Government agencies encourage income and employment generation by two main activities:
• Vetiver grass for soil and water conservation Farmers in the implementation area are employed toproduce seedlings and plant vetiver grass and then sell them to the government. Green manureapplications and the policies of purchasing and providing are conducted as follows:
• Purchase seeds of green manure plants such as black bean from the market. If there is notenough seed, government encourages farmers to produce plants and sell them to the government.Seeds will then be distributed to farmers. The local staff will train them how to grow, fertilize,harvest the plants and help them make a production plan. After harvesting, farmers are required togive back seed to the government in the same amount that they received.
Coordinate with local organizations who take care of farmer groups in encouraging farmers toproduce seeds of green manure plants distributed by the government. Government then purchases allproduction by variety, quantity, quality and price.
Hire the private sector to produce the plant seeds. The government agency will identify suchspecifications variety, quantity and quality.
Historical trends
Economic policies
The Eighth Plan identifies one objective concerning the proper utilization of natural resources andenvironment to support sustainability in economic and social development and improvement ofquality of life.
Regarding land resource, one department responsible for soil management has been assignedto reduce soil erosion of at least one million rai per year and rehabilitate at least one million rai a yearof the area troubled by saline soils, acid soils and degraded soils
All development activities have to be implemented in order to maintain the increasing ofagricultural product without harming nature.
The government village to be the representative of the government agency and let themprovide suggestion concerning land development to farmers. The government agency also conductsthe following activities to reduce soil erosion problem.
Land use zoning
Apply GIS to do land use zoning in 255 watershed areas. Establish soil suitability map at the scale of1: 50,000 and the recommendation of appropriate soil management and follow up present land use tomake a marketing plan. Establish land suitability map for brackish water shrimp farming at the scaleof 1: 250 000 in 41 provinces and a map of proper area for brackish water shrimp farming in coastalarea at the scale of 1: 50 000 in 25 provinces.

Investment in land in Thailand…320
Soil and water conservation, soil improvement and soil and land management
Soil and water conservation
Prevent soil erosion by conducting soil and water conservation system and planting vetiver grass.Develop small-scale water sources: construct farm ponds; improve land by establishing proper systemof land and water utilization.
Soil improvement and management
Improve soils by using compost and green manure; reduce soil problems such as saline soils and acidsoils by using non- chemical methods; manage land utilization in the land that have specialcharacteristics such as coastal land, highland and peat land.
Research and development
Government has conducted research studies based on groups of soil series and disseminates theresearch results on its own computer network.
GIS development
A government agency has developed its own computer network and linked data between itsheadquarters and local sites. As a result, farmers and the local staff will be able to use the data to solvetheir problems by one stop services.
Farmers and local staff potential development
The government agency has conducted training courses for the local staff as well as volunteer soildoctor and farmers to improve their efficiency in using high technologies to solve land use problems.
Administrative activities
The government agency has conducted the following three administrative activities: five techniques toincrease work efficiency; public sector standard management systems and outcomes: PSO; Output-oriented budgetary system.
Investment trends and prioritization in land during the Ninth Plan (2002-2007)
The main objective of the Ninth Plan focuses on the development of human resource by improvingeducation and health system, and management of natural resource and environment in accordancewith the development of science and technology.
The plan also emphasizes on the balance between the utilization and the rehabilitation of naturalresource which leads to sustainable natural resource utilization. It is expected that, in the year 2006,soil erosion problem area will be decreased at least 0.8 million ha. and the area of acid soil, saline soilas well as low fertility soil will be rehabilitated at least 1.6 million ha.
Long term perspective plan developed for land development
Aim Maintain the fertility of soil resource to be the base of sustainable agricultural development.
Objective To achieve sustainable land use by soil and water conservation and soil improvementpractice.

…Investment in land and water 321
Transfer land development technology to the public and promote popular participation to beresponsible for soil resource management over the long term.
Strategies Land survey and classification by zoning land use area in accordance with client needs ineach agency and follow up the situation of land utilization in order to evaluate and set the agriculturalproductivity and marketing plans.
Improvement of integrated soil resource management with focusing on area participation
Development of land resource management and research in order to get optimum use by acceleratingthe conduct of soil management and research according to group of soil series. GIS technology maybe used for this activity.
Develop systems of technology transfer and public relation, land development service, soildata, and land utilization for the target group. Technology transfer will be done through the centre ofagricultural technology transfer of each subdistrict: giving soil data, developing arable land forsustainable agriculture. Each activity will be conducted by using GIS technology.
Develop land information and GIS systems throughout the country as one-stop servicecentres; improvement of working system and development of capacity building by: supporting privatesector and educational institutions to participate in government activities; and training governmentofficials to use new technologies of administration, technique and operation concerning their job;reorganization by decentralizing some of officers to work in local area to support and strengthen thework of the local stations; developing work standard of the government agencies by using PSO, fivetechniques to increase work efficiency and output-oriented budgetary system.
CONCLUSION
Relate land and water development activities to the FAO Special Programme for Food Security. Atpresent, sustainable agriculture is well known among researchers and should extend to the farmer. Theprinciple of sustainable agriculture is to exploit natural resources such as organic fertilizer andbiofertilizer as much as possible in producing crops and to try to reduce the amount of chemicalsubstances in both fertilizer and pesticide. This can be achieved by introducing crop diversity andexploiting natural resources as much as possible.
The use of organic fertilizer from organic matter for soil improvement is well known amongpeople who are aware of the toxicity of food due to the application of chemical substances. Suchpersons require organically produced fruits and vegetables so that now that there are specializedcompanies selling organic produce, and there are farmers willing to produce organic fruits andvegetables.
Total agricultural waste in Thailand is approximately 36 million tonnes/year. Industrial wasteis 23 million tonnes/year and animal waste is 22 million tonnes/year.
Shrimp culture has been done in 22 455 ha in 23 provinces of arable land in Thailand's centralplain. The rapid increase of inappropriate land use has resulted in decreasing arable land. Moreover,discharged saline water from shrimp ponds into adjacent areas by irrigation canals or seepage ofsaline water has caused soil salinization. This situation has impacted the availability of land forcultivation. In July 1998, the government acted with regard to such salinity problems, introducing a

Investment in land in Thailand…322
total ban on shrimp farming in freshwater areas throughout the country and at the same timeannouncing its intention to reclaim the land to be use for agricultural purposes.
The adoption of sophisticated soil and water conservation technologies especially propercropping systems plus adequate conservation measures and the application of the concept ofsustainable agriculture will lead to the alleviation of farmer poverty.
Economic returns on investment of soil and water improvements
Agricultural land use often results in land degradation and the reduction of productivity. Degradationof land results in loss of current income and increase the risk and also threaten prospects for economicgrowth. Despite relatively low average return to agriculture, the cost of degradation, and thus thebenefits of conservation, are substantial. However, there are methodological problems in estimatingcost and benefit of soil and water conservation on regional or national level.
The economic impacts of erosion can be analyzed from two perspectives, on-site impacts andoff-site impacts. Farmers are concerned only with the on-site costs and benefits of soil erosion,whereas society must also be concerned with off-site or external costs. Off-site costs and benefits arean integral part of the economic impacts on land degradation.
From the farmers perspective, costs of soil erosion consists of two components, direct cost;costs incur to farmers to undertake soil conservation measure and foregone output; the loss of currentoutput results from using less soil. The benefits of soil conservation are the gains in current and futureproduction and thus income incurring to farmers from having more soil available today and in thefuture. In measuring the on-site costs of soil erosion, the main objective is to estimate the presentvalue of net income lost through excessive soil erosion, that is the difference between present value ofnet returns of farming system with soil conservation and present value of net returns with erosion.
Besides the on-site impacts, there are many possible off-site or downstream impacts of soilerosion for instance, reservoir sedimentation, effects on agricultural in lowlands, impacts on watersupply and potability and impacts on drought or flood cycles. In measuring off-sites costs is toestimate the present value of any external costs arising from the downstream impacts, that is theforegone net economic benefits from any loss of downstream economic activity.
Adoption of soil conservation measure and maintenance and improvement if such practicesare the ultimate measures of success of any soil conservation initiative. Farmers, especiallysubsistence ones, have limited financial resources to invest in soil conservation. Also factor, such asland tenure, credit and marketing systems discourage long-term investment and land productivitypreservation. Farmers are reluctant to undertake efforts not providing income or reducing their inputcosts, either in cash or in-kind services. This means that conservation measures must have visibleshort-term benefits to farmers; benefits they would appreciate might be increased yield per land unitor better production per unit of labour. Technology that is appropriately designed and properlyimplemented is necessary for success.Lessons from successful projects
The Organic Recycling for Soil Improvement project of the Land Development Department hassucceeded in making Thai farmers aware of the benefits of using agricultural organic waste ascompost for soil improvement. The department produces 150 000 packages of microbial activatorLDD.1 every year for rapidly decomposing plant residues to make about 150 000 tonnes of compostper year. Microbial activator LDD.1 consists of such beneficial microorganisms as bacteria,actinomycetes and fungi having high efficiency in decomposing plant residues. Furthermore, thedepartment promotes green manure production in agricultural areas and supports green manure seedprogrammes for farmers.

…Investment in land and water 323
Management approach for land development projects
At present, government agencies have soil 'doctor' units throughout Thailand. Such units help farmersafford and apply the new technology in soil and water conservation and soil improvement in theirfields so that farmers can make better use of their land area, increase their income by increasing cropproduction and preserve and improve sopil quality. In addition, soil and water conservationdemonstration villages have also been set up as the pattern for farmers to adopt on their land.
An Organic Recycling Project for Soil Improvement has been introduced and promoted toThai farmers by technical specialists from regional centres in 69 provinces. Thai farmers learn aboutsoil management focusing on organic agriculture concerns such as building soil by adding compost,animal manure, green manure, and plant residues such as unburned rice straw and mulches.
Concering watershed development, management activitiy programmes have begun to improveland use such as:
• an Integrated Approaches Programme to generate a potential model of a participatory integratedmanagement system at watershed scale. Popular participation techniques such as RRA and PRAencourage farmer participation and meet the needs of land users;
• a Critical Watershed Classification System has been launched to classify the degree ofdeterioration hazard set at four levels. Its evaluation methodology includes soil erosion, soilfertility, acidity levels, drought and flooding. The programme is designed to reveal criteria forrehabilitating the planning process;
• Land-use planning at watershed scale includes 25 major watersheds and 255 subwatershedsthroughout Thailand.
Examples of development projects in land sector
The Organic Recycling Project for Soil Improvement is one example of development projects in theland sector. There is an extension policy regarding soil organic matter management using agriculturalorganic wastes to farmers in Thailand's land development villages. Officials in all regional centressupport and promote the use of microbial activators (LDD.1) and green manure seeds as well asgiving agricultural extension information on the role of organic matter in soil and organic wasteutilization for producing organic fertilizers.

…Investment in land and water 325
INTRODUCTION
Under its three most recent National Economic and Social Development Plans – the Fifth, Sixth andSeventh plans respectively – Thailand experienced a satisfactory expansion of its Gross DomesticProduct (Table 1). Agriculture accounted for 69, 42 and 35 percent respectively in these plans,demonstrating that the agricultural sector is a very important but a not very efficient part of Thailand'snational economic system.
Although Thailand is one of the world's top agricultural exporters and while the trend ofproduction per hectare is rather high, its main economic crops such as rice and corn still have quitelow production efficiency compared to other countries. In this regard, Thailand needs additionalresearch and development (R&D), improvement of fundamental structures for increasing productionefficiency (including irrigation), management, quality control in production and technology andexpanded marketing.
BACKGROUND AND TRENDS
Since 1961, Thailand's water development for irrigation was implemented under the strategy anddirection of comprehensive National Economic and Social Development plans. At the beginning, theemphasized target was construction of large- and medium-scale irrigation projects to increase newirrigable areas as much as possible to guarantee or reduce the risk of a lack of water in the agriculturalsector. Development also included targets for hydropower development.
As a result of development in earlier phases, Thailand during the Fifth Plan was able toexpand irrigable areas to 3.55 million ha or about 25 percent of its total agricultural land. Laterstrategy and policies in irrigation development changed as the result of competition in economicdevelopment as Thailand changed from being primarily agricultural to having an increasing emphasison the industrial export sector as a newly-industrialized country.
________________________________________________________________________________
Boonkerd Budhaka, Natural Resources Economics Specialist, and ..Manu Srikajorn, Soil and Water Conservation Specialist…Ministry of Agriculture and Cooperatives, Thailand and …
Vason Boonkird, Engineer for Operation an Maintenance…Royal Irrigation Department, Thailand…
_________________________________________________________________________________
Thailand country reporton investment in water

Investment in water in Thailand…326
TABLE 1Thailand's agricultural sector and Gross Domestic Product (NESDB)
National Economic andSocial Development Plan
Gross DomesticProduct (GDP)
Domestic product inAgricultural sector
Agriculture as % ofGDP
Fifth Plan 5.34 3.69 69.10
Sixth Plan 11.37 4.82 42.39
Seventh Plan 8.21 2.91 35.44
This led to a lack of water from existing developed water resources due to the following reasons:
• increasing demand as farmers learned to make better use of their land, requiring more water fromexisting resources;
• growing water requirements in non-agricultural sectors, a result of national industrialdevelopment policy and investment, as well as population growth;
• low efficiency in irrigation usage because there were no irrigation fees;• lacking an effective plan for basin development, duplication by many agencies in water resources
development negatively affected potential basin development; and the• limited topographic conditions for building large-scale irrigation projects together with substantial
NGO opposition.
Economic crisis in Thailand in 1997 and the devaluation of the baht resulted in economicrecession and a stretching of finances leading to budget shortages. In addition, the new constitutioncalled for decentralization and the participation of local people for transparent implementation. Thedirection of water resources development for irrigation at present is reflected in the National WaterPolicy and Vision of the Royal Irrigation Department. It concentrates on increasing irrigation wateruse efficiency in existing irrigation projects instead of new water resources development andextension of irrigable areas. RID has attempted to emphasize farmer participation in on-farm watermanagement. Construction of on-farm distribution systems by farmers themselves with governmentassistance is described in the Ditch and Dyke Act of 1962 (Buddhist Era 2505) and the Land
Figure 1
Com paring Dom estic Product in
Agricutural Sector with GDP
3.694.82
2.91
-
2
4
6
8
10
12
GDP
Agriculture Sector
F

…Investment in land and water 327
Consolidation Act of 1968 (B.E. 2511). The objective is to promote the most effective use ofirrigation water as well as to prevent conflicts among farmers during any water use crisis.
THAILAND'S NATIONAL WATER POLICY AND VISION
By 2025, Thailand is projected to have sufficient water of good quality for all users through efficientmanagement, organization and a legal system to ensure the equitable and sustainable use of its waterresources with due consideration to the quality of life and participation of all stakeholders.
Thailand's national water policy
Thailand's nine-point National Water Policy and Vision as set forth by the Royal IrrigationDepartment details how this will be implemented:
• Accelerate promulgation of a Draft Water Act as the framework for national water managementby reviewing the draft and implementing all necessary steps to make it effective, includingreviewing existing laws and regulations;
• Create water management organizations both at national and river basin levels with supportivelegislation. The national organization is responsible for formulating national policies, monitoringand coordinating activities to fulfil the policies. The river basin organizations are responsible forpreparing water management plans through a participatory approach;
• Emphasize suitable and equitable water allocation for all water use sectors, and fulfil basic waterrequirements in agriculture and domestic uses, to be achieved by establishing efficient andsustainable individual river basin water use priorities under clear water allocation criteria,incorporating beneficiary cost sharing based on the ability to pay and the level of services used;
• Formulate clear directions for raw water provision and development compatible with basinpotentials and demand, ensuring suitable quality while conserving natural resources andmaintaining the environment;
• Provide and develop raw water sources for farmers extensively and equitably in response to waterdemand for sustainable agriculture and domestic uses, similar to deliveries of other basicgovernmental infrastructure services;
• Include water related topics at all levels of the educational curriculum to create awareness of thevalue of water, understanding the importance both of necessary and efficient water use andresponsibility in maintaining natural and man made water sources;
• Promote and support participation, including clear identification of procedures, clear guidelineson the rights and responsibilities of the public, non-governmental and government organizationsin efficient water management. Water management includes water use, water source conservation,monitoring and preservation of water quality;
• Accelerate preparation of plans for flood and drought protection, including early warnings,damage control and efficient and equitable rehabilitation with proper use of land and other naturalresources; and
• Provide sufficient and sustainable financial support for action programmes in line with nationalpolicy, including water-related research, public relations, information collection and technologytransfer to the public.

Investment in water in Thailand…328
Water policy visions in the Ninth National Economic and Social Development Plan
Vision regarding natural resource management Thailand's 1997 Constitution is the fundamental baseof national development and accelerates participatory rural development, decentralization, naturalresource conservation and environmental protection, and good governance with public emphasis onaccountability and highly efficient management. The vision (by steps) leads to good connectionsbetween subplans, good governance, high participation fat the rural, regional and national levels isexpected and effectively developed in all areas.
Vision regarding agricultural production Thailand envisages agricultural production based on thesustainable use of natural resources, without prejudice regarding social status and to be advantageousto the environment.
Vision regarding local participation in irrigation management and cost sharing To change thetraditional idea of farmers being one-way receivers from government (the government sector invests,manages, maintains and repairs irrigation system without payment) to be full participatants in terms ofmanagement and sharing the cost of operation and maintenance.
FIGURE 2Flow chart – preliminary plan of Royal Irrigation Department
Because of continued development of efficient irrigation practices since implementation of theFifth National Economic and Social Development Plan, large-, medium- and small-scale irrigationprojects with a total capacity of 32 million m3 covering some 3.52 million ha were built (Tables 2 to7).
CONCEPT AND DIRECTION OF INVESMENT
Although Thailand's irrigation water requirement was projected to increase at the rate of 1.1 billion m3
per year, average annual water resources capacity increased only 0.97 million m3 (Khon KaenUniversity, 1986). Water shortage trends indicated above together with the slowing rate of expansion
• Water Quality Improvement• Concession
• River Basin Management• PIM & CS
• NEYRTEC Distributor• AVIO Automatic Gate• Telemetering System• GPS• Processed U-shape canal
• Pasak Earth Dam• Tha-dan Dam• Bang Prakhong Diversion Dam• Pak Pa-nang Basin Dev. Project• Kho-Lok River Mount Project
Irrigation AreaCapacityBudgetaryWater Quality
��������������������PAST
IMPLEMENTATION
PROBLEMS andOBSTACLES
Worldwide waterproblem & crisisAgricultural productsEconomic crisisParticipatory by people
Constitution (1998) & CabinetResolutionsNational Water and otherPoliciesAgricultural Product andManagement Visions
POLICY & VISION
IMPLEMENTATION PLAN
Water projectdevelopment
Irrigation systemmodernization
Management
Concession & WaterQuality Improvement

…Investment in land and water 329
of new irrigated areas (Table 7) illustrate Thailand's difficulty in fulfilling its water demand. At thesame time, environmental conservation is getting favourable attention in regard to water resourcemanagement.
TABLE 2Budget of Royal Irrigation Department (RID), Ministry of Agriculture & Cooperatives (MOAC)
Year National Budget(billion baht)
MOAC budget(billion baht)
RID budget(billion baht)
RID budget as % ofMOAC budget
1992 460.4 35.450 17.753 52.53
1993 560.0 44.329 21.674 50.08
1994 625.0 54.694 24.435 48.89
1995 715.0 63.924 29.089 44.68
1996 843.2 74.351 36.180 45.51
1997 984.0 81.825 42.456 48.66
1998 800.0 62.581 30.567 51.89
1999 825.0 65.408 32.049 48.84
2000 860.0 69.227 35.638 49.00
2001 910.0 68.317 33.498 51.48Source: Office of Budget Programming and Project PlanningNote: 1992-1997 US$=25 baht; from mid-1997 the baht fluctuated. In late 2001 it was about 44 Baht/US$1.
Therefore, it is necessary in Thailand's present and future water resources development toemphasize qualitative development through sustainable development approaches. This means toincrease irrigation efficiency by using appropriate technology, to add value to irrigation water as wellas to promote participatory irrigation management (PIM) by holding public hearings. The RoyalIrrigation Department has supported the participatory approach and is ready to adapt its future planswith such participation. RID also introduced new approaches in irrigation management by:
FIGURE 3Ministry of Agriculture and Cooperatives (above) and Royal Irrigation Department (below) budget
0
20
40
60
80
100
1992
1993
1994
1995
1996
1997
1998
1999
2000
2001
Fiscal Year
Budg
etar
y (m
illion
Bah
t)

Investment in water in Thailand…330
• introducing appropriate technology in conjunction with local technology, adapting to partial orfully automated systems, for validity, reliability, speed, and equity support through an entirenetwork or subnetworks;
• using equipment to replace skilled labour or local labour attracted from agriculture to industry;and
• decreasing water loss in canal systems by using concrete linings or by replacing pipe systems.
Additional approaches that Thailand has been implementing include:
• reducing water losses due to inefficient water resources management, expanding storage farmpond capacity (both as supplementary sources and as night storage);
• altering criteria or redesigning proper and easily operated irrigation works;
TABLE 3Fiscal Year 2000 & 2001 Budget for Royal Irrigation Department classified by plan
PLAN Yr. 1999 % of Total Yr. 2000 % of Total
1. Management plan for agricultural water resource development 3.718 11.60 3.647 10.23
2. Large Scale Water Project Plan 6.881 21.47 8.793 24.67
3. Medium Scale Water Project Plan 3.987 12.44 5.302 14.88
4. Operation Maintenance and Development Plan 10.657 33.25 10.853 30.45
5. Land Used & Standard Service Plan 0.600 1.87 0.615 1.72
6. Research & Development plan for agricultural water resource 0.114 0.35 0.125 0.35
7. Rural Development Plan 5.950 18.56 6.124 17.18
8. Public Service Plan 0.104 0.32 0.108 0.30
9. National security Plan 0.040 0.12 0.070 0.20
Total 32.049 100.00 35.638 100.00
Source: Office of Budget Programming and Project Panning
• developing flood management and adjusting paddy cropping systems suitable for lowland areas;
• privatization and irrigation management transfer (IMT). Government plays a role as the technicaladvisor, supporting productivity improvement and directing implementation according to policyto maintain fair procedures;
• supporting entrepreneurship, ownership and partnership by encouraging farmers to undertake self-maintenance and cost sharing;
• replacing function structures by 'process structures' to create a system of participatory agencies.

…Investment in land and water 331
SOME IMPLEMENTED PROJECTS
To accomplish the objectives of the policy and vision and to solve water shortage problems, Thailandhas implemented various construction projects together with improvement of irrigation system andguideline in water management, classified as water resource development projects, irrigation systemmodernization, management and concession and water quality improvement
TABLE 4Projects and programme loans allocated and pending approval 1995 to 2007
Source Description Budget 1995 1996 1997 1998 1999 2000 2001 2002 2003 2004 2005 2006 2007
KfW MIP-II Project 936.00
JBIC SSIRP (small-scale irrigation improvement &rehabilitation project) 2 010.30
Pasak Irrigation Project 1 529.36Miyazawa Project 4 335.00Grand Total (approval) 8 810.66
ADB+JBIC ASPL 5 700.00JBIC Tha-sae Project 2 788.96
Upper Thachin Project 2 908.12Flood Protection Project (Eastern Bangkok) 9 800.00Mae-Wong Project 4 933.24
WB Dam Safety Project 2 004.00IMM Project (Chao-Phraya Basin) 3 600.00Grand Total (pending approval) 31 734.32
Source: Office of Budget Programming and Project PanningNOTE JBIC: Japan Bank for International Cooperative; ADB: Asian Development Bank; WB: World Bank
TABLE 5Irrigation area and capacity by regions (Fiscal Year 1998)
Number of Irrigation Projects
Region Large, Medium Small Total
Irrigation area
(million rai)
Capacity
(million m3)
193 1 771 1 963 3.78 23.97
276 4 023 4 299 3.10 5.37
57 624 681 7.65 0.51
74 530 604 1.96 0.66
49 299 348 3.20 1.36
82 987 1 069 1.99 0.27
731 8 234 8 965 21.69 32.16Source: Office of Budget Programming and Project Planning.Note: 1 hectare = 6.15 rai

Investment in water in Thailand…332
Water project development
Expansion of irrigation area shown in Table 7 reflects the difficulty in building new water storage insupport of rapidly rising water demand. However, Thailand continues to develop new water storage tosupport extended agricultural productivity. Existing irrigation projects are:
• The Pasak Cholasit Dam in Lopburi province (a zoned earth dam height 31.50 m, length 4 860 m)constructed from 1995 to 2002 (EIRR = 12.80 percent). Its main purpose is to store water forirrigating 21 600 ha and providing supplementary irrigation water for a lower Chao Phraya WestBank area of 320 000 ha. It also provides water for domestic use in metropolitan Bangkok and itsvicinity, as well as providing flood protection for Lopburi and Saraburi provinces, promotingfisheries, transport waterways and water pollution control;
TABLE 6Progress and trends in 10 years of water resource development
NationalEconomic and
SocialDevelopment
Plan
Irrigation Area(million rai)
% Irrigationarea overtotal Area
Capacity(million m3)
% increase incapacity overprevious year
First Plan 9.720 3.031 14.472 n.a.
Second Plan 10.960 3.418 15.079 4.19
Third Plan 14.380 4.484 24.347 61.46
Fourth Plan 15.840 4.939 25.462 4.58
Fifth Plan 18.710 5.834 28.669 12.60
Sixth Plan 20.710 6.458 30.200 5.34
Seventh Plan 21.680 6.760 31.662 4.84Eighth Plan 22.390 6.982 32.314 2.06Ninth Plan 28.490* 8.884* 36.599* 13.26*Tenth Plan 30.710* 9.576* 39.253* 7.25*
Source: Office of Budget Programming and Project PlanningNote: Asterisk (*) denotes projected figure.
Figure 5 Capacity by region
North77%
North-East15%
South1%
West4%
Central1%East2%
Figure 4 Irrigation area by region
North17%
Central36%
East9% West
15%
South9%North-East
14%

…Investment in land and water 333
TABLE 7Increased irrigation area in percentage by NESD PlanNational Economic and
Social Development PlanIrrigation Area
(million rai)% Irrigation Area Increase by
NESD Plan
1-3 14.3804 15.840 9.2175 18.710 15.3396 20.710 9.6577 21.680 4.4748 22.390 3.171
Source: Office of Budget Programming and Project Planning
• The Khlong Tha Dan Dam in Nakhon Nayok province is a roller-compacted concrete structurewith a height of 93.0 m, a length of 2 720 m and a capacity of 224 million m3. Built from 1997 to2004 (EIRR = 10.85 percent), its main purpose is to store water for irrigating an area of 29 600ha, to provide flood control for the upper Nakhon Nayok basin, to reduce soil acidity and fordomestic water supply of approximately 16.0 million m3/year;
• Bang Pakong Diversion Dam, Chachoengsao province, is built of reinforced concrete, at a lengthof 166.0 m with a gate electronically controlled by computer. Built from 1996 to 2001 (EIRRvalue of JICA study is outdated), its main purpose is to provide water storage for irrigating 14 720ha, providing protection from salinity intrusion, for fisheries, and domestic water supply of 18.90
Figure 8 % Increased Irrigation Areaby NESD Plan
-
5
10
15
20
4 5 6 7 8NESDPlan
Ar
Figure 6 Irrigation area classified by NESD Plan
-
5
10
15
20
25
30
35
1 2 3 4 5 6 7 8 9 10NESDPlan

Investment in water in Thailand…334
million m3/year, 69.70 million m3/year for industrial use and to maintain waterway levels andclearance for local transport;
• Pak Phanang Diversion Dam, Nakhon Si Thammarat Province, built from 1995 to 2002 (EIRR =13 percent) has as its main objective salinity control, storage of 70 million m3 of fresh water,irrigating 83 360 ha, providing flood protection in the Pak Phanang basin, reducing soil acidityand managing freshwater and saltwater irrigation areas;
• The Kolok River Improvement Project in Narathiwat province, includes 30 breakwaters andgroins of 750 m. Built from 1996 to 2002 (EIRR = 16.60 percent), its main purpose is protectionof 22 km of shoreline, conservation of ocean resources in the economic zone, fisheries promotion,aquatic animal nurseries in the lower Kolok and Tak Bai rivers and flood protection in the lowerKolok Basin.
Figure 8 Capacity Classified by NESD Plan
-5
1015202530354045
1 2 3 4 5 6 7 8 9 10NESD Plan
Capa
city (
milli
on m
3)
Figure 7 Capacity Classified by NESDP
-
10
20
30
40
50
1 2 3 4 5 6 7 8 9 10NESDP NO.
Capa
city (
mil.
Cu.m
.)

…Investment in land and water 335
Irrigation system modernization
Thailand has introduced new technologies in new projects appropriate to the environment with greaterefficiency in irrigation water control such as:
• Overnight storage and distribution systems: automatic control and water distribution to farms byreplacing farm turnout (FTO) using NEYRTEC distributors;
• Hydraulically automated controllers or AVIO automatic gates: hydro mechanical devices forwater level and discharge control which simultaneously controls water moving through irrigationstructures and in all conditions of water sources;
• Telemetering systems: advanced information technology with World Bank support in cooperationfrom the Electricity Generating Authority of Thailand (EGAT), telemetering helps plan andmanage irrigation systems in response to basin runoff, supporting a more efficient use of runoffand irrigation waters including flood risk warnings for adequate preparation. Telemeteringsystems were introduced in the Chao Phraya and Pasak River basins;
• Geographic positioning system (GPS): used in a reservoir sediment survey at Lat KrathingReservoir, Chachoengsao province in conjunction with an echo sounding device, contour mapsare produced and reservoir capacity is recalculated;
• Ready-made U-shaped canals: introduced in 1997-1998 in on-farm development, prefabricatedcanals reduce construction time and minimize excess right of way usage, increasing managementefficiency. Pilot projects are located in Chiangmai, Ubon Ratchathani and Krabi provincescovering a total irrigated area of 2 080 ha.
Management
In Thailand the main objective is to coordinate development and water resources management as asystem, linking specific natural resource concerns with broader environmental impact.
Participatory irrigation management and cost recovery, Thailand has set up two types of pilot projects,river basin management and participatory irrigation management (PI) and cost sharing (CS) projects.
• River basin management policies include:
Water resources development policy Water resources development master plan for 25 basinstogether with the implementation plan of large and medium scale irrigation projects will beprepared. Suitable water resources will be carefully identified in order to control margin water forsustainable irrigation and flood protection through good feasibility studies and design;
Water resources conservation policy Promoting conservation and rehabilitation of water resourcesto develop and improve operation and management structures of water resources for agriculture aswell as domestic water. Measurement for operation, construction, conservation and maintenanceof water resources ecology will be provided;
Operation management policy Development and utilization planing for water resources as well asemphasis of basin management, project management and on-farm water management. Supportwater management activities and human resources development in water management. Researchand design irrigation water utilization boundaries;

Investment in water in Thailand…336
Improvement and maintenance policy Prepare master plan in improvement and maintenance, newdevelop/improvement project in accordance with the local administration and economicalcondition;
Conservation of agricultural land in irrigation area policy Emphasize productivity efficiency byusing inefficient natural resources, identify the irrigation promotion zone;
Information technology policy Develop information concerning basin system and standardizationof information. Using this information beneficially among policy and administrative levels.Follow-up and evaluate including updating information and connection by the up-to-date network. Develop human resources; and
Public relations for irrigation policy Emphasize popular participation in water resourcedevelopment and conservation, promotion and publication in development and the utilization andconservation of water resources. Demonstrate and inform those concerned with irrigation projectsand conduct public hearings.
• Participatory irrigation management (PIM) and cost sharing (CS) comprises:
Participatory irrigation management aims to strengthen farmer ability to participate in irrigationmanagement, most importantly to build-up decision-making capacity in farmer organizationswhich corresponds with government policy in decentralization, privatization and communityparticipation.
Cost sharing (CS) allows farmers’ sense of ownership by cost sharing in maintaining irrigationstructures and facilities. Ready to use their rights to protect and maintain the project in sustainableways. Costs beginning with construction extend through operation and maintenance (O&M).Farmers participate in intensive on-farm development and land consolidation cost. However,farmers participate in maintenance costs of small-scale irrigation projects.
Irrigation management transfer (IMT) Privatization of O&M of irrigation projects may beginwith outside contracting and at the same time, developing/strengthening farmer organizations byacknowledging and improving their capability, power of decision and readiness for projecttransfer through PIM. At the monitoring and evaluation (M&E) stage, performance indicators andservice standards, PI&SS guides implementation, for example, of the ratio of land use to totalirrigation area, irrigation efficiency, and farmer satisfaction with irrigation water sharing.
• Thailand has also developed and experimented with other types of management, including:
Privatization of water resources development, transferring maintenance responsibility ofirrigation projects to the private sector and water users groups by contracting. NEWMASIP, theleft main canal of the Yang Chum Irrigation Project and 10 other large and medium scaleirrigation projects were selected as pilot projects (ASPL).
Integrated management of agro-industrial development and integrated rural development projectsin irrigation area. Start with operation planning, preparation of whole season irrigation water,agricultural research and development (breeding and methodology), agricultural promotion andmarketing with price guarantee at the pilot project of the country, Nam Oon Irrigation Project,Sakhon Nakhon Province.
Development-oriented research on agrarian systems (DORAS) entitled Chao Phraya Basin Watermanagement: guidelines for development of efficient and fair water management. Research on
…Investment in land and water 337
growing paddy in flood-prone lowland areas and management of floodwater in the floodplain ofthe Chao Phraya Basin. Researchers applied the Kamling theory of flood management initiated byHis Majesty the King of Thailand, dividing the flood area into drainage units or “boxes” withstructures to control waterflow. Paddyfield floodwaters can then be adjusted.
Concession and water quality improvement
In addition to cost-free development from government, which has the main responsibility inagriculture, Thailand has considered other types of development such as partial concession usingwastewater from the agricultural sector for domestic and industrial purposes. The projects are:
• Dork Krai-Mabtaput-Sattahip pipeline project: implemented by the Eastern Water ResourcesDevelopment and Management Co., Ltd. Under the concession, 72 million m3 of water from theDok Krai reservoir is supplied for domestic and industrial use. In any water shortage, the RoyalIrrigation Department may set irrigation water for agricultural purposes as the main priority.
• Water Quality Improvement: In addition to providing new water resources and increasingagricultural management efficiency for projects initiated by His Majesty the King, the RoyalIrrigation Department (RID) concentrates on water quality improvement. RID conducts sponsoredresearch and development under the Chai Pattana Foundation. Experiment has been conducted inthe area of wastewater and found the tool can work satisfactory
CONCLUSION
Thailand is preparing the fundamental structure in order to increase efficiency in the agriculturalsector, which is very important for our country considering the ratio of agricultural sector over theGDP.
Different conditions in the past together with the economic crisis of the country and the otherfactors in guidelines, measurement, policy and vision such as constitution 1997, national water policy,vision frame in natural resources management, agricultural productivity, and farmers’ participation inthe management and cost sharing. Therefore, Thailand must change its concept of water resourcesdevelopment from quantitative qualitative orientation. Implementations include increased irrigationefficiency, quantity of irrigation water, promotion in farmers’ participation for water management.
Guidelines for Thailand's development can be classified in four main categories: 1) waterresource development projects, 2) irrigation system modernization, 3) management improvement, and4) concession and water quality improvement. Application of these concepts will solve Thailand'ssocio-economic problems as well as secure sustainable development in the agricultural and irrigationsectors.

Investment in land and water in Viet Nam…338
BACKGROUND
Viet Nam's main land body extends along the Eastern coast of the Indochinese peninsula facing thesea in the east and south. It shares borders with China, Laos in the north and Cambodia in the west.Viet Nam lies entirely within the northern tropical zone. Average annual rainfall varies from 800 mmto 2 000 mm. Viet Nam's total land area is 33 million ha of which nearly 20 percent or more than 7million ha is now cultivated. Some 4.24 million ha are planted in rice. With a population of77 865 500 (2000) and an annual growth rate of 1.51 percent (1999), arable land is becoming a scarceresource. Viet Nam remains predominantly an agricultural economy. The agricultural sector employsmore than 60 percent of the labour force and accounts for 30 percent of total GDP.
While it may seem that Viet Nam has abundant water resources, the amount of watergenerated is low compared to other countries (4 200 m3 per capita). Water resources vary in differentseasons and geographic areas. Some 70 to 75 percent of annual rainfall comes during three to fourmonths in the rainy seasons, with up to 30 percent of annual rainfall coming in only one month, oftencausing serious floods. Rainfall in the three driest months normally accounts for 5 to 8 percent.Sometimes, however, it is as little as 1 to 2 percent which causes serious drought in many areas – asseen during the drought caused by El Nino in 1998-1999. Natural calamities such as storms, floodsand droughts have traditionally threatened agricultural production and the living standards of peoplein many areas of Viet Nam. In addition, there are also problems in many areas with a high soil contentof aluminium and salt.
The Government of Viet Nam considers the agricultural sector to be foundational to thesuccessful implementation of industrialization and modernization of the country. Therefore it hasgiven and continues to give high priority to agricultural development. Investment in agriculture hasbeen increased in the past and is projected to expand in coming decades.
Investment in agriculture from the state budget during the period from 1996 to 2000 was21 594 billion dong (15 000 dong = US$1) or US$1.44 billion or 21.75 percent of total investment inall social and economic programmes. The budget allocated for agriculture and rural infrastructureimprovement was 1 432 billion dong (468 billion in external funding), while 13 008 billion dong(4 342 billion in external aid) or more than 60 percent of total investment for water resourcesdevelopment in the agricultural sector, 2 788 billion dong for forestry; 864 billion dong for rural watersupply; and 3 503 billion dong for other activities. Investment details are presented in Table 2.
________________________________________________________________________________
Dao Trong Tu, Director, Department of International Cooperation…Ministry of Agriculture and Rural Development, Viet Nam…
________________________________________________________________________________
Land and water investment in Viet Nam:past trends, returns and future requirements

…Investment in land and water 339
TABLE 1Agricultural portion of gross domestic product (billion VN dong)
1990 1995 1997 1998 1999 2000
Total 76 707 228 892 313 623 361 016 399 942 444 139
Agriculture 30 314 52 713 65 883 76 170 83 335 88 409
Percent 39.5 23.03 21.01 21.10 20.84 19.91
(US$1 = VN Dong 15 000)
TABLE 2Total investment for agriculture and rural areas during 1996-2000
Year Total investment Investment in agricultureand forestry
Percentage (2/3)
1 2 3 4
1996 79 367 5 140 6.48
1997 96 870 6 190 6.39
1998 97 336 6 325 6.5
1999 103 772 6 563 6.32
2000 120 600 7 629 6.32
1996-2000 497 495 31 848 6.4
INVESTMENT IN THE WATER SECTOR
Existing situation
During the last decade, the government and people of Viet Nam have made significant investments inconstruction of many irrigation systems. Annually, about 10 percent of the state budget and labourcontributed by the people is used for irrigation development. The country now has 75 large andmedium scale irrigation systems, many small irrigation systems, and nearly 600 large and mediumreservoirs (with more than 1 million m3 of stored water with an average dam height of more than 10m). Viet Nam's existing water infrastructure is massive: over 3 000 small lakes and dams, about 2 000pumping stations with a combined capacity of 200 MW in irrigation and 300 MW in drainage works,more than 1 000 drains below river and sea dykes, about 8 000 km of flood prevention dykes in theMekong river delta and tens of thousands of kilometres of canals. Total fixed assets represented bystate investment are valued 60 000 billion dong or US$4 billion (1998).
Using this infrastructure, 3 million ha of croplands are irrigated, 1.4 million ha of winter-spring crops in northern provinces are drained, 700 000 ha of land are protected against saltwaterintrusion, and 1.6 million ha of acid sulphate soils in the Mekong delta are being improved. Thisinfrastructure hasgreatly reduced the severity of floods and droughts, expanded cultivable area,improved soil, and increased food production to its present level of almost 32 million tonnes (1998).

Investment in land and water in Viet Nam…340
TABLE 3Investment from state budget for agriculture and rural in period 1996-2000 (billion dong)
Total investment Investment for Agriculture Percentage
Total investment
1996
1997
1998
1999
2000
1996-2000
16 544
20 570
22 209
26 197
28 000
113 521
3, 373
3 889
3 765
5 855
5 712
21 594
14.34
18.91
16.95
22.35
20.40
19.02
Central Government
1996
1997
1998
1999
2000
1996-2000
8 969
9 861
10 076
16 000
13 000
57 906
1 196
1 943
658
2 952
2 705
10 455
13.34
19.70
16.46
18.45
20.81
18.05
Local government
1996
1997
1998
1999
2000
1996-2000
7 575
10 709
12 132
10 000
11 000
51 417
1 177
1 946
2 107
2 903
3 054
11 188
15,54
18.18
17.37
29.04
27.76
21.76
Note: 15 000 Dong = US$1
The dyke system consists of 5 700 km of river dykes, 2 000 km of sea dykes and a network ofdams, drainage canals and embankments designed to prevent flooding in the Mekong river delta,contributing both to increased production and socio-economic development. The dyke systems in theRed, Ca and Ma river systems are most important. Their success was demonstrated by the Red Riverdyke system preventing flooding in 1991, when water levels reached 13.6 m in Hanoi and 7 m in PhaLai. Similarly, the sea dyke system in northern and north-central Viet Nam now prevents saltwaterintrusion and can withstand storms of 8 to 9 on the Beaufort scale (unless there is a concurrent hightide) while systematic embankments in the Mekong river delta protects summer-autumn paddy andprevents early flooding in August.

…Investment in land and water 341
Large- and small-scale irrigation systems annually provide more than 4 billion m3 of water forindustrial and domestic needs. Large-scale integrated irrigation and hydropower infrastructure such asthe Hoa Binh, Tri An and Thac Ba dams prevent floods, provide water for downstream areas and yieldlarge amounts of hydropower (some 10 billion kWh/yr) to the national electricity grid. They alsocontribute to further development in transportation, fisheries and tourism.
TABLE 4External funds (ODA) for agriculture sector 1996-2000 (billion dong)
1996-2000
SubsectorTotal Ministry-led Local
authority-ledODA/TotalInvestment
Agriculture and rural development 468 445 24 32.71
Water resources 3 432 2 822 610 26.38
Forestry 552 409 142 19.79
Rural infrastructure 330 181 149 38.22
Total 4 783 3 858 925 22.07
The irrigation schemes contribute to the elimination of hunger and poverty alleviation in ruralareas, especially in mountainous provinces. In many localities, irrigation schemes have facilitated thecreation of new economic zones, created better conditions for fixed cultivation and resettlement, andhave contributed to the reduction of shifting cultivation. In many places, irrigation schemes combinedwith small hydropower installations provide light to remote hamlets. In the Mekong River delta, thesaying is that where there is fresh water, there are people.
Many irrigation systems have contributed to improvement of the environment and tourism,for example, by creating beautiful landscapes such as Suoi Hai, the Dong Mo-Ngai Son lakes, the DauTieng, Nui Co and Dai Lai lakes. Irrigation systems now provide flood protection; areas which in thepast were often subject to flooding now escape that problem, making peoples' lives safer, facilitatingoverland transport and reducing the incidence of disease.
Shortcomings and challenges
However, the system of irrigation schemes in Viet Nam still suffers from many shortcomings andchallenges. For example, the initial construction cost for irrigation construction in Viet Nam has beenlow, at some US$1 000-US$2 000/ha while in countries with similar conditions it reaches fromUS$3 000-US$5 000 or US$10 000/ha. However, inexpensive construction has come at a loss ofquality or only partial completion. Irrigation usage fees are insufficient to cover costs of managementand operation (O&M), maintenance and repair of the irrigation network, leading to a process ofdegradation. Improper management leads to water wastage. Some irrigation works can carry only 60percent of designed capacity – very serious in dry years when much of the crop can be lost due to theshortage of water.
Management of existing irrigation systems at the on-farm level has not been reformed duringthe ongoing economic transition process. Further, management of irrigation construction at local levelhas not yet been adapted to the market mechanism

Investment in land and water in Viet Nam…342
Irrigation systems initially designed to provide water for paddy now needs to be improved tomeet the present demand for multi-cropping and crop diversity. Construction of irrigation systems forfruit trees and industrial crops in mountainous areas, concrete-lined canals, and application ofadvanced watering techniques to reduce water consumption are now urgent requirements.
At present, one million people in the upland areas have insufficient water for domesticconsumption and only 30 percent of the rural population has access to clean water.
Dyke systems and other flood prevention works should be improved and expanded towithstand even exceptional climatic conditions. There is a need now to take all necessary measures toprevent floods during the coming years. This is a serious challenge for the water management sector.Planning for water resources usage has so far been done on a sectoral basis only, without consideringforests, production, the daily needs of local people and the environment. In consequence, manysurface water bodies have been exhausted. Most attention has been given to supplying water, whilethere has been less attention to the drainage system. In addition, emphasis has been given to water foragricultural production with less attention to domestic water use and other socio-economic needs.Finally, within agricultural production, paddy production was given priority while the needs ofdryland crops, subsidiary crops, cash crops and fruit trees were neglected. Although water is abundantduring the rainy seasons, too little is collected and saved for the dry season. Existing reservoirs canstore only 6 percent of total annually generated water resources: for water coming into Viet Nam inrivers from abroad, the storage capacity is only 2.8 percent.
Water sources are becoming polluted due to industrialization, urbanization and high growthrate of population. Over-exploitation of groundwater resource has caused supply difficulties in manyareas.
Water resource management is still scattered and there is overlap between ministries, sectorsand localities. Management by river basin has not been implemented; neither is there the systematicestablishment of irrigation systems by river basin.
IRRIGATION SYSTEMS DEVELOPMENT/WATER MANAGEMENT OBJECTIVES
Water resources in Viet Nam are relatively abundant in the rainy season and can be exploited fordifferent purposes: domestic use, food production, industry, energy development, transportation,tourism and environment, and socio-economic development. In the major river valleys, the water levelcan be maintained over the entire year, except in Binh Thuan province, where there is a need totransfer water from Dong Nai. There are also technical difficulties in arranging irrigation in theMekong River delta. Building water retention structures in upstream countries may create additionalwater shortages during the dry season downstream.
• Industrialization and modernization are accompanied by urbanization, leading to increased waterdemand for domestic and industrial use, which leads to increased demand for construction ofmore water storage and distribution works – which in turn leads to the need for drainage andwastewater treatment facilities.
• The more highly developed the economy, the more sophisticated systems for protecting societyfrom natural calamities must be. Both the dyke system and flood regulation structures atresidential and important economic production areas should be strengthened to ensure safety,limit losses, and enable sustainable development.

…Investment in land and water 343
• The average agriculture land area per capita is very low. At present, there are about 7 million haof agriculture land, giving an area per capita of less than 0.1 ha. Even if the area of agricultureland could be increased to 10 or 11 million ha over the next few decades, the expected populationgrowth (to 140 million by 2040) would make the average remain below 0.1 ha per capita.Therefore, increased agricultural production cannot only be achieved through expansion in theland area cultivated but must be accomplished mainly through the intensification of cultivation.Increasing areas of agricultural land should be made able to carry two or three crops per year.Further, protective measures should be taken that ensure continued productivity of the landdespite natural calamities in both dry and rainy seasons.
The irrigation network is extensive and there has been no major breach of the dykes in the last20 years. The high food production level reached in 1998 demonstrates the robustness of theagricultural production system. However, much of the irrigation and dyke system consists of low-costconstruction which might not be able to fill their function in extreme situations or flood or drought.
Structural quality will also deteriorate without regular maintenance and upgrading, Theirrigation system should also be gradually modernized to support the transition in the croppingstructure, irrigating more vegetables, subsidiary crops, cash crops and fruit trees. Water and soilshould also be used sparingly to protect the environment.
At present, Viet Nam faces many difficulties, such as the changes in global climate andecological changes due to local deforestation; increased frequency of natural calamities; increasedproduction of waste which pollutes water sources due to industrial development and growth of urbanareas. In this situation, it is necessary to develop irrigation within the framework of comprehensivewater resource management and exploitation to obtain multiple benefits for industry, agriculture, andlivelihood of the people. Integrated management and utilization of water resource should beimplemented according to the Law on Water Resources. New organizations for water resourcemanagement should be established, such as a National Water Resource Council and managementboards for planning of river basins. The quantity and quality of water resources should be monitoredto facilitate water management according to the new law.
By the year 2010, the irrigation schemes must be able to meet the demands originating in VietNam's industrialization and modernization:
• For agricultural production, 11 million ha of land should be fully utilized, of which annualcrop production areas would be 9.7 million ha for production of 36 to 38 million tonnes.Clean water must be ensured for domestic use and for supply to industrial zones. Waterdemand in 2000 is estimated at 72 billion m3, of which 61 billion is for agriculture and 11billion is for domestic use and industry. Water demand is expected to increase to 90 billion m3
by 2010, with agriculture needing 74 billion m3 and industry and household use at 16 billionm3. Demand is expected to increase particularly rapidly in the Mekong river delta, thesoutheast, the mountains and in the central highlands. Drainage should be ensured in flood-prone areas.
• For flood prevention and limitation of damage by natural calamities, the dyke system mustbe improved. The Red River dyke system should be strengthened and improved in quality tocontrol water flow even if water levels reach historically high levels. More reservoirs shouldbe created to reduce fluctuations in water flow. The sea dyke system must be strengthened towithstand storms of 11 and 12 on the Beaufort scale. In the Mekong river delta, an area safefrom severe flooding in areas of shallow water levels should be created, where people fromareas of deeper inundation can find safety. In large river valleys, integrated construction inwhich flood prevention is combined with irrigation and electricity generation must be created.

Investment in land and water in Viet Nam…344
The planned Son La hydropower plant at Ta Bu and the Dai Thi plant on the Lo river arehighest priority, followed by Cua Dat on the Chu, Ban Mai on the Ca, and Ngan Truoi on theLa rivers, respectively, along with plants on the Huong, Bo (Thua Thien Hue) and the DinhBinh plant on the Con river. The plant on the Phuoc Hoa river must be constructed as early aspossible to overcome serious water shortage in the Ho Chi Minh City-Dong Nai-Vung Tautriangle. The 'stair' on the Dong Nai river will be formed after the Han Than-Da Mi plant isfinished. The Dai Ninh plant should be started to generate electricity and provide water forthe Luy river region (Binh Thuan). These are strategic plants; apart from building such largeplants throughout the country, small- and medium-scale plants in the mountains and centralhighlands have important roles to play in socio-economic development, hunger eliminationand poverty alleviation, and as a basis for establishing agricultural and industrial productionzones.
Dykes preventing saltwater intrusion and regulating water flow in the Mekong river delta,particularly increasing water retention capacity in the dry season, should be completed.Groundwater resources should be protected and exploited safely for domestic use in theMekong watershed, the central highlands, the central coast and in the southeast. The problemof insufficient water for domestic use by one million people in upland areas should be solved.Water resources must also be provided as needed for development of industrial zones.
• Irrigation systems and related infrastructure such as pumping stations, mechanical facilitiesand electricity transmission lines should gradually bemodernized. Channel systems should beconsolidated. Existing irrigation works should be utilized to their full design capacity. Smallirrigation systems in mountainous area must be strengthened. The area watered and drainedfor cash crops and fruit trees should be expanded and soil and water conservation must bepractised on sloping land.
• Viet Nam's capacity for scientific research, water resource management, planning, design,construction and application of new materials for irrigation construction should be increasedintegrating new technologies.
• Appropriate policies and procedures should be formulated to support the introduction and useof the coming Law on Water Resources.
• These tasks show that irrigation is very important for Viet Nam's socio-economicdevelopment, for the sustainability of production and for protection of the environment. Thereis need for US$5-7 billion of state funds in this field.

…Investment in land and water 345
PRIORITIES FOR INTERNATIONAL ASSISTANCE SUPPORT
Irrigation schemes
Because of the central importance of irrigation to Viet Nam's national economy and social needs thefollowing priorities have been established for international assistance:
Construction of multipurpose irrigation systems. Regulating water levels to create water resources forboth national economic sectors and environmental improvement. Build works which regulate floodsand reduce losses caused by natural calamities, works to prevent saltwater intrusion; plants to treatwastewater and protect water quality; works to drain low-lying areas to improve living standards.
Improve existing irrigation systems to take full advantage of their capacity for multiple cropping andcrop diversification. Modernize works and apply advanced water technology combined withtraditional techniques to save water and maintain humidity for longer time. Strengthen the canalsystem.
Invest in irrigation control systems: communications for flood prevention; strengthen reservoirmanagement; establish wastewater quality standards and programmes for clean water and ruralenvironmental hygiene; strengthen management capacity in water resources and irrigation; formulatenational water resources strategies; and prepare integrated plans for river basin and irrigationdevelopment.
By-law preparation: preparing by-laws including decrees for implementing the Law on WaterResources, on administrative punishments in the water resource sector and on water pricing.Revisions of laws on the exploitation and protection of irrigation constructions, on dykes, and onflood and storm prevention, so that they become compatible with the Law on Water Resources.Prepare inter-ministerial circulars and regulations on water resource management and on preventionof losses caused by water.
Establish water resource management agencies in accordance with the new Law, such as a WaterResource Management Council and management and planning agencies for river basins andinvestigation of water resources.
Investigate the extent of water resources (including surface water and groundwater), establish databanks and related resources.
Training human resources for development of irrigation and water resource management.
Licensing exploitation and utilization of water as well as for wastewater emission.
INVESTMENT IN THE LAND SECTOR
From 1996 to 2000, the state budget of Viet Nam allocated 1 432 billion dong for agriculture, ofwhich 468 billion is external funding. Investment in land development is 6.61 percent of total fundingfor all sectors of agriculture. Investment for agriculture, however, is mainly for rural infrastructurewith only a small amount for land (improvement of agriculture production on land). Investment inland concentrates to sustainability of food production to ensure national food security; improvementof management of natural resources (including ecological systems and environmental protection); andpoverty reduction, or increasing living standards for rural areas and improvement of ruralinfrastructure

Investment in land and water in Viet Nam…346
Box 1Agricultural land in Viet Nam
Total land: 33 million haAgricultural area: 11 million ha
(33% of total)Cultivated area: 7 million ha
(21% of total)Rice fields: 4.25 million ha
(12.9% of total)Rice field area (irrigated): 3.4 million ha
(80% rice fields)
ASSESSMENT OF INVESTMENT IN AGRICULTURE
Thanks to the high level of attention by the government in the past, agricultural production hasachieved encouraging results:
TABLE 5Land-related investment (1999) (billion dong)
Total Construction &assembly works
Machinery &equipment
Others
TotalI. Agriculture
1. Cultivation
+ land reclamation
+ Services for cultivation
2. Livestock
3.Water resources
II. Forestry
5753.04124.2
776.2
98.2
275.8
230.6
4117.4
628.8
4286.33911.2
509.2
84.7
172.5
156.0
3246.0
375.1
381.1293.6
134.1
0.3
55.4
5.5
154.0
87.5
1085.6919.4
132.9
13.2
47.9
69.1
717.4
166.2
The growing rate of agricultural sector has been increased continuously with average rate 4.3percent in the period 1989-1999. From a rice-importing country, Viet Nam has become the secondlargest rice exporting country worldwide. Agriculture has change from self-sufficiency to adiversified, commercialized and export-oriented agriculture.
Food production from 1989 to 1999 doubled; every year food production rose by 1.3 milliontonnes, coffee-growing areas expanded 20 times, the production of rubber, tea and cashew nutsincreased by five times, four times and four times respectively. Rice, coffee, tea, rubber have becomemain products for export. Income from export increased 13 percent annually and occupied 30 percentof production exported by all national economic sectors.

…Investment in land and water 347
Box 2Water in Viet Nam
Natural area: 330 000 km2
Population: 76.8 million Average rainfall: 1 750 mm
Rainy season: 70-80% Dry season: 20-30%
Number of rivers: 1 360 (L>10 km)Annual river flow: 830 billion m3
(63% or 522 billion m3 generated outside VN)
Storage volume: 65 billion m3Storage/natural flow: 7.8%
Technology succeeded progress. Advanced and modern technologies/methods in agriculturalsector have been developed or applied which contribute to the improvement of yield and quality ofplants and animals.
Agricultural structures have changed positively, moving toward an efficient and diversifiedagricultural sector. Many concentrated production areas have been created. Rural infrastructure hasbeen significantly improved. The income of most farmers is rising and living conditions of people inrural, mountainous areas have improved. Rehabilitation of forests and reforestation has progressed:after 10 years Viet Nam has 1 464 million ha of forest; deforestation declined from 100 000 ha/year in1980 to only a few thousand ha/yr today. Forest cover rate in 1999 reached 33 percent (11 million ha).
CHALLENGES IN LAND DEVELOPMENT
Viet Nam has 10 million ha of barren land (hills, mountains) of which some area can be cultivated. theincome from 8.1 million ha cultivated land is low with US$1 000 ha/yr. Rural labour potential andlocal people's capital resources are now still not yet mobilized effectively for production
Viet Nam's agriculture is still underdeveloped, with low productivity and efficiency, and lowcompetitive capability. As of 1994 more than 70 percent of farmers household owned farmlands ofless than 0.5 ha. Investment in land is low. Agricultural services, including marketing for agriculturalproduction, is weak. Due to various constraints, government investment in agriculture is not atsufficient levels.
CONCLUSIONS
Improvement of efficiency of planning activities: investment efficiency in the rural infrastructure(including irrigation, rural roads and household living areas) and concentration of investment fortargeted national and sector programmes such as: resettlement and new economic zones, drinkingwater, sanitation and rural environment, seeds and animal, and 5 million ha of forest addition;improvement of land use planning to mobilize all potential of areas to increase income of farming;changing investment structures: government should increase investment in agriculture and ruraldevelopment (including water resources and land). Enhancement of managing institution and

Investment in land and water in Viet Nam…348
strengthening state administrative mechanism in order to mobilize and efficiently utilized externalassistance for development of
Viet Nam's strategy for irrigation development and water resources management to 2010
Challenges
• Low initial investment (US$1 000-2 000/ha)• Degraded constructions: some only reach 60 percent of designed capacity• Lack of water, dam safety for hydraulic works• Management of local level irrigation construction not consistent with market mechanisms• One million people in uplands lack clean water supply: only 30 percent of rural people have clean
water• Planning for protection and utilization of water resources is not comprehensive• Exhausted water resources in many places• Scattered and overlapping management of water resources between Ministries, sectors and local
level; management by river basin not yet implemented
Targets for the year 2010
• ensure clean water supply of 72 billion m3: agriculture: 61 billion m3; industrial and domestic use:11 billion m3 and 90 billion m3 by year 2010 (agriculture: 74 billion m3; industry and domesticuse: 16 billion m3 );
• ensure drainage for flooded areas;• improve environment and ecology;• implement a Red River dyke system to ensure the stable flow of water and prevent flooding at
highest water levels;• install a sea dyke system to withstand storms of 11 to 12 on the Beaufort scale and prevent coastal
saltwater intrusion;• ensure flood security for the Mekong river delta;• establish integrated water infrastructure in large river basins• overcome water shortages in Ho Chi Minh City-Sang Nai-Vòng Tau triangle;• develop small- and medium-scale water infrastructure in mountains and Central Highlands;• complete construction to prevent saltwater intrusion and regulate water level in Mekong delta;• provide basic water supply to 1 million people in upland areas;• strengthen scientific research, water resource management, capacities for planning, design of
irrigation construction and applications of new construction materials; and• complete the legal documentation system under the Law on Water Resources
Priorities for investment in irrigation development
• multi-purpose irrigation schemes;• flood regulation and reduction of losses by natural calamities;• infrastructure to prevent saltwater intrusion;• construction for wastewater treatment;• construction for drainage channels for flooded areas• improve existing irrigation works;• consolidate dykes and canals system improve irrigation control system;• improve weather forecasting system and natural calamity prevention/reaction information;• strengthen reservoir management capacity;
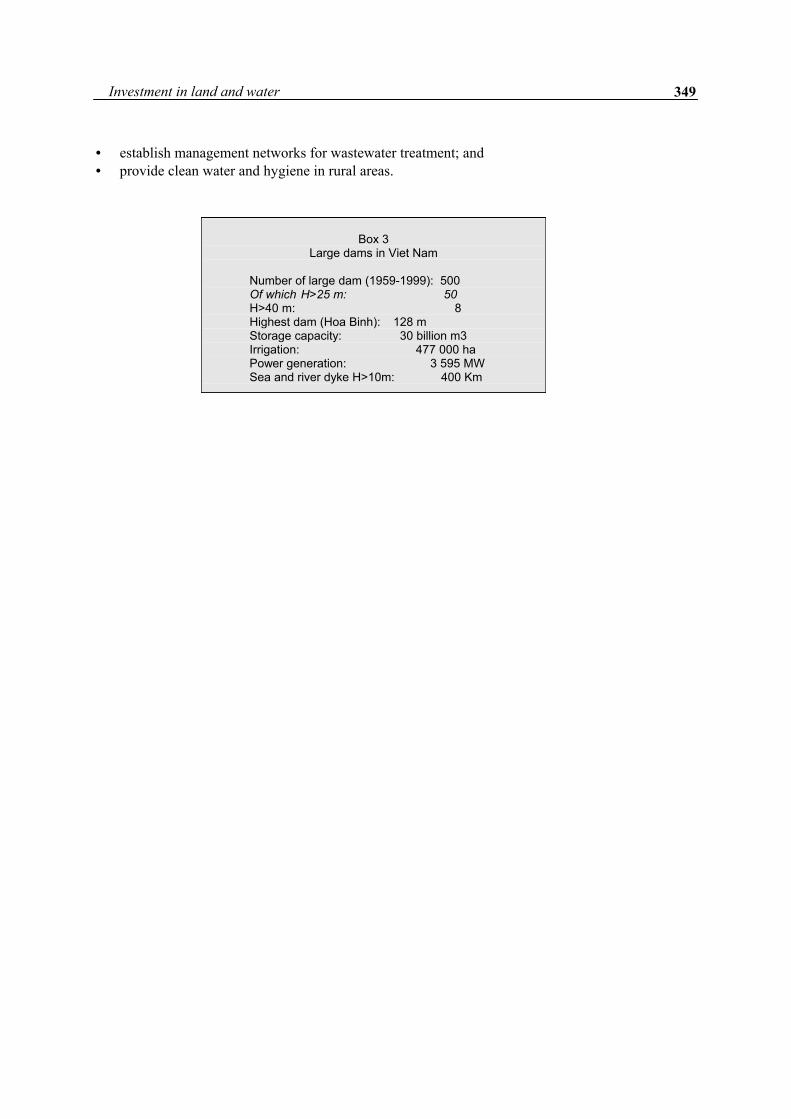
…Investment in land and water 349
Box 3Large dams in Viet Nam
Number of large dam (1959-1999): 500Of which H>25 m: 50
H>40 m: 8Highest dam (Hoa Binh): 128 mStorage capacity: 30 billion m3Irrigation: 477 000 haPower generation: 3 595 MWSea and river dyke H>10m: 400 Km
• establish management networks for wastewater treatment; and• provide clean water and hygiene in rural areas.

350
ANNEXES

352
ANNEX IRegional Consultation on Investment in Land and Water3-5 October 2001, Bangkok, Thailand
AGENDA
Wednesday, 3 October 2001
08:00-08:40 Registration08:40-08:45 Welcome address by Dr. K. Siegert, Secretary of the consultation08:45-09:00 Introduction of participants09:00-09:30 Opening address by Dr. R.B. Singh, ADG/RR09:30-10:00 Benefits of investment in land and water (Mr. K. Yoshinaga, Director AGL)10:30-11:30 Investment in land and water, past successes and failures, future direction
(Prof. Y.K. Alagh, resource person)11:30-12:00 Investing in irrigation and drainage in the context of water policy and
institutional reform (Mr. T. Facon, FAO/RAPG)
COUNTRY PRESENTATIONS
13:00-13:30 Bangladesh13:30-14:00 Cambodia14:00-14:30 China14:30-15:00 DPR Korea15:30-16:00 India16:00-16:30 Indonesia16:30-17:00 Lao PDR
19:00 Welcome dinner hosted by Dr. R.B. Singh, Assistant Director-General and RegionalRepresentative,FAO/RAPG, at Royal Princess Hotel
Thursday, 4 October 2001
08:00-08:30 Pakistan08:30-09:00 Republic of Korea09:00-09:30 Sri Lanka09:30-10:00 Thailand10:30-11:00 Viet Nam11:00-12:00 Group discussion13:00-17:00 Group discussion
Friday, 5 October 200108:30-10:00 Group discussion10:30-12:00 Drafting of conclusions and recommendations13:30-15:00 Presentation of conclusions and recommendations
Discussion and adoption of the Bangkok DeclarationClose of consultation

Annex II Participants354
Annex IILIST OF PARTICIPANTS
BANGLADESH
Mr. Khwaja Abdur RahmanAdditional SecretaryMinistry of AgricultureSecretariat, DhakaTel: 88 02 8619658; Fax: 88 02 8617040
CAMBODIA
Mr. Chann SinathDeputy Director, Irrigated AgricultureDepartment, Ministry of Water Resources& MeteorologyP.O. Box 958, Phnom PenhTel: 855 16889 623; Fax: 855 23 426345/426201E-mail: [email protected]
CHINA
Mr. Zhou YinghuaDirector, Development DivisionDepartment of Development and PlanningMinistry of Agriculture, BeijingTel: 86 10 64192561; Fax: 86 10 65002448E-mail: [email protected]
DPR KOREA
Mr. Mun Jong NamCounsellor and Permanent Representative toESCAP, Embassy of DPR KoreaBangkokTel: 662 3192686; Fax: 662 3186333
INDIA
Mr. Hemendra KumarSpecial SecretaryMinistry of AgricultureRajendra Prasad RoadNew Delhi 110 001Tel: 91 11 3383830; Fax: 91 11 3381305
INDONESIA
Dr. Ato SupraptoDirector-GeneralAgriculture InfrastructureMinistry of AgricultureJakarta SelatanTel: 62-21 7816080; Fax: 62-21 7816081
Mr. Hilman Manan, DirectorDirectorate of Water Use ManagementMinistry of AgricultureJakarta SelatanTel: 62 21 7816080; Fax: 62 21 7816081
LAO PDR
Mr. Anonth KhamhungDirector-GeneralDepartment of Agriculture and ForestryMinistry of Agriculture and ForestryP.O. Box 811, VientianeTel: 856 21 415363; Fax: 856 21 415359/451715
PAKISTAN
Mr. Hafeez AkhtarSecretary, Ministry of Food, Agriculture andLivestock,Government of PakistanIslamabadTel: 92 51 9203307/9210351Fax: 92 51 9210616E-mail: [email protected]
REPUBLIC OF KOREA
Dr. Hong-Sang KimFellow, Korea Rural Economic Institute4-102 Hoegi-dong, Dongdaemun-kuSeoulTel: 822 32994236; Fax: 822 9596110E-mail: [email protected]
SRI LANKA
Mr. Henry GamageSenior Deputy DirectorDepartment of AgricultureMinistry of AgricultureColomboTel: 08 234453; Fax: 08 388333
THAILAND
Mr. Boonkerd BudhakaSpecialist, Natural Resources EconomicsOffice of Agricultural EconomicsMinistry of Agriculture and CooperativesBangkokTel: 02 9407211; Fax: 02 9407244

Investment in land and water 355
VIET NAM
Mr. Dao Trong TuDirectorDepartment of International CooperationMinistry of Agriculture and Rural DevelopmentHanoiTel: 84 4 8344682; Fax: 84 4 7330752E-mail: [email protected]
FAO
Dr. R.B. SinghAssistant Director-General and RegionalRepresentative for Asia and The Pacific,Regional Office for Asia and the Pacific (RAP)BangkokTel: 02 6974222; Fax: 02 6974445E-mail: [email protected]
Dr. K. YoshinagaDirector, Land and Water DivisionFAO, Rome
Mr. Dong QingsongDeputy Regional RepresentativeRegional Office for Asia and the Pacific (RAP)BangkokTel: 02-6974223; Fax:02-6974445E-mail: [email protected]
Dr. K. SiegertWater Resources Development and Conservation OfficerRegional Office for Asia and the Pacific (RAP)BangkokTel: 02 6974298; Fax: 02 6974445E-mail: [email protected]
Mr. T. FaconWater Management OfficerRegional Office for Asia and the Pacific (RAP)BangkokTel: 02 6974156; Fax: 02 6974445E-mail: [email protected]
Mr. David A. IvorySenior Agricultural Investment OfficerRegional Office for Asia and the Pacific (RAP)BangkokTel: 02-6974112; Fax: 02-6974445E-mail: [email protected]
Dr. M. VelayuthamConsultantRegional Office for Asia and the Pacific (RAP)Bangkok
Prof. Y.K. AlaghVice-Chairman, Sardar Patel Institute ofEconomic & Social ResearchThaltej, Ahmedabad 380054Tel: (O) 91 79 6851428, 91 79 6850598, (R) 91-79-6859950Fax: (O) 91 79 6851714, (R) 91-79-6855984E-mail: [email protected]
OBSERVERS
Mr. Graham JacksonSpecial Project OfficerAsian Development BankRama VI Road, Bangkok
Mr. Tongchai Wechasut, OIC Agriculture,Irrigation and Forestry Programme (AIFP)MRC Secretariat P.O. Box 1112Phnom Penh, Cambodia
Dr. Frits Penning de VriesTeam LeaderInternational Water Management Institute(IWMI), SEA Regional OfficeBangkok
Mr. Pongsak ArulvijitsakulSenior Engineer (Irrigation)Royal Irrigation DepartmentBangkok
Mr. Charnchai PaethongPolicy and Plan AnalystOffice of Agricultural EconomicsMinistry of Agriculture and CooperationTel: 02 9406485-6
Mr. Va-son BoonkirdEngineerOperational Maintenance DivisionRoyal Irrigation DepartmentBangkok