investment outlook - seb group...year. from a swedish investor’s perspective the end result was...
TRANSCRIPT

Investment Outlook
February 2019
2Investment Outlook: February 2019
02 Contents
03 Introduction
Slowing growth rate, but more attractive pricing
04-05 Macro and other market drivers
Growth rate decelerating from high levels
06 Summary by asset class
07 Risk exposure & allocation
Total risk level around or just above neutral
08-09 Questions and answers
How messy will 2019 be? What surprises may appear?
10-11 Global equities
Downward earnings revisions and falling prices offset by low valuations
12-13 Theme: Corporate earnings
Uncertain earnings growth early in 2019
14-16 Nordic equities
Rational pricing as 2019 begins
17-18 Fixed income investments
Central banks slow their pace of normalisation
19-22 Theme: Improving energy efficiency
A promising investment
23 Contact information
Contents

3Investment Outlook: February 2019
• Further economic slowdown in 2019-2020.
• More favourable valuations and positioning, but declining rate of earnings increases.
• We are again slightly overweight in equities and corporate bonds.
• Improved energy efficiency – a good tool for achieving environmental targets.
2018 was a volatile year, with weak performance for most asset classes and periodic free fall during the fourth quarter – despite strong economic growth and impressive corporate earnings increases. The best strategy for the year would have been to focus on defensive equities during the first half and then flee risk completely during the second half of the year. From a Swedish investor’s perspective the end result was less dramatic, thanks to the positive effect of the krona’s depreciation on asset values.
In the last Investment Outlook (December 2018) we explained that we had lowered our risk level to a neutral position ahead of the report season. This was a correct decision, but we again increased our risk (after an initial stock market downturn of about 10 per cent). This was a mistake, since December also proved to be a very weak month. Early in 2019, we are now somewhat overweight in equities and corporate bonds.
We expect 2019 to be stormy as well, since we are still in the late phase of the economic cycle. This means that global growth will gradually slow down and that the earnings-generating ability of the corporate sector will be challenged. In this phase, more short-term sources of disruption such as political turmoil often have a greater impact as well. But we also foresee some positive counterforces that may diminish volatility during the year ahead, for example more appetising valuations of financial assets. Investors have already assumed more cautious positions, which will reduce the need for further risk reductions. Both political leaders and central banks have surely been affected by the turbulence of 2018 and may thus make more supportive future decisions.
In this issue of Investment Outlook, we describe how we expect 2019 to unfold, with a special focus on our view of asset allocation and expected earnings generation in the global stock market. We also provide an in-depth look at the intriguing field of energy efficiency. The technological potential to halve energy use already exists. We expect a strongly growing need for future investments in energy efficiency. This will create opportunities and challenges for both companies and equity investors.
Wishing you enjoyable reading,
Fredrik Öberg Chief Investment Officer Investment Strategy
Introduction

4Investment Outlook: February 2019
In the last Investment Outlook we noted that economic growth seemed past its peak. We thus focused on a discussion about how long growth can last. The continued deceleration of the past few months makes it clear that we are now in a phase of falling growth rates.
We expect overall global growth to fall by a couple of tenths of a percentage point in 2019 and 2020, compared to 2017 and 2018. We thus do not expect a recession, although the risk of one has increased somewhat.
US – clear deceleration, but no recession
The American economy is furthest in the cyclical process, as reflected in record-low unemployment and high capacity utilisation. Last autumn, growth remained steady in the United States. At year-end the Institute for Supply Management’s purchasing managers’ index (PMI) for the manufacturing sec-tor showed a marked decline, especially the New Orders com-ponent − a clear warning sign for the future. But we have also seen strong labour market statistics in recent weeks. There are many indications that the labour supply is not as low as the unemployment figure indicates. Due to resource shortag-es along with potentially temporary negative effects from the US-Chinese trade conflict, we will see a clear deceleration. But we foresee no recession, “only” a slower growth rate.
Euro zone – political problems dampen the mood
In the euro zone, growth slowed down in 2018 due to weaker demand. PMIs are at their weakest since 2014. We believe
that temporary factors, such as new European Union regula-tions that have hampered important auto sales, amplified the slowdown. Growth is being maintained by business invest-ment needs and a good outlook for households, but various political problems are dampening the mood, while weaker global demand is hurting vital exports. We expect growth to stabilise at somewhat above today’s levels, but slower than in prior years.
Emerging markets – still an important engine
China’s economic policy shift and deceleration are proceeding as planned, but they have been heightened by a world trade downturn, accentuated by the trade war. The authorities are taking numerous steps to stimulate growth. We believe this will be enough to make the deceleration more modest. Other emerging market (EM) countries have also seen slower growth, partly due to a downturn in commodity prices. Yet global trade remains at decent levels, while domestic demand is strong in most places. We thus expect the EM economies to remain an important engine of the world economy.
Overall, global growth is thus decelerating from high levels. The question is whether our forecast of about 3.5 per cent yearly growth during 2019 and 2020 is too high. The market is definitely worried that this may be the case, but the prob-ability of an economic downturn as early as 2019 remains low. We estimate the risk of a recession in 2019-2020 at 20-25 per cent, which nevertheless shows that the risks have increased.
Macro and other market driversGrowth rate decelerating from high levels
GDP forecasts for major markets, year-on-year percentage growth
Market 2017 2018 2019 2020 Comment
United States 2.2 3.0 2.4 1.7 Deceleration from high level
Japan 1.7 1.1 1.0 0.8 Consumption tax hike = uncertainty
Germany 2.2 1.5 1.2 1.4 Auto industry a source of uncertainty
China 6.9 6.6 6.3 6.1 Deceleration, with downside risks
United Kingdom 1.8 1.4 1.3 1.6 Brexit solutions, but great uncertainty
Euro zone 2.4 1.9 1.6 1.7 Growth will stabilise at lower levels
Nordic countries 2.2 1.6 2.0 2.0 Domestic strengths provide immunity
Baltic countries 4.4 3.7 3.2 2.7 Continued good growth, external risks
OECD 2.5 2.5 1.9 1.8 Slowdown under way, low joblessness
EM economies 5.0 4.9 4.7 4.8 Stable growth, but great divergence
World, PPP* 3.7 3.7 3.5 3.5 Growth losing momentum, near trendSource: OECD, IMF, SEB *Purchasing power parities (PPP)

5Investment Outlook: February 2019
Low inflation and more dovish central bank signals
Despite rising wage inflation, mainly in the American econo-my, the global inflation rate is having difficulty climbing much more. In 2018 we reached an inflation rate of just over 2.5 per cent in the 36 mainly affluent countries of the Organisa-tion for Economic Cooperation and Development (OECD). We believe this was a peak figure. Our forecast is that the infla-tion rate will fall to 1.5 per cent in 2019 and rebound to 2.1 per cent in 2020. Combined with recent financial market vol-atility, neither the US Federal Reserve (Fed) nor other central banks reasonably have much room to hike their key interest rates. Looking ahead, this conclusion is one of the factors that will serve as a shock absorber in the capital market. Another very important method that central banks have employed since the financial crisis has been their quantitative easing (read more on page 8), which they have implemented at the same time as sharp key interest rate cuts. Nowadays these functions are reversed and when it comes to central banks’ plans to dismantle their bond portfolios, these plans will be partly controlled by economic developments, but also by the performance of capital markets. This implies that during messy periods, central banks can be expected to move slowly with these portfolio reduction plans.
Reasonable valuations
Throughout 2018, valuations were being pushed downward because corporate earnings were rising and share prices were falling. A similar trend occurred for corporate bonds, which showed rising yields and widening spreads against government bond yields (read more on page 18). This means that today’s valuations already take into account a dimmer future, although at this writing in early 2019 there has been some recovery in stock markets and corporate bond markets. If 2019 and 2020 should result in a gradually declining rate of growth and weakly rising corporate earnings − which is our main scenario − today’s valuations are reasonable. If the economy accelerates, which we do not expect, these assets
are downright cheap. Similarly, a recession would usually sig-nal that valuations are high, since − as a rule − earnings will fall significantly. Thus our main scenario is that the economy will be more sustainable than many people fear. We expect slower growth in corporate earnings during 2019 in the 2-6 per cent range, excluding dividends. This implies expected returns on global equities of around 6-8 per cent in local cur-rencies, provided that valuations are unchanged.
Supportive risk appetite and positioning
At the end of 2018, risk appetite collapsed. This had a major impact on positioning, since investors once again greatly reduced the risks in their portfolios. In this situation, risk appetite indicators signalled that in a short-term perspec-tive it would be a bad idea to decide to take further steps to reduce risks. Then 2019 began with a rebound. Risk appetite remains modest, and positioning is also on the cautious side. This means that as long as we are not heading into a reces-sion, both these factors are supportive of risk-taking.
Examples of risks
During the past quarter, leading indicators continued to signal a deceleration in the economic growth rate. This is one of the main risks, since a dramatic deceleration has not been discounted in today’s pricing. A situation of lower underlying economic strength, also hampered by possible political troubles (hard Brexit, Italian fiscal problems, trade barriers between China and the US), has boosted the risks of a recession, which we currently estimate at 20-25 per cent in 2020. Our main scenario (75 per cent) that this will not occur remains in place. Finally, it would be unfortunate if the US Federal Reserve (Fed) should feel under pressure to hike its key rate several times during 2019, combined with a shrinking balance sheet, due to accelerating inflation and weak growth. We believe the Fed is now already in a situation where it needs to proceed cautiously unless growth is strong enough.
Leading indicators signal further deceleration
The chart shows purchasing managers’ indices (PMIs) from various regions and countries, which show the future plans of companies. If an index exceeds 50, it indicates an economic expansion. Historically, these indices have had to fall well below 50 to be compatible with a recession in an entire economy.
Source:MacrobondThe chart shows how the balance sheets of the three largest central banks (BoJ = Bank of Japan, Fed = US Federal Reserve, ECB = European Central Bank) have increased during the period when they were buying fixed income securities in order to stimulate growth and boost liquidity in the world economy.
Source:Macrobond
Central bank balance sheets have expanded

6Investment Outlook: February 2019
Nordic equities
• Weaker growth rate and more profit warnings will push down historically high stock market gains.
• Earnings performance will determine share price perfor-mance.
• Valuations are more rational after stock markets have lost 6-7 per cent in six months.
• Fine opportunities to invest in structural growth.• Defensive sectors have delivered.
Return expectations, %, next 12 months (SEK)
Equities Return Risk
Global equities 8.0% 11.9%
Emerging market equities (local currencies)
8.3% 10.8%
Swedish equities 9.5% 11.2%
Fixed income investments Return Risk
Government bonds -2.7% 1.2%
Corporate bonds, investment grade (Europe IG)
0.5% 2.2%
Corporate bonds, high yield(Europe HY)
3.3% 5.0%
Emerging market debt (local currencies)
6.2% 7.1%
Alternative investments Return Risk
Hedge funds 3.5% 6.0%Source: SEB, forecasts January 2019
Fixed income investments
• A cautious monetary policy normalisation.• US key interest rate is approaching neutral level.• Volatility and liquidity will lead to sharp credit market
fluctuations.• Economic growth and undervalued currencies will
provide support to emerging market bonds.
Alternative investments
• Distinctly difficult conditions for hedge funds during Q4.• Changed view of US key rate path is causing troubles for
macro hedge funds.• Short-term trends, including sharp fluctuations, are com-
plicating the picture for CTAs.• Hard-to-manage risk reduction in equity hedge funds.
Despite increased uncertainty about both the economy and corporate earnings, we are forecasting positive returns for most asset classes. Clear improvements in the past quarter include more cautious central banks, as well as valuation and posi-tioning factors. It is always hard to forecast short-term returns, especially late in an economic cycle. Meanwhile the likelihood of positive returns is increasing, since we now have a very weak period behind us, but we expect that the extra return we have received for many years purely as an effect of a weak krona is over. As early as 2019 we believe the krona will appreciate by about 5 per cent against the US dollar, which may lower returns on global equity portfolios for Swedish investors.
Global equities
• Improvements in US-Chinese talks and more cautious Fed statements have contributed to stock market recovery.
• Despite uncertainty, we believe stock markets will gen-erate normal, positive returns. This view is based on low valuations and a mild economic slowdown.
• Global corporate earnings will grow by low single-digit percentages this year, given our macro scenario.
• The downward trend in earnings forecasts will level out during the second half of 2019.
• While awaiting a clearer economic outlook and de-creased volatility, it is wise to own stable companies that have underlying growth as well as high-quality revenues.
Expected returns and risks
-4%
-2%
0%
2%
4%
6%
8%
10%
12%
0% 4% 8% 12%
Swedish equities
Global equitiesEM equities
Hedge funds
EM debt
Risk
Retu
rn HY corporate bonds
IG corporate bonds
Government bonds
Source: SEB
Summary by asset class

7Investment Outlook: February 2019
It is apparent today that early in 2018, investors had an overly optimistic picture of market performance during the coming year. By the end of 2018 the situation was the opposite. Their risk appetite thus went from strongly upbeat to excessively downbeat in the course of 12 months. Early in 2019, signs are pointing towards a degree of normalisation and a more nuanced view of the future. In our discretionally managed portfolios, this past autumn we increased risk to an overweight for equities, in the wake of the negative market response following the third quarter 2018 report season. This turned out to have been too early, since December was anoth-er very weak month, whereas the rebound early in 2019 has been in line with our expectations and portfolio positioning.
On several occasions during the past year, we have urged our readers and clients to review their total risk level, since we expected a clear increase in market instability because we are late in the economic cycle. This proved correct during 2018 and should also apply to 2019, although we expect full-year volatility to be lower than during the extreme fourth quarter of 2018 (see the VIX volatility chart below).
Between September 30 and Christmas Eve, share prices fell by more than 15 per cent. Most other assets also lost value. This meant that pricing reverted to levels that prevailed about 1½ years earlier. The stock market plunge was excessive in a short-term perspective; since then, prices have recovered about 50 per cent of their decline.
Today’s pricing and risk-taking are more reasonable. In a short- to medium-term perspective, the result is that it is appropriate to maintain a risk level of around neutral. In our model portfolios we still have an overweight in the stock and credit markets, and our portfolios are thus targeted towards a continued rebound. We have a very broad approach and diversification in these portfolios. During extremely strong periods in the capital market, this may feel superfluous, but as soon as the market becomes unstable the value of risk diver-sification becomes evident. Our prevailing recommendation is thus to keep a total risk level of around or just above a neutral stance, and make sure not to have an overly concen-trated portfolio, since the risk of stepping on a land mine is higher than usual.
Risk exposure & allocation Total risk level around or just above neutral
How different asset classes have performed
The chart shows the return on the MSCI AC World, a broad global equity index; the OMX Stockholm equity index; the OMRX Swedish fixed income index; and a European high yield index with an SEK currency hedge. The lengthy upturn in asset prices since 2009 was not repeated during 2018.
Source: Bloomberg/Macrobond
VIX index performance since 2015
The chart shows the implicit volatility of the S&P 500 equity index in the US. The higher the VIX figure, the greater the stock market instability.
Source: Bloomberg/Macrobond

8Investment Outlook: February 2019
In turbulent times like these, the number of questions we are asked increases. This is both natural and something we appreciate. Below we present answers to questions we have received that are not entirely covered by the regular texts in our quarterly Investment Outlook report.
Will stock market performance in 2019 be as weak
and messy as in 2018?
During the last few months of 2018, stock markets were shaken by a variety of negative forces. This was mainly related to the fact that we are in a late-cyclical phase of the economy, when the rate of growth decelerates. In itself, this resulted in a clear need among investors to reallocate their portfolios, which for a number of years had been clearly positioned towards accelerating cyclical growth. Many inves-tors therefore wished to lower the proportion of equities in their overall holdings and chose more defensive equities. In addition, the market was worried about the consequences of the trade conflict between the US and China, the US Federal Reserve’s reduction in stimulus and higher key interest rates. We can describe 2018 as essentially a year of very good growth and strong earnings, but when investors began to dis-count a weaker future. During such phases, when uncertainty about future growth and corporate earnings increases, it is normal for the market both to become more sensitive to neg-ative headlines and for investors – in order to preserve their capital – to make allowances for a clearly negative scenario. Market downturns and fluctuations are often larger than the incoming statistics justify.
Looking ahead, we are still in the same late-cyclical phase, but what is different today is that asset valuations are lower and investor positioning is less aggressive, while political leaders and central banks have also experienced market volatility and are thus perhaps more inclined to make deci-sions that do not unnecessarily challenge investors. Overall, uncertainty about growth and earnings will mean that we will see another year when volatility will be highly variable, as it was in 2018, but when average volatility will be less than we experienced in 2018. As for returns, our forecast is that we will be able to deliver positive returns, which was not the case last year.
The newspapers say that central banks are
shifting from QE to QT. What does this mean?
What will the effects be?
QE is an abbreviation for “quantitative easing”. For many years after the financial crisis that started about a decade ago, central banks used a strategy of purchasing various kinds of bonds in order to stimulate the economy when their classic weapon – cutting their key interest rate – was not enough. This method increases the liquidity in the financial system, removes risk from the balance sheets of banks and pushes down interest rates in order to jump-start the economy. The central banks were successful, but they cannot continue this stimulus forever. The next step in the process is to slowly phase out these large bond portfolios (through QT or “quanti-tative tightening”). There is then a risk that its impact will be the opposite. Central banks are well aware of this. As a result, their tightening pace will be much slower than their easing pace. The same thing applies to key interest rates, which central banks will not be able to hike as quickly or as much as they previously lowered them. The impact of QT should not be exaggerated, since it will happen in a leisurely way. But it is reasonable to assume that decreased liquidity will contribute to higher volatility for financial assets, all else being equal.
Why do people talk so much about a recession if
growth is so strong?
There are two main reasons. First, this economic expansion has been going on for longer than usual. Second, some clas-sical economic warning signals have begun flashing. As for the length of the upturn, it is indeed lengthy, but the recovery has occurred at the slowest pace of all recoveries since the 1950s (in the US), so overall this is far from being the biggest economic upturn. The warning signals include things like very low unemployment and narrow gaps between short-term and long-term bond yields. Historically, these signals have pointed to an imminent recession. But this has happened after a time lag, and the lag may be as long as two years. We believe there is a 20-25 per cent probability that a recession will occur during the next two years.
Questions & answersHow messy will 2019 be? What surprises may appear?

9Investment Outlook: February 2019
What risks do you view as the most troubling
during the coming year?
The growth picture always includes risks. If the economy decelerates more sharply than we anticipate, it hurts corpo-rate earnings. That would generate market worries and falling risk appetite. If, on the other hand, growth becomes stronger there is a somewhat greater risk of rising wages and salaries, inflation and interest rates, which would also challenge share prices and risk pushing down economic growth.
An increase in friction between the US and China would defi-nitely be troubling, since the market has now begun to expect the two sides to reach agreement on a constructive solution.
Brexit (British withdrawal from the European Union) is a third source of concern. European growth is weak and may be further undermined if there should be a hard Brexit, that is, a withdrawal with no agreement.
Finally, it is worth being aware of more long-term structural risks, such as global debt.
What upside surprises might we see during 2019?
When the market is uncertain, like now, it often suffices if its fears are not realised for the market to regard it as an upside surprise. Another such surprise might be a large-scale economic stimulus, especially in China, and stronger earnings generation than the market is now expecting – driven, for example, by a larger-than-anticipated increase in today’s slow productivity growth. Another upside possibility is that we will see global growth in line with our forecasts, but that in spite of this the US Federal Reserve finds its current key interest rate sufficient in relation to incoming inflation data.
Another joker in the pack is Donald Trump’s presidential election promises about infrastructure investments. Having made front page headlines during the 2016 campaign, these promises have been completely side-lined. Because of good global growth and Trump’s tax cuts, large-scale infrastruc-ture investments have not been needed in order to drive the economy. But infrastructure spending will become necessary. If economic growth continues to slow, these plans may very well be dusted off. In that case they might have a positive impact on both overall growth and on the sectors and com-panies that work in the infrastructure field. The political land-scape supports this idea, since representatives of both the Democrats and Republicans have made positive statements about the need for investments, but weak US federal finances may be an obstacle.
Earnings forecasts are apparently being lowered a
bit, from growth of around 10 per cent to perhaps
5 per cent. Why are stock markets falling much
more than this?
Although it may seem remarkable, the answer is found in the word “discounting”. Most share valuation models are based on the concept of putting a current value on a company’s shares based on its expected future earnings – not only next year but during a substantially longer period. When investors, like now, lower their forecasts of future earnings growth, a
small downward adjustment for each year becomes a large figure if we add up the effect over many years. So even a slight lowering of the future pace of earnings growth can have a considerably larger impact on the current value of its earnings generation.
In addition, for natural reasons investors are prepared to assign a higher value to a company whose earnings will grow faster. For example, that company will be able to raise its dividends to shareholders at a faster pace. This is well illus-trated by developments during the past year. Early in 2018, it was estimated that global earnings would grow by at least 10 per cent annually during the next few years. At that time, investors were willing to pay 15-18 times annual earnings for the average company on major stock exchanges (the price- earnings or P/E ratio). Today estimated annual earnings growth is perhaps 5 per cent, and share prices have thus (among other reasons) fallen to where the P/E ratio is now 12-15 − so even minor downward adjustments of earnings forecasts can justify relatively large share price declines. What is reassuring about this equation is that once earnings forecasts have been lowered to reasonable levels, there is a higher probability of upside surprises.
How do you view short- and long-term forecasts
for expected returns?
By definition, short-term forecasts are more uncertain, which 2017 and 2018 are good examples of. Most observers un-derestimated 2017 and overestimated 2018 yearly returns. Our estimates regarding expected returns for the current year can be found in the table on page 6. These estimates are based on an expectation that the global economic growth rate will end up at 3.2-3.5 per cent yearly, that we will have corporate earnings growth of around 2-6 per cent yearly and that valuations will remain unchanged.
In a longer perspective of 5 to 10 years, it is harder to make forecasts that factor in expected actual developments, but at the same time it is easier, since a long period usually means that short-term fluctuations offset each other. So it is rea-sonable to expect returns in line with the long-term historical average, but adjusted for the prevailing bond yield situation. By this we mean that if we look back at history, we see that a stock portfolio returned 3-4 percentage points more than government bonds. This is also a reasonable expectation in the future. However, it means that absolute return is expected to be lower than the returns of recent decades, since govern-ment bond yields are well below their historical average. On the other hand, inflation-adjusted returns are more compa-rable, since we are now in a world with lower inflation than before.

10Investment Outlook: February 2019
The world’s stock markets fell sharply during the final quarter of 2018. Macroeconomic data brought downside surprises, while the US Federal Reserve stuck to its key interest rate hiking path. Tightening monetary policy combined with downward revisions of corporate earnings forecasts are a toxic cocktail for the stock market. However, more cautious central banks have helped get 2019 off to a better start.
After a steep fall in December, the stock market started the year strong, which should be viewed as a rebound amid an uncertain trend. The US Federal Reserve calmed the market with its actions in response to incoming data. Hopes of a constructive trade agreement between the US and China also contributed to rising share prices early in the year. The impact of the trade war is uncertain, but the conflict has already giv-en rise to disruptions in supply chains. Investments have been cancelled or postponed, slowing the pace of global economic growth. After a lengthy upswing, hard macroeconomic data and leading indicators have started to fall. Earnings of listed companies have started to be revised downward, contribut-ing to increased volatility.
Downward earnings revisions will level off
Earnings forecasts for 2019 have already been adjusted downward to an unusually large degree over a short period. When the revision trend reverses, it usually lasts for a while.
Since our main scenario is somewhat slower economic ex-pansion but no recession, corporate earnings growth should be 2-6 per cent this year. We expect the downward revision trend to level off by the end of June, provided that our posi-tive macro scenario proves correct.
When stock markets have lost their footing, the macro picture is unclear and the earnings trend is uncertain, valuations become an interesting gauge for assessing whether it is worth buying shares or not. Based on forward-looking price-earn-ings or P/E ratios (share price/earnings per share), which is 13.8 for the MSCI world index, share prices have not been cheaper during the past five years. An average P/E ratio of 15.5 during the same period indicates that normal share valuations are about 12 per cent higher than today. However, we expect further downward earnings revisions of a few percentage points, ending up with moderate potential share price gains of about 6-8 per cent. The low interest rate envi-ronment is helping support valuations and boost capital flows
Global equitiesDownward earnings revisions and falling prices offset by low valuations
Simultaneous downward revisions in major stock markets
Valuations in the world’s stock markets have been revised downward significantly over a short period, in Europe and the US as well as on emerging market (EM) exchanges.
10
12
14
16
18
20
22
Jan-14 Jan-15 Jan-16 Jan-17 Jan-18 Jan-19
P/E EM P/E Europe P/E US
Source: Bloomberg/Macrobond
Lower valuations in the global stock market
The 12-month forward price-earnings or P/E ratio (share price/earnings per share) for the world index is now the lowest in five years.
12
13
14
15
16
17
18
19
Jan 2014
Jan 2015
Jan 2016
Jan 2017
Jan 2018
Jan 2019
Source: Bloomberg/Macrobond

11Investment Outlook: February 2019
into stock markets, since the risk-free interest rate in large parts of the world is not generating any return at all. Studying other valuation metrics such as dividend yield or the price-to-book (P/B) ratio, we draw the same conclusion.
Large inflows to emerging market equities
In the last issue of Investment Outlook, we noted that emerg-ing market (EM) share valuations had fallen to historical lows compared to those in advanced economies. The valuation spread at that time was 35 per cent based on the P/B ratio, the metric that we used since return on equity across these regions was similar. The spread has now narrowed to 31 per cent, after investors took note of the valuation gap and bought EM equities at the expense of equities in mature econ-omies during the final quarter of 2018. For institutional inves-tors, EM countries are now the most popular to overweight.
The EM earnings trend is discouraging in the near term, especially in the IT sector. During the autumn, semiconductor makers and other subcontractors in the IT sector saw sharp downward earnings revisions. January profit warnings from Samsung and Apple resulted in another wave of downward revisions. Lower earnings are expected in the IT sector, whereas other sectors will provide positive earnings growth. Negative earnings growth is expected in tech-heavy South Korea and in Russia, where the oil sector is a major contrib-utor to the economy, while Taiwan’s earnings will grow only marginally. These three countries together account for 35 per cent of the EM earnings base and will bring down the over-all figure. At the other end of the scale are Brazil and India, where double-digit earnings growth is expected in 2019. The most important EM stock market, China, is also expected to show earnings growth despite a decelerating economy.
In order for the EM sphere to achieve positive capital inflows, we would have to see a weaker US dollar combined with global economic growth that does not decelerate any further. Results from China’s stimulus measures would also be encour-aging. EM equities still have low valuations but historically they are a riskier investment, so one should be selective when investing during this phase of the economic cycle.
Europe is unpopular
Europe has declined in popularity among institutional invest-ment managers. The last time the region was this unpopular was in 2012, when the Greek crisis was the biggest source of concern. Now it is Italy and the United Kingdom. Unpopular usually also means cheap. The P/E ratio has fallen from 16 to 12.5 in one year, which can be considered relatively low despite the risk of downward revisions. However, we need to see declining political risk and a better general economic trend for investors to overweight Europe again.
Large valuation spreads for FAANG companies
The US also fell in popularity among investment managers last autumn. This is attributable to some of the big high-growth companies that have led the long stock market upturn. High valuations, increased regulatory risks and in some cases exceptionally high profitability have scared off investors. Although the FAANG companies (see chart above right) are described as one group, their operations vary sig-nificantly, and so has their share price performance over the past year. Netflix has climbed 33 per cent, in local currency,
whereas Facebook has fallen 9 per cent in one year. Compa-ny valuations also vary significantly. With net cash holdings equal to 20 per cent of its market capitalisation (USD 130 billion), Apple has a P/E ratio of 14, while Netflix is valued at a P/E ratio of 74 based on its 2019 projected earnings.
Largest downward revisions in cyclical sectors
For some time, we have been saying that we are in a late phase of the economic cycle. As a rule, that means lower demand, troublesome cost pressures and shrinking margins. Investors are looking for companies with pricing power, which means that customers are less sensitive to the price of their goods. In other words, there is scope for such companies to raise prices without losing significant sales volume. These companies are found in virtually every industry and region, except perhaps the commodities sector, where added value is low. Companies with strong market positions, sound financ-es and unique products that are less cyclical are favoured whereas cyclical companies are at a disadvantage. The most negative downward revision trend is seen in cyclical sectors – a trend that will probably persist for a few more quarters. This is partly reflected in valuations, which have priced in a gloomy future. Valuation spreads between sectors, regions and companies will continue to be volatile. The wrong invest-ments will be severely punished, which will increase dispari-ties between different fund managers.
Conclusions
As we wait for the economic picture to become clearer and for volatility to decline, it is a good idea to own companies with stable operations that show some growth and offer high-quality earnings. Despite uncertainty, we believe the stock market will generate normal returns this year: about 6-8 per cent in local currencies. This is based on low valua-tions and our outlook of a mild economic slowdown, but no recession.
Divergent price trends for FAANG companies
Although all the FAANG companies are digital, their operations have few similarities, which is reflected in their share price performance. FAANG = Facebook, Amazon, Apple, Netflix, Google (whose parent company is Alphabet).
60
80
100
120
140
160
180
Feb-
18
Mar
-18
Apr
-18
May
-18
Jun-
18
Jul-1
8
Aug
-18
Sep-
18
Okt
-18
Nov
-18
Dec
-18
Jan-
19
Facebook -9% Amazon +17% Apple +6%
Netflix +33% Alphabet +5%
Source: Bloomberg/Macrobond, Dec 2017 to Jan 2019

12Investment Outlook: February 2019
Corporate earnings forecasts for 2019 have softened for most regions and countries, gradually being adjusted downward as macroeconomic data have brought downside surprises. The consensus forecast is now 7 per cent global earnings growth. Due to slowing global economic growth, we expect another quarter or two of lowered earnings forecasts. We do not expect a sustained steep fall, but rather a decline to low single-digit growth. This need not be negative for stock markets, since lower share prices mean that a lower earnings scenario has already been discounted.
The US corporate earnings trend in 2018 stands out, due to the country’s strong economy combined with substantial corporate tax cuts. We estimate around 22 per cent earnings growth for the broad S&P 500 index of US listed companies, although the corporate report season for the final quarter has just begun. Since the tax cuts are a nonrecurring effect, we foresee earnings growth falling to a more normal 8 per cent in 2019. In Europe, earnings growth of just over 6 per cent is expected in 2019, down from nearly 10 per cent in 2018.
In Asia excluding Japan, growth prospects are subdued as China’s economy is slowing down, while growth in the IT sec-tor, represented by large semiconductor companies, peaked in 2018. During the first half of 2019, earnings growth is even expected to be negative. After this, we believe earnings growth will recover as China’s stimulus measures take hold and IT sector earnings stop falling. In Japan, earnings growth is expected to be in the low single digits. However, falling global GDP growth combined with a stronger yen point to even lower earnings forecasts for Japanese companies.
Stock markets in Europe and Japan have similarities in their sectoral structure, with manufacturing and cyclical sectors accounting for a large share of earnings. There is a strong correlation between earnings and the economic cycle, so it is more likely that earnings will be revised further downward in these regions than, for instance, in the US. In one extreme case – the financial crisis that took place a decade ago – Jap-anese companies posted aggregate losses. In Europe earn-ings fell 85 per cent and in the US earnings were halved. That gives an indication of how sensitive earnings are to weaker economic growth. Our macroeconomic scenario is a certain slowdown in economic activity, but not a steep fall.
Strong earnings growth, but downward revision trend
US companies are the first out during the report season. The year got off to a brisk start, with Apple issuing a profit warn-ing. When the company provided a market update ten weeks prior to its profit warning, it forecast sales of more than 91
Theme: Corporate earningsUncertain earnings growth in 2019
Decelerating earnings growth
The bar chart illustrates earnings growth in the US, the EU and Asia excluding Japan. US and European earnings will fall this year compared to 2018, while earnings in Asia excluding Japan are expected to increase somewhat, though from a low level.
0%
5%
10%
15%
20%
25%
30%
35%
2017 2018 2019f
Asia excl Japan EU US
Source: Bloomberg/Macrobond
Downward earnings revisions in Europe
Downward revisions of 2019 European earnings forecasts began in late autumn.
21
22
23
24
25
26
27
28
29
30
31
Jan-14 Jan-15 Jan-16 Jan-17 Jan-18 Jan-1915 16 17 18 19
Stoxx 600
-3%
Source: Bloomberg/Macrobond

13Investment Outlook: February 2019
billion dollars for Q4 2018 – a major miscalculation, since the forecast was cut to 84 billion. The main factor contributing to this downside surprise was weak Chinese demand for the new iPhone models. Macroeconomic conditions had deterio-rated in China, Apple CEO Tim Cook stated. This profit warning had repercussions in large parts of the technology sector that are Apple subcontractors, such as Samsung, Qualcomm, STMicroelectronics, Hon Hai Precision and Micron. One week later, Samsung also issued a strong profit warning, confirming the industry trend. Sales are expected to decline 11 per cent and earnings 29 per cent compared to the fourth quarter of 2018. The reasons given were macroeconomic uncertainty, increased competition in phones and tepid demand for mem-ory chips. FedEx, a logistics company with a strong interna-tional presence, likewise issued a profit warning, indicating that the weaker global economy was one factor. The German industrial robot maker Kuka AG also lowered its forecasts due to the slowdown in the vehicle and electronics industries and uncertainty in the Chinese automation market.
An unusually large number of companies with an international presence that depend on the general economic trend have issued profit warnings, confirming the weaker macro picture. Analysts have started to revise their earnings forecasts down-ward. US fourth quarter forecasts have been lowered by five per cent in recent months. The biggest downward revisions are for the oil and technology sectors.
The chart above right shows the S&P 500 companies that publish their own earnings forecasts. It is common for compa-nies to start low so they can announce upside surprises as the report date approaches. A worrisome trend began as early as Q4 2018, when more companies than usual lowered their earnings guidance. It was clear in the final quarter that more companies than usual were forced to decrease their earnings expectations. This sample of companies is probably repre-sentative of what the report period will look like.
For several months, Europe has also seen downward revi-sions. The biggest downgrades are in cyclical sectors such as industrials, chemicals and the passenger car industry. Naturally, oil company earnings have been affected by falling oil prices.
Downward earnings revisions in the US
Downward revisions of 2019 US earnings began in late autumn.
110
120
130
140
150
160
170
180
Jan-13 Jan-14 Jan-15 Jan-16 Jan-17 Jan-18 Jan-19
15 16 17 18 19
S&P 500
-10%
Source: Bloomberg/Macrobond
There are also examples of companies that are comfortable with the general economic situation. The US bank Citigroup, with tentacles across the globe, was explicitly upbeat about the corporate climate in its report and foresaw continued high demand for corporate borrowing. Credit losses were being kept in check, and household finances were considered solid. Bank of America confirms this picture of strong US consump-tion. One surprising example of an upside profit warning this late in the economic cycle came from General Motors. The passenger car industry has experienced several difficult years, with emissions scandals and capital-intensive product development of electric cars. Growth has also stagnated, and in China, auto production has fallen for the first time. GM’s situation should therefore be considered unique. Continued weak earnings momentum is expected in the vehicle sector.
With the financial crisis still fresh in people’s minds, corpo-rate executives in traditional industries have been relatively restrained about making investments, thereby reducing the risk of excessively high negative operating leverage in an economic downturn. However, downward earnings revisions cannot be avoided. Banks today are relatively sound, so no major downside surprises are expected from that sector, but an especially vigilant eye is being kept on credit loss levels. The biggest downside surprises have come from semiconduc-tor and hardware producers in the IT sector. We can expect a continued weak earnings trend here. Falling oil prices have lowered oil producers’ earnings and their willingness to invest. Subcontractors, including a large number of industrial companies, are indirectly affected.
Conclusions
In general, there are few reasons for corporate executives to be overly optimistic about the upcoming flow of reports. There is still great uncertainty. However, downward earnings revisions should not be equated with falling stock markets. Last year was the best earnings year ever, yet the world index ended more than 9 per cent lower in local currencies. In other words, large downward earnings revisions have been priced into the market. If we avoid an actual recession – which we believe will be the case – then there is real potential for a good stock market year, despite sluggish earnings growth.
Fewer companies revising earnings upward
The chart shows the number of companies that have revised their earnings guidance either upward or downward. This sample consists of companies that provide their own forecasts and represents about one fifth of the S&P 500 (95 companies).
0
10
20
30
40
50
60
70
80
90
100
2018 Q1 2018 Q2 2018 Q3 2018 Q4
Number of companies revising upwardNumber of companies revising downward
Source: Bloomberg/Macrobond

14Investment Outlook: February 2019
During the past six months, the stock market has reassessed future economic prospects. Having previously foreseen a continuation of the upturn to even higher heights, it is now pricing in global factors much more rationally. A lengthy economic cycle is slowing. The stock market has sobered up, realising that growth will not continue forever and that uncertainty factors may have an impact on the real economy. Our strategy going forward remains cautious, but we are somewhat more hopeful in the short term and prefer to invest in structural growth, including digitisation and sustainability.
Economic slowdown a reality
In recent issues of Investment Outlook, we have pointed out that the global economic cycle is in a clearly mature phase and that investors should be aware of the risks involved, although our stock market outlook has been optimistic. A dec-ade-long economic upturn phase is unusual; economic cycles usually reverse when both employment and corporate earn-ings growth are at today’s levels, which historically are very favourable. Investors would still be wise to position them-selves with at least some element of caution. Central banks are expected to reduce the scale of their monetary policy programmes going forward, while earnings performance will assume a larger role in the pricing of shares. The stock market has had an abrupt wake-up call for this very reason during the past six months. No expansion lasts forever; at some point the real economy loses momentum and self-confidence. Businesses usually face a turning point around such levels. Consumer spending plans also change as people tighten their purse strings. By all indications, we are in a late phase of the economic cycle, when growth is not as high as before.
Profit warnings came thick and fast in January
At the start of 2019, profit warnings came thick and fast from international companies, with clear signals of weakening. In the vehicle sector, both Jaguar Land Rover and Ford Motor introduced cost-cutting measures in response to warning signals in the general economy and weaker demand for diesel-powered vehicles. American Airlines, Norwegian Air Shuttle and EasyJet also cited tougher times for aviation. US-based retailers Macy’s and Kohl’s announced that the Christ-mas holiday season was not the success they had hoped for, while jewellery-maker Tiffany & Co. stated that it had seen weaker earnings from mainland Chinese tourists in the US and Hong Kong. Apple issued a profit warning due to weaker sales in China, and in the financial sector BlackRock will reduce its global workforce by 3 per cent. When unemployment is at historically low levels and corporate earnings and credits are at high levels, the economy tends to slow down, and we are now getting more signals of this.
More rational pricing
The chart below shows the index level (excluding dividends) for the 30 most heavily traded shares on the Stockholm exchange (OMXS30) since the early 1990s. It clearly shows how stock market pricing becomes either too greedy or too pessimistic when the economy reaches an extreme, that is, during an upturn or downturn. The average share price (P/E ratio) is important, of course, but the general economic trend is even more important. The chart is adjusted for the extreme euphoria at the turn of the millennium, when promises were priced as if they were gold ingots. The chart is an attempt to single out periods when the stock market was irrational, no matter whether it was at a peak or a trough. Interestingly, each peak has been higher than previous peaks, and each trough higher than previous troughs. After the stock market had priced equities and the economy at relatively high levels, a more rational level has been reached.
Nordic equitiesRational pricing early in 2019
More rational pricing on the Stockholm exchange
The chart shows the Stockholm exchange’s OMXS30 index since the early 1990s, adjusted for extremely irrational pricing at the turn of the millennium. Pricing in the Stockholm stock market (based on history) has now gone from an irrational to a rational level. The general economic trend determines the future – that is, corporate earnings growth.
0100200300400500600700800900
1,0001,1001,2001,3001,4001,5001,6001,7001,8001,9002,000
19
93
19
94
19
95
19
96
19
97
19
98
19
99
20
00
20
01
20
02
20
03
20
04
20
05
20
06
20
07
20
08
20
09
20
10
20
11
20
12
20
13
20
14
20
15
20
16
20
17
20
18
20
19
-23%
-51%
-45%
-18%
-21%
-7%Irrational
Irrational
Irrational
Irrational
Irrational
Irrational
Rational
Irrational
Source: SEB

15Investment Outlook: February 2019
What are prospects like at the sectoral level?
Potential based on SEB’s benchmark prices and future earn-ings growth for different sectors shows that prospects are clearly mixed. We believe investments that include a large element of structural growth are particularly attractive. Digitisation and sustainability are examples of segments that show major structural growth.
In the digital sector, with its structural growth, potential is very strong and highly competitive against other sectors. Earnings growth forecasts from last year through 2020 (two years forward from the base year 2018) also stand out sharply at 40 per cent. When we look around us – at home, at the office, in the car, at the factory or outdoors – it is easy to see the revolutionary digitisation that is under way in every aspect of society. The digital economy still offers excellent growth potential, regardless of the state of the overall econ-omy. Product segments such as e-commerce, automation, smart business systems and digital entertainment games are experiencing structural growth.
For banking and social/educational/health services, the average upside against the underlying benchmark prices is around 20 per for the year ahead. Compared to other sectors, these have far more stable demand. SEB analyses 17 Nordic banks; the smallest of these offer the greatest potential based on our benchmark prices. But large banks have good chances of maintaining their efficiency improvement trajecto-ry, with relatively high dividend yields in the next few years.
We have long considered social/educational/health service companies to be attractive, given their non-cyclical demand and a valuation picture that we believe prices in a political future that includes too many risks. Profit caps do not have political backing at present, and it is difficult to see how this can change over the next few years, given today’s broad consensus at the government level.
Gaming (casinos and betting) also stands out in terms of upside compared to benchmark prices. The gaming sector continues its digitisation, but there are risks, with betting lim-its in the United Kingdom being one onerous factor. Swedish
regulations, with their consumer protections, are a welcome development, but the sector may be volatile.
For sectors such as network equipment, services, real estate and insurance, analysts’ benchmark prices are the lowest among the sectors. Meanwhile, risk levels for these sectors are generally lower compared, for instance, to com-modities, where the average upside against the benchmark price for 15 commodity companies is around 40 per cent. Our earnings forecast for the commodities sector was recently revised sharply downward for a number of companies.
Real estate and insurance have been among the best sectors to be invested in over the past few months. This is because they are considered “safe havens” when the stock market is turbulent. However, their potential going forward is significantly lower, although we should not rule out continued outperformance if the economy slows more than expected.
Two other sectors with strong share price performance are telecom operators and salmon farming. We have argued in favour of owning telecoms, while salmon farming has per-formed far better than our recommendations. Salmon farm-ing has remained a surprisingly strong sector in recent years, given the structural growth potential in these Norwegian companies. Telecom operators are showing stable growth, with a far lower degree of competition than internationally influenced sectors (that is, most others). Structural changes and high dividend yields have also helped telecom operators achieve strong performance. But our optimism has waned, since valuations have risen to what we view as more reason-able levels. There are other sectors with brighter prospects.
The construction sector is interesting, where the upside for equities stands out as neither positive nor negative, while earnings growth is expected to be among the weakest over the next two years. However, the twelve companies that SEB analyses in the construction sector face very different condi-tions, since their underlying exposures vary. The differences are primarily geographic, with some only operating in Sweden or Finland, while others are more international with a broader exposure. A few years ago, the Swedish construction sector was extremely hot − far too hot − but today it is ice-cold.
Potential compared to benchmark price (%)
The above charts show potential compared to the benchmark price based on SEB’s forecasts and earnings growth for 18 different sectors. Each sector is represented by the average of the companies included
4134
3323
232020
1918
151515
1414
1210
3-6
-10 0 10 20 30 40
CommoditiesGaming
DigitalBanking
Social/educational/health servicesForest products
Investment companiesConstruction
ServicesRetail
Telecom operatorsFood
IndustrialsSalmon farming
Health careInsurance
Real estateNetwork equipment
Source: SEB
Earnings growth, 2019-2020 (%)
204
77
48
46
43
41
40
40
36
26
25
22
19
18
13
10
5
-20 0 20 40 60 80
Network equipment
Commodities
Social/educational/health services
Health care
Retail
Telecom operators
Digital
Services
Gaming
Salmon farming
Insurance
Banking
Industrials
Food
Real estate
Construction
Forest products
Source: SEB

16Investment Outlook: February 2019
After the US presidential election, investments in infrastruc-ture were among the hottest in the stock market. That theme is now totally lifeless but may be revived when US political parties launch their election campaigns over the next year. For example, Skanska has a big position in the US, but SSAB (steel) and Hexagon (measurement technology) could also be affected if this theme heats up again.
Health care is another sector where the current US admin-istration would very much like to fulfil its 2016 campaign promises. American drug prices have been escalating for a long time. Compared to Europe, price differences are often very wide. The trend for pharmaceuticals is of course compa-ny-specific. At the same time, a discussion about excessively high drug prices may affect attitudes towards such compa-nies as well as their earnings. Novo Nordic and AstraZeneca are two examples of companies where the risk of increased, government-driven price pressure should not be ignored. Generic versions of products with expired patents may be a headache for some pharmaceutical companies, but they also have impressive potential to find new areas to grow in.
Stock market returns well above historical trend
In the chart above right, we illustrate Nordic corporate earn-ings since the mid-1990s, adjusted for extreme changes in a few sectors where the underlying influence from the general economic trend was very difficult to read. We have excluded network equipment, pharmaceuticals, fossil energy, shipping and clothing consumption. These sectors have been affected by sharp swings in competitiveness over the past 20 years. For instance, the collapse of Nokia’s telephone handset pro-duction had nothing to do with the general economic trend. Nor does Hennes & Mauritz’s 40 per cent plunge in profits over the past 3-4 years, as digital platform companies have intensified the competition in fashion retailing.
During the 25 years shown, corporate earnings have been above trend, with two major deviations: at the peak of the economic cycle in 2000 and in 2006-2007. It is clear that Nordic stock market returns are higher at present than the
historical trend. Do SEB’s analysts anticipate a slowdown in returns soon? No, they expect a 13 per cent increase both this year and next. Meanwhile, it is important not to ignore the permanent over-optimism that has virtually always characterised forecasters. Our earnings forecasts for 2019 have been revised downward by about 10 per cent during the past year. Historically, earnings forecasts have been revised downward by an average of 15 per cent from the initial annual forecast to the actual final outcome. We also expect downward revisions for 2019.
Earnings-neutral valuations for Nordic equities
During 2018, our line of reasoning was closely linked to our view that earnings growth, not valuations, would be the critical factor for future returns. Earnings growth has driven equities for the past 2-3 years, and will probably do so going forward. The price-to-book or P/B ratio (share price/book value per share) is currently about 2.1, a level that indicates neither particular optimism nor fear. It is a neutral level from a future returns perspective. Some companies may be priced as if a recession were imminent, but it is hard to maintain that the stock market has done this at an aggregate level. Historically, the valuation multiple has been much lower in tough times. If we are at the end of an economic cycle, as various leading indicators and employment figures suggest, average share prices are at levels that reflect both the risks and opportunities of such a trend. We believe investments that include a large element of structural growth are particu-larly attractive. Digitisation and sustainability are two shining examples of segments with major structural growth.
Summary • Weaker leading indicators are a reality; so is decelerating
economic growth. • Forecast revisions have been substantial and broad over
the past six months. • Profit warnings came thick and fast early in 2019.• There will be continued large earnings shifts between
sectors. • We have a clear focus on structural growth.
Earnings-neutral price-to-book ratio for Nordic listed companies since 1994
The forward price-to-book (P/B) ratio for Nordic equities, based on more than 270 companies that SEB monitors and analyses. The current ratio of 2.1 does not stand out in a historical perspective. The general economic trend drives both earnings and optimism/pessimism (in other words, valuations).
1.31.6
2.6
1.7
0.3
2.1
0.5
1.0
1.5
2.0
2.5
3.0Highmultiples
Low multiples
Source: SEB
Nordic stock market returns well above historical trend
The historical earnings trend for Nordic listed companies (adjusted for extreme changes in a few sectors) since the early 1990s. A steady upturn in recent years indicates a relatively mature economic cycle.
0
10,000
20,000
30,000
40,000
50,000
60,000
1994 1998 2002 2006 2010 2014 2018Source: SEB
EUR million

17Investment Outlook: February 2019
A more uncertain economic outlook presents central banks with new challenges. Low inflation pressure is enabling them to slow their pace of normalisation, which also reduces upward pressure on long-term yields. We are choosing to maintain a limited interest rate risk. In the credit market we see potential in the high yield segment, after yield spreads between government and corporate bonds widened during the autumn. Emerging markets are showing signs of recovery and in some cases may be bolstered by weakened currencies.
Government bonds (excl emerging markets)
The United States Federal Reserve (Fed) raised its key inter-est rate to 2.25–2.5 per cent in December, but at the same time it signalled a slower pace of rate hikes going forward. Early in 2019, the Fed repeated its signals about a pause in rate hikes. In our view, the Fed will only raise its key rate once this year, at its June policy meeting. As a result, the rate hikes will stop at 2.75 per cent, roughly in line with the Fed’s new view of what a neutral rate is. However, the Fed’s balance sheet will continue to shrink as planned, although Fed Chair-man Jerome Powell is now open to a more flexible approach to this component of monetary policy as well (read more on page 8).
The European Central Bank (ECB) has ended its bond-buying programme (coupons and maturities are being reinvested), but due to falling inflation there is a greater likelihood that its first interest rate hike will be further postponed. We believe the ECB will carry out its first rate hike in December this year and then be satisfied with raising its deposit rate (for banks) to -0.25 per cent. Not until late 2020 will that rate be raised to 0 and the ECB’s refi rate to 0.25 per cent.
Sweden’s Riksbank hiked its repo rate in December to -0.25 per cent, but at the same time it reduced the number of planned rate hikes going forward. We believe low inflation will be among the reasons why the Riksbank will slow its pace of rate hikes somewhat compared to its December rate path. Our forecast is that the next hike will occur in October 2019, with the Swedish central bank then being satisfied with a single hike in 2020 to 0.25 per cent. We thus expect a repo rate of 0.25 per cent at the end of 2020.
Fewer rate hikes also have consequences for our forecasts about 10-year government bond yields. We do not believe we will return to the levels seen last autumn; instead, US long-term Treasury yields have peaked. In light of our forecast of cautious ECB rate hikes towards the end of 2019, we believe German government bond yields will rise gradually, but less than Swedish long-term yields, since we believe the Riksbank will manage one more rate hike before the ECB makes a move.
We prefer bonds with low interest rate risk
Government bonds today generate low returns, while upturns in government bond yields may cause returns to deteriorate further. Owning government bonds works well when inter-est rates are falling, but when government bond yields are moving upward, it means worse conditions for fixed income investments with longer maturities. This is why we prefer holdings with short durations, since an upturn in long-term yields will not have as large a negative impact on bond prices.
Fixed income investmentsCentral banks slow their pace of normalisation
Forecasts for 10-year government bond yields
Market Feb 2019 Jun 2019 Dec 2019 Dec 2020
US 2.70 3.00 2.75 2.40
Germany 0.17 0.30 0.50 0.70
Sweden 0.38 0.65 0.90 1.15Source: SEB, market data for February 4.
18Investment Outlook: February 2019
Corporate bonds – investment grade (IG) and
high yield (HY)
Due to uncertainty about global growth and political risks, yield spreads between corporate bonds (both HY and IG) and government securities widened at the end of 2018. After this sharp movement, credit spreads are now at an average level, seen in a 15-year perspective.
US corporate bonds in the high yield segment had an es-pecially difficult December. Continued stable conditions for companies were no help as recession worries spread. Falling oil prices also contributed, since this created concerns about the future earnings of energy companies.
There is also a strong correlation between economic growth and the risk seen in corporate bonds via credit spreads. Weaker economic prospects, indicated mainly by purchasing manager sentiment about future growth, were thus another reason for the turbulence in Decem-ber. As a result, corporate bonds will be very sensitive to recession signals going forward as well. But if our forecast is correct and we avoid a recession during 2019-2020, then we foresee enough scope for credit spreads to shrink; they have already begun to narrow as risk appetite has recovered in recent weeks. Given our cautiously optimistic growth scenario, signs of stabilisation should instead provide renewed optimism. We are choosing to maintain a relatively high credit risk, although increased uncertainly may lead to sharp move-ments along the way.
We expect high yield and investment grade bonds to generate better returns than government bonds. The largest potential is probably in the high yield segment, assuming stable growth prospects and the relatively lim-ited sensitivity of these bonds to rising interest rates and
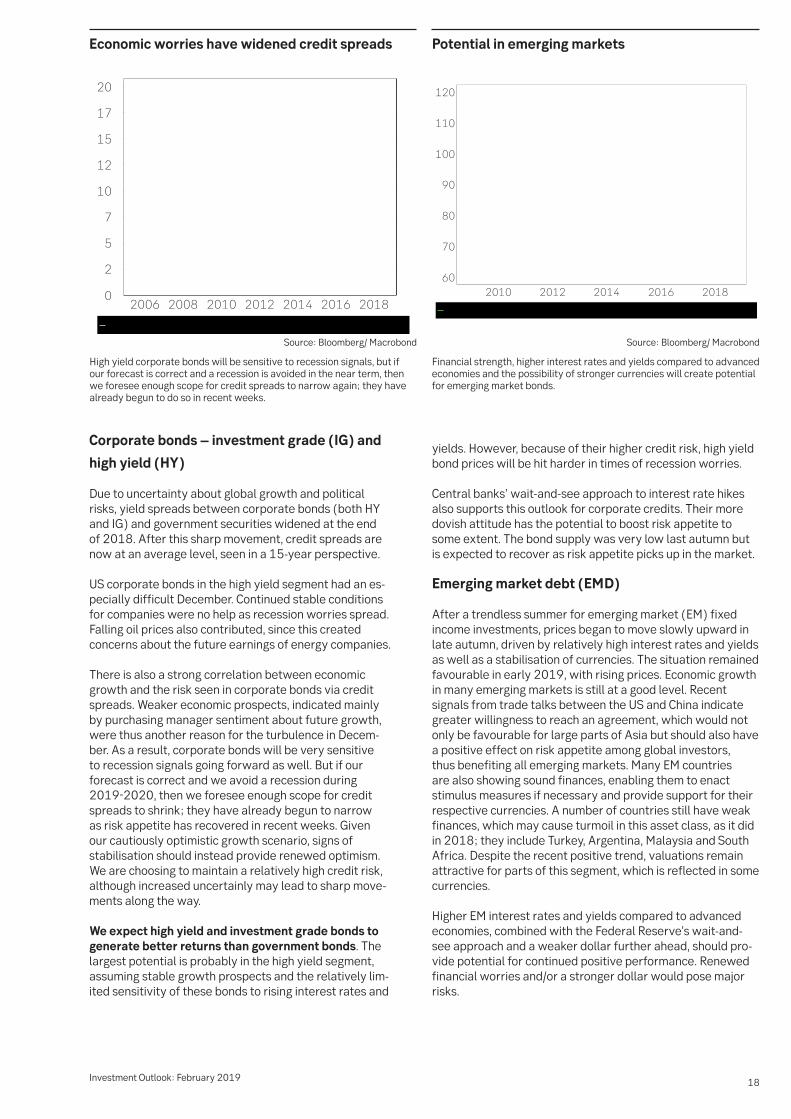
Economic worries have widened credit spreads
High yield corporate bonds will be sensitive to recession signals, but if our forecast is correct and a recession is avoided in the near term, then we foresee enough scope for credit spreads to narrow again; they have already begun to do so in recent weeks.
Source: Bloomberg/ Macrobond Source: Bloomberg/ Macrobond
yields. However, because of their higher credit risk, high yield bond prices will be hit harder in times of recession worries.
Central banks’ wait-and-see approach to interest rate hikes also supports this outlook for corporate credits. Their more dovish attitude has the potential to boost risk appetite to some extent. The bond supply was very low last autumn but is expected to recover as risk appetite picks up in the market.
Emerging market debt (EMD)
After a trendless summer for emerging market (EM) fixed income investments, prices began to move slowly upward in late autumn, driven by relatively high interest rates and yields as well as a stabilisation of currencies. The situation remained favourable in early 2019, with rising prices. Economic growth in many emerging markets is still at a good level. Recent signals from trade talks between the US and China indicate greater willingness to reach an agreement, which would not only be favourable for large parts of Asia but should also have a positive effect on risk appetite among global investors, thus benefiting all emerging markets. Many EM countries are also showing sound finances, enabling them to enact stimulus measures if necessary and provide support for their respective currencies. A number of countries still have weak finances, which may cause turmoil in this asset class, as it did in 2018; they include Turkey, Argentina, Malaysia and South Africa. Despite the recent positive trend, valuations remain attractive for parts of this segment, which is reflected in some currencies.
Higher EM interest rates and yields compared to advanced economies, combined with the Federal Reserve’s wait-and-see approach and a weaker dollar further ahead, should pro-vide potential for continued positive performance. Renewed financial worries and/or a stronger dollar would pose major risks.
Potential in emerging markets
Financial strength, higher interest rates and yields compared to advanced economies and the possibility of stronger currencies will create potential for emerging market bonds.

19Investment Outlook: February 2019
More efficient energy use can have positive effects on the economy, the environment and people’s health. The technological potential to halve the energy intensity of the global economy already exists, and the financial return on many of these investments is good. Nonetheless, global investments aimed at improving energy efficiency are far below what is required to achieve this potential, which the International Energy Agency (IEA) believes is desirable and ought to be achieved by 2040. Regulatory changes, more extensive incentive schemes and better access to funding are needed in order to stimulate these investments going forward. There are already regulations and stimulus measures to promote more energy-efficient vehicles, electrical devices, industrial products, building materials and construction solutions in most countries, and we see good reasons for them to increase and become more widespread going forward. Such developments will create both opportunities and risks for equity investors. Many companies in the Nordic stock market sell products or solutions that have energy savings as an important sales argument. We think a number of them have improving energy efficiency as their raison d’être.
Economical and healthy
In virtually every important product area that consumes ener-gy, more energy-efficient alternatives to the cheapest or most commonly used ones are already available. The cost over a product’s life cycle may often be lower for energy- efficient alternatives, but the purchase price is sometimes substantially higher. From a socioeconomic perspective, this may lead to significant sub-optimisation, since consumers do not pay the indirect costs that the use of more inefficient alternatives entails − such as greater investment needs for energy production capacity and the costs generated by unnecessary emissions. More than four million people die prematurely each year from breathing polluted outdoor air, mainly in Asia (according to the report State of Global Air 2018). It is clear that polluted air is one factor behind gigantic health-related costs, both direct and indirect, but it is usually not rational for an individual consumer or manufacturer to take this into consideration in their purchasing decision if the right set of incentives is not in place. Emissions from fossil fuel combustion account for a very large proportion of air quality problems and could be reduced by improving energy efficien-cy, especially when combined with better energy sources.
The technology already exists
If the whole world switched to the most energy-efficient alternatives that are already available in the important energy-consuming transport, construction and manufacturing sectors, energy intensity could be nearly halved by 2040. It would take time to replace the existing stock of vehicles, elec-tronics, buildings, machinery and so on, even if all new cars or newly constructed homes, for example, were sold with the most efficient solutions that are now available. Yet the efficiency improvement potential around the world over the next few decades is mind-boggling, once a large proportion of capital stock has been replaced.
Larger investments needed
However, in order to benefit from the savings that nearly halving energy use would bring, global energy efficiency investments – estimated at more than 236 billion dollars in 2017 – would have to double over the next six years and then double again during 2025-2040. This scenario assumes that the investments with the fastest payback period would be made first, with more demanding investments coming
Theme: Improving energy efficiencyA promising investment
20Investment Outlook: February 2019
after 2025. Aggregate investments could be expected to be repaid three times over during their lifetime, in the form of energy cost savings alone. Meanwhile enormous investments in new energy sources and power generating capacity would be unnecessary and could be eliminated. Investments in new power generating capacity equivalent to today’s total in China and India could be eliminated by 2040. In this scenario, the global economy would double in size while energy consumption would remain almost unchanged and related emissions would be reduced, assuming that energy efficiency is maximised at the same time. Aside from a dramatic decrease in energy costs for the owners of homes, vehicles and factories, less air pol-lution would mean better quality of life and lower health care costs for society as a whole. In countries with high costs for imported energy – such as oil, gas and coal – it is also worth thinking about the potential reduction in their costs and dependence on politically troubled countries in the Middle East that oil imports represent. This applies especially to developing countries like India, which is burdened by constant oil-related trade deficits and is fre-quently subject to instability caused by inflation pressure from rising oil prices.
Investments lead to lower costs
It is worth noting that households in countries that have been at the forefront of improving energy efficiency in re-cent decades, such as Japan and much of the EU, are now realising sizeable savings on their energy expenditures for transport, heat and cooling. In 2017, total energy costs for Japanese households were more than 25 per cent lower than they would have been if energy efficiency measures introduced in 2000-2017 had not been imple-
mented. In France, Germany and the United Kingdom, energy costs were roughly 20 per cent lower whereas in the US they were only about 10 per cent lower.
Although large total investments would be needed to realise the IEA’s efficient world scenario, they appear to be far from unattainable compared to the investments made in the ener-gy sector. In 2017, investments in electrical power totalled 750 billion dollars, while investments in oil and gas produc-tion totalled 716 billion dollars.
Improved efficiency critical to meet
Paris Agreement’s climate goal
One good way to reduce the environmental impact of the world’s large and growing energy needs is through more ef-ficient use of the energy that is already being produced. The IEA forecasts a continued increase in global carbon dioxide emissions until 2040, assuming that the current policy frame-work remains in place. In order to meet the Paris Agreement’s climate goal − keeping the increase in global average temper-ature to less than 2°C above pre-industrial levels − a sharp reduction in emissions is needed. The IEA has outlined a sce-nario for such a trend that is feasible in technical, economic and practical terms in its Sustainable Development Scenario.
In fact, the biggest emissions difference between the IEA’s main scenario and this more desirable scenario comes from the more efficient use of the energy that is produced. Efficien-cy improvements are not adequate for achieving this climate goal without other measures, but such improvements are as important as investments in renewable energy sources and far more important than fuel substitution, nuclear power or
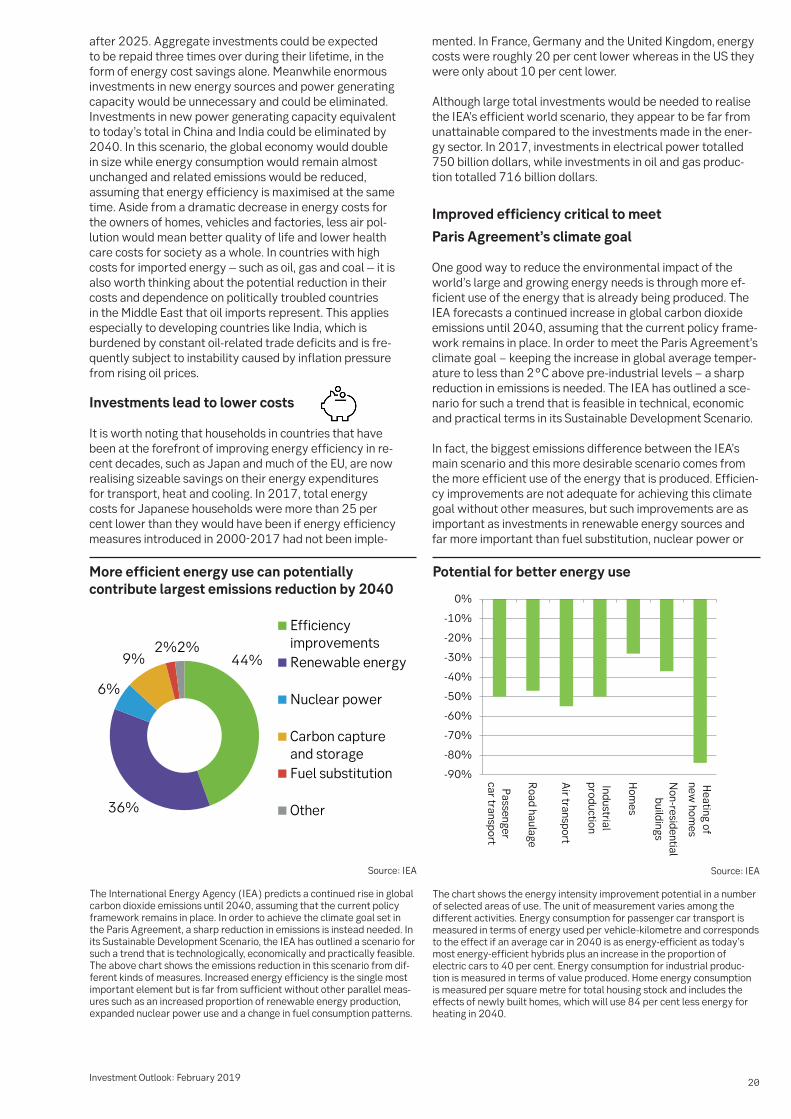
Potential for better energy use
The chart shows the energy intensity improvement potential in a number of selected areas of use. The unit of measurement varies among the different activities. Energy consumption for passenger car transport is measured in terms of energy used per vehicle-kilometre and corresponds to the effect if an average car in 2040 is as energy-efficient as today’s most energy-efficient hybrids plus an increase in the proportion of electric cars to 40 per cent. Energy consumption for industrial produc-tion is measured in terms of value produced. Home energy consumption is measured per square metre for total housing stock and includes the effects of newly built homes, which will use 84 per cent less energy for heating in 2040.
-90%
-80%
-70%
-60%
-50%
-40%
-30%
-20%
-10%
0%
Passengercar transport
Road haulage
Air transport
Industrialproduction
Hom
es
Non-residential
buildings
Heating of
new hom
es
Source: IEA
More efficient energy use can potentially contribute largest emissions reduction by 2040
The International Energy Agency (IEA) predicts a continued rise in global carbon dioxide emissions until 2040, assuming that the current policy framework remains in place. In order to achieve the climate goal set in the Paris Agreement, a sharp reduction in emissions is instead needed. In its Sustainable Development Scenario, the IEA has outlined a scenario for such a trend that is technologically, economically and practically feasible. The above chart shows the emissions reduction in this scenario from dif-ferent kinds of measures. Increased energy efficiency is the single most important element but is far from sufficient without other parallel meas-ures such as an increased proportion of renewable energy production, expanded nuclear power use and a change in fuel consumption patterns.
44%
36%
6%
9%2%2%
EfficiencyimprovementsRenewable energy
Nuclear power
Carbon capture and storageFuel substitution
Other
Source: IEA
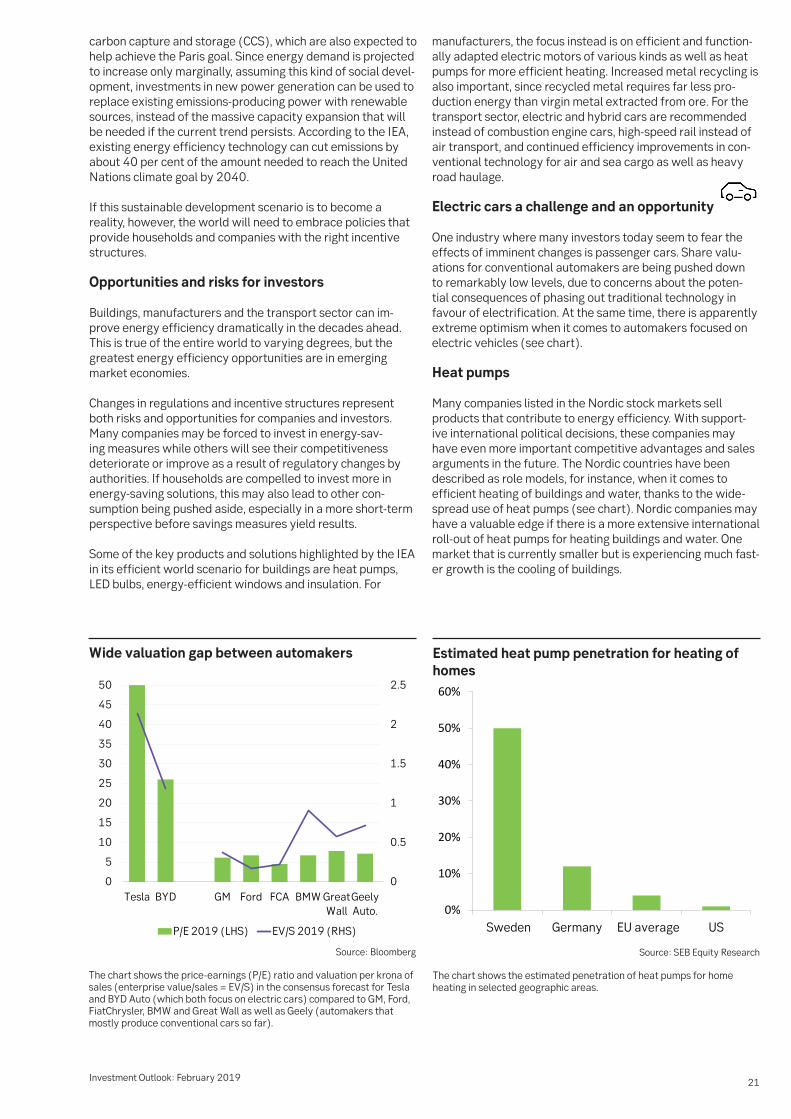
21Investment Outlook: February 2019
carbon capture and storage (CCS), which are also expected to help achieve the Paris goal. Since energy demand is projected to increase only marginally, assuming this kind of social devel-opment, investments in new power generation can be used to replace existing emissions-producing power with renewable sources, instead of the massive capacity expansion that will be needed if the current trend persists. According to the IEA, existing energy efficiency technology can cut emissions by about 40 per cent of the amount needed to reach the United Nations climate goal by 2040.
If this sustainable development scenario is to become a reality, however, the world will need to embrace policies that provide households and companies with the right incentive structures.
Opportunities and risks for investors
Buildings, manufacturers and the transport sector can im-prove energy efficiency dramatically in the decades ahead. This is true of the entire world to varying degrees, but the greatest energy efficiency opportunities are in emerging market economies.
Changes in regulations and incentive structures represent both risks and opportunities for companies and investors. Many companies may be forced to invest in energy-sav-ing measures while others will see their competitiveness deteriorate or improve as a result of regulatory changes by authorities. If households are compelled to invest more in energy-saving solutions, this may also lead to other con-sumption being pushed aside, especially in a more short-term perspective before savings measures yield results.
Some of the key products and solutions highlighted by the IEA in its efficient world scenario for buildings are heat pumps, LED bulbs, energy-efficient windows and insulation. For
manufacturers, the focus instead is on efficient and function-ally adapted electric motors of various kinds as well as heat pumps for more efficient heating. Increased metal recycling is also important, since recycled metal requires far less pro-duction energy than virgin metal extracted from ore. For the transport sector, electric and hybrid cars are recommended instead of combustion engine cars, high-speed rail instead of air transport, and continued efficiency improvements in con-ventional technology for air and sea cargo as well as heavy road haulage.
Electric cars a challenge and an opportunity
One industry where many investors today seem to fear the effects of imminent changes is passenger cars. Share valu-ations for conventional automakers are being pushed down to remarkably low levels, due to concerns about the poten-tial consequences of phasing out traditional technology in favour of electrification. At the same time, there is apparently extreme optimism when it comes to automakers focused on electric vehicles (see chart).
Heat pumps
Many companies listed in the Nordic stock markets sell products that contribute to energy efficiency. With support-ive international political decisions, these companies may have even more important competitive advantages and sales arguments in the future. The Nordic countries have been described as role models, for instance, when it comes to efficient heating of buildings and water, thanks to the wide-spread use of heat pumps (see chart). Nordic companies may have a valuable edge if there is a more extensive international roll-out of heat pumps for heating buildings and water. One market that is currently smaller but is experiencing much fast-er growth is the cooling of buildings.
Estimated heat pump penetration for heating of homes
The chart shows the estimated penetration of heat pumps for home heating in selected geographic areas.
0%
10%
20%
30%
40%
50%
60%
Sweden Germany EU average US
Source: SEB Equity Research
Wide valuation gap between automakers
The chart shows the price-earnings (P/E) ratio and valuation per krona of sales (enterprise value/sales = EV/S) in the consensus forecast for Tesla and BYD Auto (which both focus on electric cars) compared to GM, Ford, FiatChrysler, BMW and Great Wall as well as Geely (automakers that mostly produce conventional cars so far).
0
0.5
1
1.5
2
2.5
0
5
10
15
20
25
30
35
40
45
50
Tesla BYD GM Ford FCA BMW GreatWall
GeelyAuto.
P/E 2019 (LHS) EV/S 2019 (RHS)
Source: Bloomberg

22Investment Outlook: February 2019
Electric motors
One of the products that may be critical to more efficient energy use in manufacturing is new, highly efficient electric motors − a key product for the Swiss-based engineering multinational ABB, whose shares are among the most heavily traded on the Stockholm exchange. More efficient electric motors are one of the areas with the best projected invest-ment returns on average. It is noteworthy that the biggest energy savings potential in manufacturing is now in less ener-gy-intensive “light” industries such as textiles and assembly operations (including auto manufacturing, considered light industry in this context). Obviously, there are major energy savings opportunities in energy-intensive industries such as steel, but in industries where energy costs are a significant percentage of total cost, there has already been a big focus on this issue for a relatively long time. The total value of po-tential efficiency improvements is thus greatest in industries where energy costs have not been as important. A related example is the Nordic paper industry, in which many compa-nies have carried out enormous investments to reduce energy costs over the past 10-12 years, after these costs exploded in the first decade of the millennium.
Green finance
Energy efficiency is a business opportunity, and not only for industrial companies. One of the challenges in getting large enough investments in energy efficiency is inadequate access to finance. Both households and companies today mainly invest their own funds in energy efficiency solutions, although “green bonds”, for instance, have become far more important in recent years. Corporate investments in energy efficiency compete with all the other available investment opportunities, which often leads to high return requirements and a higher risk premium on these investments than would be desirable from a socioeconomic perspective. At the same time, household investment and consumption decisions are often based on very short-term planning. In order for the im-proved efficiency scenario outlined above to become a reality, more extensive funding mechanisms are required for energy efficiency improvements. To effectively manage the risks that this kind of funding entails, financial innovations may be need-ed. One innovation that has been successful so far in China and the US is energy service companies (ESCOs).
Summary
We believe there are good reasons for investors to anticipate and position themselves for a future in which more efficient energy use will be even more necessary. There are socioec-onomic, humanitarian and environmental reasons to expect further regulatory changes going forward, which should drive this trend − creating both opportunities and risks for investors. Given such a trend, we see a number of potential winners among Nordic listed companies.
Households save money on more efficient energy use
The chart shows the percentage decrease in the average household’s energy budget (for electricity, gas, vehicle fuel and so on) in selected countries due to energy-efficiency improvement measures implemented between 2000 and 2017.
-30%
-25%
-20%
-15%
-10%
-5%
0%
Japan
Germ
any
United K
ingdom
France
United States
Mexico
Source: IEA

23Investment Outlook: February 2019
Contributors to this issue of Investment Outlook
This report was published on February 5, 2019. Its contents are based on information and analysis available until February 1, 2019.
This document produced by SEB contains general marketing information about its investment products. SEB is the global brand name of Skandinaviska Enskilda Banken AB (publ) and its subsidiaries and branches. Neither the material nor the products described herein are intended for distribution or sale in the United States of America or to persons resident in the United States of America, so-called US persons, and any such distribution may be unlawful. Although the content is based on sources judged to be reliable, SEB will not be liable for any omissions or inaccuracies, or for any loss whatsoever which arises from reliance on it. If investment research is referred to, you should if possible read the full report and the disclo-sures contained within it, or read the disclosures relating to specific companies found on www.seb.se/mb/disclaimers. Information relating to taxes may become outdated and may not fit your individual circumstances. Investment products produce a return linked to risk. Their value may fall as well as rise, and historic returns are no guarantee of future returns; in some cases, losses can exceed the initial amount invested. Where either the underlying funds or you invest in funds or securities denominated in a foreign currency, changes in exchange rates can impact the return. You alone are responsible for your investment decisions and you should always obtain detailed information before taking them. For more informa-tion please see inter alia the Key Investor Information Document for funds and the information brochure for funds and for structured products, available at www.seb.se. If necessary, you should seek advice tailored to your individual circumstanc-es from your SEB advisor.
Information about taxation: As a customer of our International Private Banking offices in Luxembourg and Singapore you are obliged to keep yourself informed of the tax rules applicable in the countries of your citizenship, residence or domicile with respect to bank accounts and financial transactions. You must yourself provide concerned authorities with informa-tion as and when required.
Investment StrategySEBSE-106 40 Stockholm, Sweden
Fredrik Öberg Chief Investment Officer Investment Strategy [email protected]
Johan Hagbarth Economist Investment Strategy [email protected]
Kai Svensson Portfolio Manager Investment Strategy [email protected]
Christopher Lyrhem Equity Analyst Investment Strategy [email protected]
Louise Lundberg Economist Investment Strategy [email protected]
Henrik Larsson Portfolio Manager Investment Strategy [email protected]
Esbjörn Lundevall Equity Analyst Investment Strategy [email protected]
Pernilla Busch Investment Communication Mgr Investment Strategy [email protected]
Cecilia Kohonen Investment Communication Mgr Investment Strategy [email protected]