investment promotion training - world...
TRANSCRIPT

Investment promotion training: Data collection and analysis
Course manual
July 2002
Foreign Investment Advisory Service A joint service of the International Finance Corporation and The World Bank
34704
Pub
lic D
iscl
osur
e A
utho
rized
Pub
lic D
iscl
osur
e A
utho
rized
Pub
lic D
iscl
osur
e A
utho
rized
Pub
lic D
iscl
osur
e A
utho
rized
Pub
lic D
iscl
osur
e A
utho
rized
Pub
lic D
iscl
osur
e A
utho
rized
Pub
lic D
iscl
osur
e A
utho
rized
Pub
lic D
iscl
osur
e A
utho
rized

DC&A Manual Final July 2002.doc
Copy right
© 2002 The International Finance Corporation and the World Bank, 1818 H Street, N.W., Washington, D.C. 20433.
All rights reserved.
First printing June 2002.
The International Finance Corporation (IFC), an affiliate of the World Bank, promotes the economic development of its member countries through investment in the private sector. It is the world’s largest multilateral organization providing financial assistance directly in the form of loans and equity to private enterprises in developing countries.
The World Bank is a multilateral development institution whose purpose is to assist it’s developing member countries further their economic and social progress so that their people may live better and fuller lives.
The findings, interpretations, and conclusions expressed in this publication are those of the authors and do not necessarily represent the views and policies of the International Finance Corporation or the World Bank or their Boards of Executive Directors or the countries they represent. The IFC and the World Bank do not guarantee the accuracy of the data included in this publication and accept no responsibility whatsoever for any consequences of their use. Some sources cited in this paper may be informal documents that are not readily available.
The material in this publication is copyrighted. Request for permission to reproduce portions of it should be sent to the General Manager, Foreign Investment Advisory Service (FIAS), at the address shown in the copyright notice above. FIAS encourages dissemination of its work and will normally give permission promptly and, when the reproduction is for non-commercial purposes, without asking a fee. Permission to copy portions for classroom use is granted through the Copyright Clearance Center, Inc., Suite 910,222 Rosewood Drive, Danvers, Massachusetts 01923, U.S.A.
Library of Congress Cataloguing-in Publication Data has been applied for.

DC&A Manual Final July 2002.doc
Course preparation
This course manual was prepared for the Foreign Investment Advisory Service (FIAS) by:
Mr Don Jacobson
Don Jacobson & Associates
138 Banksia Terrace
South Yunderup
WA, 6208, Australia
Telephone +61 8 9537 8385
Facsimile +61 8 9537 8386
Email [email protected]
Mr Sean M Duggan
Foreign Investment Advisory Service
Asia Pacific Regional Office
Level 18, 14 Martin Place
Sydney, NSW, 2000, Australia
Telephone +61 2 9235 6511
Facsimile +61 2 9223 7152
Email [email protected]
Thanks
The authors would like to thank Mr Henry Sanday of the Pacific Islands Forum Secretariat and Mr Andrew Proctor of FIAS for their helpful comments and suggestions during the preparation of the course manual.

DC&A Manual Final July 2002.doc
Contents Chapter 1 About this course........................................................................................1
Identification of training needs .......................................................................................1 Training courses to date ..................................................................................................1 About this course ............................................................................................................2
Chapter 2 Data collection and analysis: an overview ...............................................5 An IPA information system ............................................................................................5 From data to knowledge..................................................................................................6 Data and the thinking process .........................................................................................6 Types of data ...................................................................................................................8 What is data collection and analysis? .............................................................................8
Chapter 3 Stakeholders and their requirements.....................................................10 Understanding stakeholder problems and requirements ...............................................10 Types of stakeholders....................................................................................................10 Stakeholder data needs..................................................................................................11 Business operating conditions.......................................................................................13 Existing and potential investors ....................................................................................16
Chapter 4 Sources of data .........................................................................................18 Some general considerations.........................................................................................18 Sources of data ..............................................................................................................18 Primary and secondary data sources .............................................................................20 Determinants of collecting data ....................................................................................26 Investor perceptions data ..............................................................................................26 Locating data.................................................................................................................27
Chapter 5 Data collection, storage and management .............................................29 Tools and techniques.....................................................................................................29 Research design.............................................................................................................29 Storage and management of data ..................................................................................30 Updating data ................................................................................................................32 Manual and computer databases ...................................................................................32
Chapter 6 Analysis and use of data ..........................................................................35 The quality of data ........................................................................................................35 Analysis and interpretation of data ...............................................................................40 Data reporting and presentation ....................................................................................41 Types and styles of reporting and presentation.............................................................43
Appendices Appendix A Course outline: Data collection and analysis.....................................47 Appendix B Fact sheets to meet stakeholder data needs .......................................49 Appendix C Data tools used by IPAs.......................................................................52 Appendix D Data sources on the Internet ...............................................................76 Appendix E Investor perceptions survey ................................................................84 Appendix F Data collection, storage and management .........................................85 Appendix G References and further reading..........................................................88

DC&A Manual Final July 2002.doc 1
Chapter 1 About this course
All of the books in the world contain no more information than is broadcast as video in a single large American city in a single year. Not all bits have equal value. Source: Carl Sagan (1934-1996), listed in Michael Moncur's (Cynical) Quotations, from The Quotations Page, http://www.quotationspage.com/search.php3
Identification of training needs
The first Heads of Investment Promotion Agencies’ Meeting (HIPAM), organised by the Pacific Islands Forum Secretariat in April 1997, agreed that a regional training program for IPA staff would be beneficial to Forum members. In addition, HIPMA decided that an IPA training needs analysis should be undertaken.
The training needs analysis was conducted during April to June 1998. Its findings were presented to participants at the HIPAM in June 1998. The key training areas identified (not in order of priority) included:
• roles and functions
• strategic planning
• research skills
• data collection and analysis
• computer training
• private sector orientation.
The analysis also recommended that training occur through short, targeted, competency-based regional workshops and work exchanges, based on adult learning principles.
Training courses to date
The 1998 HIPAM requested the Secretariat to draft a set of training course outlines. These were circulated to investment promotion agencies (IPAs) across the region for the purposes of determining training priorities.
Training course outlines were subsequently developed during 1999 for all of the identified training areas except strategic planning. The HIPAM in September 1999 reviewed and discussed the outlines. In addition, future training priorities and a training schedule were agreed.
To date, four courses for IPAs have been developed and successfully delivered:

DC&A Manual Final July 2002.doc 2
• Private Sector Orientation for IPA Officials (Nadi, May 2000).
• Investment Promotion and Marketing Skills (Auckland, July 2000).
• Strategic Planning for IPAs (Sydney, July 2001).
• Computer Use in the Investment Promotion Environment for IPA Officials (Nadi, September 2001).
This training course is the next part of the overall IPA training programme. It is designed for investment promotion officers.
About this course
Objective
More than ever, the decisions of governments, businesses and individuals are based on data. The problem is that the variety of data available upon which decisions might be made is amazing. What is more, people are increasingly encouraged to justify their decisions on the basis of data rather than personal opinion or belief. In an increasingly complex world, the task of making decisions is becoming more challenging. Therefore, the ability to collect, analyse and interpret data are critical components of making good decisions.
Blindly collecting data, manipulating data and making calculations based on data has no value by itself. Rather, effort needs to be put into understanding the concepts of data collection and analysis and in concentrating on explaining the results. A balance needs to be made between clear, logical thinking and doing a lot of arithmetic.
The main objective for this course is for participants to gain an appreciation of the data required to support the activities of a successful IPA. It is also for participants to gain exposure to methods of finding, getting and presenting data in the form of usable information.
It is anticipated that, on returning to their countries, participants will transfer the knowledge gained during this training course to other staff within their respective IPAs.
Course development
The course has been developed from the training course outline provided by the Pacific Islands Forum Secretariat (see Appendix A). This outline has been developed into a three-day course with the following structure:
• introduction to data collection and analysis
• examining the needs of the principal stakeholders
• the type of data that stakeholders require and how they use it

DC&A Manual Final July 2002.doc 3
• sources of data
• data collection and storage
• using data.
Context
One of the challenges of globalisation is for governments to become more competitive, both in the attraction of foreign direct investment (FDI) and in supporting investor companies. The degree of global competition to attract FDI is not known. However, there is growing evidence that competition is both widespread and intensifying. In this context, IPAs are a critical component in competing for FDI.
To compete successfully, IPAs must be able to promote both themselves, and the country they represent, to investors. To do this, IPAs must be able to understand, use and present data effectively. Data collection and analysis is a critical determinant of an IPA’s ability to confer sustainable competitive advantage by influencing an investor’s decision making.
In general, Pacific Islands do not rate well against the competition for FDI. As locations, they suffer from a number of inherent constraints (e.g. small local markets, high transportation costs, etc.). This means that Pacific Island IPAs need to develop particular skills in data collection and analysis in order to provide timely, accurate and adequate information. They then need to communicate that information to decision makers –investors considering an investment location or government agencies considering improvements to the investment environment.
Prerequisites
There is a minimum level of expertise and experience required for participants to obtain the maximum benefit from the training offered. Participants are expected to:
• have a minimum of 12 months experience at a middle management level in their IPA
• have some experience of researching data and data sources
• participate actively in individual and group exercises, offering the experience of their IPA as well as developing ideas
• have attained a basic level of computer literacy – it would be an advantage for participants to be regular computer users
• have some experience of presenting – participants will be required to make presentations during the course
• bring copies of their IPA’s promotional materials with them, so that the data contained can be used in their presentations – all other necessary presentation materials will be supplied.

DC&A Manual Final July 2002.doc 4
It is assumed that all participants have read and understand the Training Manuals from previous IPA training courses, as this is the starting point for some sections of this training course. IPAs without copies of previous Training Manuals can contact the Pacific Islands Forum Secretariat to obtain copies.

DC&A Manual Final July 2002.doc 5
Chapter 2 Data collection and analysis: an overview
Knowledge is of two kinds: we know a subject ourselves or we know where we can find information upon it. Source: Samuel Johnson, Life of Johnson, Boswell, Vol. v. Chap. ix. 1775
An IPA information system
An information system is used to describe an IPA’s system for collecting, analysing, storing, managing and communicating relevant information to stakeholders as decision makers. These stakeholders include existing and potential foreign investors, IPA management and staff, among others (a more detailed discussion on stakeholder groups and their requirements is in Chapter 3). The objective of the information system is to provide information so that stakeholders can make better informed decisions. The main components of such a system and its relationship with its environment, in terms of data inputs and information reporting outputs to decision makers, is summarised in Figure 1.
Figure 1: IPA information system
To be effective, this type of system needs to perform a variety of specific functions. These are to:
• collect data from the environment in which the IPA operates
• assess and sift incoming data to determine its quality, accuracy and usefulness
• to analyse and interpret incoming data
• act as a warehouse for the data collected and to manage it so that data can be located and retrieved
• report on data to stakeholder groups, to provide data and analysis that meets their requirements and alerts them to opportunities, threats and developments.
Data environment:• Sources of FDI• Stakeholders
• Competitor IPAs• Economic environment
Stakeholder data for:• Planning• Action• Control
IPA information system:• Data collection• Data analysis
• Data storage / management• Data reporting
Data Reporting
Decisions

DC&A Manual Final July 2002.doc 6
To be useful and relevant to stakeholder groups, the IPA information system needs to contain most of the data and analysis these groups require on a regular basis. Equally, the information system itself needs to be user-friendly. Best practice indicates good IPA information systems are easy to navigate around. They allow staff (and other users) to locate and retrieve data required quickly and efficiently, and are designed so that data updating is straightforward.
Because of the need to respond rapidly to requests for information, IPAs also need to regularly maintain the information system. They should anticipate the needs of stakeholders and keep information up to date as a matter of routine.
From data to knowledge
Data are not very useful in themselves in supporting decision making. Good decisions are based on knowledge. Data are only crude information and not knowledge, as demonstrated by the definitions in Table 1. There is a progression from data to knowledge. This runs as follows:
• from data to information,
• from information to facts
• from facts to knowledge.
Data becomes information when it becomes relevant to your decision problem. Data that have been collected, recorded, classified, organized, related or interpreted within a framework so that meaning emerges is information.
Information becomes fact when there are data to support it. Where information is provided in a numerical form, it is usual to refer to the information as a statistic.
Fact becomes knowledge when it is used in the successful completion of decision process. This might be extended to indicate that knowledge, when used to make decisions, becomes a powerful tool.
Data and the thinking process
The thinking process based on data in decision making is shown in Figure 2. This emphasises the need for clarity and accuracy in the analysis and provision of data. The aim is to strengthen decision making. It also reinforces the observation that the decision making process must be founded on data rather than personal opinion or belief.
Opinion is that exercise of the human will which helps us to make a decision without information. Source: John Erskine, listed in Poor Man’s College, from The Quotations Page, http://www.quotationspage.com/search.php3

DC&A Manual Final July 2002.doc 7
Table 1: Data - some definitions
Datum \Da”tum\, n.; pl. Data.:
1. Something given or admitted; a fact or principle granted; that upon which an inference or an argument is based; -- used chiefly in the plural.
2. pl. (Math.) The quantities or relations which are assumed to be given in any problem. Source: Webster’s Revised Unabridged Dictionary, 1996, 1998 MICRA, Inc.
Numbers, characters, images, or other method of recording, in a form which can be assessed by a human or (especially) input into a computer, stored and processed there, or transmitted on some digital channel.
Data on its own has no meaning, only when interpreted by some kind of data processing system does it take on meaning and become information.
People or computers can find patterns in data to perceive information, and information can be used to enhance knowledge. Since knowledge is a prerequisite for wisdom, we always want more data and information. But, as modern societies verge on information overload, we especially need better ways to find patterns.
1234567.89 is data.
“Your bank balance has jumped 8087% to $1234567.89” is information.
“Nobody owes me that much money” is knowledge.
“I’d better talk to the bank before I spend it, because of what has happened to other people” is wisdom. Source: Denis Howe, The Free On-line Dictionary of Computing, http://foldoc.doc.ic.ac.uk/foldoc/foldoc.cgi?data
Figure 2: Data to knowledge
Level of improvement in decision making
Level of exactness of decision making
Data
Information
Facts
Knowledge

DC&A Manual Final July 2002.doc 8
Types of data
There are two types of data:
• Qualitative data. Examples include eye colour of a group of individuals. They are not valid for arithmetic calculations. They are labels that advise in which category or class an individual, object, or process fall. They are called categorical variables.
• Quantitative data. These consist of measures that take numerical values. They are valid for making meaningful arithmetic calculations. Quantitative data can be further divided into two groups:
− Discrete data. These data can be counted, e.g. the number of tuna caught during a day’s fishing.
− Continuous data. When the parameters (variables) are measurable, these data are expressed on a continuous scale, e.g. measuring the weight of the tuna caught.
What is data collection and analysis?
Mysterious, sometimes bizarre, manipulations performed upon collected data in order to obscure the fact that the results have no generalised meaning for humanity. Commonly, computers are used, lending an additional aura of unreality to the proceedings. Source: Unknown, from quotes collected by Rob J Hyndman, Monash University, http://www-personal.buseco.monash.edu.au/~hyndman/quotes2.htm
Data collection and analysis is a set of methods that are used to gather, analyse, interpret and present data. These methods are used in a wide variety of occupations and help people identify, study, and solve complex problems. In the business and economic world, they enable decision makers and managers to make informed and better decisions about uncertain situations.
Increasing amounts of data and information are becoming available in today’s global and economic environment. This is partly because of improvements in computer technology. To compete successfully, decision makers must be able to understand the data and information that are available and to use them effectively. Data collection and analysis provides a means of thinking that contribute to well-informed decisions.
Data collection and analysis can be broken down into four basic parts:
• understanding the problem
• collecting data – that are relevant to the problem
• analysing data
• reporting data as information.

DC&A Manual Final July 2002.doc 9
Understanding the problem
An exact definition of the problem or need for which data and analysis might be required to support a decision is important. Only from this will it be possible to determine what data are needed. It is extremely difficult to collect data without a clear understanding of the problem.
Problems and requirements are typically user defined. Within the context of the IPA information system described in Figure 1, the main users of data and analysis are an IPA’s stakeholder groups. It is, therefore, important to understand the exact requirements of the individual or group for which the data are being collected.
Collecting data
The strategy and design of collecting data tends to be neglected. Typically, the assumption is that extensive computation can make up for any deficiencies in collection that might arise. This is not the case. A data collection strategy and design are important. The objective is to ensure that data are gathered efficiently and that those data are accurate – accuracy refers to the closeness of the measurements to the “actual” or “real” value of the physical quantity.
Data can be collected through observation (e.g. a survey) and experimental studies designed to obtain new data (primary data) or collected from existing sources (secondary data).
Once data have been collected and processed, they can be organised, stored and managed for analytical purposes – it is hard to imagine reasons for collecting data for its own sake.
Analysing data
There are a variety of methods for analysing data. Typically, and of most interest to IPAs, are those used to discover what the data appear to be saying by using arithmetic calculations and relatively straightforward techniques to summarise and present data. This processed data is information, which can be used by stakeholder groups to make better informed decisions.
Reporting data as information
Reporting data is about communicating the data and the output from any analysis undertaken. The aim is to make people aware that the data are available and where they might be found. In addition, data are presented as information so that stakeholder groups and other readers easily understand them.

DC&A Manual Final July 2002.doc 10
Chapter 3 Stakeholders and their requirements
The three laws of information requirements:
1. If information should exist, it doesn’t.
2. If information does exist, it’s out of date.
3. Only useless information disobeys the first two laws. Source: Adapted from Arnold’s laws of documentation, listed in Stephen L. Spanoudis, Quotations Homepage, http://www.geocities.com/~spanoudi/quote-15.html
Understanding stakeholder problems and requirements
The flowchart of a typical IPA information system shown in Figure 1 indicates that data collected and analysed by an IPA are reported to stakeholder groups. Data collection and analysis are not undertaken for their own sake. An IPA has a key role in undertaking data collection and analysis activities in order to support the decision making requirements of these stakeholder groups. It is, therefore, important to understand the exact requirements of the individual or group for which data are being collected.
Information can be considered a ‘product’ that an IPA ‘sells’ to its ‘customers’. Although each IPA is, for the most part, selling the same type of product (i.e. their country or region as a location for investment), there can be a significant difference in the detail of that product. It is therefore important to market your product effectively. And the first rule in marketing is to know your customers.
Types of stakeholders
In the market in which an IPA operates, its customers are the stakeholders with which it has direct or indirect contact. An IPA’s Stakeholders are many and varied, including individuals, businesses and government agencies. They can be broken down into two groups:
• external stakeholders
• internal stakeholders.
External stakeholders
The main external stakeholder group is investors. This group comprises:
• local individuals and companies with existing investments in the region/country
• local individuals and companies with the potential to exist in the region/country

DC&A Manual Final July 2002.doc 11
• foreigners with existing investments in the region/country
• foreigners with the potential to exist in the region/country.
In addition, local and foreign media are likely to be users of information as a channel for reporting to investor companies.
A further distinction between large and small companies is sometimes necessary because of differences in their ability to process information.
Internal stakeholders
The main internal stakeholder groups are more diverse than external stakeholders. They include:
• IPA management and staff
• government Ministers to whom an IPA is directly responsible and accountable
• government departments with a direct or indirect interest in investment , e.g. Agriculture Department, Department of Labour
• government and non-government agencies that have a direct or indirect interest in investment e.g. Small Business Development Corporation, Chamber of Commerce
• community groups with a direct or indirect interest in investment, e.g. women’s and village organisations with an interest in tourism and handicraft projects.
The relative importance of these internal stakeholders will depend on the way in which an IPA has been set up and the nature of its mandate. For example, in Samoa, the Trade and Investment Promotion Unit operates as a division of the Department of Trade, Commerce and Industry. It works closely with other divisions within the Department and is responsible to the Minister. This influences both its day-to-day operations and its longer-term development.
On the other hand, the Papua New Guinea Investment Promotion Authority is an independent statutory authority reporting to a Board of Directors, which comprises both public and private sector representatives. It, therefore, has weaker direct links to government and stronger links to the private sector.
Stakeholder data needs
Consideration needs to be given to both external and internal stakeholders in deciding what data are collected and analysed. In reality, however, there are few differences between their requirements. The main differences are in how the data are analysed and presented.
In general, stakeholder needs are such that an IPA can identify two main types of data:

DC&A Manual Final July 2002.doc 12
• Business operating conditions. These data are required by both external stakeholder groups, but for different reasons. External stakeholders typically use these data to make appropriate investment location decisions. Internal stakeholders need these data to persuade investors of the relative merits of a location. They also need these data as input to policy decisions about aspects of a location’s competitiveness that need improvement. In both cases, two particular types of information are required:
− country information
− sector information.
• Existing and potential investors. Again, both external and internal stakeholder groups require these data. For external stakeholders, especially foreign investors, data about existing investors can in their location decision. For internal stakeholders, especially IPA staff and management, these data are an important for relationship management and performance measurement purposes.
Presenting fact sheets
A good practice approach in meeting stakeholder needs for these types of data is given in Appendix B. It includes an example of a standard marketing information fact sheet (Example 1). This can be used by IPAs as a general guide in preparing fact sheets, which can form the basis of their promotional materials.
In preparing fact sheets, presentation (clarity, layout and design) is an important matter. The stakeholder audience and their expectations are, therefore, key considerations. Typically, stakeholders look for succinct explanations of relevant issues supported by appropriate data, which are presented in a professional manner (these issues are discussed in the section Data reporting and presentation in Chapter 6 ). An IPA will also need to take into account its own objectives in developing and distributing its promotional materials – the objective might be to provide an information resource, or it might be to maintain established contacts.
The method of presenting fact sheets (and other information) depends on the costs involved. Consideration, therefore, needs to be given to the costs associated with the development, design, storage, maintenance, updating and reproduction of fact sheets. A low cost option is to prepare fact sheets using basic computer packages (such as Word or Powerpoint). These can be printed on A4 or A3 paper in black and white (colour printing will add to the costs involved). Higher cost options involve the use of different forms of information technology – floppy disc, CD-ROM, Internet websites. 1
1 The role of information technology in investment promotion is discussed in the Multilateral Investment Guarantee Agency’s (MIGA) Investment Promotion Toolkit, Module 9, Utilizing Information Technology, January 2001. This module also provides guidelines for IPAs to establish and develop their information technology potential.

DC&A Manual Final July 2002.doc 13
The Internet, in particular, is increasingly regarded by IPAs as a key promotional tool for the presentation of fact sheets. IPAs without direct access to the Internet and/or who want to reach out to stakeholders, have the option of contracting out the development, hosting and maintenance of Internet sites. There are a number of private sector Web design and Internet Service Provider (ISP) companies able to offer the full spectrum of Internet services. However, IPAs need to weigh up this option carefully, as it can end up being very costly. There is also a risk that an IPA may lose control of the content, particularly as regards keeping it up to date.
Business operating conditions
Country data
Investor companies need country data to make decisions about the type, size and location of their investments. An investment location decision needs to be supported by data to help determine where an investment should be made.
There are investment requirements that are considered by most investors during the course of the investment decision process. The one constant requirement that investors look for is stability – both political and economic. This relates to the extent to which a location is stable at a country level. Investors also look for open, consistent and transparent economic, industry and investment policies. In combination, these provide the general investment environment under which a company takes an investment decision.
Beyond these general requirements, there also exist a number of common location evaluation criteria. These criteria are listed in Table 2, in broad order of importance. The composition and importance attached to these criteria will vary depending on the type of investor company and their:
• stage in the investment and location decision process
• country of origin and cultural background
• industrial and commercial activity and characteristics
• existing perceptions and experiences.
As a result, IPAs need to provide a variety of information to support investors in their location decision-making. In addition, they need to have the capability to adapt and tailor this information. The amount of ‘tailoring’ needed depends on the specific requirements of the investor concerned.
A good practice example of the range of country data provided by an IPA is set out in Example 2 in Appendix C.

DC&A Manual Final July 2002.doc 14
Table 2: Common investment location evaluation criteria2
Main criteria Main issues Market • General business climate and stability
• Size, nature and purchasing capacity of demand at the location and the surrounding economic ‘hinterland’ – the market.
• Openness to trade and investment. • Existence of clusters of investors or activity.
Communications and transportation
• Availability, quality and cost of communications and transport infrastructure (road, rail, port, air) – supports accessibility to market.
Labour issues • Availability, quality, flexibility and cost of labour. • Availability and quality of education and training
facilities – includes willingness of institutions to provide tailored education and training.
• Issues of productivity, turnover and militancy/industrial relations can be second order considerations.
Operating infrastructure
• Availability, quality and cost of basic utilities (electricity, gas, water, waste management, etc.).
Property • Location, range, availability and quality of land and/or property.
• Property costs and contractual conditions. • Nature, availability and quality of property ‘catalyst’
projects. Supplier access • Availability, quality and cost of suppliers for critical
resource inputs. Taxation and incentives
• Level of corporate taxation. • Availability and nature of specific grants, low-interest
loans, tax breaks or other offsets. Environment and quality of life factors
• Availability and quality of the physical and social facilities and their attractiveness – especially for expatriate staff and staff recruitment.
• Cost of living – including housing and schooling.
Sector data
Sector data, by definition, is specific to a particular industry or sector. It is, therefore, expected by the investor to be more detailed than country data. At the country level, for example, the availability of labour can be stated in terms of their level of education. By comparison, at the sector level, it is broken down into the availability of particular skills, such as welders and machine operators with experience in the steel fabrication industry.
2 A similar assessment is provided in the Multilateral Investment Guarantee Agency’s (MIGA) Investment Promotion Toolkit, Module 1, Understanding Foreign Direct Investment, January 2001.
DC&A Manual Final July 2002.doc 15
It is unlikely to be practical for most countries to provide this level of information for all sectors. An IPA will, therefore, have to address this issue and decide on which sectors to collect and analyse data and report on. Some IPAs decide not to target particular sectors, i.e. to consider all sectors equally. Other IPAs select a small number of sectors, where the prospects of success are perceived to be the greatest, and concentrate on collecting information on these.
The type of sector data and analysis required by stakeholders, especially investor companies, can be listed under four headings:
• Sector/activity description – a general description of industry sector(s) and economically significant activities within the country.
• Trends and characteristics – an overview of the main trends, drivers and features of the sector.
• Market and sector issues – a review of the market and industry environment within the country that will affect an investor, highlighting key factors that are most likely to influence an investment decision e.g. policy and regulatory issues, privatisation considerations etc.
• Key players – an outline of the main features of the major corporate decision makers within the industry/activity.
Sector data and analysis is also important for internal stakeholder groups. In particular, IPA staff need information to assist them in discussions with existing and potential investor companies. IPA staff need enough information for them to respond intelligently to an investor enquiry and to hold discussions that are of relevance to a company – companies expect IPA staff dealing with foreign investment have a good working knowledge and understanding of the main issues influencing investment decisions in their sector.
Local companies can also often benefit from information about the sector in which they operate provided to them by an IPA. This is particularly the case when an IPA’s research identifies business opportunities that can be taken up by local investors.
The types of sector-related data and analysis IPA staff require in developing relationships with investors, can be considered under seven headings:
• Trends and characteristics – an overview of the main market and industry environment trends, drivers and features that are likely to impact on an investor in that sector and any corporate strategy considerations that influence the investment decision. This should comprise a country specific and international perspective for the sector.
• A review of the market and industry environment – identifying the features of the environment most likely to influence an investor and any corporate strategy considerations that influence the investment location decision.
DC&A Manual Final July 2002.doc 16
• The likely nature and scale of an investment – an outline of a ‘typical’ investment project within the sector/activity, describing it in non-technical terms. This includes information concerning the quantifiable aspects usually associated with the proposed investment, such the capital investment, number of jobs etc.
• Key investment location evaluation criteria – a summary listing of the main criteria/issues taken into consideration by investors in the sector, which influence the investment location decision, listed in broad order of importance.
• Investment project priorities for the country – a clear indication of the level of priority given to potential investment projects (reflecting the national and IPA strategy).
• Competitor issues – identification of the most likely regional rivals to the country. This can be supplemented with key arguments likely to place the country at a competitive advantage over identified rivals.
• Arguments in favour of the country as a location for investment – core arguments that can be used with stakeholders.
A good practice example of the range of sector information provided by an IPA is set out in Example 3 in Appendix C.
Existing and potential investors
At the initial point of contact with an investor company (or third party adviser), a set of basic contact information can be recorded. This information, which relates to both investors and investments, is needed for on-going customer relationship management purposes. It becomes the basis of an IPA’s marketing database. It is used for four main purposes:
• generating ‘leads’ for investment promotion purposes
• investor tracking
• investment follow-up
• reporting to IPA management and the relevant government agencies to which an IPA is accountable.
Once an investment has been made (i.e. contracts signed and construction commenced), an IPA may have an additional role in ensuring compliance with agreed conditions or incentives. Even if this is not the role of an IPA, good practice marketing indicates regular follow-up with investor companies. This is to ensure that their needs and expectations are being met and to check if additional information or support is needed. After all, the best form of investment promotion is a happy investor who will extol the virtues of your country as a destination for investment to their business associates. These need an IPA to collect additional data by asking investors the following sorts of questions:

DC&A Manual Final July 2002.doc 17
• Did construction performance meet expectations?
• Is output quantity and quality up to expectations?
• Are local employment expectations being met?
A good practice example of the range of investor client, country and sector based information provided by an IPA is set out in Example 4 in Appendix C.

DC&A Manual Final July 2002.doc 18
Chapter 4 Sources of data
The government are extremely fond of amassing great quantities of statistics. These are raised to the nth degree, the cube roots are extracted, and the results are arranged into elaborate and impressive displays. What must be kept ever in mind, however, is that in every case, the figures are first put down by a village watchman, and he puts down anything he damn well pleases. Source: Comment of an English judge on the subject of Indian statistics quoted by Sir Josiah Stamp, Some Economic Matters in Modern Life, 1929, pp. 258-259, from quotes collected by Rob J Hyndman, Monash University, http://www-personal.buseco.monash.edu.au/~hyndman/quotes2.htm
Some general considerations
Data can be obtained from a variety of sources. Some of these are obvious, while others are less so. The ‘art’ of collecting data is in knowing where to go to get it. The two key skills in all data collection exercises are the ability to:
• identify the sources most likely to have the data needed
• extract these data.
At the highest level (librarian, university researcher, etc.) data collection is a highly skilled job, requiring specialist training and years of experience. Few IPA staff will have this background and level of ability. This section of the training course outlines some of the basics of research methodology and provides some ‘shortcuts’, which IPA officers can use to find good sources of information. It is expected that these sources will be the starting point for IPA officers to, over a period of time, generate their own sources of information that uniquely meet the needs of their particular IPA.
The method used to collect data will, in part, depend on the type and nature of the data needed. However, there are also other considerations to take into account. In particular, there will be issue of whether the data sources are accessible and what the time and resources are available to allow the data to be identified and collected.
Sources of data
For general data
A commonly held view is that locating data is nine tenths common sense and one-tenth specialised knowledge. Largely this is true, as large amounts of data are available from commonly used and freely available sources such as:
• in-house documents

DC&A Manual Final July 2002.doc 19
• companies
• reports published by government departments
• departments of statistics
• universities and technical colleges
• libraries.
The best starting point for data collection is an established in-house library. Such a library can be relatively simple, but needs an adequate indexing system, so the various types of documents can be catalogued against appropriate key words for future reference. Equally important is the need to implement appropriate management systems for the library. This usually involves having written procedures and designating one person to manage the library. All of the reports and other documentation, which are conventionally accumulated by individuals within an IPA, need to be identified and relocated to the library where they can be catalogued.
The next step is to actively search out data and information from other government departments and agencies. This can either be copied for an IPA’s library or the reference and source catalogued and entered into an IPA’s library index so that the relevant data or information can be obtained when required.
The next source of data is from businesses that are already operating in a country. If an IPA has a good relationship with these companies it will be possible to obtain, not just published data such as company reports, but also valuable data such as information about their markets, suppliers and customers.
Many international sources can be accessed for data. These include industry associations that publish annual lists of members, annual reports from selected international companies and data published by other governments. A simple letter requesting that your IPA be placed on their mailing list is usually all that is required to obtain access to these data.
Finally, there are external libraries and information services that can be accessed for specialised information. These include:
• national and state government libraries
• university libraries
• on-line library services
• specialised and technical libraries.
For Pacific Island Country data
Detailed information on Pacific Island countries (PICs) is not as readily obtainable as that on larger, more developed economies. However, some important sources can be referenced. These include regional organisations such as:

DC&A Manual Final July 2002.doc 20
• Pacific Islands Forum Secretariat (PIFS)
• Pacific Islands trade offices:
− Pacific Islands Trade and Investment Commission (PITIC), formerly South Pacific Trade Commission) Auckland and Sydney
− Pacific Islands Centre, Tokyo
− Pacific Island Forum Trade Office, Beijing
• Secretariat of the Pacific Community (SPC), formerly the South Pacific Commission
• Asian Development Bank (ADB)
• Asia Pacific Economic Cooperation (APEC)
• Commonwealth Secretariat.
Other sources include:
• Universities with specialist teaching and research interests on the Pacific e.g.:
− University of Hawaii and the associated Centre for Pacific Island Studies
− Kagoshima University and its Research Centre for the Pacific Islands
− University of New South Wales with its Centre for South Pacific Studies
− University of the South Pacific (USP)
• The International Centre for Island Studies (ICIS)
• United Nations (UN), especially:
− Economic and Social Commission for Asia Pacific (ESCAP)
− United Nations Commission on Trade and Development (UNCTAD)
• World Bank.
Primary and secondary data sources3
There are two basic categories of data sources:
• secondary data sources
• primary data sources.
Both secondary and primary data sources can exist both within and outside an IPA. There is also a relationship between these two sources of data. This is based on the level of detail they provide and the difficulty in acquiring those data, as depicted in Figure 3.
3 Adapted from C West, Competitive Intelligence, 2001

DC&A Manual Final July 2002.doc 21
It is relatively easy to acquire data with a low level of detail from internal secondary sources such as in-house reports. By contrast, obtaining data with a high level of detail is more difficult, requiring access to external sources. This has repercussions both on budgeting (external primary sources are usually more expensive to access) and on staff resources and training (higher levels of skill are required).
Figure 3: Sources of data
Secondary data sources
Secondary data sources are defined as being publicly available. These include all forms of published research. They vary in their usefulness, accuracy and timeliness. Nevertheless, they can often represent a relatively low cost and thorough means of meeting most data requirements. Consequently, they are the most frequently used and most heavily relied on as sources of data for IPAs and other organisations.
Secondary sources exist within and outside an IPA. Given the access available to secondary sources within an IPA, it is useful to access these first before searching externally. Internal secondary sources are likely to have limitations. Unless specifically created to support an IPA information system, they are likely to be incomplete. They will also tend to reflect the interests of those involved in collecting the data in the first instance. This limits, rather than invalidates, their usefulness. Consequently, these sources need to be supplemented using external secondary data sources.
There is a considerable volume of external secondary data sources available for research purposes. This fact, in itself, can be both daunting and frustrating. In many cases, a large number of data sources can be searched but may yield little or no data that are useful or relevant.
External secondary
sources
Internal secondary
sources
Internal primary sources
External primary sources
Difficulty in acquiring
Level of detail available
High
LowHighLow

DC&A Manual Final July 2002.doc 22
The main sources of internal secondary data are listed in Table 3. External secondary data are listed in Table 4. These two tables are not intended to provide an exhaustive list of sources. Neither are they intended to be used each and every data collection exercise. Rather they provide an overview of the variety of sources available and indicate the range of data collection sources that can be used.
Table 3: Internal secondary data sources
Source Comment Library files Not all IPAs have library files or even a library. However,
where an IPA has even a part time library officer, it is likely to have a collection of all types of data available on a shared basis. To be effective, a library needs to be well organised so that collected data can be easily located and accessed.
Staff files IPA staff often keep files that contain data that are kept for personal or general use. These data can typically include data on market trends, companies, newsletters, press cuttings etc. Staff files can provide a useful source if they are known about and shared within an IPA.
Market research reports
Market research reports are usually commissioned for specific purposes. Nevertheless, they can contain useful data that can be used for other purposes.
Professional, trade and industry association reports
Association membership can often provide useful access to reports and statistics, especially on general market and industry trends and news on members and member activities. Membership can also provide a means of meeting existing and potential investors.
Table 4: External secondary data sources
Source Comment Government Governments worldwide collect information across a diversity of
issues. This can include census reports on the general population, specific industry survey data, trade data, investment data etc. In many cases these data are available free of charge or at below commercial rates to public sector agencies.
Libraries Data can be obtained from a variety of libraries. These include regional and national libraries, university libraries, trade and industry association libraries and private libraries. Many of these have on-line search capabilities where hard copies of documents can be ordered. They can also have specialist staff available to assist with information searches. An increasing number have full text search facilities available on the Internet.
Competitor IPAs Other IPAs provide information, investment guides and other reports for promotional purposes. This can often provide comparative data on investment related issues, general industry and sector information, etc.

DC&A Manual Final July 2002.doc 23
Source Comment Investment location advisers
There is a range of specialist location assessment advisors that act on behalf of investors, who collect and analyse data. Some of these data are often used and circulated for their own promotional purposes. These data can provide insights into the issues affecting investors and how different countries are viewed as potential locations for investment.
Regulatory authorities In many countries, industry sectors, especially those formally under government control, are regulated. In the public interest, these industries are subject to review and reporting. While much of the data relates to the performance of the industry and specific companies in the sector in the country, these reports can also provide data on the industry in an international context.
Company annual report and accounts
Limited liability companies are required to prepare a set of audited accounts annually. This to comply with legal reporting requirements and for tax purposes. These accounts can be obtained from the companies direct, or from the authorities where they are required to be filed. Depending on the reporting requirements of the country concerned, these accounts can comprise a reasonably comprehensive set of data about the companies activities, its profit and loss account, liabilities, list of directors, as well as an overview of the companies’ future plans.
Other company documents
A variety of data can often be obtained from companies directly. This can comprise promotional documents, product brochures, catalogues, and prospectuses for share issues and in-house journals and newsletter. All of these can provide specific information on a company, its operations, the sector it is operating in and its products. Together they can be used to build up a complete picture of a company and provide useful insights into what their objectives might be and how they are likely to behave.
Broker reports Analysts in banks and stockbroker research departments operate their own information systems, in a similar manner to that of IPAs. The reason and purpose for their research may be different, but their reports can provide a wealth of information not otherwise available. While weighted towards financial analysis of sectors and particular companies, broker reports are often based on briefings from companies and interviews with company staff. As such, broker reports can provide a range of data related to market and sector conditions and trends, recent investments and their performance, competitive pressures on companies as well as particular management practices, technologies, products and future intentions.
Credit reporting agencies
Credit reference agencies are particularly useful in obtaining information about private companies and investors. This is because they provide reports to suppliers and other clients on whether these companies and investors are safe to deal with. In many cases, credit history reports also provide a range of financial information to support the reference agency’s conclusions.

DC&A Manual Final July 2002.doc 24
Source Comment Company directories and databases
There are a range of international and national directories and databases that provide data about companies. These are usually on a country-by-country basis. The depth of data can be limited. However, the range of individual companies that are covered can be considerable, often running to several thousand entries.
Published media The breadth of published media is substantial and provides data that is both timely and wide-ranging. The main disadvantage of many of these sources is that their level of coverage can be superficial and biased, while a major advantage is that, to an increasing degree, on-line versions of the publications are available. The main sources include: • national and local press • business and trade press journals and newsletters • professional journals • academic publications • bank reports and publications • conference papers • trade association reports.
Some specific examples of secondary sources available are set out in Appendix D. These sources typically provide access to written publications, reports and studies stored in various types of database, data records, files and libraries. As such, they provide avenues for data collection that can be used.
Primary data sources
In most cases, primary sources are a means of filling the data gaps after secondary sources have been used. They can often provide highly relevant and detailed data. However, they are often difficult to access and require direct research to be undertaken, either by IPA staff or by IPA appointed consultants. As with secondary data, there are two sources – internal and external.
Internal sources are in some ways obvious. They are often overlooked or deliberately disregarded because they are considered too subjective and unreliable. These sources can also be difficult to access because there is often a reluctance to share data – sharing data can be seen as conferring advantage to others. Nevertheless, a considerable amount of data resides in the heads of an IPA’s own staff. This may have been gained through previous data collecting and analysis exercises, experience gained in dealing with investor companies, training, or through working with other organisations.
An obvious danger with data collected from internal sources is that it is often difficult to distinguish data and facts from opinion and speculation. In addition, the accuracy of data obtained through internal sources is questionable – the human mind is not designed to provide a faithful recording of events and has difficulties in recalling substantive amounts of data.

DC&A Manual Final July 2002.doc 25
External primary data sources are typically a last resort for data collection purposes. This is because collecting data from these sources is technically challenging and can be costly. There is also a risk that the data may not be forthcoming as the main tool of data, collection is often some form of interview or other survey technique. Nevertheless, external primary data sources can provide specific data for analysis and reporting purposes that cannot be obtained through any other source.
The main sources of primary internal data are listed in Table 5. Primary external data sources are listed in Table 6. Again, these tables are not intended to provide an exhaustive list of sources but are only intended as a general guide as to what sources are available. Pacific IPAs should be aware of the range of sources available, without necessarily expecting to use more than a selection of them.
Table 5: Internal primary data sources
Source Comment IPA staff Staff in contact with the external environment in which their IPA
operates, and in direct contact with stakeholders, are all potential sources of data. New staff joining an IPA can be particularly useful, especially if they have previously worked for other government departments or agencies, worked for the private sector or have worked outside the country.
Table 6: External primary data sources
Source Comment Investor companies Investor companies, both actual and potential, are an important
data source. They are unlikely to provide data where they consider it might do harm to their commercial position. However, they are also aware that sharing data with IPAs can be useful. It contributes to an IPA’s understanding of the issues involved in an investment. This enables the IPA involved a better opportunity to develop improved investor support and facilitation assistance.
Investment location advisers
There is a range of specialist location assessment advisors, which act on behalf of investor companies and collect and analyse data. Some of these data are used and circulated for their own promotional purposes. These data can provide insights into the issues affecting investors and how different countries are viewed as potential locations for investment.
Members of professional, trade and industry associations
Association members have access to information systems of their own. Collectively they collect, store and analyse large amounts of data to support their own activities. Some of this may be available free of charge. In addition, members can provide some data directly, drawing on their own experience or as a representative of their organisations official position on an issue.

DC&A Manual Final July 2002.doc 26
Determinants of collecting data
Typically, an IPA information system works within constraints, which determine both the focus and mix of data collection techniques to be used. Ultimately, data collection is about making compromises and trade-offs to concentrate resources on essential rather than non-essential data – here essential is defined as data most likely to meet the needs of an IPA’s stakeholder groups.
The main determinants influencing the data collection techniques used are:
• the nature and characteristics of the data required
• the level of detail needed
• the frequency with which data will need to be collected
• the staff resources, time and budget available.
Investor perceptions data
An integral part of an investment promotion programme will include knowing what potential investors think about a host location. An IPA can measure this in several ways. It can refer to publicly available reports on its location and its investment climate. A variety of organisations produce these reports, including multilateral institutions. Examples include:
• the country reports compiled for the United Nations World Investment Report
• technical reports by the World Bank and Asian Development Bank
• investment guides compiled by private consultancy firms such as PricewaterhouseCoopers and KPMG and investment reviews produced by specialist foreign investor magazines like Strategic Direct Investor
• country reports compiled by banks such as Westpac and Bank of Hawaii
• country reports produced by commercial organisations such as the Economist Intelligence Unit (EIU).
Unfortunately, not all these publications cover all Pacific Island countries. So, it may be necessary to try a variety of sources to get the data required.
An alternative way to measure investor perceptions of your location is to administer a survey questionnaire to a target audience of companies and investment location advisers. This target audience needs to be large enough to yield a sufficient quantity of responses. With only 5 – 15 percent of those contacted likely to respond, a target survey population of at least 500 is desirable.
In selecting the companies to be surveyed, a matrix approach is recommended, where firms are categorised according to predetermined criteria such as:
• geographical location (USA, Asia, Europe, etc.)
DC&A Manual Final July 2002.doc 27
• size of firm (large, medium, small) by capitalisation or sales
• sector in which they operate
• existing operations in the region or not.
This will give a more statistically representative result and allow any bias to be accounted for. That is to say, if questionnaires were sent to 500 companies and completed forms were received from 50, of whom 40 were large manufacturing companies with their headquarters in the USA, the results could not be presented as being representative of, for example, small European companies that operate in the tourist sector.
An example of the sort of questionnaire that could be sent out is given in Appendix E.
Locating data
A key challenge in the data collection process is the task of physically locating the data. This requires some understanding of where data are likely to be stored and managed. There are three methods normally used for data storage and management:
• libraries
• databases
• the Internet.
Libraries
Libraries, whether internal or external, provide a useful and often low cost location for data.
The main advantages of libraries are that they are normally well organised and provide a number of ways of searching for and accessing data quickly. Where data are not available from a particular library, there often exists an inter-library system such that data can be obtained from another library.
There are disadvantages to libraries. In particular, some libraries are set up for particular user groups and may, therefore, be restricted. They also require physical access, either directly by IPA staff or indirectly through a librarian.
Databases
The use of databases to store and manage data is not new. However, there has been a trend toward the use of electronic databases to speed up the search and collection process.
Some databases are propriety, with data gathered for resale, usually on some form of one-off payment or subscription basis. In addition, there are a growing number of guides designed to identify sources of data – a database of databases.

DC&A Manual Final July 2002.doc 28
The Internet
The Internet has become popular as a method of searching for data. It provides access to data on a global basis. Most organisations of any significance now appear to have some form of presence on the Internet. In many cases, they provide information that is often not available through any other medium, such as hard-copy reports, fact sheets etc.
In many cases, access to the data provided through Internet sites is free, although some sites charge. However, free data are not the same thing as costless data. One of the more substantive problems posed by the Internet is that that data it contains are not well organised. It can, therefore, take considerable skill, thought and time to identify the sites likely to be of most interest and to provide the data required. The other major problem is that the quantity of data does not always equate to quality of data. Some Internet searches can provide hundred of references, but none of them can end up being of any relevance. This can impose considerable time costs.
A common way of overcoming some of the drawbacks of using the Internet as a data source is to use search engines. There are a number available. Some of the more widely recognised and used include:
• Yahoo – http://www.yahoo.com/
• MSN Web Search – http://www.searchmsn.com/
• AOL – http://www.search.aol.com/
• Excite – http://www.excite.com/
• Lycos – http://www.lycos.com/
• Alta Vista – http://www.altavista.com/
No search engine can provide a complete search of all web-sites. However, a method of running multiple search engines at the same time is to use ‘web crawlers’. The more widely used of these includes:
• Google – http://www.google.com/
• Webcrawler – http://www.webcrawler.com/
• Mamma.com – http://www.mamma.com/
• Metacrawler – http://www.metacrawler.com/index.html
• Monstercrawler – http://www.monstercrawler.com/
• Copernic – http://www.copernic.com/.

DC&A Manual Final July 2002.doc 29
Chapter 5 Data collection, storage and management
If you were designing the sort of information-processing system a brain is, it would be extremely impractical to store memories permanently in their original form. You need mechanisms for transforming and recording them; for ‘chunking’ information into categories. Source: Judith Hooper Teresi, listed in Cyber Nation http://www.cyber-nation.com/victory/quotations/subjects/quotes_information.html
Tools and techniques
The first ‘rule’ for the collection, storage and management of data, as in many other activities, is to be systematic. That is to say:
• Work out in advance exactly what you are intending to do.
• Decide what measurable outcomes you intend to achieve.
• If appropriate, write a plan of what you intend to do.
• Work out what resources are needed (cost, personnel, etc.)
• As the job is progressing, review progress and, if necessary, revise your plan, i.e. be flexible.
• When the job has finished, assess your performance and look for ways in which it can be improved in the future.
This can be summarised as follows:
• Think
• Plan
• Act
• Review.
Research design
When this is applied to the collection and storage of data, the steps involved are:
• Think about what it is that you are trying to find out about. What are the questions you are trying to find answers for? Who is the information for? What are the expectations of your customers in terms of that information? Where are you likely to find that information? What are you going to do with it once you get it?

DC&A Manual Final July 2002.doc 30
• Write a plan of what you intend to do, i.e. the methodology. At the very least, this can be in the form of notes addressing the above questions, written on a sheet of paper. For a major research project, it can be formally written up and reviewed by your colleagues and immediate manager. It can clearly state the objectives of your research and the expected outcomes. Included in the plan can be a list of key words.
• Investigate possible sources. Referring to the previous chapter, start with what is available internally and then work up to the more detailed if required. Talk to people who are familiar with the subject you are researching. As you go along you will identify additional sources of information. These can all be written down so that you, or someone else, can refer back to them if necessary.
• Talk about your results with your colleagues. Remember that you are part of a team and what is not immediately useful to you may be useful to another IPA officer either now or later.
• Start with a general search, and then progressively refine the search.
• When you find something that might be of interest, don’t just copy the information, but also record the source(s). If you are copying a table from a report (or similar), also copy the title page, table of contents and list of references so that you will be able to return to that report for additional information later.
• When you have finished the job, write a short summary of what you did, noting which sources proved useful and commenting on ways in which the search could have been improved. This can be circulated to colleagues.
Storage and management of data
Basic storage and management
The simplest form of data storage is a filing cabinet where each drawer is allocated to a general category of information, e.g. investors, country information, etc. Dividers with tabs can be used to further categorise information, e.g. for each company. Information in each ‘division’ can be further broken down using folders, e.g. for company reports, file notes of contacts, etc. The importance of this, or any similar system, is that information becomes available to all authorised users. This is, in once sense, a basic library. An example of a simple filing cabinet data storage system is shown in Example 5 in Appendix F.
Where it is not possible to physically store the data in the filing cabinet, because of its bulk or because it is kept at another location, a summary sheet can be inserted showing where the main data are located.
With this system established, any officer in an IPA has instant access to all the known data on any subject.

DC&A Manual Final July 2002.doc 31
A further sophistication of this system is to catalogue all data items on an in-house computer database. This can be done using special purpose cataloguing software or using generic data bases such as MS Access™ or Filemaker™. Although this type of system is time consuming to set up, it pays dividends when the amount of data stored becomes large and when users are in different locations and computers are networked. With an increasing amount of data being sourced in electronic format (CD ROM or direct from the Internet) computerisation of data storage is becoming more important. As a further sophistication, key documents can be scanned so that they are available in electronic format.
Investor tracking
Investor tracking can be integrated into a simple ‘filing cabinet’ type of manual database system. The alternative, and perhaps more common approach, is to have a separate investor tracking system. A relatively straightforward and useful system comprises a diary for tracking progress with and enquiry and a series of pre-printed cards for recording investor data:
• The basic data on each investor (company or individual).
• The specific details of each contact made with that investor as an enquiry progresses. A diary based ‘bring up’ system is usually included so that progress with each investor can be reviewed on a regular basis.
In-house computer based versions of the same system can also be used.
The core data an IPA needs to collect when an investment enquiry is made is set out in Example 6 in Appendix F.
Where an investor company takes an enquiry further, and an investment project appears more likely, then an IPA can collect additional data. This requires the collection of more specific data, related to the potential investment project to be captured. This type of system is the same as used by sales organisations, who often use card-based system. The type of additional data an IPA needs to collect as an investment enquiry progresses is set out in Example 7 in Appendix F.
In-house library
One of the best starting points for data collection is to establish an in-house library. This is something that can be started very simply and be improved as the data collection and analysis ability of an IPA develops. There are, however, key features that need to be incorporated from the beginning. These include:
• establishing a system for recording and filing all items in a consistent way
• setting up procedures for operating and accessing the library
• allowing for the storage, filing and retrieving of all types of media – books of various sizes, documents, maps, electronic media, etc.
DC&A Manual Final July 2002.doc 32
Updating data
Essential to any IPA information system is the need to update data on a regular basis. Data that are not up to date are likely to lead to incorrect inferences and conclusions. It may also advertise to investors that the IPA, and by association the government of the country, is not committed to providing quality investor facilitation services.
Whenever an IPA collects data, the original source of that data and date (year) of collection needs to be noted. In addition, each item needs to be:
• date stamped as it is received by the IPA
• given a future date for review and possible updating, i.e. there needs to be a ‘bring-up’ system operating as part of the cataloguing system for all data received by the IPA.
Larger IPAs will have an officer who is responsible for the recording and updating of all data received. Ideally, this person would be a trained librarian. In smaller IPAs, this is not possible and the task falls to an officer with other duties. Often this means that it is given a low priority. This is a mistake. A better system is to share the responsibility amongst all IPA officers, including senior staff, to emphasise the importance of the task. This can be done by, for example, giving one officer responsibility for all country information, another for all information pertaining to certain industry sectors, etc. The officer is then responsible for managing, (i.e. collecting, collating and updating), all information pertaining to the assigned areas. If a back-up person is also assigned to each area, there will be a continuity of management when the primary person is unavailable.
Manual and computer databases
Making a choice
There is a computer adage of “garbage in garbage out” (GIGO). This applies to any database as much as to a computerised database. There is no substitute for sound planning and a logical system as the basis for any database – manual or computer.
A manual database can be perfectly adequate for a smaller IPA, but if considering an in-house computerised system, the following questions ought to be addressed:
• Is there an adequate networked computer system in place for the database to run on? To buy new computers just to run the database is unlikely to be justified.
• Is all IPA staff properly trained in using computers and do they use computers on a daily basis? If staff is not comfortable and confident in using computers the database will probably be unused.
• Is there someone in-house who can maintain the database? An outside contractor can do the initial set up. However, it is important to have at least one person who can handle the day-to-day problems that will inevitably occur.
DC&A Manual Final July 2002.doc 33
• Are all users of the database in the same office location, or are there sub-offices that need access to the data? For a small IPA, with all users in close proximity, computerisation may not be advisable.
• Is there likely to be a significant quantity of data in electronic format to be collected? If a lot of the data were to be obtained from the Internet or on computer disc, it would be advisable to leave it in that format and have it available to all authorised internal users via an in-house computer database.
If a decision is made to proceed with a computer database, the next question to be addressed is what sort of software to use and whether it will require external expertise to set it up.
Often the choice of software will determine to what extent external expertise is required. A perfectly adequate, though limited, database can be set up using MS Excel or equivalent. This is within the scope of moderately experienced computer users.
The next level up, MS Access or equivalent, requires considerably more experience to set up and is probably best left to experts. But because it is such a popular program, that expertise is available locally in most countries. It is also relatively easy to train IPA staff to maintain the database software.
Above this, there is a range of specialised software to undertake data storage and analysis, which requires a high level of expertise to set up. For most Pacific Island countries, this would entail bringing in a foreign consultant and the risk of unavailability of technical backup on an on-going basis.
Databases for investor tracking
An investor’s perception of an IPA will be based on their varied experiences and, in some cases, contacts with IPA staff. Ensuring these contacts and experiences are positive is important for an IPA, especially since its far easier to retain an existing investor (or a potential investor who has visited the country) than to acquire a new one. This requires a better understanding of the investor and what they expect from an IPA.
Data and data storage and management are the key to a successful relationship. Data about the investor made available to IPA staff being exposed to the investor can go a long way, not only in getting an investment project but also in creating a good relationship with the investor for future investments. It also helps an IPA focus effort where it is most required.
It is difficult to expect the same IPA person to be the single point of contact with the investor all the time. However, by maintaining internal data records of an IPA’s collective contact with an investor, there is no need to re-establish a rapport with an investor. Thus, an IPA ends up presenting one face to the investor no matter who they come in contact. This is something investors appreciate. Moreover, it can provide a major source of differentiation between IPAs.

DC&A Manual Final July 2002.doc 34
Increasingly, organizations, including IPAs, are turning to what are collectively described as customer-relationship management (CRM) systems to develop and maintain a better understanding of their investor’s needs. This allows for better marketing and promotion at less cost. Used in association with data storage and data analysis techniques, investor tracking and management allows IPAs to collect and access data about investors’ requirements, preferences, complaints and other data, so they can better anticipate what investors want. The goal is to instil greater loyalty among investors.
A number of commercial CRM software products are available. These run from the very sophisticated (and expensive) to the simple (and cheap). One of the simplest and most popular of these for sales organisations is ACT!.

DC&A Manual Final July 2002.doc 35
Chapter 6 Analysis and use of data
Did you know that if you torture the data long enough, that eventually it will confess? Source: From collected quotes collected by Gary C Ramseyer, in Gary C Ramseyer’s First internet gallery of statistics jokes, Illinois State University, http://www.ilstu.edu/~gcramsey/Gallery.html
The quality of data4
Typically, producing primary (new) data is expensive. Consequently, data analysts often rely on existing data that were collected for some other purpose (secondary data). Therefore, data analysts need the skills and experience to be able to judge the quality of data produced by others as part of the analysis process.
People do not normally buy a house, a car or a pet without asking some questions about it first. Yet, in many cases, when faced with data people often just accept what is available. The general rule is that all data ought to be treated with scepticism – some data are deliberately designed to mislead and deceive.
Figures often beguile me, particularly when I have the arranging of them myself; in which case the remark attributed to Disraeli would often apply with justice and force: “There are three kinds of lies: lies, damned lies and statistics.”
Source: Mark Twain, Autobiography of Mark Twain, in Twainquotes.com, http://www.twainquotes.com/Statistics.html
There are, therefore, a number of simple questions data analysts must ask of data before performing any kind of analysis, let alone presenting it as information. Among the more sensible questions to ask of data are:
• Where did the data come from?
• Have the data been peer-reviewed?
• How were the data collected?
• Are data missing or have data been added?
• What is causing what?
• What is the context?
• Do the data make sense?
4 Adapted from Darrell Huff, How to Lie With Statistics, 1991 and C Helberg: Pitfalls of Data Analysis (or How to Avoid Lies and Damned Lies).

DC&A Manual Final July 2002.doc 36
The answers to these questions will provide a sound basis for drawing legitimate inferences and conclusions from the data available.
Where did the data come from?
This is the “Who says so?” test. Always ask this question first. You need to know who did the research that created the data you are going to use. Do not accept data at face value. All may not be what it appears to be.
Quite often, it is not possible to obtain a source for the data. Take this as a hint that there may be something doubtful about the data available.
Even where data have an identifiable source, you ought to still query what it is. In particular, are the data likely to be biased in some way? There are two particular forms of bias to watch for: conscious bias and unconscious bias.
Conscious bias usually comes from a desire to distract or deceive intentionally and can come in a number of forms. The include:
• deliberate misstatement
• ambiguous statement
• selection of favourable data
• suppression of unfavourable data.
In many ways, unconscious bias is more dangerous, with data being provided in ignorance rather than with any intent to deceive.
Box 1: Conscious or unconscious bias?
The Pepsi-Cola advert
“In recent side-by-side blind taste tests, nationwide, more people preferred Pepsi to Coca-Cola”. Some relevant questions to ask here are: • Who undertook the blind taste tests? • How many people were asked • Why does it not say “In all recent…”?

DC&A Manual Final July 2002.doc 37
Have the data been peer-reviewed?
Many research reports undergo a process called “peer review” before they are ever published. That means that fellow professional researchers and analysts have looked at the report before its publication and provided comments on its approach, findings etc. More importantly, they have concluded that the author of the report followed the rules of good research and did not torture their data to force them into matching their conclusions.
It is always a good idea to ask if the research was formally peer reviewed. If it was, you know that the data have a degree of accuracy and reliability. However, not all peer reviewers are of equal quality. It may, therefore, be sensible to ask about the experience and competency of peer reviewers. A review of a research report on the tourism sector undertaken by a fishing industry expert, for example, may be of questionable value. Equally, some effort should be made to establish whether the reviewer has any sort of a relationship with the original data analyst who’s paper is being reviewed.
If a research report has not been peer-reviewed, is a good idea to ask why not? It may simply be that few people are interested in discussing why there are so few cinemas in the Pacific compared with the Caribbean. Alternatively, it could mean that the data, and the inferences drawn from it, are so poor as to be worthless and would never stand up to any kind of close third party, let alone professional, scrutiny.
How were the data collected?
This is the “How do they know?” question. It is an important question to ask, especially if the data were not peer-reviewed. Data are not the same thing as reality. However, we are interested in the extent to which data accurately reflect reality.
In many cases, new data are developed from a survey or sample. If this is the case, it is necessary to establish whether the survey was random or not. Many surveys and samples contain bias, which may be accidental and/or deliberate.
Box 2: How do they know?
“Users of Big Grin toothpaste reported up to 30% few fillings than users of other toothpaste.”
Some relevant questions to ask here are: • How many people were in the “Big Grin” toothpaste test group? • Who was in the test group and how were they chosen? • Exactly how many is up to 30%?

DC&A Manual Final July 2002.doc 38
Are data missing or have data been added?
Often data are missing from a data analysis research report. This can severely reduce the value of the data that are available and distort the true picture of reality. The absence of data can be difficult to spot – they are after all not presented. However, their absence can often be detected with careful scrutiny of the data that are presented.
Equally, some data can end up being included that should have been excluded. In many cases this is because the original data are poor, e.g. they come from an unreliable source or contain bias, etc. Again, this raises the possibility that inferences might be drawn from the data that are not warranted.
Box 3: Missing and added and data
Source: Asia Development Bank (2002), Key indicators of developing Asian and Pacific countries http://www.adb.org/Documents/Books/Key_Indicators/2001/COO.pdf
Some relevant questions to ask here are: • What years are being shown? • What inflation value is being shown? • Why is there so much white space above the data line? • Is there some reason that the source of the data is so carefully documented?
What is causing what?
Data are often used to indicate relationships between things. In statistical terms, the relationship is called a “correlation.” However, correlation does not necessarily mean a cause and effect relationship exists.
Inflation in the Cook Islands
Years
Infla
tion

DC&A Manual Final July 2002.doc 39
Box 4: A question of causation
A consortium of electric companies advert
“96% of streets in the US are under-lit and, moreover, 88% of crimes take place on under-lit streets”.
Some relevant questions to ask here: • How might there be a link between street lighting and crime? • Are other causes of crime possible? • What about the other 12% of crimes that take place?
What is the context?
Again, data that are “cherry picked” to look interesting might mean something else entirely once it is placed in a different context.
Box 5: A question of context
Car crashes in winter and summer: an example from Eric Meyer, a professional reporter working at the University of Illinois
My personal favourite was a habit we use to have years ago, when I was working in Milwaukee. Whenever it snowed heavily, we’d call the sheriff’s office, which was responsible for patrolling the freeways, and ask how many fender-benders had been reported that day. Inevitably, we’d have a lead that said something like, “A fierce winter storm dumped 8 inches of snow on Milwaukee, snarled rush-hour traffic and caused 28 fender-benders on county freeways” – until one day I dared to ask the sheriff’s department how many fender-benders were reported on clear, sunny days. The answer – 48 – made me wonder whether in the future we’d run stories saying, “A fierce winter snowstorm prevented 20 fender-benders on county freeways today.” There may or may not have been more accidents per mile travelled in the snow, but clearly there were fewer accidents when it snowed than when it did not. Source: Robert Niles, in RobertNiles.com, http://nilesonline.com/stats/dataanly.shtml
Do the data make sense?
This is an often overlooked question, especially when the data presented appear to be well founded and appeal to feelings, beliefs that or prejudices that people might have. Nevertheless, it is a useful final question to ask.

DC&A Manual Final July 2002.doc 40
Box 6: Are data sensible?
Identifying car thieves.
Data set 1: 10% of all car thieves are left-handed.
Data set 2: All polar bears are left-handed.
Inference: If your car is stolen, there’s a 10% chance it was stolen by a Polar bear.
Some relevant questions to ask here are: • Do the data reflect what is already known or generally understood? • How far do inferences that can be drawn reflect a picture of reality? • To what extent might this reflect someone’s beliefs about who car thieves are?
A final note
You can use all the quantitative data you can get, but you still have to distrust it and use your own intelligence and judgment. Source: Alvin Toffler, listed in Cole’s Quotables, from The Quotations Page, http://www.quotationspage.com/search.php3
It is easy to go blank when presented with data. In fact, some people are depending on it happening. However, remember that there are decision-makers that depend on an analyst to make sense of that data and to provide them with useful usable information.
Always regard data critically and treat data with a healthy dose of scepticism. There are first class data available. But in the course of collecting data, second and third class data will inevitably be found too.
Analysis and interpretation of data
In many respects, large volumes of data are relatively easy to collect, especially if adequate resources and time are available. Generally, however, what is required to solve problems and make decisions is information. In this respect, effective data analysis tools serve to:
• summarise the data through compilation and categorisation
• assist in interpretation.
Compilation
Compilation involves extracting the data that are required, often from several sources, and discarding that which is not required. These data can then be tabulated, either manually or onto a computer. Entering the data onto a computer is to be preferred because:

DC&A Manual Final July 2002.doc 41
• once in electronic format, it is much easier to manipulated
• similarly, it is much easier to convert tables of figures into charts and graphs
• it is much easier to transmit the data to other users via a computer network or e-mail
• it is easier to subsequently update the data.
Categorisation
When data are collected as part of an on-going process, it will be necessary, after compilation, to decide how the data are to be categorised. Sometimes, e.g. in the case of national statistics, this will already have been done. Often, however, it will be necessary to categorise, or re-categorise, data according to the needs of investment promotion.
An example of this might be in labour statistics. When the objective is to promote the country as a location for the fishing industry, the various competing countries are categorised according to the availability of skilled maritime labour, where the country is ranked highly. It is not be particularly sensible to categorise the country according to the availability of computer technicians, where the country might be ranked much lower.
When information is collected as part of a project, e.g. collecting information about international investors active in a particular sector, all of the expected outputs can be defined as part of the project plan. In this way, all of the categories of data to be collected are decided before starting to collect the data. In this example the expected outputs will include:
• tabulations of all active investors, categorised by such factors as sub-sectors, products, nationality, capitalisation, etc.
• a ranking of all active investors according to pre-determined criteria such as activity in the region, probability of future investment in the region, etc. and categorised according to priority ranking
• full contact details, categorised by country.
Interpretation of data
Interpretation is the clarification of the meaning of the data that have been collected. Even data solely as part of an on-going data collection programme require interpretation, either before the data are stored or as an adjunct to routine data storage.
Data reporting and presentation
It is not the intention of this training course to go into detail about report writing and other forms of presentation. This section provides a summary of good practice in the reporting and presentation of data.

DC&A Manual Final July 2002.doc 42
The need to report and present well5
The presentation of data stands and falls on the quality, relevance, and integrity of the content. Nevertheless, it is also the task of the data analyst to report data in such a way that it is accessible and understandable to the stakeholders. It is, therefore, the responsibility of the data analyst to communicate the message of the data effectively. Too often, this crucial part of the data analysis process is overlooked, precisely because of the requirements involved in presenting data well.
A data analyst’s report is, in many ways, their most visible product. Both internal and external stakeholders often regard the reports as evidence of the quality of information and decision support advice and professional capability. Reports that are hard to read or look as if they have been carelessly prepared, no matter how good the analysis, will erode an analyst’s reputation for quality technical work. If a report is of high quality, i.e. straightforward, clear concise and well presented, the reader is more likely to respect and attach weight to an analyst’s judgement and competence. Stakeholders are reassured by consistency of quality in documentation and reporting.
Good reports are those that convey a message quickly and accurately to the reader. It will present a coherent, persuasive message in a clear and unambiguous language that is attractive in design – layout and appearance. Good reports are written with the stakeholder (reader) in mind. They, therefore, are prepared with an understanding of their problems and requirements and to support their decision making process.
The difference between a report that fulfils stakeholder requirements and what stakeholders are often provided with is summarised in Table 7.
Table 7: Stakeholder reporting6
What stakeholders want … What stakeholders often get … • Questions and queries answered
clearly • Answers ‘buried’ in complex, and
often inarticulate, text • Accurate and relevant content • Data dumps or lists of findings • Succinct, explicit writing • Garbled sentences; vague and
abstract sentences • Coherent structure, logically linked • Data confused with implications • A document that is attractive and
easily accessible • A document that is cluttered and
inaccessible
5 The Plain English Campaign and the US Securities and Exchange Commission have each produced useful guides to writing reports. 6 Adapted from PricewaterhouseCoopers, MCS Asia Pacific presentation standards, May 1999.

DC&A Manual Final July 2002.doc 43
General guidelines for reporting and presenting well
There are a number of general guidelines for well reported and presented data:
• Before deciding the type of report or presentation to use, it is necessary to consider the stakeholder audience, i.e. who will be using the data and for what purpose.
• What is the main ‘message’ you are trying to get across to the reader? Structure your report or presentation like a pyramid so that this ‘message’ is at the top. State it clearly up front and then elaborated on it subsequently.
• Provide the data for the reader to draw their own conclusions – don’t limit people by “dumbing” the data – they may spot things the analyst will miss.
• Limit irrelevant clutter in data presentation, which usually causes confusion.
• Important concepts in good design involve separating figure and background (for example, a blurred background often brings the foreground into sharper focus) and use of use of white space.
• Don’t use graphics when a table will do and don’t use a table when text will do.
Types and styles of reporting and presentation
The type and style of reporting and presentation can be very different. However, whether the presentation is on paper (brochures, fact sheets, etc.) or employs the electronic media (video, CD ROM, web site, etc.) the same basic principles apply.
Written reports – text based
It is all too common for large amounts of data and information to be incorporated into the text. This lazy habit needs to be avoided. Most readers, when presented with large amounts of data and information in text form, will read the first few sentences, ‘skim’ the next page or two, and often ignore anything thereafter. Therefore, keep the text simple using every day language. In addition, avoid lengthy passages of text, and to focus on the message you are trying to transmit.
Written reports – tables and graphics
Where there is a lot of data to be transmitted, tables can be very effective. They can be structured to present data clearly and effectively without compromising the need to be honest in what is presented.
Graphics (charts and pictures) are usually much more effective than tables in conveying information. They are used frequently in promotional presentations, particularly where comparisons are being made. Nevertheless, there is often a presumption that tables and, more particularly, graphics are simply “devices for showing the obvious to the ignorant”.

DC&A Manual Final July 2002.doc 44
In presenting data through tables and graphics, the presumption should be that readers are usually both intelligent and curious – they will be willing to explore complex information as long as it is presented with a high quality. Often there is a presumption that people are intelligent enough to understand complex text but somehow too stupid to appreciate relatively straightforward, let alone complex, graphics.
Graphics communicate numbers and concepts visually. You turn to graphics when they stimulate a deeper or quicker understanding and appreciation of a situation than words alone. To create good graphics, you must study the design critically and assess whether it conveys information honestly, accurately, and efficiently.
This said, the purpose of using tables and graphics is not to misapply techniques and lead a reader astray or to suggest an inference from data that the analyst wished to make. If used intelligently and thoughtfully, relatively simple tables and graphics can be used to show considerable volumes of information quickly and with clarity. If used carelessly, graphics can be intentionally or unintentionally misleading. In general, a good guideline to follow is to avoid using any table or graphic that does not reinforce the message from the data. Beyond this, there are some particular points to bear in mind when using tables and graphics.
Keep the design simple
Keep the design of any graphic as simple as possible. Do away any non-essential design elements so the data stands out. Graphic should deal with a data point and not the decoration. Just because software packages allow you to produce graphics with 3-D effects, drop shadows, patterns, and so on does not mean you should use them!
The examples in Figure 4 show how a 3-D bar graph provides initial visual appeal. However, it is harder to read and understand than a straightforward presentation of the same information. The multiple lines of the 3-D bars will confuse some of your readers because the front of the bars appear to have a lower value than the back of the bars.
Figure 4 Graphics with 3D effects can be confusing
0102030405060708090
US$ million
1st Qtr 2nd Qtr 3rd Qtr 4th Qtr
2001
Sales revenues Sales revenues
0102030405060708090
1st Qtr 2nd Qtr 3rd Qtr 4th Qtr
2001
US$ million

DC&A Manual Final July 2002.doc 45
Take care with visual proportions
In general, non-zero baseline scales are best avoided, because they distort correct proportions between the same data. This is demonstrated in Figure 5, where the first graph gives a misleading picture of the magnitude of the changes occurring quarter by quarter – especially the third quarter.
Figure 5 Non-zero access scales can distort visual proportions
Use scales appropriately
Any graphic should be proportionately correct or drawn to scale. The example in Figure 6 shows two blocks representing FDI inflows. While the height scale has increased accurately (3.83 times) in the block representing 2000 inflows, its width has also been increased in the same proportion. Graphically, this tells your reader that FDI inflows have increased by nearly 14.4 time the inflow in 1995!
Figure 6 A problem of scale
Sales revenues
3040
50607080
90100
1st Qtr 2nd Qtr 3rd Qtr 4th Qtr
2001
US$ million
Sales revenues
0
20
40
60
80
100
1st Qtr 2nd Qtr 3rd Qtr 4th Qtr
2001
US$ million
World FDI inflows (US$ mn)
331,068
1,270,764
1995 2000

DC&A Manual Final July 2002.doc 46
Organize data to aid reader insights
Choose an organization that helps your reader grasp information, comparisons and observation you are making quickly. For instance, if you have a list of FDI inflow data by country in one year, list them in descending order by the magnitude of their flows of in alphabetical order.
Integrate text with graphics
As far as is practical, any graphic and its text should be together. You don’t want to break your reader’s concentration by separating the two, forcing your reader on a detour to another page in search of the graphic that goes with the text.

DC&A Manual Final July 2002.doc 47
Appendix A Course outline: Data collection and analysis
Target group: Investment promotion and IT officers
Duration: Three days
Prerequisites: Module II
Objectives: This course will provide the participants with an appreciation of the information required to support the activities of a successful Investment Promotion Agency and suggest methods to capture and secure the data for generating such information.
The participants will be asked to participate in exercises designed to develop generic data collection and information processing systems, which could be implemented upon return to their institutions/departments.
Major topics: The following major topics will be covered:
• The importance of accurate timely information in the Investment Promotion Process - being able to respond to investors’ requirements
• Type of country information required supporting the investment promotion process - economic statistics, policies, labour, levels of investment, raw material availability, market access, etc.
• Type of client (investor) information required supporting the investment promotion process – existing investments, status of investment inquiries, status of investor applications, implementation status of proposed investments, etc.
• Information to be used for promotional purposes - fixed vs. variable information
• Capturing data required to generate relevant information
• Sources of data
• Developing a generic data base of country data
• Developing a generic, card-based investor tracking system and related procedures.

DC&A Manual Final July 2002.doc 48
Style: The course will focus on using examples from existing sources in the Pacific region and the world at large to show the salient elements of information and data systems relevant to the investment promotion process. Participants will be required participate in the design and development of practical generic data systems for country data and an investor tracking system.

DC&A Manual Final July 2002.doc 49
Appendix B Fact sheets to meet stakeholder data needs
Appropriate fact sheets
IPAs will need to prepare a range of fact sheets that can be given to the relevant stakeholders at the appropriate time. These will cover a wide range of topics, which could include one or more of the following:
• a standard marketing information fact sheet that introduces the country’s investment programme
• a series of fact sheets that are specific to various sectors
• a series of fact sheets that highlight the country’s competitive advantages
• a series of fact sheets that are specific to a specific category of stakeholder, e.g. information for the general public in their own country
• a series of fact sheets that are specific to investor categories, e.g. by industry grouping or by country (in which case they may be in that country’s language
An appropriate selection of these fact sheets will often be sufficient as a first rapid response to an enquiry received by the IPA.
An example of a standard marketing information fact sheet is shown in Example 1. It comprises five elements of information.
Example 1: Standard marketing information fact sheet
Section Content Introduction Foreword the head of the Investment Promotion Agency
This can be a short introduction from the Investment Promotion Agency its mission, culture, and the manner in which it will provide professional services to prospective and existing investors. This statement gives the feel of a Letter to Shareholders from a young, agile and professional company. This section can also touch on the major positioning themes for the country as an investment location.

DC&A Manual Final July 2002.doc 50
Section Content 1 The country’s competitive advantage
The purpose of this section is not simply to impart information. Rather, the intention is to develop the foundation for a value-based proposition, with both rational and emotive arguments i.e. what are the main features of the country’s “offer”, which positively differentiate it relative to the other locations. The focus is on the aspects of the country likely to be relevant to investors. It will need to reflect the needs and requirements of the investor and address the following issues: • markets and investment regime • communications and transport • labour issues and human resources • operating infrastructure • property • suppliers • taxation and incentives • environment and quality of life. The level of detail included should be restricted to the key arguments that support the country’s “offer” to investors. Providing too much information in a fact sheet is likely to result in reader “fatigue”.
2 The country’s leading sectors The purpose of this section is to demonstrate the strength and depth of the sectors within the country. This is to support the value proposition established in Part three of the fact sheet: • introduction • sectors – key characteristics, trends and players • additional material of relevance. Again, the level of detail included should be restricted to the key arguments supporting the position that the sector(s) described differentiates the country from other potential locations. As such, the fact sheet will provide information for all the sectors of the economy.

DC&A Manual Final July 2002.doc 51
Section Content 3 Making an investment
The purpose of this section is to demonstrate to a potential investor that the process of making an investment and undertaking activity within the country is straightforward and hassle free. It needs to map out the main steps in the process covering the main elements of an investment life-cycle i.e.: • Start-up – including business registration, tax registration and
other official registrations and approvals required of all businesses and specialized or sectoral approvals required of business investors in particular sectors, i.e. fishing, mining, forestry.
• Establishment – including purchasing land, deeds transfer, developing land, (e.g. construction), obtaining environmental approvals and hooking up utilities.
• Employment – including work permits for foreign investors and expatriates, and labour relations.
• Operation – including importing, exporting, profit repatriation and various inspections requirements required by business enterprises to continue operations on a day-to-day basis.
4 Contact details Contact details for the Head office and overseas offices ought to be provided.

DC&A Manual Final July 2002.doc 52
Appendix C Data tools used by IPAs
Example 2: A country database
To improve staff knowledge, project handling and marketing, the IPA worked with consultants to develop a country database. The database is available to all IPA staff for internal use with external clients. It provides data mainly from internationally recognised sources, for the country and a number of location rivals, on important factors relating to the appraisal of competing locations for investment. It is structured under the following headings: • Markets, business climate and investment regime • Communications and transport • Labour issues and human resources • Operating infrastructure • Property, land and construction • Supplier access • Taxation and incentives • Environment and quality of life. For each heading the Database provides: • selected comparative data demonstrating the competitive position and ranking of
locations relative to the country • identification of key competitors • an overview of the host country’s comparative strengths and weaknesses. Thee range of data contained in the database is provided in Table 8. The advantages of the Database are: • Rapid response – it facilitates rapid response to information enquiries from
stakeholder groups.Marketing and promotion – it provides extensive, up-to-date information and key selling argument for marketing (brochures, fact sheets, stakeholder presentations, mail-shots etc.).
• Officer empowerment – It allows immediate access to location data and to build-up knowledge for intelligent conversations with stakeholders quickly.Ease of use – all data for is available on one database, which is designed to be easily updateable over time.
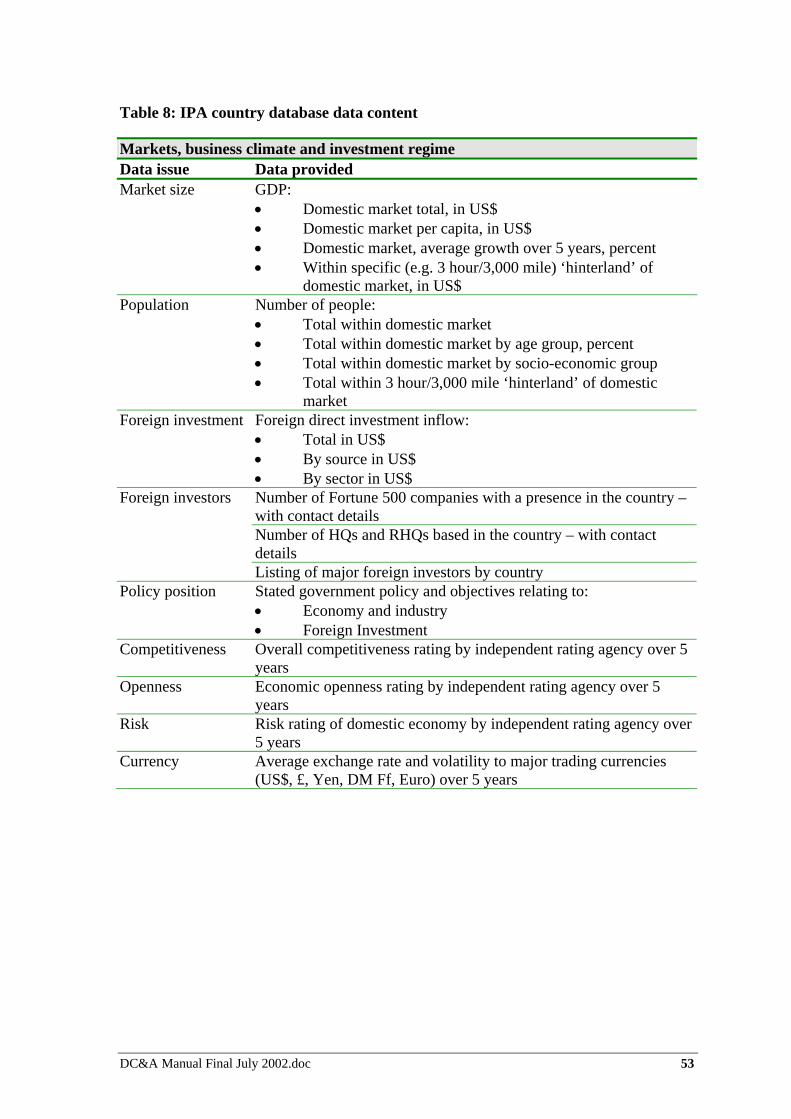
DC&A Manual Final July 2002.doc 53
Table 8: IPA country database data content
Markets, business climate and investment regime Data issue Data provided Market size GDP:
• Domestic market total, in US$ • Domestic market per capita, in US$ • Domestic market, average growth over 5 years, percent • Within specific (e.g. 3 hour/3,000 mile) ‘hinterland’ of
domestic market, in US$ Population Number of people:
• Total within domestic market • Total within domestic market by age group, percent • Total within domestic market by socio-economic group • Total within 3 hour/3,000 mile ‘hinterland’ of domestic
market Foreign investment Foreign direct investment inflow:
• Total in US$ • By source in US$ • By sector in US$ Number of Fortune 500 companies with a presence in the country – with contact details Number of HQs and RHQs based in the country – with contact details
Foreign investors
Listing of major foreign investors by country Policy position Stated government policy and objectives relating to:
• Economy and industry • Foreign Investment
Competitiveness Overall competitiveness rating by independent rating agency over 5 years
Openness Economic openness rating by independent rating agency over 5 years
Risk Risk rating of domestic economy by independent rating agency over 5 years
Currency Average exchange rate and volatility to major trading currencies (US$, £, Yen, DM Ff, Euro) over 5 years

DC&A Manual Final July 2002.doc 54
Markets, business climate and investment regime Data issue Data provided
Inflation rate over 5 tears Inflation Inflation forecast over next 3-5 years Observations as a place "to do business": • From investors • From third-party ‘brokers’ • Chambers of commerce • Academic/independent researchers
Image
Observations of IPA as a “professional agency”: • From investors • From third-party ‘brokers’ • Chambers of Commerce • Academic/independent researchers
Clusters Within target sectors: • Number of companies • Listing of companies – with contact details • Level of employment • Level of turnover/sales in US$ • Level of exports in US$

DC&A Manual Final July 2002.doc 55
Communications and transport Data issue Data provided
Main suppliers of telecommunications provision – with contact details Average time to connect to telephone system for business users Average time to connect to a private international high capacity leased line
Telecommunications – availability
Average time to connect to a private national high capacity leased line Average number of faults per telephone line per year Proportion of telephone line faults cleared by next day
Telecommunications – quality
Average call success rate (percent) Cost, per minute of: • An in-country local telephone call - standard business hours
rate • A long distance telephone call - standard business hours rate• An international telephone call to selected international
destinations - standard business hours rate • An incoming free-phone call from selected international
destinations Total non-call related costs, e.g. connection costs, line rental etc
Telecommunications – costs
Average monthly cost of leasing a private high capacity leased line to selected international destinations Main suppliers of logistics services provision – with contact detailsLogistics services Cost of despatching: • 40kg, 80kg, 150kg, 350kg and 500kg over 200kms by road • 40kg, 80kg, 150kg, 350kg and 500kg over 200kms by road • 40kg, 80kg, 150kg, 350kg and 500kg to selected
international destinations Major carriers servicing the country – with contact details: • Passenger • Freight Number of direct international passenger flights available per week (no stops or connections)
International air services
Total main city to main city travel time to selected international destinations (covering road/air/road components) Main suppliers of sea freight services – with contact details Port charges at the country ports (covering pilotage, towage, mooring, harbour dues, berthage and wharfage) Cost of despatching 20 foot and 40 foot general cargo container to selected international destinations Number of days for a standard 20 foot general cargo container to be unloaded and cleared through customs after arrival Volume of freight handled by the country ports
International sea freight services
Number of freight sailings each week from the country to selected international destinations

DC&A Manual Final July 2002.doc 56
Labour issues and human resources Data issue Data provided
Number of people in the labour force Proportion of labour force unemployed Ease of obtaining labour Ease in obtaining fluent multi-lingual speakers
Labour availability
Ease of obtaining work visa for employment of expatriate staff Number of degree qualified graduates, per 1,000 of population Number of secondary education qualified people, per 1,000 of population Number of trade qualified people, per 1,000 of workforce Number of multi-lingual speakers by language per 1,000 of workforce
Labour skills
Standard of English language skills of workforce Labour costs – general
Annual direct cost (salary & on costs) of a: • General manager – 10 years experience • Financial manager –10 years experience • Manufacturing plant manager –10 years experience • Qualified accountant – 5 years experience • Sales and marketing executive –5 years experience • Tradesperson (e.g. electrician, builder, toolmaker) –5 years
experience • Payroll clerk – 5 years experience • Secretary – 5 years experience • General labourer
Labour costs – specific
Annual direct cost (salary & on costs) of specific categories of labour from within target sectors Productivity per person: • Total • In services • In manufacturing Flexibility/trainability of workforce
Workforce issues
Proportion of employees leaving per year - turnover Number of tertiary establishments Number of undergraduates graduating by course/discipline/grade Number of postgraduates graduating by course/discipline/grade Rating of tertiary establishments Willingness/ability of tertiary education establishments to develop/tailor courses to meet user specific requirements
Education/training
Willingness/ability of tertiary establishments to engage in join R&DStaff disputes Number of working days lost to industrial disputes per 1,000
employed

DC&A Manual Final July 2002.doc 57
Operating infrastructure Data issue Data provided
Main sources of electricity supply available – with contact details Cost per kWh for an annual consumption of 1 million kWh - general published tariff rate
Energy – electricity
Number of power drop-outs or surges per year over 5 years and duration Main sources of gas supply available – with contact details Cost per gigajoule for an annual consumption of 0.1 million gigajoules – general published tariff rate (commercial customer)
Energy – gas
Number of gas service disruptions per year over five years and duration Main sources of water supply available – with contact details Cost per kilolitre for an annual consumption of 0.1 million kilolitres – general published tariff rate
Water
Number of water service disruptions per year over five years and duration Main sources of waste disposal available – with contact details Cost per metric tonne of waste disposed
Waste
Number and duration of waste service disruptions per year over five years

DC&A Manual Final July 2002.doc 58
Property land and construction Data issue Data provided
Total office space vacant m2 by grade Total main city office space vacant m2 by grade Total industrial estate space vacant m2 by grade Total science/technology park space vacant m2 by grade Total business park space vacant m2 by grade Total other commercial space vacant m2 by grade
Commercial property – availability
Nature and type of ‘catalyst’ property initiatives Commercial property – leasing
Normal lease terms and conditions, e.g. • Fees and taxes payable • Lease length • Rent payable in advance • Rent guarantees • Rent indexation • Early termination penalties • Sub-letting provision • Responsibilities for repair Average gross annual rental of office space of at least 1,000 m2, including outgoings, US$ per m2, by grade Average gross annual rental of main city office space of at least 1,000 m2, including outgoings, US$ per m2, by grade Average annual rental for industrial estate single story factory unit with a column free floor area of 4,000 m2 and a uniform internal height of 7m to the eves per m2, US$ per m2, by grade Average annual rental for science/technology park unit with floor area of 4,000 m2, US$ per m2, by grade Average annual rental for business park unit with floor area of 4,000 m2, US$ per m2, by grade Average annual rental for other commercial space with floor area of 4,000 m2, US$ per m2, by grade Cost of 5ha greenfield site with development approval, US$ per ha, on an industrial estate, science/technology park and business park Cost to construct a single story factory unit with a column free floor area of 4,000 m2 with a uniform internal height of 7m to the eves, inclusive of all permits and fees but excluding land costs, US$
Commercial property – cost
Cost to construct an office block (1-3 floors) with a footprint floor area of 5,000 m2, inclusive of all permits and fees but excluding land costs, US$
Construction time Average time taken to design and construct a single story factory unit with a column free floor area of 4,000m2 with a uniform internal height of 7m to the eves, US$

DC&A Manual Final July 2002.doc 59
Property land and construction Data issue Data provided
Time to process and grant building application approval for a single story factory unit with a column free floor area of 4,000m2 and a uniform internal height of 7m on a greenfield site
Planning approvals process
Time to process and grant building application approval for a grade A single story factory unit with a column free floor area of 4,000m2 and a uniform internal height of 7m on a on an industrial estate site, science/technology park and business park

DC&A Manual Final July 2002.doc 60
Supplier access Data issue Data provided Business and professional services – availability
Availability of international banking, finance, venture capital, insurance, property, legal, business, accounting and computer services at world market prices
Daily standard charge-out rate for an international audit firm senior partner, US$ Daily standard charge-out rate for an international management consultant senior partner, US$ Daily standard charge-out rate for a senior commercial law partner, US$ Daily standard charge-out rate for a senior recruitment consultant, US$
Business and professional services – cost
Daily standard charge-out rate for a senior Patents officer, US$ Interest rate (%) charged on overdraft/temporary credit - US$50,000 equivalent Interest rate (%) charged on US$250,000 short-term business loan Cost of property insurance - US$1 million equivalent
Finance & insurance – cost
Cost of plant & machinery insurance - US$5 million equivalent Complex manufactures
Local availability of selected examples of complex manufactures (e.g. extruded plastic, stainless steel, circuit boards, microprocessors, machine tools and motor vehicles) at world market prices

DC&A Manual Final July 2002.doc 61
Taxation and incentives Data issue Data provided
Total tax burden as a percentage of GDP Indirect tax revenues (taxes on services) as a proportion of GDP
Taxation – burden
Take home pay as a proportion of gross pay Standard rate of corporation tax Effective rate of corporation tax Sales tax on goods and services Withholding tax on interest to parent corporation Employment taxes
Taxation – rates
Standard rate of personal tax Incentives Type and nature of incentives available and associated conditions:
• Tax incentives either through reduced rates, offsetting capital allowances, tax holidays or favourable tax treatment
• Cash grants associated with capital expenditure, and/or employment, and/or training
• Special incentives (tax allowances, grants, or support in kind) for particular qualifying activities
• “Subsidised” capital or operating costs associated with, for example, land or property, utilities provision (installation costs or supply charges), infrastructure (road, rail or sea facilities)
• Favourable loans or loan guarantees

DC&A Manual Final July 2002.doc 62
Environment and quality of life factors Data issue Data provided Quality of life Overall quality of life rating by independent rating agency over 5
years Number of international schools Schooling Average annual cost of secondary level education in a residential private or international school Vacancy rates for three bedroom executive house within 30 minutes of main city, based on minimum rental of 6 months, in US$
Housing
Monthly rental of three bedroom executive house within 30 minutes of main city, based on minimum rental of 6 months, in US$
Cost of living Average monthly expatriate living expenses in US$ Shopping facilities Availability of quality 'western-style' shopping facilities
Number of theatres with 'live' entertainment facilities within 30 minutes of main city Number of museums within 30 minutes of main city Number of public art galleries within 30 minutes of main city Number of large/international cultural events held per year
Cultural facilities
Listing of designated ‘cultural’ and heritage’ sites within 60 minutes of main city Number of murders per 1,000 population Number of personal assaults per 1,000 population
Level of security
Number of robberies per 1,000 population Number of parks and nature reservations within 60 minutes of main city
Environment facilities
Size of park and nature reserve area within 60 minutes of main city Annual average daily concentration of NOX pollution parts per million Annual average daily concentration of SO2 pollution parts per million
Air quality
Annual average daily concentration of suspended particulates pollution parts per million Average time taken to travel 10km from the main city by car Travel times Average time taken to travel 10km from the main city by public transport

DC&A Manual Final July 2002.doc 63
Example 3: A sector database
To improve staff knowledge, project handling and marketing the IPA worked with consultants to develop a Sector Database. The IPA had selected a number of specific target sectors of focus for its investment promotion efforts. For each target sector, a document was produced for internal use to provide constructive information to assist the IPA staff in discussions with stakeholders on a sector/activity specific basis. They provide enough detail for the IPA staff to respond to a stakeholder enquiry and to demonstrate knowledge of: • Industry conditions and trends • The likely nature and scale of an investment • Competitive issues and likely competitors • Arguments in favour of the location. The Database is particularly useful the following situations: • If a specific enquiry emerges which represents one of the specific target sectors, it
will provide a detailed briefing in preparation for a meeting with the enquirer. It will also provide specific insights into the likely issues and suggesting positive points that can be made, which are of relevance to the enquirer.
• If an stakeholder is to be met and is known to have generated investment projects in the past, or expected to generate projects in the future, the sector information papers provide more detailed insights to issues of importance in the investment decision-making.
• The information set out in the Database is based on an amalgam of actual border investment projects. They represent a distillation of experience in their location appraisal and site selection. This is supplemented with the experiences of staff from a variety of IPAs and other advisers who have dealt with investment projects and additional research.
The contents, therefore, do not relate to any one case. The objective is to illustrate characteristics of, what might be best described as, ‘typical cases’, which provide background information, before additional, and more specific, sector and investor research. The layout of the database follows a common format for ease of reference: • Background information comprising:
− general description of sector/activity under consideration − main trends, drivers and features of the sector/activity − review of the market and industry environment that impacts on an investor
client and any corporate strategy considerations that influence the investment location decision
− main features of the major corporate decision makers within the industry/activity
− level of expected international mobility of investment.

DC&A Manual Final July 2002.doc 64
• Investment project information: − an outline of a ‘typical’ investment project within the sector/activity,
describing it in non-technical terms − the quantifiable aspects associated with the proposed investment i.e.
capital investment, number of jobs, site/property needs. − the criteria influencing an investors’ location decision, listed in order of
importance. • Country position:
− the level of priority given to potential investment projects as new projects or re-investment by existing investors
− identification of the most likely rivals to the country and the location ‘offer’ issues likely to place them at a competitive advantage
− core arguments to be used with stakeholders. An example of the sort of information contained in the database for the transportation sector is provided in Table 9. The advantages of the Database are: • rapid response – it facilitates rapid response to information enquiries from
stakeholder groupsmarketing and promotion – it provides extensive, up-to-date information and key selling argument for marketing (brochures, fact sheets, stakeholder presentations, mail-shots etc.)
• officer empowerment – It allows IPA immediate access to location data and to build-up knowledge for intelligent conversations with stakeholders quickly
• ease of use – all data for is available on one database, which is designed to be easily updateable over time.

DC&A Manual Final July 2002.doc 65
Table 9: IPA sector database content example – transportation sector
1 Background information Sector/activity description • The transportation market encompasses all those activities associated with
moving goods from a customer through to the end user. • The main segments of the transportation market of relevance are:
− Ocean carriers - predominantly international, comprises a small number of suppliers with global capability, suffers low margins; barriers to entry and exit are high.
− Air carriers - comprising, domestic, regional and international suppliers, is highly fragmented, typically handles smaller volume but relatively high value shipments; pressures on margins are increasing; barriers to entry and exist are high at the regional and international level.
− Third party logistics (3PLs) providers, comprising freight forwarding and consolidation, warehousing and transport - contains a variety of intermediaries facilitating all or part of the logistics and management processes associated with transportation.
Sector trends and characteristics Globalisation • The globalisation of activity has driven multinational
companies (buyers/shippers) to seek maximisation in the effectiveness with which they supply their goods to their customers.
• Often this requires reducing the cost of delivering the final good, reducing the time involved in delivering it and moving towards a demand-driven strategy.
• The main trend and driver for transportation services is a direct reflection of the main driver for buyers/shippers.
One stop-shopping • There is growing interest among buyers/shippers for one-stop shopping for transport and logistics services.
• Transportation companies are, therefore, also continuously expanding their overall service offerings to adapt to the various needs of their global clients.

DC&A Manual Final July 2002.doc 66
Sector trends and characteristics Increased outsourcing by multinational customers
• Buyers/shippers have supply networks formed by all the operations and companies linked to supplying the goods and services to, and within, the company and through to end customers.
• These networks require the management of the entire chain of raw material supply, manufacture, assembly and distribution to the end customer.
• At present, truly global supply chain partnerships with multinational companies do not exist - the trend is toward achieving this position as an end objective.
• As globalisation of investment and activity becomes more prevalent, their transport and distribution needs become greater, but takes buyers/shippers out of their area of core competency and is expensive, in terms of transportation and associated management and logistics activity.
• Many buyers/shippers are opting to outsource these, and related, activities, although the range of services used, in practice, is limited to basic transportation, warehousing and bill auditing and payment.
• The main reasons buyers/shippers are outsourcing of transport and logistics functions is to: − retain focus on core competencies − reduce operating and inventory costs − improve cycle times − avoid investing in non-core assets and activities − improve customer service − take advantage of the transport providers leverage
and use of best practices to reduce total distribution costs and improve service.

DC&A Manual Final July 2002.doc 67
Sector trends and characteristics Alliances, mergers and acquisitions and industry consolidation
• Competition has made it increasingly difficult for large transport services providers to identify any gaps in the global market place, allowing organic expansion a difficult option.
• As the industry matures, companies are turning increasingly to alliances, mergers and acquisitions as a cost-effective means of broadening their service offerings and market coverage in an effort to provide one-stop shopping for their customers.
• Alliances, mergers and acquisitions are seen as a means of being able to offer a wider range of services, increased ability to focus on the core competencies, broader geographic coverage, access to leading-edge information technology, and access to industries not previously served.
• Examples of activity include: − Maersk’s US$800 million acquisition of Sea-Land
in August 1999 to form Maersk-Sealand − the development of major ocean carrier alliances,
the biggest being New World Alliance (APL, NOL, MOL and Hyundai), Grand Alliance 2 (P&O Nedlloyd, NYK, Hapag Lloyd, OOCL, MISC), United Alliance (Hanjin, DSR-Senator, Cho Yang, UASC) and K Line/Yangming/Cosco.
− Nippon Express USA, a leading global freight forwarder has, together with 15 other forwarders and 20 major airlines, formed Cargo 2000.
Market, sector and corporate strategy issues Buyer preferences • Buyers/shippers tend to undertake transport and logistics
activity in-house. • Where transport and logistics activity is outsourced,
buyers/shippers contract with a limited number of transport services providers and there is a clear trend towards reducing the number of providers used.
• The objective of contracting with a limited number of geographically strategic transport suppliers is to ensure that product and service deliveries to customers can be assured.
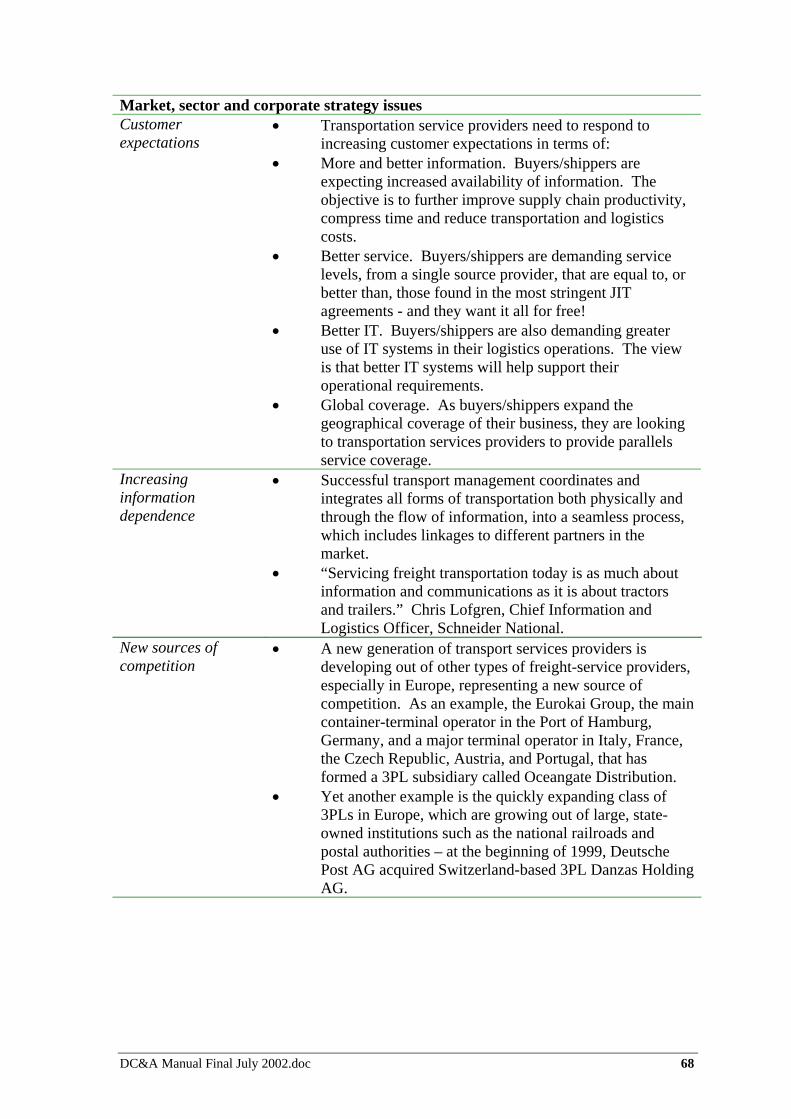
DC&A Manual Final July 2002.doc 68
Market, sector and corporate strategy issues Customer expectations
• Transportation service providers need to respond to increasing customer expectations in terms of:
• More and better information. Buyers/shippers are expecting increased availability of information. The objective is to further improve supply chain productivity, compress time and reduce transportation and logistics costs.
• Better service. Buyers/shippers are demanding service levels, from a single source provider, that are equal to, or better than, those found in the most stringent JIT agreements - and they want it all for free!
• Better IT. Buyers/shippers are also demanding greater use of IT systems in their logistics operations. The view is that better IT systems will help support their operational requirements.
• Global coverage. As buyers/shippers expand the geographical coverage of their business, they are looking to transportation services providers to provide parallels service coverage.
Increasing information dependence
• Successful transport management coordinates and integrates all forms of transportation both physically and through the flow of information, into a seamless process, which includes linkages to different partners in the market.
• “Servicing freight transportation today is as much about information and communications as it is about tractors and trailers.” Chris Lofgren, Chief Information and Logistics Officer, Schneider National.
New sources of competition
• A new generation of transport services providers is developing out of other types of freight-service providers, especially in Europe, representing a new source of competition. As an example, the Eurokai Group, the main container-terminal operator in the Port of Hamburg, Germany, and a major terminal operator in Italy, France, the Czech Republic, Austria, and Portugal, that has formed a 3PL subsidiary called Oceangate Distribution.
• Yet another example is the quickly expanding class of 3PLs in Europe, which are growing out of large, state-owned institutions such as the national railroads and postal authorities – at the beginning of 1999, Deutsche Post AG acquired Switzerland-based 3PL Danzas Holding AG.

DC&A Manual Final July 2002.doc 69
Market, sector and corporate strategy issues IT system requirements
• The right information technologies to support global networks are vital in order to provide clients with a global visual pipeline and to administer their logistics activities.
• Awareness of this has driven many transport providers to develop proprietary IT systems that can provide unique benefits to their clients and differentiate the company’s product and service from that of competitors.
• Increased IT sophistication is seen by carriers as a key marketing, pricing and asset utilisation tool - this is particularly the case, where attempts are being made to establish global customer accounts.
• Internet technology is expected to produce transactional efficiencies, but will not change other economic forces that drive growth, shipment size and industry structure.
Pressure on margins and negative impact on profitability
• Most transport services companies are facing increased pressure on margins, brought about through a combination of: − increased competition from existing and new
sources − expansion of investment and activity into new
geographic areas to meet customer demand for increased geographic coverage.
− rising costs – from expansion into areas of new products and services provision and increased investment in new technology, especially in the development of end-to-end global visual pipe lines
− customers leveraging their purchasing power to negotiate better prices, or product and service improvements, from preferred transport providers.
• Ocean carriers are being affected by a combination of overcapacity, fundamental imbalances in the structure of trade, necessitating empty container repositioning and associated costs.
Regulatory changes • For ocean carriers, the recent enactment of the US Ocean Shipping Reform (OSRA) Act, 1998, which will deregulate some aspects of the way ocean carriers do business together, has heightened many shippers’ expectations regarding service.
• OSRA provides an opportunity for carriers to deepen customer relationships, especially on a global scale - the main route for this will be to negotiate contracts on the basis of improved and additional value-added service rather than purely on price.

DC&A Manual Final July 2002.doc 70
Key players Major global ocean carriers
• The trend in mergers and acquisitions can be seen in the increased concentration within the ocean carrier market - the 25 leading carriers currently control about 61 % of the worldwide container carrier capacity.
• The top 10 carriers aggregate 38% of total container capacity, of which the top five carriers are: − Maersk-Sealand + SLC − Evergreen Group − P&O Nedlloyd − Hanjin / DSR / Senator − Mediterranean Shipping Co.
Major global air carriers
• Of the top 50 carriers that report to IATA, approximately 80% of total freight tonne kilometres (FTKs) flown are on commercial airlines.
• The top 5 carriers in terms of FTKs are: − Federal Express − Lufthansa − United Parcel Service − Singapore Airlines − Korean Air Lines.
Major global 3PLs • The top five 3PLs in terms of revenue are: − TNT − Nippon Express − DFDS Dan Transport − Schenker − Ryder − DHL Worldwide Express.
Mobility • As buyers/shippers expand the geographical coverage of their business, they are
looking to transportation services providers to provide parallels service coverage, which means the industry must invest where the demand is, both in end-markets and in strategic hub locations.
• Transportation service companies have responded to the trend in buyer/shipper business requirements by expanding their activity and investment geographically.

DC&A Manual Final July 2002.doc 71
2 Investment project Investment project description • The project will be critically dependent on whether the transportation service
company is asset based or not and, therefore, whether the investment is development of a ‘hub’ or service office.
• ‘Hub’ investments will have high demand for freight handling, warehousing and administration office space and associated transportation infrastructure.
• Service office investments will have high demand for transportation infrastructure and supplier support.
Project characteristics Capital investment • Hub investment:
− will be a high capital investment project − property will be a major cost item, because of
space and property requirements. • Service office investment:
− will be a low capital investment project − office and IT equipment comprise the largest
capital cost. Number of jobs • Hub investment:
− this can vary widely, depending on the geographical area to be covered, the size of company and the number of functions included
− from 30-50 to 300-500, depending on operation. • Service office investment:
− from 10-15 to 200-300, depending on operation. Project ramp-up • Hub investment:
− final establishment for full operations will be within 24-36 months
− exact timescales will be dependent on the outcome of discussions on whether bespoke premises are to be built.
• Service office investment: − typical objective is to be operational within 6-12
months.

DC&A Manual Final July 2002.doc 72
Key location criteria Market • The choice of market will be driven by consideration of
existing and likely future customer requirements. • Investors are also likely to place emphasis on an existing
cluster of ‘peer’ organisations and functions. Communications and transportation
• Easy and free access is required for freight facilitated by proximity of high quality international transport facilities.
• Restrictions on the use of the international transport infrastructure will be a major consideration for air carriers and 3PLs, which increasingly operate on a 24hr, 7 days basis.
• Accessibility to a road/rail “feeder” network and its connections with the international transport infrastructure is also an important consideration.
• There is a need to be able to communicate with customers, suppliers and internally within the company over disparate geographic locations.
• Infrastructure concerns for shared services centres are principally associated with the standard/quality of and costs of the telecom infrastructure.
Property • Initially require large area of freight handling space with good access to international transport facilities and wired for international networking.
• A hub facility will probably require bespoke office accommodation, with a preference for a high quality logistics or business park environment.
• Flexibility in the use of space and availability of future expansion space will also be a consideration.
Taxation and incentives
• The experience in assessing locations for the European transport and logistics centres suggests that package deals to help reduce establishment costs (and potentially on-going operations costs) may be a consideration.

DC&A Manual Final July 2002.doc 73
3 Country position Project priority New projects • High priority – only for container traffic and specialised
3PLs and where identified gaps in the logistics value chain are identified.
Aftercare • High priority: − to maintain continuity in the development of the
infrastructure to ensure the country’s competitiveness
− due to high interdependence with trade related sector.
Country competitor considerations Overall • Competition is most intense in the ocean and air carrier
sectors and is reflected in location competition. • Major shipping and airline companies are forming close
relationships with a few key ports and airports. • Key to attracting these companies, therefore, is the ability
to claim ‘hub’ status within an important region or economic hinterland, which will rely partly on location, but increasingly, requires adequate infrastructure and a high concentration of logistical support services.
• Within Asia/Pacific, the adequacy of transportation infrastructure will be a key competitive factor in the medium- to long-term, e.g. there will soon be inadequate infrastructure to handle air traffic at peak periods.
• Although many Asia/Pacific airports handle fewer flights overall than Europe and North America hubs, they still experience severe air traffic congestion problems.
• There is increasing competition on the basis of on-going development of existing airports, e.g. Chek Lap Kok, Tokyo Narita, Singapore Changi, Seoul Kimpo, Bangkok Don Muang, which will increase as international airports in Korea, Kuala Lumpur, and China (Shanghai), open and build up traffic.
Competitor A • Already a transportation service hub – the second largest hub for container traffic in the world.
• Allied transportation developments include a marine base, a logistics supply base servicing the oil and gas exploration and production industry in the region.
• Strong reputation for pragmatic approach to deal making through provision of tailored incentives packages.

DC&A Manual Final July 2002.doc 74
Country competitor considerations Competitor B • Has an ambitious plan to develop its position as a
transportation hub. • Specific catalyst investments include:
− the new island super port − the redevelopment of the international airport -
operational in 1998, which is designed to handle 45 million passengers a year
− the associated express rail link from the capital city to the new international airport.
• Wide range of incentives available to investors. Competitor C • A top 10 container port by volume.
• Is seeking to expand facilities to increase its share of port traffic.
Country supporting arguments (summary) • Strategic location relative to major growth markets. • Excellent supporting infrastructure for air transport, e.g.:
− airport is part of the country infrastructure development programme – one of the largest in the world
− represents one of the top five air transportation markets − a Logistics Centre and a Marine Cargo Terminal at the airport is under
consideration − airport operates 24-hours − an annual operating capacity is 87 million passengers and 9 million tomes
of cargo − two new air cargo terminals have been built to handle freight forwarding
and express air cargo − ranked number 1 airport for handling air cargo.
• Has closest proximity of the airport and port of any other major infrastructure facility.
• Excellent supporting infrastructure for sea transport, e.g.: − advanced port facilities and efficient port handling underpin position as a
world trading entity − operates the largest and busiest port in the world for container traffic − an additional container terminal is under development − turnaround times at the port are some of the most efficient worldwide.
• Track record: − there are nearly 100,000 trading companies in the country, employing over
500,000 − there has been an average annual growth rate of 10.3% in import and
export since 1992 • Strong supporting telecom, financial and insurance facilities. • Generally low cost transportation costs.

DC&A Manual Final July 2002.doc 75
Example 4: An integrated use of databases and data
The Industry Development Directorate of the Western Australian Department of Industry and Technology provides advice and services to stimulate industry development in Western Australia; and facilitates investment and business attraction to the State. 1. Client management information system (CMIS) The CMIS is a confidential investor-tracking database that is accessible (password protected) from all of the Department’s networked computers as well as from interstate and overseas offices. 2. Industry database (IDB) The IDB is a general purpose database, used by the whole Department, for storing and retrieving information pertaining to industry. 3. Country Information The Directorate has developed excellent working relationships with other state and national departments from which they can access data for investment promotion purposes as and when needed, e.g. the Australian Bureau of Statistics for trade data, the Australian Bureau of Agriculture and Resource Economics (ABARE) for statistics on agriculture and mineral resources. As a subscriber, the Directorate has immediate on-line access to this data. 4. Data analysis and presentation Only a limited amount of work is done in-house on analysing and presenting data. Consultants are employed for sector studies as required. Preparation of promotional brochures and electronic media is contracted out. 5. Investment promotion A variety of promotional materials have been produced including: • Brochures • Video • CD-ROM • BIG.WA website

DC&A Manual Final July 2002.doc 76
Appendix D Data sources on the Internet
General data
Commonwealth Secretariat
The Commonwealth Secretariat site has a publications section in its site. This provides access to a range research studies, journals, handbooks and directories, and the reports of meetings and seminars, covering political and economic affairs and all areas of development, which is published by the on the Commonwealth Secretariat. Sales publications need to be ordered. http://www.thecommonwealth.org/
Kagoshima University, Research Centre for the Pacific Islands
The website provides access to the research institute’s publications archive, including the academic journal, South Pacific Study, occasional papers, and South Pacific Newsletter. http://cpi.kagoshima-u.ac.jp/publications.html
The website also supports links to other websites with information on and about the Pacific Islands. http://cpi.kagoshima-u.ac.jp/links00.html
OFFSTATS
This is a New Zealand site with links to a host of statistical sources from around the world. http://www2.auckland.ac.nz/lbr/stats/offstats/OFFSTATSmain.htm
Pacific Islands Forum Secretariat
Pacific Islands Forum Secretariat is the administrative arm of the Pacific Islands Forum. The site provides a range of trade and investment data, business cost data, tourism statistics, private sector development policy information and a trade directory for Forum Island Countries. http://www.forumsec.org.fj/
Pacific Islands Trade and Investment Commission (PITIC)
The Pacific Islands Trade and Investment Commission provides a range of business support services for all aspects of trade and investment between Australia and the 14 Pacific nations comprising the Forum Island Countries. The website provides business information on the Forum Island Countries, with details on their economies and governments. http://www.sptc.gov.au/home/home.htm

DC&A Manual Final July 2002.doc 77
Secretariat of the Pacific Community (SPC)
Secretariat for the Pacific Community site provides a range of land, marine, social and socio-economic information resources. The site also includes details of its library and on-line library catalogue. http://www.spc.org.nc/
Site Selection
Site Selection is the official publication of the International Development Research Council. It provides a range of information for investor companies covering country assessments and profiles (recent assessments include Helsinki, Trinidad & Tobago), location specific profiles (these are almost exclusively North America focused, with recent profiles include Canada, Illinois and Kentucky) industry reviews (recent reviews cover advanced manufacturing, automotive and call centres). Also available are a number of data research tools. These are USA focused and provide data on for sale or lease and various area demographics. http://www.siteselection.com
Strategic Direct Investor
Formerly Corporate Location, Strategic Direct Investor provides a range of information on cross-border investment issues aimed at IPAs and investor companies. Information available includes location studies (recent studies include Dominican Republic, Spain and Ireland), investor profiles and interviews, industry and sector profiles and reviews (recent reviews include e-business, biotechnology, automotive and distribution) and investment news items. Registration (which is free) is needed to access many of the information resources. http://www/strategicdirect investor.com
The International Centre for Island Studies (ICIS)
The objective of the International Centre for Island Studies is culturally-appropriate, environmentally-sound and socially-equitable development in small islands worldwide. The website reflects this, providing access to other sites and information on a range of issues of relevance to island countries including: agriculture and trade; alternative technology; aquaculture; biodiversity; climate change; coastal management; conventions and treaties; disaster management; eco-tourism; energy etc. http://www.islandstudies.org/
University of Hawaii
The University of Hawaii has a Centre for Pacific Island Studies. Its website provides a news service for the Pacific Islands, Pacific Islands Report. http://www.hawaii.edu/cpis/
The University of Hawaii on-line resources are also accessible from the website. http://libweb.hawaii.edu/uhmlib/index.htm

DC&A Manual Final July 2002.doc 78
University of Michigan Documents Center
The Documents Center’s web pages are clustered by broad subject area, such as cost of living, economics, foreign trade, and foreign government. http://www.lib.umich.edu/govdocs/stats.html
University of New South Wales, Centre for South Pacific Studies
The website provides an on-line bibliography on the Pacific Islands, covering the Islands and Island Groups as well as a diverse range of topic such as social change, migration, urbanisation, land tenure etc. It also supports links to other websites with information on and about the Pacific Islands. http://www.arts.unsw.edu.au/southpacific/homepage.html
University of the South Pacific (USP)
The University of the South Pacific website provides access to the University’s Libraries http://www.usp.ac.fj/%7Elibrary/:
• The Pacific Information Centre (PIC) is a regional information network based at the University of the South Pacific Library, Suva, Fiji. It is primarily concerned with co-ordinating, collecting and disseminating information on the South Pacific region.
• Pacific POPIN also comes under the umbrella of PIC. It is the focal point for the Pacific on the Asia-Pacific Population Information Network.
• Pacific Islands Marine Resources Information System (PIMRIS) is a co-operative project of the Forum Fisheries Agency (FFA), South Pacific Applied Geosciences Commission (SOPAC), South Pacific Commission (SPC), the South Pacific Regional Environment Programme (SPRAP) and the University of the South Pacific (USP). PIMRIS deals with information on fisheries and non-living resources in the tropical Pacific.
World Bank
The World Bank publishes its annual World Development Report. The full text is available, including all the statistical tables. http://www.worldbank.org/poverty/wdrpoverty/report/index.htm

DC&A Manual Final July 2002.doc 79
Country data
Asian Development Bank (ADB)
The Asian Development Bank site contains a vast database of economic, social and other development statistics for the Asia Pacific region countries. The following link takes you to the index of all the sections: including Data by Region/Country, Data by Topic and Search Query. http://www.adb.org/default.asp
Asia Pacific Economic Cooperation (APEC)
The site provides economic reports, a range of economic indicators, contact details and web site references for each of its member countries. It also a series of databases covering tariffs, labour markets, project activities member country action plans and an economic and technical information exchange. http://www.apecnet.org.sg/
CIA World Factbook
This information comes courtesy of the US Central Intelligence Agency. It is a reasonably useful site, giving a host of economic and other data on a country-by-country basis. Simply click on the country within the site. http://www.odci.gov/cia/publications/factbook/index.html
Economist Country Briefings
For a somewhat less controversial source of country information, this part of The Economist site is excellent. Again, you simply click on a country to get a selection of statistics (under Country Profile), plus briefing articles. http://www.economist.com/countries/
Economist Intelligence Unit
The Economist Intelligence Unit has a well-established reputation for its economic, market and political reporting. Its web site makes available a great deal of information to anyone who takes the time to register. Information that is more detailed is available for a fee. http://www.eiu.com
International Monetary Fund (IMF)
Country reports for all countries of the world can be found on the IMF site. http://www.imf.org/external/country/index.htm

DC&A Manual Final July 2002.doc 80
Three particularly useful publications from the IMF are the World Economic Outlook, Annual Report and International Capital Markets. Each of these has a large statistical annex and can be accessed. http://www.imf.org/external/pubind.htm
IPAnet data
A good starting point if you are looking for economic information for competing investment locations worldwide, which offers several sources of comparative country information. These include the World Bank’s Competitiveness Indicators for more than 136 countries and the U.S. Department of Commerce’s Country Commercial Guides for 108 countries. http://www.ipanet.net
IPAnet also provides links to a number of “partner sites” that provide access to country commercial guides and trade statistics, such as:
• Trade Compass http://www2.tradecompass.com/partners/ipanet
• Northern Light http://www.northernlight.com
United Nations (UN)
A wide range of international statistical information is available from the United Nations Statistical Division. http://www.un.org/Depts/unsd/class/class1.htm
For regional information, the web site maintained by the United Nations Economic and Social Commission for Asia Pacific (ESCAP) provides a wide range of statistical and other information. http://unescap.org
Trade related information is available from the United Nations Commission on Trade and Development (UNCTAD). http://www.unctad.org
The United Nations Industrial Development Organisation (UNIDO) web site maintains extensive industry and investment data relating to most countries. http://www.unido.org
World Bank
The World Bank Group site contains a vast database of economic, social and other development statistics for all countries of the world. The following link takes you to the index of all the sections: including Data by Country, Data by Topic and Data Query (from 54 indicators, 5 years and over 200 countries). http://www.worldbank.org/data/

DC&A Manual Final July 2002.doc 81
LexisNexis
Provides legal, news, public records and business information; including tax and regulatory publications. Information is obtained on a fee for service basis. http://www.lexis-nexis.com
Library sites
There are a number of commercial sites such as eLibrary that will search through newspapers, magazines, etc. for articles relating to a particular topic, e.g. when reference is made to investment in your country. http://ask.elibrary.com/index.asp
However, note that these sites may not be totally relevant to the information needs of small PI countries. The IPAnet site, for example, contains links to only five PI IPAs. In searching the Internet for sites specifically relating to PI countries one of the best starting points is the “Other Pacific Island Links” connection on the Pacific Island Report web site. http://pidp.eastwestcenter.org/pireport/text.htm
Industry/sector data
Australian Securities & Investments Commission
Specific information on Australian companies can be found at the Australian Securities & Investments Commission (ASIC). http://www.asc.gov.au/asic/asic.nsf
Business.com
Business.com provides a comprehensive business information site covering a range of industries and sectors including advertising and marketing, computers, financial services, pharmaceuticals and telecommunications. http://www.business.com/
A further level of information is often available at the state or regional level. An example of this is the Business Information Gateway (BIG) site maintained by the Western Australian Government. http://www.business.wa.gov.au
Europages
Data on European market trends, sectoral indicators and company information for 30 European countries can be found at Europages. http://www.europages.com

DC&A Manual Final July 2002.doc 82
Industry associations
Information on companies in a specific sector can often be found by accessing the industry association’s web site, e.g. information on the electronics industry and individual company entries for:
• the U.S. be found on the web site of the American Electronics Association. http://www.aeanet.org
• in Japan can be found at the Electronics Industries Association of Japan.http://www.eiaj.or.jp/english/index.htm
Strategis
Strategis is sponsored by Industry Canada contains sectoral and other information relating to Canada. http://www.strategis.ic.gc.ca/engdoc/main.html
Company data
Using the Internet, you can find out what companies are investing in emerging markets and which firms have the greatest potential as targets. You can also research specific companies to check their recent financial performance, strategic plans, credit rating, contact information, etc.
Dunn & Bradstreet
Offers fee-based company information and credit search services. http://www.dnb.com
EDGAR
The U.S. Securities and Exchange Commission (SEC) established EDGAR (electronic data gathering analysis and retrieval). It is a searchable database of information submitted by U.S. public companies. http://www.sec.gov/edgarhp.htm
Europages
Europages offers data on 500,000 firms in 30 countries across Europe. Company data are available on all sectors and is searchable by country and product line. http://www.europages.com

DC&A Manual Final July 2002.doc 83
Hoovers
Hoovers offers company profiles and information on company officers for free. Paying members can find additional news and background information. http://www.hoovers.com
Kompass
One of the best international sources of company information is Kompass, which contains information on 1.6 million companies worldwide. http://www.Kompass.com

DC&A Manual Final July 2002.doc 84
Appendix E Investor perceptions survey
A typical investor perception survey questionnaire
Please rank your perception of (insert country name) against each of the following on a scale of 1 to 6, where:
1. Very unfavourable
2. Unfavourable
3. Acceptable
4. Favourable
5. Very favourable
6. Don’t know
Factor 1 2 3 4 5 6 Political situation Economic situation Attitude of government towards attracting FDI Market accessibility and distribution Ability to recruit a productive workforce Overhead costs Incentive regime Telecommunications infrastructure Taxation regime and profit repatriation Sourcing and sub-contracting opportunities Business establishment procedures Country track record in attracting FDI Overall investment climate
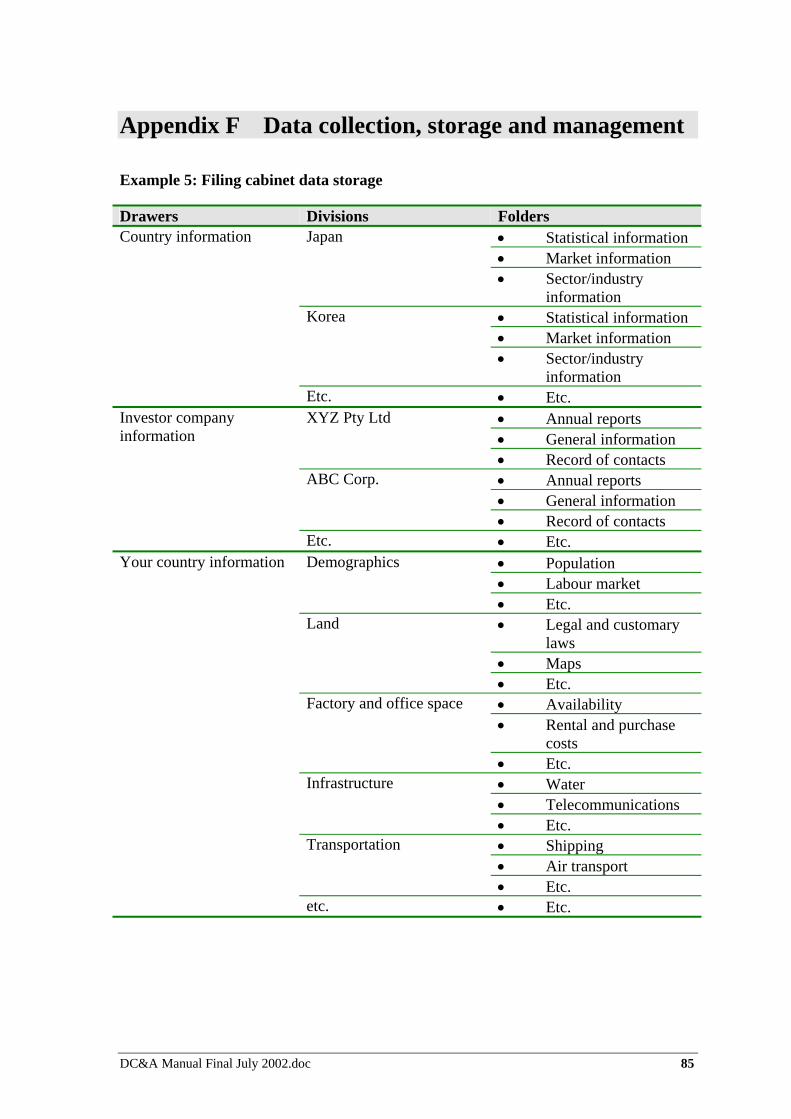
DC&A Manual Final July 2002.doc 85
Appendix F Data collection, storage and management
Example 5: Filing cabinet data storage
Drawers Divisions Folders • Statistical information • Market information
Japan
• Sector/industry information
• Statistical information • Market information
Korea
• Sector/industry information
Country information
Etc. • Etc. • Annual reports • General information
XYZ Pty Ltd
• Record of contacts • Annual reports • General information
ABC Corp.
• Record of contacts
Investor company information
Etc. • Etc. • Population • Labour market
Demographics
• Etc. • Legal and customary
laws • Maps
Land
• Etc. • Availability • Rental and purchase
costs
Factory and office space
• Etc. • Water • Telecommunications
Infrastructure
• Etc. • Shipping • Air transport
Your country information
Transportation
• Etc. etc. • Etc.

DC&A Manual Final July 2002.doc 86
Example 6: Core investor data requirements
Requirement Data First name Surname Investor organisation Postal address Zip/post code Telephone Facsimile Mobile E-mail address Organisation web site Main business activity Nature of investment Timing of investment Job title/position Third-party investment location adviser (if used)
Nature of request made Other information Action taken Date and time of request Request handled by

DC&A Manual Final July 2002.doc 87
Example 7: Investment project data requirements
Requirement Data Investor organisation Internal IPA reference Investor status (i.e. established investor, new contact, etc.)
Investor representative name and contact details (if different from previous data on Internal IPA reference record)
Company structure and principal officers (CEO, etc.)
Parent company (if relevant) Subsidiary/associated companies (if relevant)
Main operating locations Industry grouping (as set by IPA)
ISIC code(s)7 ISIC description Sales volumes Number of employees Nature of investment Timing of investment Value of investment (i.e. capital, number of jobs, value-added, exports)
Type of investment (, i.e. greenfield, acquisition, joint venture, etc.)
Local partner(s) Key investment criteria (in priority order)
Nature of request made Other information Action taken Date and time of contact Request handled by
7 International Standard Industrial Classification

DC&A Manual Final July 2002.doc 88
Appendix G References and further reading
H Arsham: Business Statistics: Revealing Facts from Figures, University of Baltimore, http://ubmail.ubalt.edu/~harsham/Business-stat/opre504.htm
H Arsham: Statistical Data Analysis: Prove It with Statistics, University of Baltimore http://ubmail.ubalt.edu/~harsham/stat-data/opre330.htm
C Helberg: Pitfalls of Data Analysis (or How to Avoid Lies and Damned Lies), http://www.execpc.com/~helberg/pitfalls/
D Huff, How to Lie With Statistics, Penguin. 1991
L Gales: Graphics and Web Design Based on Edward Tufte’s Principles, University of Washington Computing and Communications, http://www.washington.edu/computing/training/560/zz-tufte.html
Multilateral Investment Guarantee Agency, Investment Promotion Toolkit, January 2001, Washington, http://www.ipanet.net/IPQ/v1i1.htm
The Plain English Campaign, How to write reports in plain English, Plain English Campaign, 2001, http://www.plainenglish.co.uk/reportguide.pdf
Surfstat.australia: An online text in introductory Statistics, http://www.anu.edu.au/nceph/surfstat/surfstat-home/surfstat.html
US Securities and Exchange Commission, Office of the Investor Education and Assistance: A Plain English Handbook – How to create clear SEC disclosure documents, http://www.sec.gov/pdf/handbook.pdf
C West: Competitive Intelligence, Palgrave, 2001