investment research 2021 global outlook
TRANSCRIPT
2021GLOBALOUTLOOKA CRISIS BRINGS OPPORTUNITY
MAY 2021
INVESTMENT RESEARCH
For Professional Investors only. All investments involve risk, including the possible loss of capital.

GLOBAL INVESTMENT OPPORTUNITIES
Out of a crisis comes opportunity. Given our assessment of the outlook for global and regional real estate markets, we identify the following opportunities as being among the most attractive on a risk-adjusted basis over the next 12 months.
GLOBAL PORTFOLIO IMPLICATIONS
ACCELERATED CHANGE SHORT-TERM REPOSITIONINGONGOING TAILWINDS LONG-TERM CORRECTION
HOTELSA bruised hospitality sector o�ers a compelling countercyclical opportunity ahead of an unexpected gradual recovery in demand
LOGISTICS/COLD STORAGELogistics has a strong returns outlookin all regions, on the back of ongoingleasing momentum and acceleratedonline spending growth
RESIDENTIAL SECTORSAs gateway city populations grow further, the build-to-rent sector is bene�ting from declining housing a�ordability
CHINA DELEVERAGINGTighter domestic credit growthpolicies are opening up opportunities across thespectrum of equity and debt
DISTRESSED RETAILRetail is in the process of a sharp valueadjustment but looks close to �ndinga �oor in the UK, with ContinentalEurope close behind
NON-TRADITIONAL SECTORSNon-traditional property types, suchas senior living and self-storage, are attractive because of cash �ow resilience, low capex and diversi�cation
URBAN APARTMENTSUrban apartment markets su�ered a correction, but performance is expected to rebound swiftly as workplaces and amenities reopen
GRADE A OFFICESO�ces are set for a cyclical rebound assta� return to workplaces. Future tenantusage is evolving repidly, with a renewedfocus on quality
LAST MILE RETAILNeighborhood retail o�ers resilienceagainst increased online spending and is positioned to perform well as retail spending recovers
GLOBAL INVESTMENT OPPORTUNITY MAPOut of a crisis comes opportunity. Given our assessment of the outlook for global and regional estate markets, we identify the following opportunities as being among the most attractive on a risk-adjusted basis over the next 12 months:

2021 GLOBAL OUTLOOK
Page 02 PGIM Real Estate | May 2021 | REF: 20CBISC-BPTNQR
Summary of the major groups of opportunities we identify in the report
SHORT-TERM REPOSITIONING
Short-term disruption caused by the pandemic has
entry point, typically with some repositioning required
LONG-TERM CORRECTION
Retail headwinds have strengthened because of the pandemic, but a correction in values implies opportunities from a low base in segments of the market in which occupier demand is holding up better.
ONGOING TAILWINDS
Favorable momentum prior to the pandemic has remained relatively unchanged — for example, by
and rising investor interest in higher-returning non-traditional property types.
ACCELER ATED CHANGE
Favorable momentum prior to the COVID-19 global
change — related notably to a rise in online retailing, supply chain expansion and increased demand for cold storage.

STRATEGIC ALLOCATION RECOMMENDATIONSCORE STRATEGIES
Equity
Given our assessment of current market conditions and the opportunities that are most attractive across different regions, we make the following broad equity investment allocation recommendations, assuming a stabilized global portfolio of core, income-generating assets (exhibit 1).
• SHIFT EMPHASIS FROM DEFENSIVENESS TO RECOVERY AND GROWTH The worst of the crisis has passed, policy support remains extensive, capital is flowing into real estate and
pricing looks broadly fair value in aggregate. Income growth is set to recover as occupier markets rebound in line with an improving economic outlook, and investors should look to capitalize on improving momentum.
• REMAIN OVERWEIGHT IN LOGISTICS, GROWING EXPOSURE TO COLD STORAGE Logistics remains an overweight in the near term to capture value growth on the back of ongoing occupier
demand despite risks of a supply response further out. A lot of capital is targeting the sector, so specialist entry points are needed to make it work — either via a development play with a long lease in place or by targeting a specialist subsector with an operational angle for additional value creation, notably in cold storage.
• REDUCE OVERWEIGHT TO APARTMENTS We still like apartments and their stable outlook, but we recommend reducing the overweight because returns
relative to other improving sectors are less advantageous. Emphasis shifts toward urban markets in, for example, major U.S. cities and London, which suffered in 2020 but are set to rebound, and to markets in Asia Pacific, where institutional participation is rising to meet growing rental demand on the back of declining affordability.
MAY 2021INVESTMENT RESEARCH

• START REBUILDING OFFICE EXPOSURE We expect office demand to gradually improve in line with rising employment while the threat of remote
working looks to be overdone and supply pipelines are low across each major region. Focus is on grade A space in higher-density markets, reflecting changing occupier requirements. We anticipate a recovery in rental income that will be led initially by rising occupancy and falling incentives.
• INCREASE ALLOCATION TO HIGHER-RETURNING NON-TRADITIONAL STRATEGIES Non-traditional sectors — including data centers, self-storage and senior housing — continue to grow
in terms of institutional scale and have proved their resilience in past market cycles. At the core end, the emphasis is on longer-term, secure lease structures rather than operational risk. Focus is on the United States, where those sectors are most established; but opportunities are building in Asia Pacific and Europe too.
• MAINTAIN UNDERWEIGHT TO RETAIL AND HOTELS There are opportunities for core investors in retail and hotels, but headwinds remain significant for
the time being. Basic-needs retail in the United States offers resilient cash flow at increasingly attractive yields.
EXHIBIT 1: STRATEGIC GLOBAL ALLOCATIONS – CORE EQUITY
Note: For purposes of this core allocations framework, non-traditional sectors are treated as a subset of the five main property groups. As an example, senior housing is part of the apartment grouping, while cold storage and data centers fall under logistics.Sources: MSCI, PGIM Real Estate. As of May 2021.
Strategic Global Allocation Table Target Minus Neutral Weight: Overweight (+) / Underweight (-)
NeutralWeight
TargetWeight
StrategicCall
Trend vs.2020
Sector
O�ce 40% 35% Underweight Retail 20% 5% Underweight Logistics 16% 30% Overweight Apartment 18% 25% Overweight Hotel 7% 5% Underweight
Region
United States 38% 38% Neutral
Europe 34% 30% Underweight
Developed Asia Pacific 20% 27% Overweight
Emerging Asia Pacific 8% 5% Underweight -20%
-15%
-10%
-5%
0%
5%
10%
15%
20%
Maintain overweight to logistics and apartment givenfavorable occupier tailwinds
Reduce o�ce underweight as workplace reopenings boost demand
Developed Asia Pacific o�ers strongest returns outlook
O. Ret. Log. Apt. Hot. U.S. Eur. Dev. AP
Em. AP

Debt
When it comes to core debt strategy, most of the same factors apply because lenders essentially want exposure to as much high quality, performing real estate as possible — although core debt can also be used as an entry point where there is still some risk of value declines.
• Secure income from stabilized assets will continue to provide steady income streams for core debt strategies. These are especially attractive in such sectors as logistics and residential, where occupier performance drives predictable cash flow and the value of collateral benefits from value appreciation.
• For sectors that are poised for a rebound or recovery after a correction — such as offices and, more selectively, retail and hotels — core debt offers an attractive entry point because it features downside protection against further falls in capital value.
NON-CORE STRATEGIES
Equity and Debt
Further up the risk curve, the dynamics of allocation decisions shift because of higher returns objectives and a shorter investment horizon, so following a defined global benchmark is less important. For value-add equity and debt investors, we recommend the following strategies.
• FOCUS ON GROWTH . . . In the absence of any widespread distress or price corrections, the emphasis for value-add strategies
is on targeting opportunities to improve and grow cash flow.
• . . . AND BE SELECTIVE ABOUT DISTRESSED OPPORTUNITIES However, there are selective opportunities to take on risk and acquire assets that are going through
price corrections. Opportunities are limited but are starting to look attractive in parts of the UK and Continental European retail markets, in some U.S. downtown apartment markets and in China, where lenders are under pressure.
• MODERNIZATION IS SET TO BE A KEY SOURCE OF OPPORTUNITY There is a growing need for capital and expertise in such sectors as office and hotels, where future
post-pandemic requirements are leaving certain older stock effectively obsolete. Repositioning assets to grade A or developing new properties enables investors to capitalize on the recovery as it takes hold, placing them in a strong position for an exit to core investors once stabilized.

.
• CONCENTRATE ON SPECIALIST LOGISTICS AND RESIDENTIAL Returns on stabilized logistics and residential assets don’t stack up for value-add investors, and
development margins are tight because of a weight of capital and interest among core investors. Specialist, non-traditional sectors such as cold storage and senior living require higher levels of expertise and imply more risk, but they offer significant premiums for developing and operating.
• START TO ACQUIRE RETAIL SITES Retail is still a challenge because rents are falling, which is prompting ongoing value adjustments. For
investors with higher risk appetites, sites that offer stable, near-term income or leasing potential and are backed up by longer-term redevelopment are starting to look attractive.
• INVEST INTO A HOTEL DEMAND RECOVERY Hotel values have fallen more than in other sectors. As the recovery story gains pace, a window of
opportunity opens to invest, recapitalize and reposition hotels.

CONTENTS09 | SUMMARY The worst of the crisis has now passed, and while risks are still out there, investors are once again deploying capital and looking at an opportunity set that spans a wide range of categories.
10 | FIVE FACTORS SHAPING THE NEAR-TERM OUTLOOK We make five observations about the major factors affecting global real estate markets in 2021 and then think about what those factors mean for the outlook and investment opportunities around the world.
12 | REASONS FOR OPTIMISM Returns over the next cycle are expected to be lower than in the past, but there are reasons to be optimistic, including prospects for employment growth, an ongoing low supply environment and investing in active investment management strategies.
16 | DEBT AS AN ATTRACTIVE ENTRY POINT Debt investment opportunities provide downside protection in an uncertain environment, ranging from secure income streams generated by stabilized assets to more flexible short-term lending to capitalize on improving market conditions.
Given our assessment of the outlook for regional economies and real estate markets, we identify the investment opportunities that we see as being among the most attractive on a risk-adjusted basis over the next 12 months.
17 | AMERICAS
26 | ASIA PACIFIC
34 | EUROPE
PART II REGIONAL SPOTLIGHTS
PART I GLOBAL OVERVIEW

2021 GLOBAL OUTLOOK
PGIM Real Estate | May 2021 | REF: 000778 Page 9
PART IGLOBAL OVERVIEW
SUMMARY• Although the effects of the global pandemic have further
to run, the worst of the crisis has now passed, and 2021 is shaping up to be a significantly better year for the global economy and real estate markets than 2020 was.
• Risks are still out there, but distress in financial and real estate investment markets has been avoided, reflecting a concerted global policy effort. Firmer growth is expected in the second half of 2021 and beyond, although inflation remains contained and low interest rates are supporting asset pricing.
• As investors once again start to deploy capital and look for opportunities, the divergent performance of various parts of the global real estate market means that an almost full cycle’s worth of opportunities is in play at the same time.
• For core, stabilized assets, the long-term-returns outlook is weaker than it was in the past cycle, although an anticipated recovery in employment and an ongoing low supply environment provide support for occupancy and rents.
• For higher risk equity and debt strategies, there are reasons to be optimistic about the potential to generate revenue and grow values as occupier markets recover, and by expanding to look at modernization of assets, investment in operating platforms and rotation toward green strategies.
• In the short term, evidence from past cycles and ongoing demand for real estate exposure among equity and debt investors point toward potential overshooting. This is not
a major concern for core investors but provides a source of growth opportunities and, further out, risks of a correction for value-add investors.
• Today’s investment opportunities span a wide range of categories, including capitalizing on favorable occupier momentum linked to accelerated changes in how real estate is used, investing in assets that require some short-term repositioning and finding value in parts of the market that have undergone a long-term correction.
Today’s investment opportunities span a wide range of categories, including capitalizing on favorable occupier momentum linked to accelerated changes in how real estate is used, investing in assets that require some short-term repositioning and finding value in parts of the market that have undergone a long-term correction.
“

2021 GLOBAL OUTLOOK
Page 10 PGIM Real Estate | May 2021 | REF: 000778
FIVE FACTORS SHAPING THE NEAR-TERM OUTLOOKWe make five observations about the major factors affecting global real estate markets in 2021 and then evaluate their implications for the outlook and investment opportunities around the world.
1
2
3
1. THE WORST OF THE CRISIS HAS PASSED
Undoubtedly, conditions for real estate occupiers and investors remain challenging, yet the worst moment of the crisis was in early- to mid-2020, when the widest-possible range of outcomes was on the table, driven by concern that financial distress could affect credit flows and mass business failures could severely reduce property-level incomes. Since then, aided by policy commitment to support households, businesses and the financial system, large parts of the global economy and real estate markets have adapted to the challenges of operating during the pandemic, and activity is on an upward trend.
IMPLICATION: Some real estate distress cannot be ruled out, but as time goes on, such distress is less and less likely to occur on a widespread basis. Sectors and markets that haven’t yet recorded a correction are now unlikely to.
2. POLICY COMMITMENT REMAINS SIGNIFICANT
Compared with past downturns, policy commitment has been significant and has given real estate markets a major boost since the COVID-19 outbreak. At a society level, the emphasis has been on overcoming the pandemic and ensuring that otherwise viable businesses are able to continue operating. In real estate markets, job retention schemes and financial support packages targeting household and struggling industries have translated into income receipts that are holding up better than would normally have been implied by the severity of the recession. Central banks, too, have played an important role by providing major liquidity injections and committing to keeping policy interest rates low, in turn limiting financial distress and, in effect, providing support for asset values in real estate and beyond. And even though the worst of the crisis has passed, policy makers on the whole remain committed to providing extensive support until some sort of future normality is established.
IMPLICATION: Extensive policy support is set to remain in place for some time, boosting real estate values by increasing the predictability of cash flows and by keeping low interest rates in place, reducing required returns.
3. 2021 WILL BE A YEAR OF TWO HALVES
The initial recovery in economic activity in the second half of 2020 was clearly V-shaped, which has given way to a choppier pattern as restrictions to contain COVID-19 outbreaks are lifted and then reimposed regularly in many major economies. With vaccine deployment gaining pace in some parts of the world, it will start to reach the point of having a material, widespread impact on activity during the second half of the year. And though that may not herald an immediate return to pre-pandemic normality, it promises to be sufficient to lead to the beginning of a widespread easing of restrictions, which will provide a significant boost for demand.
IMPLICATION: As restrictions ease in the second half of 2021, allowing workplaces and service-oriented industries to more fully reopen, occupier sentiment is expected to return quickly supporting a rebound in real estate space demand.

2021 GLOBAL OUTLOOK
PGIM Real Estate | May 2021 | REF: 000778 Page 11
4
5
4. RAPID REBOUND IN ACTIVITY BRINGS OPPORTUNITIES
Unlike in past crises, there are no major pre-existing structural economic or financial issues to fix that might have otherwise required a lengthy adjustment period. In major developed economies, the opposite is the case. Job retention schemes and household financial support packages appear to have been successful in limiting much unnecessary economic damage, and consumers have built up significant savings. As restrictions ease, the ingredients are in place for a rapid recovery. Importantly, inflation expectations remain contained, meaning that low interest rates can stay in place.
IMPLICATION: Rapid rates of growth, even though from a low base, are positive for opportunities because sentiment can improve quickly and businesses can move into expansion mode, thereby raising demand for real estate space.
5. DIVERGENCE IN SECTOR PERFORMANCE IS UNPRECEDENTED
It goes without saying that there are always winners and losers in downturns and periods of market weakness. The difference this time around lies in how early the pattern has been established: normally, most parts of the market go through an initial period of uncertainty driven by common factors such as weaker demand, rising risk premiums and oversupply. This time, the extent and speed of policy support — together with the nature of the pandemic that brutally curtailed demand for certain assets and amplified existing trends such as the rise of online retail — immediately and transparently boosted such sectors as logistics and left others, such as retail and hotels, struggling.
IMPLICATION: Unusually, there is a full range of cyclical opportunities in play all at the same time, with some sectors and markets delivering strong growth and attracting capital, and others facing severe occupier stress.

2021 GLOBAL OUTLOOK
Page 12 PGIM Real Estate | May 2021 | REF: 000778
REASONS FOR OPTIMISMWith less scope for yield compression as interest rates are close to their lower bound, our starting assumption is that, over the next cycle as a whole, returns will be lower than they were during the cycle from 2010 to 2020. But there are reasons to be more optimistic.
Employment Recovery Underpins Space DemandAt its most fundamental level, real estate demand is about the usage of physical space. One of the noteworthy features of global economic growth in recent years is that it has been more heavily dominated by growth in employment rather than by gains in productivity. People need physical spaces to work in, and although the average amount of space per worker has been falling over time, a steady rise in total employment underpinned demand for real estate space through the most recent cycle, despite headline rates of economic growth that were mild in comparison to the past.
Beyond what is sure to be a short period of rapid expansion in the near term, the longer-term outlook for global economic growth outside the faster-growing parts of Asia Pacific remains modest. This is part of the reason that inflation expectations remain contained and major central banks have signaled no great urgency to raise interest rates.
At the headline level, employment growth is set to be a key driver of economic expansion through the next cycle. For real estate owners, this means ongoing physical space demand — most notably in the office sector but across other occupier groups too.
The prospect of shrinking working age populations in major economies may weigh on this story in the future, but for the time being, there is a good prospect of steady pickup in space demand as economic activity normalizes and beyond. How that translates into overall occupancy and rental income growth potential depends on the interaction with supply.
We’re Still in a Low Supply EnvironmentIf anything, the pandemic has reinforced the low supply environment. Apart from logistics, a sector in which supply growth has pretty much continued to match rising demand, supply forecasts are being revised downward as projects are either delayed or simply not started because developers are rethinking, given the empty offices and retail sites during the past year (exhibit 2).
EXHIBIT 2: GLOBAL ALL PROPERTY SUPPLY CYCLE AND OFFICE RENTAL GROWTH BY LEVEL OF VACANCY
Sources: Cushman & Wakefield, JLL, REIS, PMA, PGIM Real Estate. As of May 2021.
Estimated Global All Property Supply Growth (% Existing Stock) Office Real Rental Growth Since 1980 (% p.a.)
0%
1%
2%
3%
4%
5%
6%
7%
81 83 85 87 89 91 93 95 97 99 01 03 05 07 09 11 13 15 17 19 21 23 25
0.9%
-1.0%
3.9%
-2%
-1%
0%
1%
2%
3%
4%
5%
WholePeriod
VacancyAbove Avg.
VacancyBelow Avg.
1980s
Early/Mid-1990s
Forecast
Past cycle
Pre-GFC Post-dot-com
Pre-dot-com
Most previous cycles either featured or ended with high or accelerating completions
In contrast, the past cycle was notable as completions remained low throughout, while the supply pipeline and forecasts suggest the low supply environment is set to continue
Low supply is important as periods of structurally low vacancy are associated with much stronger real rental growth

2021 GLOBAL OUTLOOK
PGIM Real Estate | May 2021 | REF: 000778 Page 13
A low supply environment is important for real estate investors. During the past 40 years, several periods of high supply culminated in extended periods of elevated vacancy. Using the office sector as a guide, we can see that periods in which vacancy is below average clearly bring the benefits of much stronger income growth potential because landlords have the power to raise rents. During times of oversupply, tenants hold more power even when economic growth is relatively strong.
There is an abundance of capital targeting real estate — and there is a risk that it ends up in new supply. But in most sectors, new supply takes time to come through, so it looks like low supply growth is here to stay, meaning that vacancy — which is generally quite low despite a pandemic-related jump in 2020 — is likely to be supportive of rental growth for several years.
Real Estate Markets Tend to Overshoot Fundamentals. . .On the face of it, global real estate markets look to be broadly in line with a long-term equilibrium level. Using office as an example as it has the most long-term data available, we find
that the reduction in expected returns in recent years — driven by declining yields and lower inflation and productivity — has more or less been in line with the downward shift in long-term risk-free rates proxied by a trend G3 10-year government bond yield (exhibit 3).
The trend risk premium has changed over time but has been stable since the late 1990s. More importantly, expected returns oscillate around the trend. Overshooting essentially occurs when yields are too low given the rental growth potential of real estate and prevailing interest rates.
There have been three periods of overshooting since 1980, the most recent of which quickly leveled off as yield compression slowed and then stopped completely when the global pandemic took hold. History suggests that the next cycle will not be defined simply by the risk premium staying in line with its trend; there will likely be a period of overshooting or undershooting, with capital flows and momentum making overshooting the more likely.
EXHIBIT 3: GLOBAL OFFICE LONG-TERM EXPECTED RETURNS AND ESTIMATED RISK PREMIUM
Note: G3 refers to eurozone, Japan and the United States.Sources: Cushman & Wakefield, JLL, REIS, PMA, PGIM Real Estate. As of May 2021.
Long-Term Expected Prime Office Return and Trend Bond Yield – Global Developed Markets (%) Estimated Global Office Risk Premium (%)
. . .meaning that the risk premium is in line with its long-term trend
0%
2%
4%
6%
8%
10%
12%
14%
16%
80 82 84 86 88 90 92 94 96 98 00 02 04 06 08 10 12 14 16 18 20
Income Rental Growth Expected Return Trend G3 Bond Yield
Risk premium is the dierence between expected returns and the risk-free rate, which is proxied using a trend G3 10-year government bond yield
0% 1% 2% 3% 4% 5% 6% 7%
80 82 84 86 88 90 92 94 96 98 00 02 04 06 08 10 12 14 16 18 20
Past cycles have often seen overshooting, which is essentially when yields moving lower than levels justified by fundamentals
Trend
1
2 3Long-term returns expectations have moved lower, but interest rates are still low too. . .
In the mid-to-late 1980s, fuelled by easy credit, investors priced real estate based on optimistic assumptions, meaning yields were too low (and supply too high) when economic growth slowed in the early-1990s
After dot-com, a period of excess global liquidity drove increased capital flows to real estate yields, with asset pricing supported by the perceived resilience of the economy and financial markets – until the global financial crisis hit
In the most recent cycle, a search for higher-yielding assets drove a sharp increase in transaction volume, pushing real estate yields to historic lows, although interest rates have subsequently fallen even further restoring an equilibrium
1
2
3
Examples of Past Overshooting

2021 GLOBAL OUTLOOK
Page 14 PGIM Real Estate | May 2021 | REF: 000778
. . .So There Is Potential for a Period of Strong GrowthIn exhibit 4, we build an overshooting profile from the average of past periods. From equilibrium it usually takes two or three years for yields to compress further — driven usually by capital flows and sentiment — before finding a floor and eventually correcting back toward the equilibrium. Applying this overshooting pattern leads to a much more volatile — and more historically realistic — pattern of real capital growth than a baseline scenario that reflects stable yields and trend real rental growth.
The analysis shown in exhibits 3 and 4 has two important implications.
1. For core investors, current pricing offers broadly fair long-term value. There may be some near-term valuation upside from overshooting, but this would eventually be canceled out as values return to equilibrium. From a multi-asset perspective, values rising by 10 or 15% over the next year or two would be a clear signal to take profits and rotate into other asset classes.
2. For value-add investors, the prospect of values rising further than fundamentals would suggest gives extra incentive to pursue strategies supported by favorable leasing momentum or structural trends in the near term. Returns may be given a short-term boost from renewed yield compression, but there is the risk that this would correct further out. Such sectors as
logistics, wherein the long-term risk premium is most likely trending downward, offer greater protection against a future correction but may still be vulnerable to the same swings.
There Are Other Ways to Create ValueReal estate investing is not just about stabilized returns. The stock of real estate and its value to society — and therefore to investors via the rental income that can be generated — is not fixed. Investors can actively manage their assets to fundamentally change their value, or they can position themselves to benefit from economic activity taking place in their buildings.
Following are examples of approaches that go beyond stabilized market performance.
• Growing income through asset management: Investors can drive value gains by growing property-level income. Most simply, in the current environment, those gains could be achieved by reducing vacancy or slimming down incentives, even if headline rents are stable. The upshot is that overall property income growth potential is more elevated than headline rent trends and forecasts suggest.
• Investing in operating businesses: Real estate investors are increasingly becoming aware that the potential for value creation extends beyond the four walls and the roof of a building. Specialized real estate uses — such as data centers, cold storage and certain types of senior-living
EXHIBIT 4: ANALYSIS OF YIELD OVERSHOOTING AND ITS IMPACT ON CAPITAL VALUE GROWTH
Sources: Cushman & Wakefield, JLL, REIS, PMA, PGIM Real Estate. As of May 2021.
Average of Past Periods of Office Yield Overshooting (Basis Points)Annual Real Capital Value Growth – Global Developed Office Markets (% p.a.)
-25%
-20%
-15%
-10%
-5%
0%
5%
10%
15%
20%
25%
81 83 85 87 89 91 93 95 97 99 01 03 05 07 09 11 13 15 17 19 21 23 25 27 29
If momentum drives yields lower, values could rise by about 25%, although this would not likely be sustainable
-100
-80
-60
-40
-20
0
20
40
60
0 1 2 3 4 5 6 7 8 9 10
Historically, any overshooting has been swiftly followed by a correction
Setting other factors aside, yields can move lower from their current levels
Long-Term Average
History suggests pricing can overshoot by 80 basis points in the space of a couple of years
Overshooting: yields below levels justified by fundamentals
Baseline + yield overshooting
Baseline
Overshooting would make a di�erence to performance compared to a steady state baseline

2021 GLOBAL OUTLOOK
PGIM Real Estate | May 2021 | REF: 000778 Page 15
facilities — require specialist equipment, operating expertise and branding. By acting as owner-operator, a landlord can generate additional rent and participate in the profits from the underlying use, leading to potentially higher returns. Of course, risks are higher too — notably, related to building and equipment obsolescence and higher running costs and, compared with traditional fixed leases, more-variable profit-driven income streams.
• Modernizing: The aftermath of the pandemic is proving to be a good moment for households and businesses to assess their future real estate needs. Older commercial and residential stock is becoming increasingly exposed to such factors as shifting living preferences and post-pandemic workplace regulations related to ventilation and infection control. The effective supply of fit-for-purpose stock has fallen. In most sectors there are broad opportunities to reposition existing assets or develop new buildings so as to provide the modern space that will suit future requirements.
• Rotating toward green investment strategies: There has been a clear increase in focus among investors toward green buildings that are, for example, BREEAM or LEED certified. This trend has been most noteworthy in the retail and industrial sectors, but it’s clear in office too. Importantly, we are now seeing the emergence of a green premium because across the quality spectrum, certified buildings enjoy stronger pricing performance than average properties do (exhibit 5). In part, the additional yield compression reflects growth in capital that targets green investment strategies — a trend that is set to continue. However, it also reflects stronger income growth potential at the asset level.
Note: Green buildings refer to assets that are either BREEAM (Good to Outstanding) or LEED (Bronze to Platinum) certified.Sources: Real Capital Analytics, PGIM Real Estate. As of May 2021.
EXHIBIT 5: RELATIVE GLOBAL INVESTMENT SHARE AND PRICING OF GREEN BUILDINGS
10%
12%
14%
16%
18%
20%
22%
24%
26%
28%
10 11 12 13 14 15 16 17 18 19 20 0%
1%
2%
3%
4%
5%
6%
10 11 12 13 14 15 16 17 18 19 20
Share of green oce transactions grew through the past cycle
Oce
Industrial
Retail
Industrial and retail share now growing from a low base
-100 -75 -50 -25
0 25
18 19 20 21 Green Buildings All Assets
-72
-27 -3
-80
-60
-40
-20
0
Low Quality Median Quality High Quality
Green premium starting to show up in pricing through lower yields
Lower-quality assets have benefited the most from green building certification
Share of Green Buildings in Overall Global Transaction Volume by Sector (% Total)
Cumulative Global Office Transactions Yield Shift Since 1Q18 (Basis Points)
Additional Yield Shift for Green Buildings Through the Past Cycle by Asset Quality (Basis Points)

2021 GLOBAL OUTLOOK
Page 16 PGIM Real Estate | May 2021 | REF: 000778
Core Debt Investors Continue to Value Steady IncomeSecure income from stabilized assets will continue to provide steady income streams for core debt strategies. These are particularly attractive in such sectors as logistics and residential, in which occupier performance drives predictable cash flow and the value of collateral benefits from value appreciation based on robust investor demand. Given low returns on government and investment-grade corporate bonds, lending against assets with resilient income continues to be attractive for long-term debt strategies.
At the same time, fierce competition from a growing pool of capital sources means credit spreads are tightening, although there are opportunities to lend against sectors and markets with potential for long-term future growth. These include sectors underpinned by demographic trends — such as cold storage, last mile logistics, health care and senior housing — and those providing the infrastructure for a digital future, such as data centers.
Lending Into a RecoveryFor sectors that are poised for rebound or recovery after a correction, such as offices and, more selectively, retail and hotels, debt strategies offer an interesting entry point. And even though uncertainty surrounding the speed and durability of recovery remains high, core debt can provide downside protection against further capital value falls. Further up the risk spectrum, lending can offer opportunities to capture some of the benefits of value appreciation as assets such as necessity-driven retail, hotels and grade A central business district offices move through their recovery cycles.
Short-term debt is especially interesting in this space because it provides flexibility to capitalize on market improvements. Shorter-term lending also has the benefit of providing protection against higher interest rates. With the flexibility in short-term debt, as maturity approaches, the proceeds can be used to redeploy at a more favorable point in the real estate cycle and potentially at higher lending rates.
Duration, Regulation and Dislocation
Duration will be a key driver of returns with rising yieldsExample: United States
• In the United States, positive economic momentum is manifesting into rising inflation expectations, leading to a steepening of the yield curve.
• This provides interesting opportunities for shorter-term debt, which can be reinvested when the market further improves and interest rates are higher, and is especially favorable for markets that are poised to rebound.
• Core debt strategies favoring longer-term debt focused on strong income remain attractive because we expect the rise in market interest rates to be contained by ongoing demand for investment-grade bonds and the currently elevated market economic growth expectations to be reined back in.
Regulatory risk transfer sees debt capital sources diversifying furtherExample: Europe
• Ongoing regulatory pressures on the European banking sector have reduced banks’ market share in commercial real estate lending as they continue to de-risk their loan books — an existing structural trend accelerated by the pandemic.
• Yet there is no shortage of financing, because the nonbank lender market has established itself in Europe over the past decade, throughout the capital stack. Bank and nonbank lenders are working together to facilitate borrowers’ financing needs, thus providing market stability.
• With about €100 billion a year on average up for refinancing across Europe’s three largest markets — France, Germany and the United Kingdom — there is an opportunity for commercial real estate debt markets to diversify further, and at a pace.
Dislocation of capital marketsExample: China
• China’s tightening of credit and loan growth in its real estate sector is opening up a window of opportunity for real estate investors — especially in the private debt space.
• As the Chinese government continues to tighten bank financing, both large and small developers are looking to sell assets to meet debt obligations or to fund new land acquisitions. At the same time, loan defaults are rising, and distressed assets are coming to the market.
DEBT AS AN ATTRACTIVE ENTRY POINT

2021 GLOBAL OUTLOOK
PGIM Real Estate | May 2021 | REF: 000778 Page 17
PART IIREGIONAL SPOTLIGHT
Key factors in support of the outlook and opportunities • As the vaccine rollout takes effect,
the U.S. economy is set to benefit from several tailwinds through the second half of the year, including the prospect of a full reopening, a boost to spending from accumulated savings and further fiscal stimulus. Latin America will take longer to recover.
• Real estate tenant demand has turned a corner, supported by improving economic conditions and a strengthening labor market.
• The Federal Reserve remains committed to supportive monetary policy, and the prospect of low interest rates remaining in place points toward further yield compression.
• With parts of the retail and office markets facing structural headwinds, investors are increasingly turning to non-traditional sectors as sources of resilient, income-driven performance.
• While Mexico will only gradually recover from its domestic demand decline, the export-oriented manufacturing and e-commerce sectors continue to expand.
IN BRIEFGiven our assessment of the outlook for the Americas economy and real estate market, we identify the following opportunities as being among the most attractive on a risk-adjusted basis over the next 12 months.
l SHORT-TERM REPOSITIONING
Urban ApartmentsUrban apartment markets suffered a correction but performance is expected to rebound swiftly as workplaces and amenities reopen
Grade A OfficesThe future of office usage is evolving rapidly but can be seen as an extension of existing trends, with demand increasingly focused on grade A space
l LONG-TERM CORRECTION
Last Mile RetailNeighborhood retail offers resilience against increased online spending and is positioned to perform well as retail fully reopens
l ONGOING TAILWINDS
Non-Traditional SectorsNon-traditional property types are gaining the attention of institutional investors because of cash flow resilience, low capex and diversification
l ACCELERATED CHANGE
Mexico Infill LogisticsRising amounts of online shopping are creating demand for logistics in larger Mexican cities, with low current e-commerce adoption rates providing plenty of runway for future tenant demand growth
AMERICAS

2021 GLOBAL OUTLOOK
Page 18 PGIM Real Estate | May 2021 | REF: 000778
WHAT ARE THE INVESTMENT OPPORTUNITIES?
1. Urban ApartmentsSHORT-TERM REPOSITIONING
Urban apartment markets suffered a correction, but performance is expected to rebound swiftly as workplaces and amenities reopenThe impact of COVID-19 on much of the U.S. and global real estate markets broadly has been surprisingly mild, but urban apartment rents and values have experienced a substantial correction (exhibit AM1). Our view is that the anticipated reopening of offices and restaurants will reinforce preferences for urban living among younger-age cohorts. Apartments in urban locations are expected to record a cyclical rebound in demand and rents, thereby boosting potential investment returns.
At the same time, it is important to recognize that the market — and therefore the opportunity set for investors — has shifted. The increased adoption of flexible working arrangements means workers are less tied to offices, so we find apartments located in well-amenitized urban neighborhoods more attractive than locations offering workplace proximity that typically come with a legacy of higher in-place rents.
Urban apartment rents dropped after the onset of the COVID-19 global pandemic as tenants moved away from expensive apartments located near workplaces — an effect that has been exacerbated by significant new supply additions, and yet, investment performance of urban apartments looks to have turned the corner.
Net absorption was positive in the final quarter of 2020, after two consecutive quarters of declining demand. Effective rents are no longer falling, and some downtown submarkets are now reporting rental growth, with tenant sentiment boosted by COVID-19 vaccine distribution and the prospect of workplaces reopening.
Beyond the short-term recovery story are concerns that the aging millennial cohort transition toward homeownership and suburban living will weigh on future rental demand, although we think those fears are overdone.
Certainly, urban living preferences have changed over time. Those aged 25 to 34 years and 35 to 44 years have become more concentrated in urban areas since 2006 (exhibit AM2). Similarly, looking to preferences among age cohorts instead, millennials appear to be more committed to urban living than was the preceding generation at the equivalent age. Indeed, the share of older millennials — born before 1989 — who live in urban areas has increased significantly during the past decade.
Overall, the worst of the short-term impact of the pandemic has passed, and urban locations are poised to record a recovery from a lower base, leading to relatively attractive returns in the near term.
EXHIBIT AM1: APARTMENT RENTAL GROWTH AND EFFECTIVE RENT LEVELS IN DOWNTOWN MARKETS
Sources: RealPage, PGIM Real Estate. As of May 2021.
70
75
80
85
90
95
100
105
Mar-20 May-20 Jul-20 Sep-20 Nov-20 Jan-21 Mar-21
Boston Chicago Denver Los Angeles Miami New York San Francisco Seattle Washington
Urban apartment markets recorded a sharp rental correction in 2020
Downtown rents have stabilized and are edging back up from a low base
-15%
-10%
-5%
0%
5%
10%
15%
00 01 02 03 04 05 06 07 08 09 10 11 12 13 14 15 16 17 18 19 20 21
Urban Suburban
Annual Apartment Effective Rental Growth (%) Downtown Apartment Effective Rent Index (March 2020 = 100)

2021 GLOBAL OUTLOOK
PGIM Real Estate | May 2021 | REF: 000778 Page 19
2. Grade A OfficesSHORT-TERM REPOSITIONING
The future of office usage is evolving rapidly but can be seen as an extension of existing trends, with demand increasingly focused on grade A spaceThe threat to space demand from remote working is credible, but we expect offices to remain an integral part of how businesses operate. As the economy reopens and leasing markets adapt to post-pandemic requirements, quality matters more than ever, but modern, grade A space in prime, central locations is in short supply. We see an opportunity in the development of new buildings or the repositioning of older assets to provide well-located, high-quality office space that can deliver net operating income growth.
In part, this is because offices will continue to play an essential role in encouraging collaboration, facilitating training and development, and building culture within the organizations that use them. The pressures for occupiers to allow for greater remote working — including the potential for cost savings and demands from highly skilled workers — will result in a shift to a hybrid model that balances in-place working with remote working.
Note: Showing data for 2019 to reflect pre-COVID-19 preferences that we judge to be a more appropriate measure than 2020, where urban living has been negatively affected by temporary factors that we expect to reverse.
Sources: American Community Survey (2006-2019), PGIM Real Estate. As of May 2021.
EXHIBIT AM2: SUMMARY OF URBAN-LIVING PREFERENCES BY AGE GROUP AND GENERATION
25%
27%
29%
31%
33%
35%
37%
39%
Share of those aged 25–44 years old living in urban areas is expected to remain high, although the rate of increase has moderated
Early millennials are entering their late 30s when the share of urban living drops o�, but late millennials have been supporting high demand in recent years
25%
27%
29%
31%
33%
35%
37%
39%
Total Under 25 25-34 35-44 45-54 55-64 65+
2006 2010 2014 2019
2006 2010 2014 2019
Millennials
Early Mille
nnials
Late Millennials
Gen X
Boomers
Early Boomers
Late Boomers
Share of Population by Age Group in Urban Areas (%) Share of Population by Generation in Urban Areas (%)
2021 GLOBAL OUTLOOK
Page 20 PGIM Real Estate | May 2021 | REF: 000778
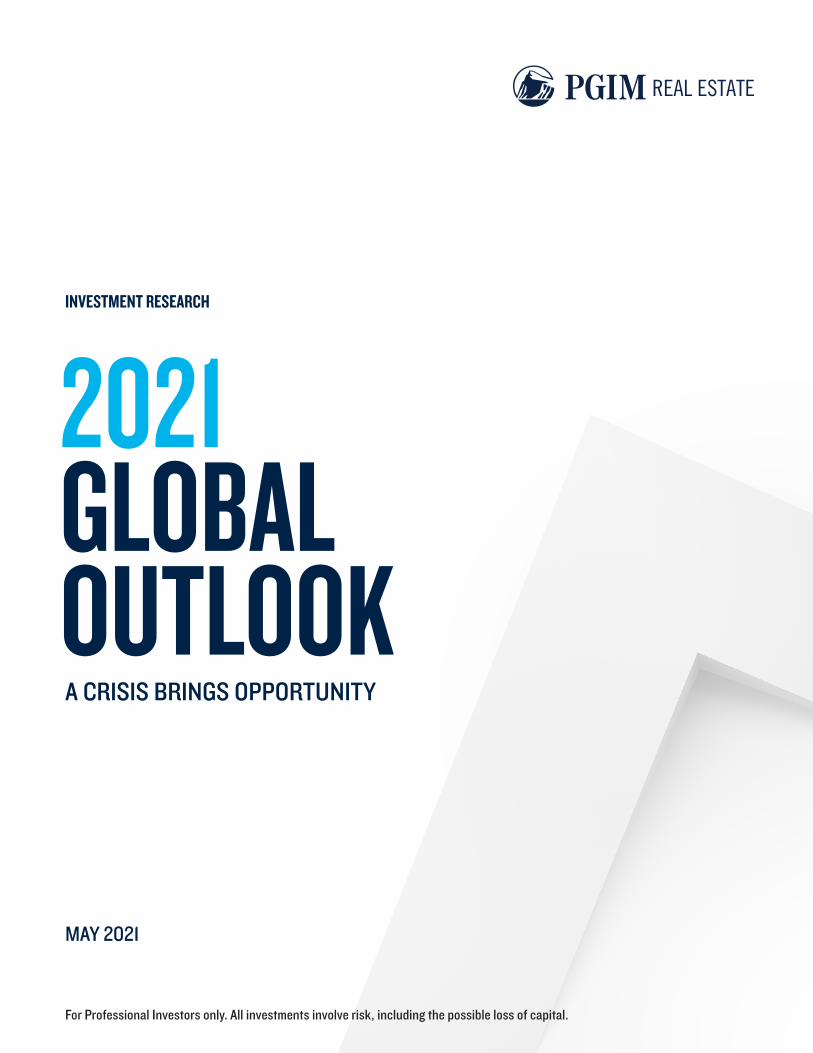
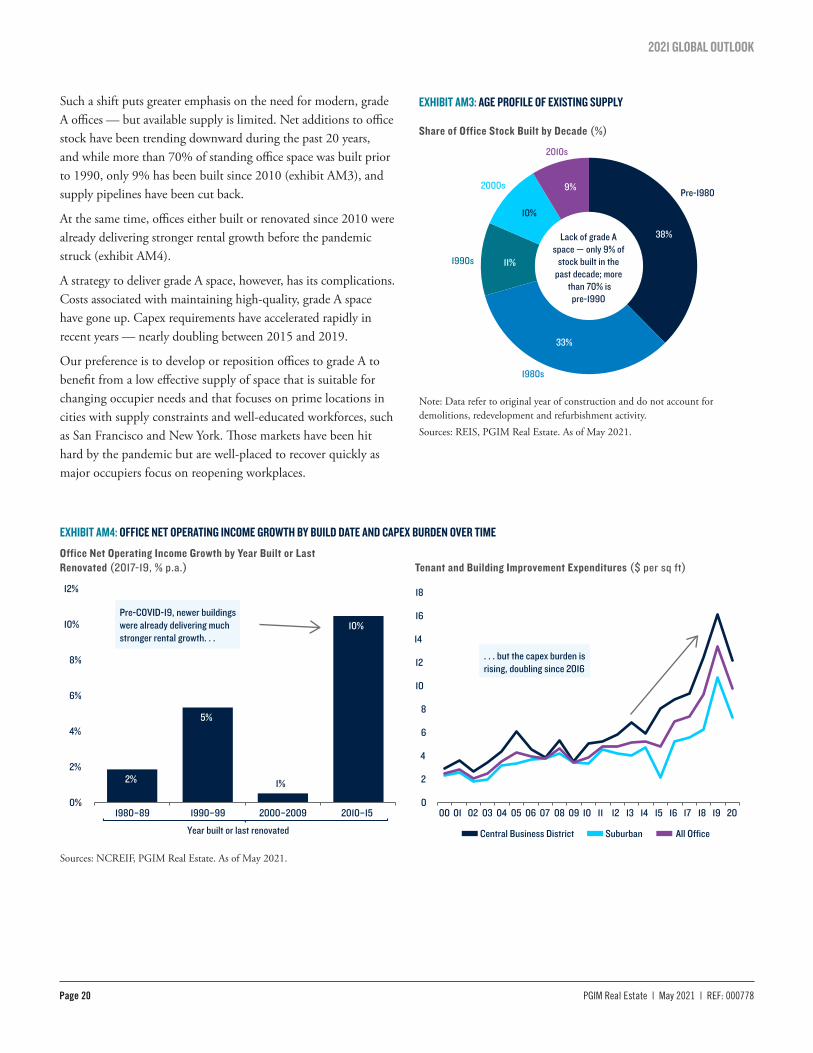
Such a shift puts greater emphasis on the need for modern, grade A offices — but available supply is limited. Net additions to office stock have been trending downward during the past 20 years, and while more than 70% of standing office space was built prior to 1990, only 9% has been built since 2010 (exhibit AM3), and supply pipelines have been cut back.
At the same time, offices either built or renovated since 2010 were already delivering stronger rental growth before the pandemic struck (exhibit AM4).
A strategy to deliver grade A space, however, has its complications. Costs associated with maintaining high-quality, grade A space have gone up. Capex requirements have accelerated rapidly in recent years — nearly doubling between 2015 and 2019.
Our preference is to develop or reposition offices to grade A to benefit from a low effective supply of space that is suitable for changing occupier needs and that focuses on prime locations in cities with supply constraints and well-educated workforces, such as San Francisco and New York. Those markets have been hit hard by the pandemic but are well-placed to recover quickly as major occupiers focus on reopening workplaces.
EXHIBIT AM4: OFFICE NET OPERATING INCOME GROWTH BY BUILD DATE AND CAPEX BURDEN OVER TIME
Sources: NCREIF, PGIM Real Estate. As of May 2021.
Office Net Operating Income Growth by Year Built or Last Renovated (2017-19, % p.a.) Tenant and Building Improvement Expenditures ($ per sq ft)
2%
5%
1%
10%
0%
2%
4%
6%
8%
10%
12%
1980–89 1990–99 2000–2009 2010–15
Pre-COVID-19, newer buildings were already delivering much stronger rental growth. . .
. . . but the capex burden is rising, doubling since 2016
0
2
4
6
8
10
12
14
16
18
00 01 02 03 04 05 06 07 08 09 10 11 12 13 14 15 16 17 18 19 20
Central Business District Suburban All O�ce Year built or last renovated
EXHIBIT AM3: AGE PROFILE OF EXISTING SUPPLY
Lack of grade A space — only 9% of
stock built in the past decade; more
than 70% ispre-1990
38%
33%
11%
10%
9%
2010s
Pre-1980
1980s
1990s
2000s
Share of Office Stock Built by Decade (%)
Note: Data refer to original year of construction and do not account for demolitions, redevelopment and refurbishment activity.Sources: REIS, PGIM Real Estate. As of May 2021.
2021 GLOBAL OUTLOOK
PGIM Real Estate | May 2021 | REF: 000778 Page 21
3. Last Mile RetailLONG-TERM CORRECTION
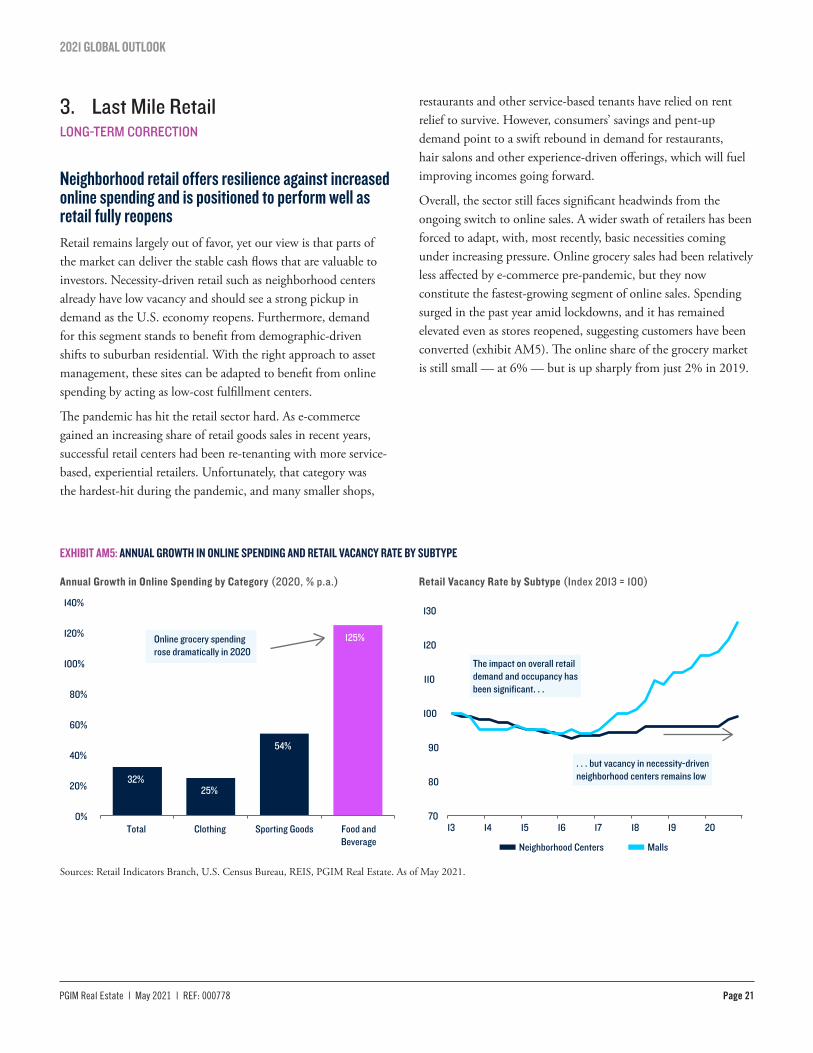
Neighborhood retail offers resilience against increased online spending and is positioned to perform well as retail fully reopensRetail remains largely out of favor, yet our view is that parts of the market can deliver the stable cash flows that are valuable to investors. Necessity-driven retail such as neighborhood centers already have low vacancy and should see a strong pickup in demand as the U.S. economy reopens. Furthermore, demand for this segment stands to benefit from demographic-driven shifts to suburban residential. With the right approach to asset management, these sites can be adapted to benefit from online spending by acting as low-cost fulfillment centers.
The pandemic has hit the retail sector hard. As e-commerce gained an increasing share of retail goods sales in recent years, successful retail centers had been re-tenanting with more service-based, experiential retailers. Unfortunately, that category was the hardest-hit during the pandemic, and many smaller shops,
restaurants and other service-based tenants have relied on rent relief to survive. However, consumers’ savings and pent-up demand point to a swift rebound in demand for restaurants, hair salons and other experience-driven offerings, which will fuel improving incomes going forward.
Overall, the sector still faces significant headwinds from the ongoing switch to online sales. A wider swath of retailers has been forced to adapt, with, most recently, basic necessities coming under increasing pressure. Online grocery sales had been relatively less affected by e-commerce pre-pandemic, but they now constitute the fastest-growing segment of online sales. Spending surged in the past year amid lockdowns, and it has remained elevated even as stores reopened, suggesting customers have been converted (exhibit AM5). The online share of the grocery market is still small — at 6% — but is up sharply from just 2% in 2019.
EXHIBIT AM5: ANNUAL GROWTH IN ONLINE SPENDING AND RETAIL VACANCY RATE BY SUBTYPE
Sources: Retail Indicators Branch, U.S. Census Bureau, REIS, PGIM Real Estate. As of May 2021.
Annual Growth in Online Spending by Category (2020, % p.a.) Retail Vacancy Rate by Subtype (Index 2013 = 100)
70
80
90
100
110
120
130
13 14 15 16 17 18 19 20
Neighborhood Centers Malls
32% 25%
54%
125%
0%
20%
40%
60%
80%
100%
120%
140%
Total Clothing Sporting Goods Food and Beverage
Online grocery spending rose dramatically in 2020
The impact on overall retail demand and occupancy has been significant. . .
. . . but vacancy in necessity-driven neighborhood centers remains low

2021 GLOBAL OUTLOOK
Page 22 PGIM Real Estate | May 2021 | REF: 000778
In contrast to struggling parts of the retail market, such as malls, through the process of adapting, neighborhood centers have retained their defensive status despite highly challenging trading conditions in the past year. The stable cash flows generated by necessity-based retail have a role to play in real estate portfolio construction, and we expect to see a gradual return of capital to this segment, providing support for pricing.
This rapid increase in demand has outpaced the ability of the nascent grocery logistics infrastructure to serve household customers. Rather than becoming entirely displaced by a shift to online spending, grocery-anchored neighborhood centers have adapted and now operate as last-mile fulfillment centers. As a result, neighborhood vacancy rates have remained low.
The question is whether this short-term fix will become a longer-term trend that supports retail space demand. The reality is that online fulfillment costs are high, and we expect retailers to continue to steer customers to store-based solutions — especially for low-margin, high-volume necessity-based items such as groceries and personal care items (exhibit AM6).
EXHIBIT AM6: RETAIL LOGISTICS COSTS
12.3%
6.2%
0%
2%
4%
6%
8%
10%
12%
14%
Retailers > 50% of Sales Online Retailers > 50% of Sales in Store
Logistics costs are estimated to be significantly lower for retailers that generate or fulfill a majority of sales in store
Average Combined Warehouse and Transport Costs for Retailers (% Sales)
Sources: FreightWaves, Gartner, PGIM Real Estate. As of May 2021.

2021 GLOBAL OUTLOOK
PGIM Real Estate | May 2021 | REF: 000778 Page 23
EXHIBIT AM7: NON-TRADITIONAL SECTOR DEAL VOLUME AND BREAKDOWN OF THE U.S. REIT MARKET
Sources: Real Capital Analytics, NAREIT, PGIM Real Estate. As of May 2021.
Share of Transaction Volume by Property Type (%) U.S. REIT Market Cap by Property Type (%)
REITs already have large weightings
toward non-traditional property types
Several non-traditional property types recorded jumps in their shares of volume in the second half of 2020
0%
1%
2%
3%
4%
5%
6%
7%
05 06 07 08 09 10 11 12 13 14 15 16 17 18 19 20
Self-Storage Manufactured Housing Senior Housing ex. Nursing Care
Infrastructure
Data Centers
Health Care
Self-Storage
Specialty
Lodging/Resorts
ManufacturedHousing
Single Family Homes
Industrial
Apartments
O�ce
Retail
4. Non-Traditional SectorsONGOING TAILWINDS
Non-traditional property types are gaining the attention of institutional investors because of cash flow resilience, low capex and diversificationIn a low returns environment — and with large parts of traditionally dominant investment sectors such as retail and office facing demand pressure — non-traditional property types continue to offer investors a route to secure resilient cash flow and potential outperformance. And although a greater degree of risk is often involved — especially once operational responsibilities are involved — sophisticated investors also stand to benefit from the specialist expertise required to deploy capital in such sectors as data centers, senior housing and self-storage.
Growing investor interest in non-traditional sectors is new at a time when cap rate spreads have narrowed. Investing is usually a late-cycle play because investors chase yield in a lower returns
world. Investment in three of the larger non-traditional sectors — self-storage, manufactured housing and senior living — rose sharply during the second half of 2020, but they remain below 5% of total deal volume (exhibit AM7).
That non-traditional property types are specialized helps explain why private market trends contrast sharply with REIT markets, wherein more than 50% of real estate is held outside the four traditional property types. Indeed, the single largest property type in the REIT universe is now infrastructure — which comprises mostly cell phone towers — and the data center sector is larger than offices.
REITs are often first movers in non-traditional assets, benefiting from sector-specific business plans and the ability to rapidly raise capital. And yet, REIT market trends suggest that non-traditional sector exposure will rise over time from a low base. Part of that is linked to growing expertise on behalf of private investors, as, too, are opportunities for some of these sectors — such as data centers — to grow rapidly.

2021 GLOBAL OUTLOOK
Page 24 PGIM Real Estate | May 2021 | REF: 000778
What is attractive is that non-traditional sectors provide evidence of resilience through economic downturns. Net operating income growth mostly remained positive — or dipped only slightly — during the recessions following the dot-com and global financial crisis (exhibit AM8).
This time around, senior living and student housing have been temporarily hit by the pandemic — with demand starting to rebound in early 2021 — but other sectors reported stable or growing net operating income in 2020, with cash flow proving more resilient than major property types.
So, while the higher-yield story has effectively been eroded, the case for non-traditional property types remains compelling in an uncertain environment because they offer resilient cash flow, low capex drag and diversification too. As their share of the institutional market grows over time, we anticipate growing opportunities to develop, operate and acquire assets in these specialized sectors.
EXHIBIT AM8: CAP RATE SPREADS AND INCOME GROWTH FOR U.S. NON-TRADITIONAL SECTORS
Sources: Green Street Advisors, PGIM Real Estate. As of May 2021.
Cap Rate Spread to Major Property Type Average (%) Same-Store Net Operating Income Growth by Sector (% p.a.)
-30%
-25%
-20%
-15%
-10%
-5%
0%
5%
10%
15%
00 02 04 06 08 10 12 14 16 18 20
Self-Storage Manufactured Housing Senior Housing Student Housing Single-Family Rental Cold Storage
-1.5%
-1.0%
-0.5%
0.0%
0.5%
1.0%
1.5%
2.0%
2.5%
3.0%
00 01 02 03 04 05 06 07 08 09 10 11 11 12 13 14 15 16 17 18 19 20
Self-Storage Manufactured Housing Senior Housing Student Housing Data Centers Single-Family Rental Cold Storage
Cap rate spreads have eroded over time. . .
. . . but niche sectors have typically demonstrated income growth resilience during downturns
Senior housing and student housing have su�ered due to COVID-19, but other sectors are performing well

2021 GLOBAL OUTLOOK
PGIM Real Estate | May 2021 | REF: 000778 Page 25
EXHIBIT AM9: MEXICO RETAIL SALES BY TYPE AND INDUSTRIAL RENTAL GROWTH IN MAJOR CITIES
Sources: CBRE, INEGI, Mexican Internet Association, Statista, PGIM Real Estate. As of May 2021.
Annual Retail Sales Growth by Type – Mexico (%) Mexico Industrial Rental Growth – 1Q21 (% p.a.)
1-Year 3-Year
-40%
-20%
0%
20%
40%
60%
80%
09 10 11 12 13 14 15 16 17 18 19 20
Overall Internet, Catalog and TV Sales
Online retail is growing rapidly in Mexico. . .
0%
1%
2%
3%
4%
5%
6%
7%
8%
Mexico City Mexico City(Logistics)
Monterrey Guadalajara MexicoOverall
Rents in large cities, and particularly in the logistics subsector of Mexico City, have grown faster than the national average as online retail tenants expand
5. Mexico Infill LogisticsACCELERATED CHANGE
Rising amounts of online shopping are creating demand for logistics in larger Mexican cities, with low current e-commerce adoption rates providing plenty of runway for future tenant demand growth.Logistics properties located within Mexico City as well as in other cities with large affluent populations, including Guadalajara and Monterrey, will remain in high demand as e-commerce penetration rises. Meeting needs for same-day or next-day delivery, however, comes up against limited available supply in built-up urban areas. That points to ongoing faster rental and capital value growth than industrial properties in outlying areas meeting the needs of export-oriented manufacturers.
Internet sales in Mexico surged in 2020 both in absolute terms and as a share of total retail sales during a year when overall consumption suffered, leading to strong demand from logistics tenants. Although some of that growth was caused by shoppers’ temporary avoidance of physical store locations amid lockdown restrictions, many habits will become permanent. The current retail share of Mexico’s e-commerce sales of 3.5% is low in comparison with the U.S. share of 14% and the global share of 18%.
Despite the deep recession, rents are rising for industrial properties across major cities in Mexico. This represents a break from history, such as the mild consumption downturn in 2017, when rents stagnated or fell, which points to resilience as long as e-commerce demand rises (exhibit AM9).

2021 GLOBAL OUTLOOK
Page 26 PGIM Real Estate | May 2021 | REF: 000778
Key factors in support of the outlook and opportunities • Led by a swift rebound in China, the
region’s economy is already back in expansion mode and is expected to record a rapid pace of growth in 2021 as life returns to normal.
• Real estate space demand is improving. There is an expanding focus on occupancy of high-quality space, although occupiers remain cost conscious.
• Real estate values fell only moderately in 2020, and opportunities linked to a cyclical pickup in demand and rents or through longer-term structural trends are becoming re-established.
IN BRIEFGiven our assessment of the outlook for the Asia Pacific economy and real estate market, we identify the following opportunities as being among the most attractive on a risk-adjusted basis over the next 12 months.
l ACCELERATED CHANGE
Logistics and Cold StorageA further push toward online retail on the back of the pandemic means that the secular demand for logistics remains strong
l ONGOING TAILWINDS
Residential SectorAs gateway city populations continue to grow, demand for housing – either buying or renting – will benefit from the re-urbanization trend
China DeleveragingTighter domestic credit growth policies are creating opportunities across equity and debt
l SHORT-TERM REPOSITIONING
Grade A OfficesOffice demand has turned the corner, and the sector offers an attractive cyclical opportunity as staff return to workplaces
HotelsA bruised hospitality sector offers a compelling countercyclical opportunity ahead of an expected gradual recovery in demand
ASIA PACIFIC
REGIONAL SPOTLIGHT

2021 GLOBAL OUTLOOK
PGIM Real Estate | May 2021 | REF: 000778 Page 27
WHAT ARE THE INVESTMENT OPPORTUNITIES?
1. Logistics and Cold StorageACCELERATED CHANGE
A further push toward online retail on the back of the pandemic means that secular demand for logistics remains strongLogistics remains an appealing sector for investors because of the continued structural rise of e-commerce across Asia Pacific markets. In addition, an acceleration in online spending caused by the pandemic has raised demand and created a sense of urgency for space expansion among online retailers and logistics operators. Regional net absorption continues to run at near record levels despite the decline in overall retail sales in 2020 (exhibit AP1).
EXHIBIT AP1: LOGISTICS DEMAND
EXHIBIT AP2: LOGISTICS COST STRUCTURE AND ONLINE GROCERY SPENDING
50
60
70
80
90
100
110
120
130
140
150
0
10,000
20,000
30,000
40,000
50,000
60,000
70,000
11 12 13 14 15 16 17 18 19 20
Net Absorption Rental Index (RHS)
Strong net absorption in cities like Greater Tokyo and Greater Seoul, but large supply pipelines have kept rental growth modest
0% 5% 10% 15% 20%
South Korea
China
Japan
Australia
2018 2023F
Rent is a small part of overall logistics costs
Online grocery sales penetration set to increase further in the coming years across the region
Transportation, 50% Rent, 5%Inventory,
20%
Labor,15%
Other,10%
Asia Pacific Logistics Absorption (000 sq ft) and Rental Index (2011 = 100)
Typical Cost Structure of a Third-Party Logistics Operator (% Total Costs)
Online Grocery Sales (% Total)
Sources: CBRE, JLL, PGIM Real Estate. As of May 2021.
Sources: Forrester, Deloitte, PGIM Real Estate. As of May 2021.
Space demand from e-commerce and third-party-logistics operators is rising, but investor interest has driven an unprecedented push in the development landscape and the future supply pipeline remains high, especially in China, Japan and South Korea. This relative ease of supply is clearly putting a cap on rental growth, which has averaged a modest 1.5% per year since 2016.
Noting the prospect of supply growth, investors should maintain discipline and become increasingly selective within the sector — especially in Tokyo and Seoul, where completions are expected to continue at record levels over the next two years.
We expect performance to become increasingly divergent as submarket and subsector nuances grow in importance. Location is one of those factors. Logistics stock in established submarkets that are close to large population hubs such as the bay area in Tokyo and satellite cities surrounding Shanghai or that are situated on transport nodes with strong connectivity such as Icheon near Seoul will remain defensive and highly sought after — particularly given consumers’ expectations of shorter delivery times.
Rent is a small proportion of a logistics operator’s total operating costs and is also much lower than total transportation costs arising from deliveries (exhibit AP2). This could mean a greater scope for landlords to command rental increases in well-located submarkets that enable a logistics operator or retailer to strike a balance between delivery speed, warehousing and transportation costs.
Subsectors within the logistics market will also be important. Major economies across the region are forecast to see online grocery penetration rates double in the next few years (exhibit AP2), driving demand for climate-controlled and cold-chain logistics facilities, which remain undersupplied in many markets.

2021 GLOBAL OUTLOOK
Page 28 PGIM Real Estate | May 2021 | REF: 000778
EXHIBIT AP3: POPULATION GROWTH IN MAJOR GATEWAY CITIES
-0.5%
0.0%
0.5%
1.0%
07 08 09 10 11 12 13 14 15 16 17 18 19 20 21 22 23 24 25
Major Gateway Cities Rest of Country
Population centralization means major cities have stronger demographics
Forecasts Di�erence: city minus country
Asia Pacific Population Growth (% p.a.)
Sources: Oxford Economics, CEIC, PGIM Real Estate. As of May 2021.
2. Residential SectorONGOING TAILWINDS
As gateway-city populations continue to grow, demand for housing — either buying or renting — will benefit from the re-urbanization trend Across Asia Pacific, favorable demographics and declining housing affordability provide institutional investors with opportunities to participate in the early growth of the nascent rental housing sector.
With the structural trend of population centralization — domestic and international migration toward major economic and employment hubs — the growth in numbers of inhabitants in gateway cities has outperformed the rest of their respective countries. Although disruptions caused by the pandemic will result in slower growth until 2022 at the earliest, this trend is expected to remain intact as border restrictions normalize (exhibit AP3).
The urbanization and centralization trends toward major gateway cities have driven housing demand, but supply growth has lagged as land prices have risen. Unsurprisingly, housing prices have risen faster than median incomes, and as a result, major regional gateway cities such as Tokyo, Seoul, Sydney and Hong Kong have witnessed a continuous trend of housing affordability deterioration. Even amid some house price corrections as a result of the pandemic, affordability remains low relative to a decade ago.
Residential demand in migration-driven cities such as Sydney softened in 2020 as a result of the pandemic, but the trend of declining affordability is likely to resume because a strong recovery in residential prices is expected. Moreover, we have observed an increasing willingness to rent — particularly in Australia and South Korea — which bodes well for the fledging built-to-rent market that lags far behind the well-established U.S. and Japanese markets (exhibit AP4).
Investor interest in the sector is rising and transaction volume rose 30% last year. Although the increase was almost entirely in Japan — the only established built-to-rent market in Asia Pacific — it points to exit liquidity for stabilized rental projects. In turn, it highlights the opportunities available for institutional investors that are early movers in the structural development of the built-to-rent sector in such markets as Australia and South Korea. Indeed, the strong demand trends could also open up opportunities to participate in development-for-sale projects, though investors will need to be more selective in terms of location and product type.
The urbanization and centralization trends toward major gateway cities have driven housing demand, but supply growth has lagged as land prices have risen.
“

2021 GLOBAL OUTLOOK
PGIM Real Estate | May 2021 | REF: 000778 Page 29
EXHIBIT AP4: RESIDENTIAL RENTAL MARKET SHARE AND INDEX OF HOUSING AFFORDABILITY
Note: The housing affordability index is measured as a ratio of median house prices to household disposable incomes and is rebased to 2007. Australia’s major cities refer to Sydney, Melbourne and Brisbane.Sources: National Statistics Bureaus, CEIC, PGIM Real Estate. As of May 2021.
Proportion of Renters in Australia and Japan (% Total) Housing Affordability Index (2007 = 100)
59%
60%
61%
62%
63%
23%
24%
25%
26%
27%
28%
29%
30%
31%
00 01 02 03 04 05 06 07 08 09 10 11 12 13 14 15 16 17 18 19 20
Australia Japan (RHS)
A�ordability has been deteriorating regionally becauseincomes have not kept up with house price increases
Majority of households in Japan rent, while renting has gained popularity in Australia
60
80
100
120
140
160
180
07 08 09 10 11 12 13 14 15 16 17 18 19 20
Australia (Major Cities) Tokyo Seoul Hong Kong
Less A�ordable
More A�ordable
3. Grade A OfficesSHORT-TERM REPOSITIONING
Office demand has turned the corner, and the sector offers an attractive cyclical opportunity as staff return to workplacesThe office sector offers an attractive cyclical investment opportunity as the economic recovery takes shape. This opportunity is highlighted by an improvement in net absorption, which turned positive in a number of cities in the last quarter of 2020 and the first quarter of 2021, following a period of tepid demand (exhibit AP5). In addition to improving economic conditions, office fundamentals in Asia Pacific are expected to be boosted by employment growth in the technology sector and leasing demand from global and regional tech players — particularly among rapidly expanding Chinese companies.
As health risks from the pandemic subside, we expect that grade A offices in central business districts (CBDs) — which provide quality space, amenities and proximity to clients and business partners — will remain attractive and resilient.
The correction of effective grade A office rents in major CBDs during 2020 has also made premium office space more affordable for occupiers and will play important roles in attracting occupiers back to CBDs. In Singapore and Shanghai, affordability improved after a 10% decline in rents in 2020, and Sydney and Melbourne saw even sharper rent corrections that have pushed affordability to the best levels in many years.

2021 GLOBAL OUTLOOK
Page 30 PGIM Real Estate | May 2021 | REF: 000778
EXHIBIT AP5: DEMAND, AFFORDABILITY AND SUPPLY ACROSS MAJOR ASIA PACIFIC OFFICE MARKETS
Note: The office rental affordability index is measured as a ratio of total office rental cost to business revenues. The lower the ratio, the more affordable office rents are to occupiers.Sources: JLL, Oxford Economics, PGIM Real Estate. As of May 2021.
Change in Asia Pacific Net Absorption – Average 4Q20-1Q21 Minus 2Q20-3Q20 (%) Office Rental Affordability Index (Avg. Since 2001 = 100)
0%
2%
4%
6%
8%
10%
08 09 10 11 12 13 14 15 16 17 18 19 20 21 22 23 24 25
30 60 90
120 150 180 210
Shanghai HongKong
Seoul Sydney Melbourne Singapore Tokyo Osaka
Lowe
r = M
ore A
ord
able
2019 2020 Low (Most Aordable) High (Least Aordable)
Net absorption turned positive in most markets at the turn of 2021
A decline in rents during 2020 implies improved aordability across the region
Laggards -2.0%
-0.1%
0.0%
0.4%
0.5%
0.7%
0.9%
1.0%
1.1%
1.1%
-2.0% -1.5% -1.0% -0.5% 0.0% 0.5% 1.0% 1.5%
Tokyo
Melbourne
Osaka
Brisbane
Beijing
Shanghai
Hong Kong
Sydney
Singapore
Seoul
Recovery Markets
Forecasts Trend
Supply growth remains low, limiting availability of the high-quality o�ce space that is increasingly in demand
Businesses across the region have been encouraging staff to return to the workplace, and physical office occupancy is picking up, even as potential challenges to the office sector continue to evolve while companies determine the balance between employees’ office time and remote work. We expect a shift in the way offices are used post-pandemic, but we also expect CBD offices to become more resilient, even if aggregate office demand softens, with a hybrid office structure likely to prefer a centralized location for face-to-face office engagement and business meetings. Companies looking to shrink their overall office footprints will also have the flexibility to opt for higher-quality office facilities, with potentially similar total occupancy costs. Together with recovering demand, moderating supply trends will further support the segment in the region’s major office markets.
Office Supply Growth (% Existing Stock)
Investors could position for this recovery via the grade A CBD office segment, wherein we expect investment sentiment to pick up along with a rebound in rents from this year onward. Office markets in Singapore, Seoul and Shanghai are likely to witness swifter rental recoveries, whereas the Tokyo, Osaka and Melbourne markets — which are currently lagging in the recovery — offer investors opportunities to gain exposure to these markets amid near-term pricing or fundamental dislocations.

2021 GLOBAL OUTLOOK
PGIM Real Estate | May 2021 | REF: 000778 Page 31
4. HotelsSHORT-TERM REPOSITIONING
A bruised hospitality sector offers a compelling countercyclical opportunity ahead of an expected gradual recovery in demandThe hospitality sector currently offers a countercyclical investment opportunity whereby investors stand to benefit from the gradual normalization of international travel.
The tourism sector has been hit badly, as many major international borders remained largely closed 12 months into the pandemic and as international tourist arrivals into Asia Pacific were still at virtually zero through the early part of 2021. Given national targets to vaccinate the majority of populations by the end of 2021, international tourist arrivals are expected to recover gradually from 2022 onward, driven by pent-up demand for leisure travel (exhibit AP6).
EXHIBIT AP6: INTERNATIONAL TOURISM DEMAND AND HOTEL PERFORMANCE IN MAJOR MARKETS
Sources: Pacific Asia Travel Association, STR, PGIM Real Estate. As of May 2021.
International Tourist Arrivals (Millions) and Recovery Scenarios Asia Pacific Annual Hotel RevPAR Growth and Change in Occupancy (%)
-80%
-60%
-40%
-20%
0%
20%
40%
60%
RevPAR Growth (2020) Occupancy Change (4Q20 vs. 2Q20)
Tourist demand should pick up again from 2022 onward
0
100
200
300
400
500
600
700
800
14 15 16 17 18 19 20 21 22 23
Slow Medium Fast
Forecasts Gradual recovery already under way in some markets 2019 baseline
BangkokTokyo
Mumbai
SydneySeoul
Jakarta
Hong Kong
AucklandBeijin
g
Shanghai
The return of travelers will provide a much-needed boost for the hotel sector, which has been heavily supported by governments over the past year via wage subsidies, quarantine demand and incentives for domestic travel. With those support policies, hotel occupancy rates rose above 50% at year-end 2020, having improved from a trough of about 25% in March 2020.
However, the regional figures mask a tremendous divergence in different countries. Hotel occupancy rates in Shanghai and Beijing rose by about 40% in the second half of 2020 because post-pandemic normalization in China remains way ahead of that of other countries. Most other major travel destinations in Asia Pacific have seen a more muted improvement.
Outside China, hotel revenue per available room (RevPAR) in major Asia Pacific cities remains 40 to 80% lower than a year ago, with such markets as Tokyo and Sydney reporting the steepest declines. We expect room rates and revenues to improve significantly from 2022 onward, reflecting an anticipated recovery in international tourist arrivals.

2021 GLOBAL OUTLOOK
Page 32 PGIM Real Estate | May 2021 | REF: 000778
EXHIBIT AP7: INVESTOR PRICE EXPECTATIONS
Risks to the outlook mean investors are looking for steep discounts to acquire hotel assets
47% 46% Hotel
Shopping Mall
High Street Retail
Grade A O�ce
Logistics
Bid above asking price No discount Discount < 10% Discount 10-30% Discount > 30%
Investors’ Price Expectations by Sector (%)
Sources: CBRE, PGIM Real Estate. As of May 2021.
Hotel transaction volume fell by more than 50% in 2020. Sentiment surveys indicate that a majority of investors require a steep price discount of 30% or more for hotels (exhibit AP7), although there is limited evidence of motivated sellers at the moment. Opportunities remain highly driven by specific asset situations.
Given national targets to vaccinate the majority of populations by the end of 2021, international tourist arrivals are expected to recover gradually from 2022 onward, driven by pent-up demand for leisure travel.
“

2021 GLOBAL OUTLOOK
PGIM Real Estate | May 2021 | REF: 000778 Page 33
EXHIBIT AP8: CHINA’S LENDING MARKET AND COMMERCIAL REAL ESTATE INVESTMENT MARKET
Sources: Bloomberg, Real Capital Analytics, NBS, CEIC, PGIM Real Estate. As of May 2021.
China Bond Defaults: Offshore and Onshore (RMB Billions) China Real Estate Loan Market (RMB Trillions)
80 100 120 140 160
0
100
200
300
11 12 13 14 15 16 17 18 19 20 21 Transaction Volume Commercial Price Index (RHS)
Real estate bond defaults in 1Q21 almost equaled the the 2020 total
Commercial values are declining along with volume
Loan growth down sharply since 2017, with development loans decelerating even more significantly
0%
10%
20%
30%
0
20
40
60
80
18 19 20 21 Total Defaults Real Estate (% Total, RHS)
Est. defaults in 2021 if trend continues
0%
10%
20%
30%
40%
50%
60%
0
10
20
30
40
50
05 06 07 08 09 10 11 12 13 14 15 16 17 18 19 20 21
Development Loans Standing Asset Loans Overall Growth (RHS) Development Loan Growth (RHS)
5. China DeleveragingONGOING TAILWINDS
Tighter domestic credit growth policies are creating opportunities across equity and debtChina’s government policy of tightening credit and curbing loan growth in its real estate sector is weighing on values. A funding gap is opening up as existing lenders struggle to refinance, implying a window of opportunity for real estate investors to provide capital — especially in the private debt markets.
The backdrop is a swift domestic containment of the pandemic in China and a rapidly normalizing economy. China was the only major global economy to record positive GDP growth in 2020, with its recovery supported by accommodative monetary policy and resilient domestic and corporate consumption demand.
With economic expansion expected to return to trend in the second half of 2021, the Chinese government has also been looking to normalize monetary policy. Borrowing costs have largely returned to pre-pandemic levels. While the central bank continues to pledge monetary support to assist the wider economic recovery, there is increased scrutiny of a real estate sector that is viewed as overleveraged. Real estate remains a key target for tightening — particularly in the debt-fueled residential development sector.
Commercial Transaction Volume (RMB Billions)
Nearly all listed Chinese real estate companies exceed at least one of three government leverage guidelines, which set minimum restrictions on liability, net debt and cash-holding ratios. Indeed, 19% of companies breach all three and fall within the most critical red zone. An estimate by CBRE suggests that the real estate sector will have to reduce its debt by more than US$30 billion to meet government requirements. Unsurprisingly, real estate loan growth continued to slow, falling to 11% in 2020. Growth in loans to new development projects has decelerated even more sharply (exhibit AP8).
Bond defaults are rising, and their real estate share is growing, showing early signs of stress in the system. We expect potential debt and equity opportunities to arise for real estate investors as the government continues to crack down on overleveraged developers and as distressed assets get put on the market. During 2020, commercial transaction volume moderated, and commercial building prices fell by 4%.
As the Chinese government increases regulatory and tightening pressures on the real estate sector, more overleveraged developers will begin paring down their balance sheets and divesting non-core — and even some core — assets to shore up financial strength and meet the new requirements. This will open new opportunities for investors not only with discounted prices but also in gaining exposure to traditionally tightly held markets. As new loan availability or refinancing difficulties rise, there will also be opportunities for private lenders to fill in the financing gap, which had been well served by banks for many years.

2021 GLOBAL OUTLOOK
Page 34 PGIM Real Estate | May 2021 | REF: 000778
Key factors in support of the outlook and opportunities • Vaccine rollout should lead to a
strong economic bounce-back in the second half of 2021 as services reopen and households spend accumulated savings.
• A rapid pace of growth, albeit from a low base, will support demand for real estate, creating opportunities for investors.
• Low interest rates and liquidity support programs are set to remain in place for some time, supporting low real estate yields.
• Income growth rather than yield shift will dominate the next cycle.
• Opportunities to outperform come from recovery in weaker sectors or by growing income streams through the acquisition of assets in sectors with strong demand or via development or repositioning across sectors.
• Risk appetite is improving again, prompting a push toward higher-returning operational sectors.
IN BRIEFGiven our assessment of the outlook for the European economy and real estate market, we identify the following opportunities as being among the most attractive on a risk-adjusted basis over the next 12 months.
l SHORT-TERM REPOSITIONING
Grade A OfficesAfter a tough year, offices are set for a cyclical rebound as workplaces reopen, supported by the prospect of employment-driven economic growth
l ONGOING TAILWINDS
Modern Living SpaceInstitutions have a growing role to play in delivering modern, affordable living space for younger and older generations alike
l ACCELERATED CHANGE
Logistics and Cold StorageEuropean logistics has a strong returns outlook on the back of ongoing leasing momentum
l LONG-TERM CORRECTION
Distressed RetailRetail is in the process of a sharp value adjustment but looks close to finding a floor in the UK, with Continental Europe close behind
EUROPE
REGIONAL SPOTLIGHT

2021 GLOBAL OUTLOOK
PGIM Real Estate | May 2021 | REF: 000778 Page 35
WHAT ARE THE INVESTMENT OPPORTUNITIES?
1. Grade A OfficesSHORT-TERM REPOSITIONING
After a tough year, offices are set for a cyclical rebound as workplaces reopen, supported by the prospect of employment-driven economic growthOffices are starting to look like an attractive investment opportunity again. Our view is that from the second half of 2021 onward, a rapid rebound in economic growth and workplace reopenings — based on benefits from being in high-density CBDs — set against a low supply pipeline and a limited supply of grade A space will propel income growth.
For sure, COVID-19 has taken a toll on office occupier markets in that net effective rental growth has either slowed significantly or turned negative in most of the major European markets during the past year. This reflects the severity of Europe’s recession, a lack of appetite among occupiers to sign new leases without significant incentives and the imposed restrictions on working from offices (exhibit EU1).
EXHIBIT EU1: OUTLOOK FOR OFFICE OCCUPIER MARKET PERFORMANCE
-6%
-4%
-2%
0%
2%
4%
6%
8%
10%
10 11 12 13 14 15 16 17 18 19 20 21 22 23 24 25
Headline Rental Growth Income Growth
Headline rents are holding up, but rising vacancy, remote working and incentives are drags on income growth Forecasts
Shift to remote working should be limited and partly o�set by low supply, with income growth set to improve from 2022 onward
Office Rental Growth and Income Growth (% p.a.)
Note: Income growth is a headline measure that adjusts rents to reflect changes in occupancy and incentives.Sources: Cushman & Wakefield, PMA, PGIM Real Estate. As of May 2021.
Our base case for the office market is for further negative headline rental and overall income growth in 2021, reflecting an overhang of weak sentiment on demand from a challenging start to the year that featured a fresh tightening of COVID-19 restrictions in most major countries. But going into 2022, we see the recovery story coming through quickly, driven by an anticipated economic rebound and renewed employment growth.
Going into 2022, we see the recovery story coming through quickly, driven by an anticipated economic rebound and renewed employment growth.
“

2021 GLOBAL OUTLOOK
Page 36 PGIM Real Estate | May 2021 | REF: 000778
A closer look at the employment outlook shows that cities with highly skilled workforces — including Amsterdam, Paris, Munich and London — are expected to record stronger employment growth over time, translating into demand for office space — particularly in CBD locations in which the productivity benefits from high density are most valuable to occupiers.
Although there is no doubt that the pandemic has had a significant impact on office demand — for example, in London, take-up in 2020 was 60% below its long-term average — supply in most markets has also adjusted. Many of the CBD markets that center on skilled workforces — for example, in Berlin, Paris and Munich — came into the recession with very low vacancy rates.
And although vacancy has risen because of lower demand, during 2020 and 2021 most markets also reported downward revisions of their supply pipelines. One exception is London, which recorded several large completions, although even there, supply for the next few years will be much lower.
Frankfurt and Stockholm have seen significant downward adjustments to supply pipelines. In other markets such as Barcelona, Berlin and Paris, deliveries are down, but new supply has been pushed into 2022, reflecting developer confidence that those markets are going to eventually bounce back.
Despite some risk from the increased adoption of remote working, the modern grade A space that tenants are increasingly demanding will quickly be in short supply once demand picks up again. And a lesson from history is that rents and capital values can rebound quickly in low-vacancy markets (exhibit EU3).
EXHIBIT EU3: COVID-19-RELATED SHIFT IN DEMAND AND SUPPLY AND POST-GLOBAL FINANCIAL CRISIS CAPITAL VALUES
Sources: PMA, Cushman & Wakefield, PGIM Real Estate. As of May 2021.
Supply Revisions and Demand GrowthPrime Office Capital Value Index Following the Global Financial Crisis (Index 3Q09 = 100)
-300
-200
-100
0
100
Berli
n
Mila
n
Amst
erda
m
Mad
rid
Lyon
Rom
e
Mun
ich
Vien
na
Duss
eldor
f
Stoc
khol
m
Man
ches
ter
Dubl
in
Fran
kfur
t
Ham
burg
Paris
Barc
elona
Lond
on
Change in Supply Pipeline During Pandemic (000 sq m)
The supply pipeline has adjusted in most major markets
Low vacancy markets recorded rapid capital value growth once demand recovered in the aftermath of the global financial crisis
90
100
110
120
130
140
09 10 11 12 13
High-Vacancy Markets European Average Low-Vacancy Markets -100%
-50%
0%
2020 Take-Up vs. 10-Year Average
Dampening the impact of a temporary drop in demand during 2020
EXHIBIT EU2: OFFICE DENSITY, SKILLS AND EMPLOYMENT GROWTH
High density brings productivity benefits
Highly-skilled-workforce cities to see most employment growth
-2% -1% 0% 1% 2% 3% 4%
0.2 0.3 0.4 0.5 0.6 0.7 0.8 0.9 1.0
High Density
R2 = 0.30401
0.0% 0.5% 1.0% 1.5% 2.0% 2.5%
20% 25% 30% 35% 40% 45% 50% 55%
Highly-skilled population share
Density Index
O�ce worker productivity (1996-2019, % p.a.)
Individual markets
Employment Growth (2021-25, % p.a.)
Low Density
City Office Employment Density Vs. Productivity
Sources: OECD, Oxford Economics, Centre for Cities, PGIM Real Estate. As of May 2021.
Highly Skilled Population Vs. Employment Growth
Increased adoption of remote working is a threat but is expected to be contained. One of the factors that gives us confidence about the durability of office demand is that there are negative productivity implications if too many employees work remotely at the same time. Over time, cities with high office employment density typically have higher productivity growth (exhibit EU2).

2021 GLOBAL OUTLOOK
PGIM Real Estate | May 2021 | REF: 000778 Page 37
EXHIBIT EU4: RESIDENTIAL RENTAL DEMAND AND FORECASTS FOR HOUSEHOLD GROWTH AND DISPOSABLE INCOMES
Sources: Eurostat, Oxford Economics, PGIM Real Estate. As of May 2021.
Average European Household Size and Rental Share (%) Forecast Growth in Households and Disposable Income (2021-30, % p.a.)
0.0%
0.5%
1.0%
1.5%
2.0%
2.5%
3.0%
3.5%
Stoc
khol
m
Berli
n
Man
ches
ter
Mad
rid
Ham
burg
Fran
kfur
t
Mun
ich
Paris
Lond
on
Lyon
Amst
erda
m
Mila
n
Total Households Disposable Income
Household formation and income growth supporting residential demand side
20%
30%
40%
50%
60%
70%
2.0
2.1
2.2
2.3
2.4
2010 2015 2020
Average Household Size (Persons)
% Tenants: Households Below 60% of Median Income (RHS)
% Tenants: All Households (RHS)
Trend toward smaller households and more renters
2. Modern Living SpaceONGOING TAILWINDS
Institutions have a growing role to play in delivering modern, affordable living space for younger and older generations alikeIn Europe, we like residential assets that offer a predictable, defensive, granular income stream not least as the risk premium remains elevated. Beyond stabilized core, as the defensive investment approach of 2020 gives way to a more optimistic outlook, there are opportunities for developments of new, modern living stock to meet rising rental demand — and also to access higher returns in non-traditional living segments, such as senior housing and student accomodation.
Across Europe, residential demand has held up well since the pandemic got under way, and a longer-term trend of falling household sizes continues, pushing more households into rental accommodation (exhibit EU4). Institutional ownership
of rental accommodation is generally low, and units can often be overcrowded or substandard. In the United Kingdom, for example, one-quarter of privately rented homes — 1.1 million units in total — are classed as substandard.
The need for affordable living is notable among low-income households, of which more than 60% are tenants across Europe. This points to an ongoing need for affordable rental accommodation — especially in smaller cities and in commuter belts that serve large metropolitan areas.
Two further factors support residential demand and rental growth potential. The first is that the total number of households in major urban areas is forecast to grow steadily during the next decade, whereas supply, at least in the near term, remains contained. The second is that after a few weaker years, linked to the COVID-19 recession and its aftermath, household income growth is set to recover in line with falling unemployment and rising wages — growing, on average, at a pace above recent norms in the past decade.

2021 GLOBAL OUTLOOK
Page 38 PGIM Real Estate | May 2021 | REF: 000778
EXHIBIT EU6: SENIOR POPULATION PROJECTIONS FOR MAJOR EUROPEAN COUNTRIES AND UK CARE HOME YIELD PREMIUM
Sources: Oxford Economics, Cushman & Wakefield, Knight Frank, PMA, PGIM Real Estate. As of May 2021.
Growth of Total 65+ Population (Millions, vs. 2020 Levels) UK Prime Residential and Care Home Yields (%)
0
1
2
3
4
5
6
2025 2030 2035
UK France Germany
More than 12 million over-65s will be added in the UK, France and Germany by 2035
2.5%
3.0%
3.5%
4.0%
4.5%
5.0%
5.5%
6.0%
6.5%
7.0%
08 09 10 11 12 13 14 15 16 17 18 19 20
Residential Care Homes
Estimated Care Home EBITDARM Yield Range for
Value-Add Deals
There is still a substantial yield premium for taking share in operational risk
At the same time, several major European cities such as Berlin and Paris have rent controls in place that limit landlords’ ability to capture higher rents as their tenants’ financial situations improve. However, even once that and historically low initial yields are factored in, residential assets offer a risk premium that is well above its own long-term average (exhibit EU5).
Of course, this is more a low-interest-rate story, because returns on stabilized residential are very stable over time. For some investors, the diversification potential of residential assets is appealing, but they require higher returns. The result is that we are seeing more capital targeting non-traditional living sectors.
Of these, senior living is among the most attractive because Europe’s older population is expected to grow significantly. In the UK, France and Germany, the number of over-65s is set to rise by 12 million by 2035 (exhibit EU6), which supports ongoing demand for senior-living units across the care spectrum. At the same time, much of the existing stock is itself aging, which implies significant need for capital to develop modern assets for serving future care needs.
By developing and operating specialized living assets such as care homes, which are residential homes that offer assisted-living services rather than full nursing care, investors can gain operational exposure. Through ownership and by operating facilities, value-add investors can generate much-higher yields and returns than through core buy-and-hold strategies, wherein the lease structure results in yields that are similar to prime residential.
EXHIBIT EU5: RESIDENTIAL PRICING ANALYSIS
0.0%
0.5%
1.0%
1.5%
2.0%
2.5%
3.0%
3.5%
4.0%
4.5%
03 05 07 09 11 13 15 17 19
Residential returns are steady over time, meaning the risk premium is currently elevated compared with low interest rates
Estimated Residential Risk Premium (%)
Source: PGIM Real Estate. As of May 2021.

2021 GLOBAL OUTLOOK
PGIM Real Estate | May 2021 | REF: 000778 Page 39
3. Logistics and Cold StorageACCELERATED CHANGE
European logistics has a strong returns outlook on the back of ongoing leasing momentumLogistics in Europe represents an ongoing investment opportunity based on favorable momentum because the pandemic has accelerated the shift to online retailing that had already started. Supply chains are adapting, and capital inflows will be needed for some time to create the stock to meet growing occupier demand.
Take-up of logistics space remains elevated, and our estimate is that although the effects of a weaker economy would have seen demand softening in 2020, this was more than offset by the effects of the accelerated pickup in online spending that has prompted rising space requirements among e-commerce specialists and third-party logistics operators (exhibit EU7).
EXHIBIT EU8: LOGISTICS CAPITAL VALUE GROWTH OUTLOOK
-10%
-5%
0%
5%
10%
15%
20%
25%
10 11 12 13 14 15 16 17 18 19 20 21 22 23 24 25
Logistics Commercial
Logistics still benefiting from favorable momentum and is set to outperform. . .
Forecasts
. . . although supply will eventually dampen growth potential
Capital Value Growth by Sector (% p.a.)
Sources: PMA, Cushman & Wakefield, PGIM Real Estate. As of May 2021.
Yields are low, but our view is that the improved profile of occupier demand implies a lower risk premium, and low interest rates, too, are supportive of pricing — especially given the rental growth being recorded. It is very much a momentum play on the rental side — but also as yields look set to compress further given the weight of the capital targeting the sector.
Capital value growth forecasts compare favorably with other commercial real estate sectors, although we see the gap closing over time as yields find a floor and a likely supply response weighs on future rental growth (exhibit EU8).
EXHIBIT EU7: LOGISTICS DEMAND AND SUPPLY
0% 10% 20% 30% 40%
0 5
10 15
20
10 11 12 13 14 15 16 17 18 19 20 21F
Big Three Netherlands Italy Spain Poland
0 5
10 15
20 25 30
10 11 12 13 14 15 16 17 18 19 20 21F
European logistics take-up hit a record high in 2020
Completions are elevated, but in line with demand although speculative supply is picking up
% speculative (RHS)
Estimated E�ect of COVID-19-Induced Take-up
Logistics Take-up – Major European Markets (Million sq m)
Sources: PMA, Cushman & Wakefield, PGIM Real Estate. As of May 2021.
Logistics Completions – Major European Markets (Million sq m)
Our projection for 2021 is that demand will rise further, assisted by an anticipated recovery in household spending. Despite a clear supply response across Europe, including a noteworthy pickup in speculative supply, for now elevated demand is translating into above-average rental growth, which is expected to continue into 2022.
Investors looking to generate higher returns in the sector have several options. One is to develop sites in major core markets, with the aim of benefiting from leasing momentum, rental growth and favorable exit yields. Alternatively, higher-yielding non-core markets offer opportunities wherein online spending is growing from a low base, such as in Italy and Spain. And finally, niche logistics sectors such as cold storage offer potentially higher returns in compensation for higher fit-out costs, greater operational expertise and some additional risk.

2021 GLOBAL OUTLOOK
Page 40 PGIM Real Estate | May 2021 | REF: 000778
EXHIBIT EU9: IMPACT OF ONLINE RETAIL ON CAPITAL VALUE GROWTH
UK retail decline started once online retail passed 12% of all spending
The UK decline accelerated once 16% mark was passed; eurozone will get there in 2021
-40%
-20%
0%
20%
01 02 03 04 05 06 07 08 09 10 11 12 13 14 15 16 17 18 19 20
Eurozone UK
0%
10%
20%
30%
01 02 03 04 05 06 07 08 09 10 11 12 13 14 15 16 17 18 19 20
Eurozone UK
Annual MSCI Retail Capital Value Growth (%)
Sources: MSCI, Cushman & Wakefield, PGIM Real Estate. As of May 2021.
Share of Online Retail (% Total Spending)
EXHIBIT EU10: RETAIL VALUE DECLINES IN THE CONTEXT OF PAST DOWNTURNS
40
50
60
70
80
90
100
110
120
130
140
0 1 2 3 4 5 6 7 8 9 10 11 12 13 14 15 16 17 18 19 20 21 22 23 24 25 26 27 28 29 30 31 32
Looking at past downturns across many di�erent markets gives us a sense of what can happen when markets experience structural decline or prolonged oversupply
UK retail decline looks extreme compared with a broad global sample UK
Cont. Europe
Quarters From Start of Downturn
Real Prime Capital Value Index During Downturns (Peak = 100)
Note: Chart tracks downturns across a wide range of global cities and sectors since the 1980s. The shaded areas represent deciles between the 10th and 90th percentile.Sources: Cushman & Wakefield, PGIM Real Estate. As of May 2021.
4. Distressed RetailLONG-TERM CORRECTION
Retail is in the process of a sharp value adjustment but looks close to finding a floor in the UK, with Continental Europe close behindRetail conditions are challenging, but a significant correction in values is taking place that points to an opportunity to invest in a stabilization and eventual recovery. This is a risky play, however, given there is too much retail space and some projects will simply end up being obsolete.
Trading conditions for retailers have been tough for some time, and we have already seen significant value adjustments. There was a noteworthy drop in UK retail capital value growth from 2016 onward when the share of online retail sales started to climb more quickly, with value declines intensifying once it surpassed 16% — a level that is expected to be reached in Continental Europe in 2021 (exhibit EU9).
The shift to online spending means that there is too much retail space. In periods of structural decline marked by a prolonged excess of supply over demand, income growth turns negative
(1) because it gets harder to lease space to tenants; (2) because risk premiums rise, pushing yields up; and (3) because values fall sharply.
In the past few years, this mechanism has played out in the UK, where prime retail values are down by more than 40% in real terms — an extreme adjustment compared with other examples of long-term structural decline. In Continental Europe, real values are down by 15% so far but are following a similar direction of travel (exhibit EU10).
The risks of owning a site that becomes obsolete or suffers further value falls remain significant, but a correction in values brings with it an opportunity. As outstanding loans reach maturity, distress is arising as values adjust to a new, lower equilibrium level, and existing owners and lenders face the need to inject fresh capital.
There are signs that value declines are limited or slowing on defensive, necessity-driven schemes across Europe and, in the UK, on lower-cost retail parks that can compete more effectively with online. For investors seeking to inject fresh capital, the aim is to stabilize cash flow, prove resilient leasing demand at in-place rents and benefit from yield compression as risk premiums come down from elevated levels.

2021 GLOBAL OUTLOOK
PGIM Real Estate | May 2021 | REF: 000778 Page 41
INVESTMENT RESEARCH TEAMAUTHORSGREG KANE, Executive Director, Head of European Investment Research
HENRI VUONG, Executive Director, Head of Real Estate Debt Investment Research
KELLY WHITMAN, Executive Director, Americas Investment Research
KAI YIP, Vice President, Asia Pacific Investment Research
FLORIAN RICHTER, Vice President, European Investment Research
GREG KANE Executive Director Head of European Investment Research [email protected]
FLORIAN RICHTER Vice President [email protected]
MATTHEW HUEN Associate [email protected]
DR. CUONG NGUYEN Executive Director Head of Asia Pacific Investment Research [email protected]
KAI YIP Vice President [email protected]
YIWEN CHEN Analyst [email protected]
HENRI VUONG Executive Director Head of Real Estate Debt Investment Research [email protected]
EUROPE
ASIA PACIFIC
DEBT
AMERICASLEE MENIFEE Managing Director Head of Americas Investment Research [email protected]
KELLY WHITMAN Executive Director [email protected]
BRADLEY DOREMUS, CFA Vice President [email protected]
DEAN JOSEPH DEONALDO Assistant Vice President [email protected]
PHOEBE KEEGAN Associate [email protected]
YVONNE WHITE [email protected]
KAIA HENRIKSEN Analyst [email protected]
DR. PETER HAYES Managing Director Global Head of Investment Research [email protected]
GLOBAL

www.pgimrealestate.com
Important Information
PGIM is the primary asset management business of Prudential Financial, Inc (PFI). PGIM Real Estate is PGIM’s real estate investment advisory business and operates through PGIM, Inc., a registered investment advisor. Registration as a registered investment adviser does not imply a certain level or skill or training. PGIM, their respective logos as well as the Rock symbol are service marks of PFI and its related entities, registered in many jurisdictions worldwide. PFI of the United States is not affiliated in any manner with Prudential plc, incorporated in the United Kingdom or with Prudential Assurance Company, a subsidiary of M&G plc, incorporated in the United Kingdom.
In the United Kingdom, information is issued by PGIM Limited with registered office: Grand Buildings, 1-3 Strand, Trafalgar Square, London, WC2N 5HR. PGIM Limited is authorised and regulated by the Financial Conduct Authority (“FCA”) of the United Kingdom (Firm Reference Number 193418). In the European Economic Area (“EEA”), information is issued by PGIM Real Estate Luxembourg S.A. with registered office: 2, boulevard de la Foire, L1528 Luxembourg. PGIM Real Estate Luxembourg S.A. is authorised and regulated by the Commission de Surveillance du Secteur Financier (the “CSSF”) in Luxembourg (registration number A00001218) and operating on the basis of a European passport. In certain EEA countries, information is, where permitted, presented by PGIM Limited in reliance of provisions, exemptions or licenses available to PGIM Limited under temporary permission arrangements following the exit of the United Kingdom from the European Union. These materials are issued by PGIM Limited and/or PGIM Real Estate Luxembourg S.A. to persons who are professional clients as defined under the rules of the FCA and/or to persons who are professional clients as defined in the relevant local implementation of Directive 2014/65/EU (MiFID II).
PGIM Real Estate Germany AG is a German Capital Management Company with a respective license pursuant to sec. 20, 22 of the German Capital Investment Act (Kapitalanlagegesetzbuch–KAGB). In case PGIM Real Estate Germany AG markets or distributes units or shares in external investment funds, i.e. investment funds for which PGIM Real Estate Germany AG does not provide the collective portfolio management within the meaning of Directive 2011/61/EU or, respectively, the KAGB, such marketing or distribution is performed in accordance with sec. 20 para. 3 no.6 KAGB. PGIM Real Estate Germany AG is not responsible for the collective portfolio management (including portfolio and risk management) within the meaning of Directive 2011/61/EU or, respectively, the KAGB, with regard to the respective investment funds in this case. It is also not responsible for the content of any marketing material (including prospectus, Offering Memoranda etc.) provided by the fund manager or other third parties. PGIM Real Estate Germany AG will not examine or assess the individual situation of any prospective investor and does not provide any personal recommendations, including recommendations related to tax issues, to prospective investors relating to transactions in the respective investment funds. Where relevant, prospective investors should seek advice from qualified third parties before they take an investment decision.
The information provided in the document is presented by PGIM (Singapore) Pte. Ltd.), a Singapore investment manager that is registered with, and licensed by the Monetary Authority of Singapore. In Hong Kong, information is provided by PGIM (Hong Kong) Limited, a regulated entity with the Securities & Futures Commission in Hong Kong to professional investors as defined in Section 1 of Part 1 of Schedule 1 (paragraph (a) to (i) of the Securities and Futures Ordinance (Cap.571). In Australia, information is issued by PGIM (Australia) Pty Ltd (“PGIM Australia”) for the general information of its “wholesale” customers (as defined in the Corporations Act 2001). PGIM Australia is a representative of PGIM Limited, which is exempt from the requirement to hold an Australian Financial Services License under the Australian Corporations Act 2001 in respect of financial services. PGIM Limited is exempt by virtue of its regulation by the Financial Conduct Authority under the laws of the United Kingdom and the application of ASIC Class Order 03/1099. The laws of the United Kingdom differ from Australian laws.
These materials represent the views, opinions and recommendations of the authors regarding the economic conditions, asset classes, securities, issuers or financial instruments referenced herein. Distribution of this information to any person other than the person to whom it was originally delivered and to such person’s advisers is unauthorized, and any reproduction of these materials in whole or in part or the divulgence of any of the contents hereof without prior consent of PGIM Real Estate is prohibited. Certain information contained herein has been obtained from sources that PGIM Real Estate believes to be reliable as of the date presented; however, PGIM Real Estate cannot guarantee the accuracy of such information, ensure its completeness or warrant such information will not be changed. The information contained herein is current as of the date of issuance or such earlier date as referenced herein and is subject to change without notice. PGIM Real Estate has no obligation to update any or all of such information, nor do we make any express or implied warranties or representations as to its completeness or accuracy or accept responsibility for errors. These materials are not intended as an offer or solicitation with respect to the purchase or sale of any security or other financial instrument or any investment management services and should not be used as the basis for any investment decision. Past performance is no guarantee or reliable indicator of future results. No liability whatsoever is accepted for any loss whether direct, indirect or consequential that may arise from any use of the information contained in or derived from this report. PGIM Real Estate and its affiliates may make investment decisions that are inconsistent with the recommendations or views expressed herein, including for proprietary accounts of PGIM Real Estate or its affiliates.
The opinions and recommendations herein do not take into account individual client circumstances, objectives or needs and are not intended as recommendations of particular securities, financial instruments or strategies to particular clients or prospects. No determination has been made regarding the suitability of any securities, financial instruments or strategies for particular clients or prospects. For any securities or financial instruments mentioned herein, recipients of this report must make their own independent decisions.
Conflicts of Interest: Key research team staff may be participating voting members of certain PGIM Real Estate fund and/or product investment committees with respect to decisions made on underlying investments or transactions. In addition, research personnel may receive incentive compensation based on the overall performance of the organization itself and certain investment funds or products. At the date of issue, PGIM Real Estate and/or affiliates may be buying, selling or holding significant positions in real estate, including publicly traded real estate securities. PGIM Real Estate affiliates may develop and publish research that is independent of and different from the recommendations contained herein. PGIM Real Estate personnel other than the authors, such as sales, marketing and trading personnel, may provide oral or written market commentary or ideas for PGIM Real Estate’s clients or prospects or proprietary investment ideas that differ from the views expressed herein. Additional information regarding actual and potential conflicts of interest is available in Part II of PGIM’s Form ADV.
Coronavirus: Occurrences of epidemics, depending on their scale, may cause different degrees of damage to national and local economies that could affect the value of the Fund and the Fund’s underlying investments. Economic conditions may be disrupted by widespread outbreaks of infectious or contagious diseases, and such disruption may adversely affect real estate valuations, the Fund’s investments, and the Fund and its potential returns. For example, the continuing spread of COVID-19 (also known as novel coronavirus) may have an adverse effect on the value, operating results and financial condition of some or all of the Fund’s investments, as well as the ability of the Fund to source and execute target investments. The progress and outcome of the current COVID-19 outbreak remains uncertain.
These materials are for informational or educational purposes. In providing these materials, PGIM (i) is not acting as your fiduciary and is not giving advice in a fiduciary capacity and (ii) is not undertaking to provide impartial investment advice as PGIM will receive compensation for its investment management services.