investment start 10/1/2005 | investment end 12/31/2017 ...iaamadvisor.com/files/mas portfolios...
TRANSCRIPT
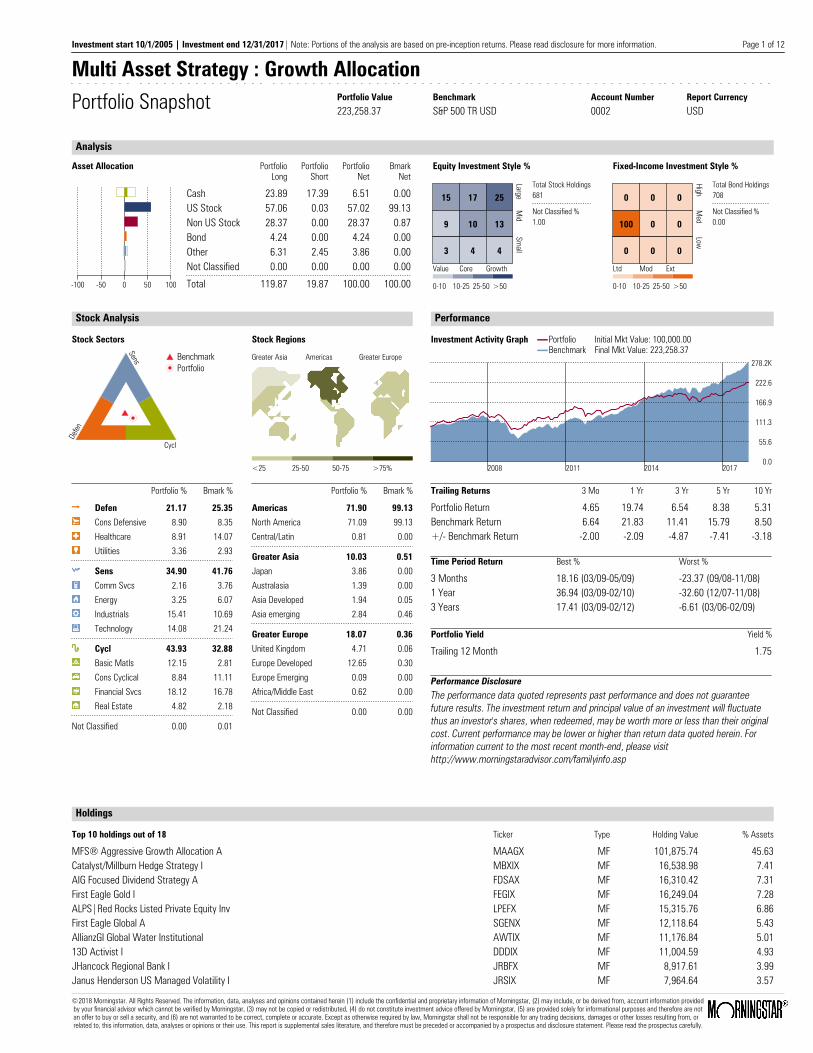
Multi Asset Strategy : Growth AllocationPortfolio Snapshot Portfolio Value Benchmark Account Number Report Currency
223,258.37 S&P 500 TR USD 0002 USD
Analysis
Asset Allocation Equity Investment Style % Fixed-Income Investment Style %
-100 -50 0 50 100
PortfolioLong
PortfolioShort
PortfolioNet
BmarkNet
Cash 23.89 17.39 6.51 0.00US Stock 57.06 0.03 57.02 99.13Non US Stock 28.37 0.00 28.37 0.87Bond 4.24 0.00 4.24 0.00Other 6.31 2.45 3.86 0.00Not Classified 0.00 0.00 0.00 0.00Total 119.87 19.87 100.00 100.00 0-10 10-25 25-50 >50
15
Value
17
Core
25
Growth
Large
9 10 13
Mid
3 4 4
Small
Total Stock Holdings681
Not Classified %1.00
0-10 10-25 25-50 >50
0
Ltd
0
Mod
0
Ext
High
100 0 0
Med
0 0 0
Low
Total Bond Holdings708
Not Classified %0.00
Stock Analysis
Stock Sectors
Defen
Sens
Cycl
BenchmarkPortfolio
Portfolio % Bmark %
Defen 21.17 25.35Cons Defensive 8.90 8.35Healthcare 8.91 14.07Utilities 3.36 2.93
Sens 34.90 41.76Comm Svcs 2.16 3.76Energy 3.25 6.07Industrials 15.41 10.69Technology 14.08 21.24
Cycl 43.93 32.88Basic Matls 12.15 2.81Cons Cyclical 8.84 11.11Financial Svcs 18.12 16.78Real Estate 4.82 2.18
Not Classified 0.00 0.01
Stock Regions
Greater Asia Americas Greater Europe
<25 25-50 50-75 >75%
Portfolio % Bmark %
Americas 71.90 99.13North America 71.09 99.13Central/Latin 0.81 0.00
Greater Asia 10.03 0.51Japan 3.86 0.00Australasia 1.39 0.00Asia Developed 1.94 0.05Asia emerging 2.84 0.46
Greater Europe 18.07 0.36United Kingdom 4.71 0.06Europe Developed 12.65 0.30Europe Emerging 0.09 0.00Africa/Middle East 0.62 0.00
Not Classified 0.00 0.00
Performance
Investment Activity Graph PortfolioBenchmark
Initial Mkt Value: 100,000.00Final Mkt Value: 223,258.37
0.0
55.6
111.3
166.9
222.6
278.2K
2017201420112008
Trailing Returns 3 Mo 1 Yr 3 Yr 5 Yr 10 Yr
Portfolio Return 4.65 19.74 6.54 8.38 5.31Benchmark Return 6.64 21.83 11.41 15.79 8.50+/- Benchmark Return -2.00 -2.09 -4.87 -7.41 -3.18
Time Period Return Best % Worst %
3 Months 18.16 (03/09-05/09) -23.37 (09/08-11/08)1 Year 36.94 (03/09-02/10) -32.60 (12/07-11/08)3 Years 17.41 (03/09-02/12) -6.61 (03/06-02/09)
Portfolio Yield Yield %
Trailing 12 Month 1.75
Performance DisclosureThe performance data quoted represents past performance and does not guaranteefuture results. The investment return and principal value of an investment will fluctuatethus an investor's shares, when redeemed, may be worth more or less than their originalcost. Current performance may be lower or higher than return data quoted herein. Forinformation current to the most recent month-end, please visithttp://www.morningstaradvisor.com/familyinfo.asp
Holdings
Top 10 holdings out of 18 Ticker Type Holding Value % Assets
MFS® Aggressive Growth Allocation A MAAGX MF 101,875.74 45.63Catalyst/Millburn Hedge Strategy I MBXIX MF 16,538.98 7.41AIG Focused Dividend Strategy A FDSAX MF 16,310.42 7.31First Eagle Gold I FEGIX MF 16,249.04 7.28ALPS|Red Rocks Listed Private Equity Inv LPEFX MF 15,315.76 6.86First Eagle Global A SGENX MF 12,118.64 5.43AllianzGI Global Water Institutional AWTIX MF 11,176.84 5.0113D Activist I DDDIX MF 11,004.59 4.93JHancock Regional Bank I JRBFX MF 8,917.61 3.99Janus Henderson US Managed Volatility I JRSIX MF 7,964.64 3.57
Investment start 10/1/2005 | Investment end 12/31/2017| Note: Portions of the analysis are based on pre-inception returns. Please read disclosure for more information. Page 1 of 12
2018 Morningstar. All Rights Reserved. The information, data, analyses and opinions contained herein (1) include the confidential and proprietary information of Morningstar, (2) may include, or be derived from, account information provided by your financial advisor which cannot be verified by Morningstar, (3) may not be copied or redistributed, (4) do not constitute investment advice offered by Morningstar, (5) are provided solely for informational purposes and therefore are not an offer to buy or sell a security, and (6) are not warranted to be correct, complete or accurate. Except as otherwise required by law, Morningstar shall not be responsible for any trading decisions, damages or other losses resulting from, or related to, this information, data, analyses or opinions or their use. This report is supplemental sales literature, and therefore must be preceded or accompanied by a prospectus and disclosure statement. Please read the prospectus carefully.
©

Multi Asset Strategy : Growth AllocationPortfolio Snapshot Portfolio Value Benchmark Account Number Report Currency
223,258.37 S&P 500 TR USD 0002 USD
Risk Analysis
Risk/Reward Scatterplot Portfolio Holding B-mark 3-Year Mean
3-Year Standard Deviation
-4.0 -1.0 2.0 5.0 8.0 11.0 14.0 17.0 20.0 23.0 26.0 29.0 32.0 35.0 38.0-2.000.202.404.606.809.00
11.2013.4015.6017.8020.00
Performance History Graph Portfolio Quarterly Return +/- Benchmark in %
2006 2007 2008 2009 2010 2011 2012 2013 2014 2015 2016 2017-12.0
-9.0
-6.0
-3.0
B-mark
3.0
6.0
9.0
12.0
Risk and Return Statistics 3 Yr 5 Yr 10 YrPortfolio B-mark Portfolio B-mark Portfolio B-mark
Standard DeviationMeanSharpe Ratio
8.746.540.72
8.228.380.99
12.275.310.46
10.0711.411.08
9.4915.791.57
15.088.500.60
MPT Statistics 3 Yr 5 Yr 10 Yr
AlphaBetaR-squared
-2.560.81
87.49
-3.870.80
86.58
-0.690.70
74.01
Fundamental Analysis
Market Maturity Geometric Avg Capitalization (Mil) Valuation Multiples Credit QualityPortfolio B-mark % of Bonds
% of StocksPortfolioB-markDeveloped MarketsEmerging MarketsNot Available
95.654.350.00
99.540.460.00
PortfolioBenchmark
19,739.1396,409.57
Price/EarningsPrice/BookPrice/SalesPrice/Cash Flow
21.452.561.99
13.36
22.873.182.25
14.29
Type Weightings
% of Stocks B-markPortfolio
High Yield 2.56 3.29Distressed 1.79 1.50Hard Asset 7.73 7.10Cyclical 46.42 42.69Slow Growth 15.89 20.17Classic Growth 7.79 11.13Aggressive Growth 8.38 9.52Speculative Growth 2.52 1.04
Not Available 6.92 3.56 % 0 5 10 15 20 25 30 35 40 45 50
Profitability
Portfolio B-mark% of Stocks2015 2016 2016
Net MarginROEROADebt/Capital
12.5115.585.82
38.29
12.1615.794.90
40.19
13.0021.007.00
43.00
AAAAAABBBBBBBelow BNR/NA
14.868.09
10.6812.280.070.530.06
53.42
Interest Rate Risk Portfolio
MaturityDuration (total portfolio)Avg Credit Quality
2.610.93BBBFund Statistics
Potential Cap Gains ExposureAvg Net Exp RatioAvg Gross Exp Ratio
28.311.211.23
Investment start 10/1/2005 | Investment end 12/31/2017| Note: Portions of the analysis are based on pre-inception returns. Please read disclosure for more information. Page 2 of 12
2018 Morningstar. All Rights Reserved. The information, data, analyses and opinions contained herein (1) include the confidential and proprietary information of Morningstar, (2) may include, or be derived from, account information provided by your financial advisor which cannot be verified by Morningstar, (3) may not be copied or redistributed, (4) do not constitute investment advice offered by Morningstar, (5) are provided solely for informational purposes and therefore are not an offer to buy or sell a security, and (6) are not warranted to be correct, complete or accurate. Except as otherwise required by law, Morningstar shall not be responsible for any trading decisions, damages or other losses resulting from, or related to, this information, data, analyses or opinions or their use. This report is supplemental sales literature, and therefore must be preceded or accompanied by a prospectus and disclosure statement. Please read the prospectus carefully.
©

Multi Asset Strategy : Growth AllocationPortfolio Snapshot Portfolio Value Benchmark Account Number Report Currency
223,258.37 S&P 500 TR USD 0002 USD
Non-Load Adjustment Returns
Total 18 holdings as of 12/31/2017 Type HoldingsDate
% ofAssets
HoldingValue
7-dayYield
1 YrRet %
3 YrRet %
5 YrRet %
10 YrRet %
Max FrontLoad %
Max BackLoad %
MFS® Aggressive Growth Allocation A MF 11/30/2017 45.63 101,875.74 0.00 22.92 9.59 11.45 6.26 5.75__
Catalyst/Millburn Hedge Strategy I MF 9/30/2017 7.41 16,538.98 0.00 13.97__ __ __ __ __
AIG Focused Dividend Strategy A MF 10/31/2017 7.31 16,310.42 0.00 20.24 11.17 15.96 11.32 5.75__
First Eagle Gold I MF 10/31/2017 7.28 16,249.04 0.00 8.44 6.41 -8.92 -1.51__ __
ALPS|Red Rocks Listed Private Equity Inv MF 9/30/2017 6.86 15,315.76 0.00 27.04 10.66 13.97 2.96__ __
First Eagle Global A MF 10/31/2017 5.43 12,118.64 0.00 13.48 7.55 8.14 6.59 5.00__
AllianzGI Global Water Institutional MF 10/31/2017 5.01 11,176.84 0.00 22.71 9.07 9.83__ __ __
13D Activist I MF 9/30/2017 4.93 11,004.59 0.00 23.78 9.65 15.76__ __ __
JHancock Regional Bank I MF 10/31/2017 3.99 8,917.61 0.00 10.86 17.28 19.27 8.93__ __
Janus Henderson US Managed Volatility I MF 9/30/2017 3.57 7,964.64 0.00 20.57 10.45 14.88 7.71__ __
DoubleLine Shiller Enhanced CAPE® I MF 11/30/2017 2.45 5,477.90 0.00 21.60 15.24__ __ __ __
Fidelity® Cash Mgmt Fds Prime Cptl Rsrvs FM 7/31/2015 0.14 307.10 0.00__ __ __ __ __ __
Fidelity® Treasury Money Market Dly Mny FM 7/31/2017 0.00 1.11 0.63 0.25 0.09 0.06 0.15__ __
Diamond Hill Long-Short A MF 11/30/2017 0.00 0.01 0.00 5.65 4.63 8.59 4.24 5.00__
Oppenheimer Gold & Special Minerals A MF 11/30/2017 0.00 0.01 0.00 17.19 10.24 -9.97 -3.87 5.75__
MFS® Emerging Markets Debt A MF 11/30/2017 0.00 0.00 0.00 9.33 5.82 2.97 6.55 4.25__
Ivy Asset Strategy A MF 9/30/2017 0.00 -0.01 0.00 18.37 0.84 3.90 2.99 5.75__
MFS® Growth Allocation A MF 11/30/2017 0.00 -0.01 0.00 18.90 8.23 9.59 6.11 5.75__
Performance DisclosureThe performance data quoted represents past performance and does not guarantee future results. The investment return and principal value of an investment willfluctuate thus an investor's shares, when redeemed, may be worth more or less than their original cost. Current performance may be lower or higher than returndata quoted herein. For information current to the most recent month-end, please visit http://advisor.morningstar.com/familyinfo.asp.
Investment start 10/1/2005 | Investment end 12/31/2017| Note: Portions of the analysis are based on pre-inception returns. Please read disclosure for more information. Page 3 of 12
2018 Morningstar. All Rights Reserved. The information, data, analyses and opinions contained herein (1) include the confidential and proprietary information of Morningstar, (2) may include, or be derived from, account information provided by your financial advisor which cannot be verified by Morningstar, (3) may not be copied or redistributed, (4) do not constitute investment advice offered by Morningstar, (5) are provided solely for informational purposes and therefore are not an offer to buy or sell a security, and (6) are not warranted to be correct, complete or accurate. Except as otherwise required by law, Morningstar shall not be responsible for any trading decisions, damages or other losses resulting from, or related to, this information, data, analyses or opinions or their use. This report is supplemental sales literature, and therefore must be preceded or accompanied by a prospectus and disclosure statement. Please read the prospectus carefully.
©

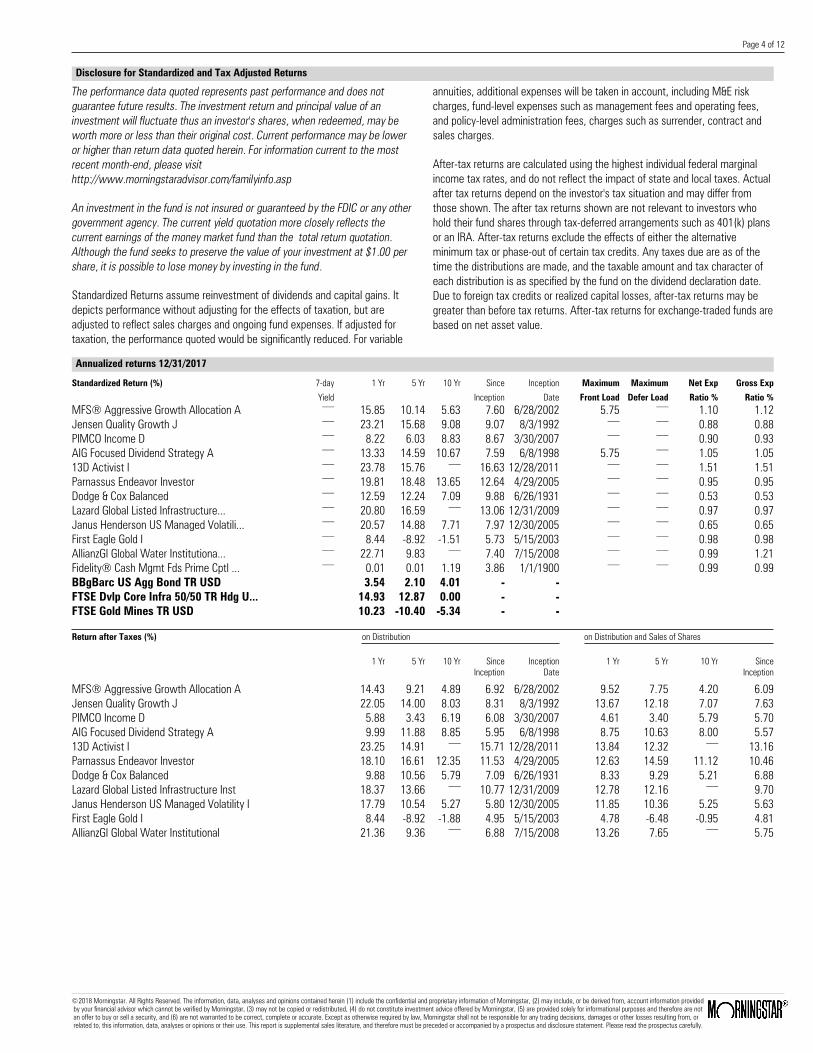
Disclosure for Standardized and Tax Adjusted Returns
The performance data quoted represents past performance and does notguarantee future results. The investment return and principal value of aninvestment will fluctuate thus an investor's shares, when redeemed, may beworth more or less than their original cost. Current performance may be loweror higher than return data quoted herein. For information current to the mostrecent month-end, please visithttp://www.morningstaradvisor.com/familyinfo.asp
An investment in the fund is not insured or guaranteed by the FDIC or any othergovernment agency. The current yield quotation more closely reflects thecurrent earnings of the money market fund than the total return quotation.Although the fund seeks to preserve the value of your investment at $1.00 pershare, it is possible to lose money by investing in the fund.
Standardized Returns assume reinvestment of dividends and capital gains. Itdepicts performance without adjusting for the effects of taxation, but areadjusted to reflect sales charges and ongoing fund expenses. If adjusted fortaxation, the performance quoted would be significantly reduced. For variable
annuities, additional expenses will be taken in account, including M&E riskcharges, fund-level expenses such as management fees and operating fees,and policy-level administration fees, charges such as surrender, contract andsales charges.
After-tax returns are calculated using the highest individual federal marginalincome tax rates, and do not reflect the impact of state and local taxes. Actualafter tax returns depend on the investor's tax situation and may differ fromthose shown. The after tax returns shown are not relevant to investors whohold their fund shares through tax-deferred arrangements such as 401(k) plansor an IRA. After-tax returns exclude the effects of either the alternativeminimum tax or phase-out of certain tax credits. Any taxes due are as of thetime the distributions are made, and the taxable amount and tax character ofeach distribution is as specified by the fund on the dividend declaration date.Due to foreign tax credits or realized capital losses, after-tax returns may begreater than before tax returns. After-tax returns for exchange-traded funds arebased on net asset value.
Annualized returns 12/31/2017
Standardized Return (%) 7-dayYield
1 Yr 5 Yr 10 Yr SinceInception
InceptionDate
MaximumFront Load
MaximumDefer Load
Net ExpRatio %
Gross ExpRatio %
MFS® Aggressive Growth Allocation A__
15.85 10.14 5.63 7.60 6/28/2002 5.75__
1.10 1.12Catalyst/Millburn Hedge Strategy I
__13.97
__ __15.49 12/29/2015
__ __2.00 2.00
AIG Focused Dividend Strategy A__
13.33 14.59 10.67 7.59 6/8/1998 5.75__
1.05 1.05First Eagle Gold I
__8.44 -8.92 -1.51 5.73 5/15/2003
__ __0.98 0.98
ALPS|Red Rocks Listed Private Equit...__
27.04 13.97 2.96 2.96 12/31/2007__ __
2.21 2.21First Eagle Global A
__7.81 7.04 6.05 11.58 4/28/1970 5.00
__1.10 1.10
AllianzGI Global Water Institutiona...__
22.71 9.83__
7.40 7/15/2008__ __
0.99 1.2113D Activist I
__23.78 15.76
__16.63 12/28/2011
__ __1.51 1.51
JHancock Regional Bank I__
10.86 19.27 8.93 31.65 9/9/2016__ __
0.96 0.96Janus Henderson US Managed Volatili...
__20.57 14.88 7.71 7.97 12/30/2005
__ __0.65 0.65
DoubleLine Shiller Enhanced CAPE® I__
21.60__ __
16.35 10/31/2013__ __
0.58 0.58Fidelity® Cash Mgmt Fds Prime Cptl ...
__0.01 0.01 1.19 3.86 1/1/1900
__ __0.99 0.99
Fidelity® Treasury Money Market Dly...__
0.25 0.06 0.15 3.49 1/1/1900__ __
0.70 0.72Diamond Hill Long-Short A
__0.37 7.48 3.70 6.36 6/30/2000 5.00
__1.40 2.07
Oppenheimer Gold & Special Minerals...__
10.45 -11.03 -4.44 5.48 7/19/1983 5.75__
1.17 1.17
Return after Taxes (%) on Distribution on Distribution and Sales of Shares
1 Yr 5 Yr 10 Yr SinceInception
InceptionDate
1 Yr 5 Yr 10 Yr SinceInception
MFS® Aggressive Growth Allocation A 14.43 9.21 4.89 6.92 6/28/2002 9.52 7.75 4.20 6.09Catalyst/Millburn Hedge Strategy I 12.79
__ __14.46 12/29/2015 8.32
__ __11.64
AIG Focused Dividend Strategy A 9.99 11.88 8.85 5.95 6/8/1998 8.75 10.63 8.00 5.57First Eagle Gold I 8.44 -8.92 -1.88 4.95 5/15/2003 4.78 -6.48 -0.95 4.81ALPS|Red Rocks Listed Private Equity Inv 21.24 11.23 0.67 0.67 12/31/2007 16.00 9.90 1.14 1.14First Eagle Global A 6.58 5.89 5.10 8.92 4/28/1970 5.09 5.24 4.59 8.63AllianzGI Global Water Institutional 21.36 9.36
__6.88 7/15/2008 13.26 7.65
__5.75
13D Activist I 23.25 14.91__
15.71 12/28/2011 13.84 12.32__
13.16JHancock Regional Bank I 10.06
__ __30.11 9/9/2016 6.41
__ __23.96
Janus Henderson US Managed Volatility I 17.79 10.54 5.27 5.80 12/30/2005 11.85 10.36 5.25 5.63DoubleLine Shiller Enhanced CAPE® I 18.47
__ __14.39 10/31/2013 13.58
__ __12.27
Diamond Hill Long-Short A -0.14 7.16 3.50 6.05 6/30/2000 0.62 5.86 2.89 5.21Oppenheimer Gold & Special Minerals A 9.06 -11.95 -5.59 4.17 7/19/1983 5.86 -8.29 -3.22 4.24Ivy Asset Strategy A 10.59 1.34 1.21 5.50 7/10/2000 6.94 1.96 1.58 5.11MFS® Growth Allocation A 10.40 7.26 4.54 6.42 6/28/2002 7.40 6.18 3.97 5.69
Page 4 of 12
2018 Morningstar. All Rights Reserved. The information, data, analyses and opinions contained herein (1) include the confidential and proprietary information of Morningstar, (2) may include, or be derived from, account information provided by your financial advisor which cannot be verified by Morningstar, (3) may not be copied or redistributed, (4) do not constitute investment advice offered by Morningstar, (5) are provided solely for informational purposes and therefore are not an offer to buy or sell a security, and (6) are not warranted to be correct, complete or accurate. Except as otherwise required by law, Morningstar shall not be responsible for any trading decisions, damages or other losses resulting from, or related to, this information, data, analyses or opinions or their use. This report is supplemental sales literature, and therefore must be preceded or accompanied by a prospectus and disclosure statement. Please read the prospectus carefully.
©

Disclosure for Standardized and Tax Adjusted Returns(continued)
The performance data quoted represents past performance and does notguarantee future results. The investment return and principal value of aninvestment will fluctuate thus an investor's shares, when redeemed, may beworth more or less than their original cost. Current performance may be loweror higher than return data quoted herein. For information current to the mostrecent month-end, please visithttp://www.morningstaradvisor.com/familyinfo.asp
An investment in the fund is not insured or guaranteed by the FDIC or any othergovernment agency. The current yield quotation more closely reflects thecurrent earnings of the money market fund than the total return quotation.Although the fund seeks to preserve the value of your investment at $1.00 pershare, it is possible to lose money by investing in the fund.
Standardized Returns assume reinvestment of dividends and capital gains. Itdepicts performance without adjusting for the effects of taxation, but areadjusted to reflect sales charges and ongoing fund expenses. If adjusted fortaxation, the performance quoted would be significantly reduced. For variable
annuities, additional expenses will be taken in account, including M&E riskcharges, fund-level expenses such as management fees and operating fees,and policy-level administration fees, charges such as surrender, contract andsales charges.
After-tax returns are calculated using the highest individual federal marginalincome tax rates, and do not reflect the impact of state and local taxes. Actualafter tax returns depend on the investor's tax situation and may differ fromthose shown. The after tax returns shown are not relevant to investors whohold their fund shares through tax-deferred arrangements such as 401(k) plansor an IRA. After-tax returns exclude the effects of either the alternativeminimum tax or phase-out of certain tax credits. Any taxes due are as of thetime the distributions are made, and the taxable amount and tax character ofeach distribution is as specified by the fund on the dividend declaration date.Due to foreign tax credits or realized capital losses, after-tax returns may begreater than before tax returns. After-tax returns for exchange-traded funds arebased on net asset value.
Annualized returns 12/31/2017
Standardized Return (%) 7-dayYield
1 Yr 5 Yr 10 Yr SinceInception
InceptionDate
MaximumFront Load
MaximumDefer Load
Net ExpRatio %
Gross ExpRatio %
Ivy Asset Strategy A__
11.56 2.67 2.39 6.81 7/10/2000 5.75__
1.12 1.12MFS® Growth Allocation A
__12.06 8.30 5.48 7.31 6/28/2002 5.75
__1.04 1.05
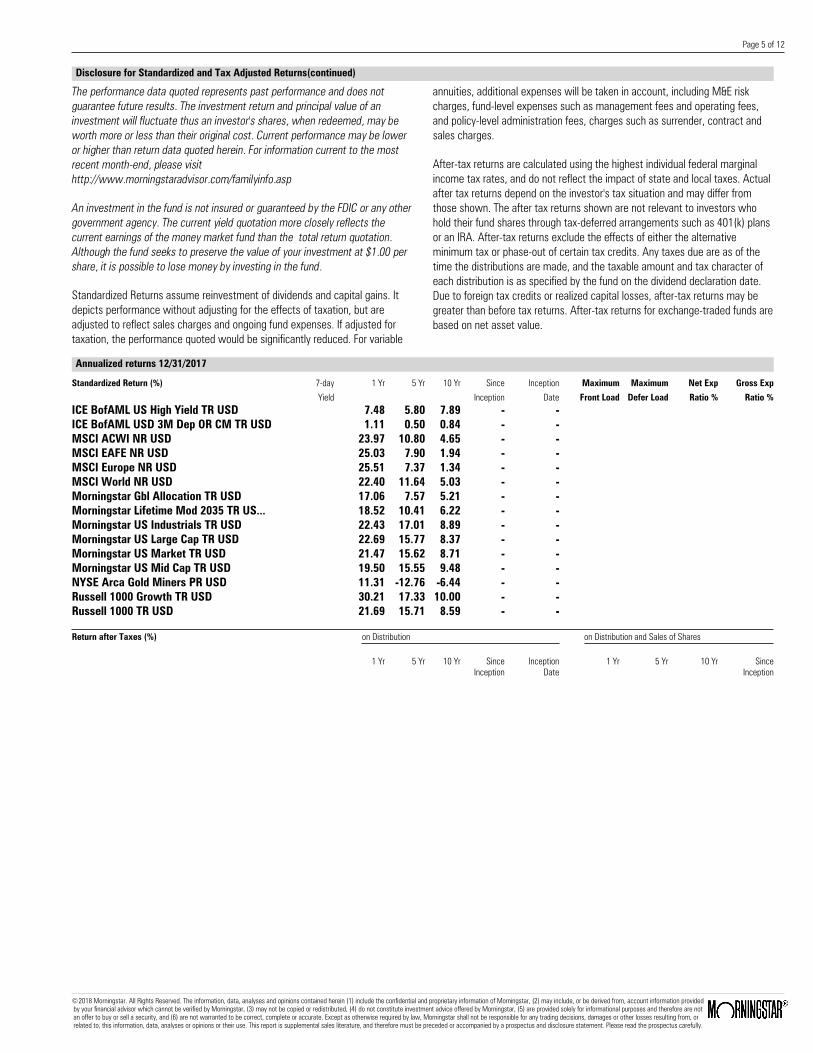
BBgBarc US Agg Bond TR USD 3.54 2.10 4.01 - -Citi EMUSDGBI Capped Brady USD 0.00 2.19 3.03 - -FTSE Gold Mines TR USD 10.23 -10.40 -5.34 - -ICE BofAML US 3M Trsy Bill TR USD 0.86 0.27 0.39 - -ICE BofAML USD 3M Dep OR CM TR USD 1.11 0.50 0.84 - -MSCI ACWI NR USD 23.97 10.80 4.65 - -MSCI EAFE NR USD 25.03 7.90 1.94 - -MSCI EASEA (EAFE ex JAPAN) NR USD 25.35 6.99 1.59 - -MSCI World NR USD 22.40 11.64 5.03 - -Morningstar Gbl Allocation TR USD 17.06 7.57 5.21 - -Morningstar Lifetime Mod 2030 TR US... 16.59 9.56 5.95 - -Morningstar Lifetime Mod 2035 TR US... 18.52 10.41 6.22 - -Morningstar Mod Tgt Risk TR USD 14.66 7.95 5.81 - -
Return after Taxes (%) on Distribution on Distribution and Sales of Shares
1 Yr 5 Yr 10 Yr SinceInception
InceptionDate
1 Yr 5 Yr 10 Yr SinceInception
Page 5 of 12
2018 Morningstar. All Rights Reserved. The information, data, analyses and opinions contained herein (1) include the confidential and proprietary information of Morningstar, (2) may include, or be derived from, account information provided by your financial advisor which cannot be verified by Morningstar, (3) may not be copied or redistributed, (4) do not constitute investment advice offered by Morningstar, (5) are provided solely for informational purposes and therefore are not an offer to buy or sell a security, and (6) are not warranted to be correct, complete or accurate. Except as otherwise required by law, Morningstar shall not be responsible for any trading decisions, damages or other losses resulting from, or related to, this information, data, analyses or opinions or their use. This report is supplemental sales literature, and therefore must be preceded or accompanied by a prospectus and disclosure statement. Please read the prospectus carefully.
©

Disclosure for Standardized and Tax Adjusted Returns(continued)
The performance data quoted represents past performance and does notguarantee future results. The investment return and principal value of aninvestment will fluctuate thus an investor's shares, when redeemed, may beworth more or less than their original cost. Current performance may be loweror higher than return data quoted herein. For information current to the mostrecent month-end, please visithttp://www.morningstaradvisor.com/familyinfo.asp
An investment in the fund is not insured or guaranteed by the FDIC or any othergovernment agency. The current yield quotation more closely reflects thecurrent earnings of the money market fund than the total return quotation.Although the fund seeks to preserve the value of your investment at $1.00 pershare, it is possible to lose money by investing in the fund.
Standardized Returns assume reinvestment of dividends and capital gains. Itdepicts performance without adjusting for the effects of taxation, but areadjusted to reflect sales charges and ongoing fund expenses. If adjusted fortaxation, the performance quoted would be significantly reduced. For variable
annuities, additional expenses will be taken in account, including M&E riskcharges, fund-level expenses such as management fees and operating fees,and policy-level administration fees, charges such as surrender, contract andsales charges.
After-tax returns are calculated using the highest individual federal marginalincome tax rates, and do not reflect the impact of state and local taxes. Actualafter tax returns depend on the investor's tax situation and may differ fromthose shown. The after tax returns shown are not relevant to investors whohold their fund shares through tax-deferred arrangements such as 401(k) plansor an IRA. After-tax returns exclude the effects of either the alternativeminimum tax or phase-out of certain tax credits. Any taxes due are as of thetime the distributions are made, and the taxable amount and tax character ofeach distribution is as specified by the fund on the dividend declaration date.Due to foreign tax credits or realized capital losses, after-tax returns may begreater than before tax returns. After-tax returns for exchange-traded funds arebased on net asset value.
Annualized returns 12/31/2017
Standardized Return (%) 7-dayYield
1 Yr 5 Yr 10 Yr SinceInception
InceptionDate
MaximumFront Load
MaximumDefer Load
Net ExpRatio %
Gross ExpRatio %
Morningstar US Industrials TR USD 22.43 17.01 8.89 - -Morningstar US Market TR USD 21.47 15.62 8.71 - -Morningstar US Mid Cap TR USD 19.50 15.55 9.48 - -NYSE Arca Gold Miners PR USD 11.31 -12.76 -6.44 - -Red Rocks Gbl Listed Private Eqty T... 25.34 13.94 3.88 - -Russell 1000 Growth TR USD 30.21 17.33 10.00 - -Russell 1000 TR USD 21.69 15.71 8.59 - -Russell 3000 Value TR USD 13.19 13.95 7.19 - -S&P 500 TR USD 21.83 15.79 8.50 - -S&P Composite 1500 Banks TR USD 19.64 19.03 4.56 - -S&P Global Water TR 27.73 12.56 6.78 - -USTREAS T-Bill Auction Ave 3 Mon 0.97 0.29 0.34 - -
Return after Taxes (%) on Distribution on Distribution and Sales of Shares
1 Yr 5 Yr 10 Yr SinceInception
InceptionDate
1 Yr 5 Yr 10 Yr SinceInception
Page 6 of 12
2018 Morningstar. All Rights Reserved. The information, data, analyses and opinions contained herein (1) include the confidential and proprietary information of Morningstar, (2) may include, or be derived from, account information provided by your financial advisor which cannot be verified by Morningstar, (3) may not be copied or redistributed, (4) do not constitute investment advice offered by Morningstar, (5) are provided solely for informational purposes and therefore are not an offer to buy or sell a security, and (6) are not warranted to be correct, complete or accurate. Except as otherwise required by law, Morningstar shall not be responsible for any trading decisions, damages or other losses resulting from, or related to, this information, data, analyses or opinions or their use. This report is supplemental sales literature, and therefore must be preceded or accompanied by a prospectus and disclosure statement. Please read the prospectus carefully.
©

Benchmark Disclosure
BBgBarc US Agg Bond TR USD : Govt/Credit Index, the Mortgage-Backed Securities Index, and the Asset-BackedSecurities Index.
Citi EMUSDGBI Capped Brady USD : The Emerging Market Sovereign Bond indexes cover US dollar-denominated externaldebt issued by sovereigns whose foreign debt is rated at or below BBB+/Baa1 byS&P/Moodys, together with Brady obligations of these issuers. In order to ensurerelevance of the securities and to maintain a high quality of information, individualissues must have at least US$500 million outstanding to be eligible. Excludesdefaulted sovereigns and limits the exposure to any one issuer by adopting a simplealgorithm to cap at US$15 billion the total par amount of any single issuer's debt in theindex.
FTSE Gold Mines TR USD :
ICE BofAML US 3M Trsy Bill TR USD :
ICE BofAML USD 3M Dep OR CM TR USD :
MSCI ACWI NR USD :
MSCI EAFE NR USD : This Europe, Australasia, and Far East index is a market-capitalization-weighted indexof 21 non-U.S., industrialized country indexes.
MSCI EASEA (EAFE ex JAPAN) NR USD : The EASEA is a 20-country index of developed nations. It resembles the MSCI EAFE inall regards except that Japan is excluded.
MSCI World NR USD : Includes all 23 MSCI developed market countries.
Morningstar Gbl Allocation TR USD :
Morningstar Lifetime Mod 2030 TR USD :
Morningstar Lifetime Mod 2035 TR USD :
Morningstar Mod Tgt Risk TR USD :
Morningstar US Industrials TR USD :
Morningstar US Market TR USD : A rule-based, float-weighted index that tracks the performance of US stock market.The Index targets 97% capitalization of the investable universe.
Page 7 of 12
2018 Morningstar. All Rights Reserved. The information, data, analyses and opinions contained herein (1) include the confidential and proprietary information of Morningstar, (2) may include, or be derived from, account information provided by your financial advisor which cannot be verified by Morningstar, (3) may not be copied or redistributed, (4) do not constitute investment advice offered by Morningstar, (5) are provided solely for informational purposes and therefore are not an offer to buy or sell a security, and (6) are not warranted to be correct, complete or accurate. Except as otherwise required by law, Morningstar shall not be responsible for any trading decisions, damages or other losses resulting from, or related to, this information, data, analyses or opinions or their use. This report is supplemental sales literature, and therefore must be preceded or accompanied by a prospectus and disclosure statement. Please read the prospectus carefully.
©

Benchmark Disclosure(continued)
Morningstar US Mid Cap TR USD : Tracks the performance of mid cap stocks--stocks that represent the next 20 percentcapitalization following the top 70 percent capitalization in the investable universe.
NYSE Arca Gold Miners PR USD :
Red Rocks Gbl Listed Private Eqty TR USD :
Russell 1000 Growth TR USD : Tracks the companies within the Russell 1000 with higher price-to-book ratios andhigher forecasted growth values.
Russell 1000 TR USD : Consists of the 1000 largest companies within the Russell 3000 index, whichrepresents approximately 98% of the investable US equity market. Also known as theMarket-Oriented Index, because it represents the group of stocks from which mostactive money managers choose.
Russell 3000 Value TR USD : Measures the performance of those Russell 3000 Index companies with lowerprice-to-book ratios and lower forecasted growth values. The stocks in this index arealso members of either the Russell 1000 Value or the Russell 2000 Value indexes.
S&P 500 TR USD : A market capitalization-weighted index of 500 widely held stocks often used as aproxy for the stock market.
S&P Composite 1500 Banks TR USD :
S&P Global Water TR :
USTREAS T-Bill Auction Ave 3 Mon : As tracked by the Wall Street Journal, this benchmark measure the yields ofbank-sponsored certificates of deposit.
Page 8 of 12
2018 Morningstar. All Rights Reserved. The information, data, analyses and opinions contained herein (1) include the confidential and proprietary information of Morningstar, (2) may include, or be derived from, account information provided by your financial advisor which cannot be verified by Morningstar, (3) may not be copied or redistributed, (4) do not constitute investment advice offered by Morningstar, (5) are provided solely for informational purposes and therefore are not an offer to buy or sell a security, and (6) are not warranted to be correct, complete or accurate. Except as otherwise required by law, Morningstar shall not be responsible for any trading decisions, damages or other losses resulting from, or related to, this information, data, analyses or opinions or their use. This report is supplemental sales literature, and therefore must be preceded or accompanied by a prospectus and disclosure statement. Please read the prospectus carefully.
©

Portfolio Snapshot ReportDisclosure Statement
GeneralInvestment portfolios illustrated in this report can be scheduled orunscheduled. With an "unscheduled" portfolio, the user inputs only theportfolio holdings and their current allocations. Morningstar calculatesreturns using the given allocations assuming monthly rebalancing. Taxes,loads, and sales charges are not taken into account.
With "scheduled" portfolios, users input the date and amount for allinvestments into and withdrawals from each holding, as well as tax rates,loads, and other factors that would have affected portfolio performance.A hypothetical illustration is one type of scheduled portfolio.
Both scheduled and unscheduled portfolios are theoretical, for illustrativepurposes only, and are not reflective of an investor's actual experience.For both scheduled and unscheduled portfolios, the performance data givenrepresents past performance and should not be considered indicative of futureresults. Principal value and investment return of stocks, mutual funds, andvariable annuity/life products will fluctuate, and an investor's shares/unitswhen redeemed will be worth more or less than the original investment.Stocks, mutual funds, and variable annuity/life products are not FDIC-insured,may lose value, and are not guaranteed by a bank or other financial institution.Portfolio statistics change over time.
Used as supplemental sales literature, the Portfolio Snapshot report must bepreceded or accompanied by the fund/policy's current prospectus or equivalent.In all cases, this disclosure statement should accompany the Portfolio Snapshotreport. Morningstar is not itself an FINRA-member firm.
The underlying holdings of the portfolio are not federally or FDIC-insured andare not deposits or obligations of, or guaranteed by, any financial institution.Investment in securities involve investment risks including possible loss ofprincipal and fluctuation in value.
The information contained in this report is from the most recent informationavailable to Morningstar as of the release date, and may or may not be anaccurate reflection of the current composition of the securities included inthe portfolio. There is no assurance that the weightings, composition andratios will remain the same.
Items to Note Regarding Certain Underlying SecuritiesA closed-end fund is an investment company, which typically makes one publicoffering of a fixed number of shares. Thereafter, shares are traded on asecondary market such as the New York Stock Exchange. As a result, thesecondary market price may be higher or lower than the closed-end fund's netasset value (NAV). If these shares trade at a price above their NAV, they aresaid to be trading at a premium. Conversely, if they are trading at a pricebelow their NAV, they are said to be trading at a discount.
An exchange-traded fund (ETF) is an investment company that typically has aninvestment objective of striving to achieve a similar return as a particularmarket index. The ETF will invest in either all or a representative sample ofthe securities included in the index it is seeking to imitate. Like closed-endfunds, ETFs can be traded on a secondary market and thus have a market price thatmay be higher or lower than its net asset value. If these shares trade at a price
above their NAV, they are said to be trading at a premium. Conversely, if theyare trading at a price below their NAV, they are said to be trading at a discount.
A money market fund is an investment company that invests in commercial paper,banker's acceptances, repurchase agreements, government securities, certificatesof deposit and other highly liquid securities, and pays money market rates ofinterest. Money markets are not FDIC-insured, may lose money, and are notguaranteed by a bank or other financial institution. Although the money marketseeks to preserve a stable per share value (i.e. $1.00 per share), it is possibleto lose money by investment in the fund.
Unit investment trust (UIT) is an investment company organized under a trustagreement between a sponsor and trustee. UITs typically purchase a fixed portfolioof securities and then sell units in the trust to investors. The major differencebetween a UIT and a mutual fund is that a mutual fund is actively managed, whilea UIT is not. On a periodic basis, UITs usually distribute to the unit holder theirpro rata share of the trust's net investment income and net realized capital gains,if any. If the trust is one that invests only in tax-free securities, then theincome from the trust is also tax-free. UITs generally make one public offeringof a fixed number of units. However, in some cases, the sponsor will maintain asecondary market that allows existing unit holders to sell their units and for newinvestors to buy units.
Variable annuities are tax-deferred investments structured to convert a sum ofmoney into a series of payments over time. Variable annuity policies havelimitations and are not viewed as short-term liquid investments. An insurancecompany's fulfillment of a commitment to pay a minimum death benefit, a scheduleof payments, a fixed investment account guaranteed by the insurance company, oranother form of guarantee depends on the claims-paying ability of the issuinginsurance company. Any such guarantee does not affect or apply to the investmentreturn or principal value of the separate account and its subaccount. The financialratings quoted for an insurance company do not apply to the separate account andits subaccount. If the variable annuity subaccount is invested in a money-marketfund, although it seeks to preserve a stable per share value (i.e. $1.00 per share),it is possible to lose money by investment in the fund.
Variable life insurance is a cash-value life insurance that has a variable cashvalue and/or death benefit depending on the investment performance of thesubaccount into which premium payments are invested. Unlike traditional lifeinsurance, variable life insurance has inherent risks associated with it, includingmarket volatility, and is not viewed as a short-term liquid investment. For moreinformation on a variable life product, including each subaccount, please read thecurrent prospectus. Please note, the financial ratings noted on the report arequoted for an insurance company and do not apply to the separate account andits subaccount. If the variable life subaccount is invested in a money-market fund,although it seeks to preserve a stable per share value (i.e. $1.00 per share),it is possible to lose money by investment in the fund.
Pre-inception ReturnsThe analysis in this report may be based, in part, on adjusted historical returns forperiods prior to the fund's actual inception. These calculated returns reflect thehistorical performance of the oldest share class of the fund, adjusted to reflect thefees and expenses of this share class. These fees and expenses are referenced inthe report's list of holdings and again on the standardized returns page. Whenpre-inception data are presented in the report, the header at the top of the reportwill indicate this and the affected data elements will be displayed in italics.
While the inclusion of pre-inception data provides valuable insight into theprobable long-term behavior of newer share classes of a fund, investors should beaware that an adjusted historical return can only provide an approximation of thatbehavior. For example, the fee structures between a retail share class will varyfrom that of an institutional share class, as retail shares tend to have higheroperating expenses and sales charges. These adjusted historical returns are notactual returns. Calculation methodologies utilized by Morningstar may differ fromthose applied by other entities, including the fund itself.
Page 9 of 12
2018 Morningstar. All Rights Reserved. The information, data, analyses and opinions contained herein (1) include the confidential and proprietary information of Morningstar, (2) may include, or be derived from, account information provided by your financial advisor which cannot be verified by Morningstar, (3) may not be copied or redistributed, (4) do not constitute investment advice offered by Morningstar, (5) are provided solely for informational purposes and therefore are not an offer to buy or sell a security, and (6) are not warranted to be correct, complete or accurate. Except as otherwise required by law, Morningstar shall not be responsible for any trading decisions, damages or other losses resulting from, or related to, this information, data, analyses or opinions or their use. This report is supplemental sales literature, and therefore must be preceded or accompanied by a prospectus and disclosure statement. Please read the prospectus carefully.
©

Portfolio Snapshot ReportDisclosure Statement (continued)
Scheduled Portfolio Trailing ReturnsScheduled Portfolios are customized by the user to account for loads, taxes,cash flows, and specific investment dates. Scheduled portfolios use theportfolio's investment history to calculate final market values and returns.For scheduled portfolios,both individual holding and portfolio returns areinternal-rate-of-return calculations that reflect the timing and dollar size ofall purchases and sales. For stocks and mutual funds, sales charges and taxrates are taken into account as specified by the user (except in the pre-taxreturns, which reflect the impact of sales charges but not taxes). Note that insome scheduled portfolio illustrations, dividends and capital gains distributions,if applicable, are reinvested at the end of the month in which they are madeat the month-end closing price. This can cause discrepancies betweencalculated returns and actual investor experience.
Scheduled Portfolio Returns-Based Performance DataFor scheduled portfolios, the monthly returns used to calculate alphas, betas,R-squareds, standard deviations, Sharpe ratios, and best/worst time-perioddata are internal rates of return.
Important VA Disclosure for Scheduled PortfoliosFor variable annuity products, policy level charges (other than front-end loads,if input by the advisor) are not factored into returns. When withdrawals andliquidations are made, increases in value over the purchase price are taxedat the capital gains rate that currently is in effect. This is not reflective ofthe actual tax treatment for these products, which requires the entire with-drawal to be taxed at the income tax rate. If adjusted for sales charges andthe effects of taxation, the subaccount returns would be reduced.
Scheduled Portfolio Investment Activity GraphThe historic portfolio values that are graphed are those used to track theportfolio when calculating returns.
Unscheduled Portfolio ReturnsMonthly total returns for unscheduled portfolios are calculated by applying theending period holding weightings supplied by the user to an individual holding'smonthly returns. When monthly returns are unavailable for a holding (ie. Due toit not being in existence during the historical period being reported), theremaining portfolio holdings are re-weighted to maintain consistent proportions.Inception dates are listed in the Disclosure for Standardized and Tax AdjustedReturns. Trailing returns are calculated by geometrically linking theseweighted-average monthly returns. Unscheduled portfolio returns thus assumemonthly rebalancing. Returns for individual holdings are simple time-weightedtrailing returns. Neither portfolio returns nor holding returns are adjustedfor loads or taxes, and if adjusted for, would reduce the returns stated. Thereturns stated assume the reinvestment of dividends and capital gains. Mutualfund returns include all ongoing fund expenses. VA/VL returns reflect subaccountlevel fund expenses, including M&E expenses, administration fees, and actualongoing fund level expenses.
Unscheduled Portfolio Investment Activity GraphThe historic performance data graphed is extrapolated from the ending port-folio value based on the monthly returns.
Benchmark ReturnsBenchmark returns may or may not be adjusted to reflect ongoing expensessuch as sales charges. An investment's portfolio may differ significantlyfrom the securities in the benchmark.
Returns for custom benchmarks are calculated by applying user-suppliedweightings to each benchmark's returns every month. Trailing returns arecalculated by geometrically linking these weighted-average monthly returns.Custom benchmark returns thus assume monthly rebalancing.
Standardized ReturnsFor mutual funds, standardized return is total return adjusted for sales charges,and reflects all ongoing fund expenses. Following this disclosure statement,standardized returns for each portfolio holding are shown.
For money market mutual funds, standardized return is total return adjusted forsales charges and reflects all ongoing fund expenses. Current 7-day yield moreclosely reflects the current earnings of the money market fund than the totalreturn quotation.
For VA subaccounts, standardized return is total return based on its inceptiondate within the separate account and is adjusted to reflect recurring andnon-recurring charges such as surrender fees, contract charges, maximum front-end load, maximum deferred load, maximum M&E risk charge, administrationfees, and actual ongoing fund-level expenses.
For ETFs, the standardized returns reflect performance, both at market priceand NAV price, without adjusting for the effects of taxation or brokerscommissions. These returns are adjusted to reflect all ongoing ETF expensesand assume reinvestment of dividends and capital gains. If adjusted, the effectsof taxation would reduce the performance quoted.
The charges and expenses used in the standardized returns are obtained fromthe most recent prospectus and/or shareholder report available to Morningstar.For mutual funds and VAs, all dividends and capital gains are assumed to bereinvested. For stocks, stock acquired via divestitures is assumed to beliquidated and reinvested in the original holding.
Non-Standardized ReturnsFor mutual funds, total return is not adjusted for sales charges and reflectsall ongoing fund expenses for various time periods. These returns assumereinvestment of dividends and capital gains. If adjusted for sales charges andthe effects of taxation, the mutual fund returns would be reduced. Please notethese returns can include pre-inception data and if included, this data will berepresented in italics.
For money market funds, total return is not adjusted for sales chargesand reflects all ongoing fund expenses for various time periods. These returnsassume reinvestment of dividends and capital gains. If adjusted forsales charges and the effects of taxation, the money market returns wouldbe reduced.
For VA and VL subaccounts, non-standardized returns illustrate performancethat is adjusted to reflect recurring and non-recurring charges such assurrender fees, contract charges, maximum front-end load, maximum deferredload, maximum M&E risk charge, administrative fees and underlying fund-levelexpenses for various time periods. Non-Standardized performance returnsassume reinvestment of dividends and capital gains. If adjusted for theeffects of taxation, the subaccount returns would be significantly reduced.Please note that these returns can include pre-incpetion data and if included,this data will be represented in italics.
Investment Advisory FeesThe investment(s) returns do not necessarily reflect the deduction of allinvestment advisory fees. Client investment returns will be reduced if addi-tional advisory fees are incurred such as deferred loads, redemption fees,wrap fees, or other account charges.
Page 10 of 12
2018 Morningstar. All Rights Reserved. The information, data, analyses and opinions contained herein (1) include the confidential and proprietary information of Morningstar, (2) may include, or be derived from, account information provided by your financial advisor which cannot be verified by Morningstar, (3) may not be copied or redistributed, (4) do not constitute investment advice offered by Morningstar, (5) are provided solely for informational purposes and therefore are not an offer to buy or sell a security, and (6) are not warranted to be correct, complete or accurate. Except as otherwise required by law, Morningstar shall not be responsible for any trading decisions, damages or other losses resulting from, or related to, this information, data, analyses or opinions or their use. This report is supplemental sales literature, and therefore must be preceded or accompanied by a prospectus and disclosure statement. Please read the prospectus carefully.
©

Portfolio Snapshot ReportDisclosure Statement (continued)
Investment StyleThe Morningstar Style Box combines the various funds investment strategies.For the equity style box, the vertical axis shows the market capitalization ofthe stocks owned and the horizontal axis shows investment style (value, blend,or growth). For the fixed-income style box, the vertical axis shows the averagecredit quality of the bonds owned and the horizontal axis shows interest ratesensitivity as measured by a bond's duration (short, intermediate, or long).
Risk and ReturnStandard deviation is a statistical measure of the volatility of a portfolio'sreturns around its mean.
Sharpe ratio uses a portfolio's standard deviation and total return to determinereward per unit of risk.
Alpha measures the difference between a portfolio's actual returns and itsexpected performance, given its beta and the actual returns of the benchmarkindex. Alpha is often seen as a measurement of the value added or subtractedby a portfolio's manager.
Beta is a measure of the degree of change in value one can expect in a portfoliogiven a change in value in a benchmark index. A portfolio with a beta greaterthan one is generally more volatile than its benchmark index, and a portfoliowith a beta of less than one is generally less volatile than its benchmark index.
R-squared reflects the percentage of a portfolio's movements that are explainedby movements in its benchmark index, showing the degree of correlation betweenthe portfolio and a benchmark. This figure is also helpful in assessing howlikely it is that alpha and beta are statistically significant.
Fundamental AnalysisThe below referenced data elements are a weighted average of the equityholdings in the portfolio.
The median market capitalization of a subaccount's equity portfolio gives you ameasure of the size of the companies in which the subaccount invests.
The Price/Cash Flow ratio is a weighted average of the price/cash-flow ratios ofthe stocks in a subaccount's portfolio. Price/cash-flow shows the ability of abusiness to generate cash and acts as a gauge of liquidity and solvency.
The Price/Book ratio is a weighted average of the price/book ratios of all thestocks in the underlying fund's portfolio. The P/B ratio of a company is calculatedby dividing the market price of its stock by the company's per-share book value.Stocks with negative book values are excluded from this calculation.
The Price/Earnings ratio is a weighted average of the price/earnings ratios of thestocks in the underlying fund's portfolio. The P/E ratio of a stock is calculatedby dividing the current price of the stock by its trailing 12 months' earnings pershare. In computing the average, Morningstar weights each portfolio holding bythe percentage of equity assets it represents.
The Price/Sales ratio is a weighted average of the price/sales ratios of thestocks in the underlying fund's portfolio. The P/S ratio of a stock is calculatedby dividing the current price of the stock by its trailing 12 months' revenues pershare. In computing the average, Morningstar weights each portfolio holding bythe percentage of equity assets it represents.
The return on assets (ROA) is the percentage a company earns on its assets ina given year. The calculation is net income divided by end-of-year totalassets, multiplied by 100.
The Return on Equity (ROE) is the percentage a company earns on itsshareholders' equity in a given year. The calculation is net income dividedby end-of-year net worth, multiplied by 100.
Market Maturity shows the percentage of a holding's common stocks that aredomiciled in developed and emerging markets.
The below referenced data elements listed below are a weighted average ofthe fixed income holdings in the portfolio.
The average credit quality is derived by taking the weighted average of thecredit rating for each bond in the portfolio.
Average maturity is used for holdings in the taxable fixed-income category,this is a weighted average of all the maturities of the bonds in a portfolio,computed by weighting each maturity date by the market value of the security.Credit quality breakdowns are shown for corporate-bond holdings and depictsthe quality of bonds in the underlying portfolio. The analysis reveals the percentageof fixed-income securities that fall within each credit-quality rating asassigned by Standard & Poor's or Moody's.debt). This figure is not provided for financial companies.
Debt as a percentage of capital is calculated by dividing long-term debt by totalcapitalization (the sum of common equity plus preferred equity plus long-termdebt). This figure is not provided for financial companies.
Duration is a time measure of a bond's interest-rate sensitivity.
Net Margin is a measure of profitability. It is equal to annual net incomedivided by revenues from the same period for the past five fiscal years,multiplied by 100.
Type Weightings divide the stocks in a given holding's portfolio into eighttype designations each of which defines a broad category of investmentcharacteristics. Not all stocks in a given holding's portfolio are assigneda type. These stocks are grouped under NA.
The below referenced data elements listed below are a weighted average of thetotal holdings in the portfolio.
The average expense ratio is the percentage of assets deducted each year foroperating expenses, management fees, and all other asset-based costs incurredby the fund, excluding brokerage fees. Please note for mutual funds, variableannuities/life, ETF and closed-end funds we use the gross prospectus ratio asprovided in the prospectus. For separate accounts and stocks we pull theaudited expense ratio from the annual report.
Potential capital gains exposure is the percentage of a holding's total assetsthat represent capital appreciation.
Investment RiskMarket Price Risk: The market price of ETF's traded on the secondary market issubject to the forces of supply and demand and thus independent of the ETF'sNAV. This can result in the market price trading at a premium or discount tothe NAV which will affect an investors value.
Market Risk: The market prices of ETF's can fluctuate as to the result ofseveral factors such as security-specific factors or general investorsentiment. Therefore, investors should be aware of the prospect of marketfluctuations and the impact it may have on the ETF market price.
Page 11 of 12
2018 Morningstar. All Rights Reserved. The information, data, analyses and opinions contained herein (1) include the confidential and proprietary information of Morningstar, (2) may include, or be derived from, account information provided by your financial advisor which cannot be verified by Morningstar, (3) may not be copied or redistributed, (4) do not constitute investment advice offered by Morningstar, (5) are provided solely for informational purposes and therefore are not an offer to buy or sell a security, and (6) are not warranted to be correct, complete or accurate. Except as otherwise required by law, Morningstar shall not be responsible for any trading decisions, damages or other losses resulting from, or related to, this information, data, analyses or opinions or their use. This report is supplemental sales literature, and therefore must be preceded or accompanied by a prospectus and disclosure statement. Please read the prospectus carefully.
©

Portfolio Snapshot ReportDisclosure Statement (continued)
International Emerging Market Funds/Subaccounts: The investor should notethat funds and subaccounts that invest in international securities take onspecial additional risks. These risks include, but are not limited to,currency risk, political risk, and risk associated with varying accountingstandards. Investing in emerging markets normally accentuates these risks.
Sector Funds/Subaccounts: The investor should note that funds and subacc-ounts that invest exclusively in one sector or industry involve additionalrisks. The lack of industry diversification subjects the investor to increasedindustry-specific risks.
Non-Diversified Funds/Subaccounts: The investor should note that funds orsubaccounts that invest more of their assets in a single issuer involveadditional risks, including share price fluctuations, because of the increasedconcentration of investments.
Small Cap Funds/Subaccounts: The investor should note that funds andsubaccounts that invest in stocks of small companies involve additional risks.Smaller companies typically have a higher risk of failure, and are not as wellestablished as larger blue-chip companies. Historically, smaller-companystocks have experienced a greater degree of price volatility than the overallmarket average.
Mid Cap Funds/Subaccounts: The investor should note that funds andsubaccounts that invest in companies with market capitalizations below $10billion involve additional risks. The securities of these companies may be morevolatile and less liquid than the securities of larger companies.
High-Yield Bond Funds/Subaccounts: The investor should note that funds andsubaccounts that invest in lower-rated debt securities (commonly referred toas junk bonds) involve additional risks because of the lower credit quality ofthe securities in the portfolio. The investor should be aware of the possiblehigher level of volatility and increased risk of default.
Tax-Free Municipal Bond Funds: The investor should note that the incomefrom tax-free municipal bond funds may be subject to state and local taxationand the Alternative Minimum Tax.
Page 12 of 12
2018 Morningstar. All Rights Reserved. The information, data, analyses and opinions contained herein (1) include the confidential and proprietary information of Morningstar, (2) may include, or be derived from, account information provided by your financial advisor which cannot be verified by Morningstar, (3) may not be copied or redistributed, (4) do not constitute investment advice offered by Morningstar, (5) are provided solely for informational purposes and therefore are not an offer to buy or sell a security, and (6) are not warranted to be correct, complete or accurate. Except as otherwise required by law, Morningstar shall not be responsible for any trading decisions, damages or other losses resulting from, or related to, this information, data, analyses or opinions or their use. This report is supplemental sales literature, and therefore must be preceded or accompanied by a prospectus and disclosure statement. Please read the prospectus carefully.
©
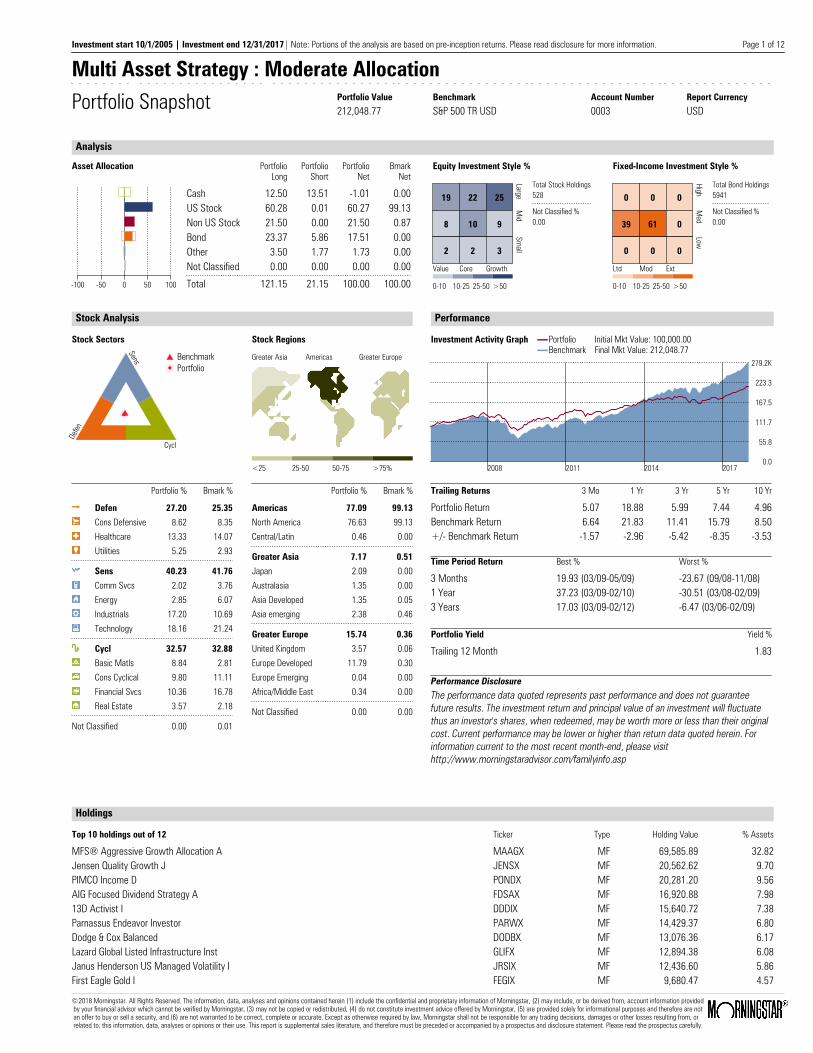
Multi Asset Strategy : Moderate AllocationPortfolio Snapshot Portfolio Value Benchmark Account Number Report Currency
212,048.77 S&P 500 TR USD 0003 USD
Analysis
Asset Allocation Equity Investment Style % Fixed-Income Investment Style %
-100 -50 0 50 100
PortfolioLong
PortfolioShort
PortfolioNet
BmarkNet
Cash 12.50 13.51 -1.01 0.00US Stock 60.28 0.01 60.27 99.13Non US Stock 21.50 0.00 21.50 0.87Bond 23.37 5.86 17.51 0.00Other 3.50 1.77 1.73 0.00Not Classified 0.00 0.00 0.00 0.00Total 121.15 21.15 100.00 100.00 0-10 10-25 25-50 >50
19
Value
22
Core
25
Growth
Large
8 10 9
Mid
2 2 3
Small
Total Stock Holdings528
Not Classified %0.00
0-10 10-25 25-50 >50
0
Ltd
0
Mod
0
Ext
High
39 61 0
Med
0 0 0
Low
Total Bond Holdings5941
Not Classified %0.00
Stock Analysis
Stock Sectors
Defen
Sens
Cycl
BenchmarkPortfolio
Portfolio % Bmark %
Defen 27.20 25.35Cons Defensive 8.62 8.35Healthcare 13.33 14.07Utilities 5.25 2.93
Sens 40.23 41.76Comm Svcs 2.02 3.76Energy 2.85 6.07Industrials 17.20 10.69Technology 18.16 21.24
Cycl 32.57 32.88Basic Matls 8.84 2.81Cons Cyclical 9.80 11.11Financial Svcs 10.36 16.78Real Estate 3.57 2.18
Not Classified 0.00 0.01
Stock Regions
Greater Asia Americas Greater Europe
<25 25-50 50-75 >75%
Portfolio % Bmark %
Americas 77.09 99.13North America 76.63 99.13Central/Latin 0.46 0.00
Greater Asia 7.17 0.51Japan 2.09 0.00Australasia 1.35 0.00Asia Developed 1.35 0.05Asia emerging 2.38 0.46
Greater Europe 15.74 0.36United Kingdom 3.57 0.06Europe Developed 11.79 0.30Europe Emerging 0.04 0.00Africa/Middle East 0.34 0.00
Not Classified 0.00 0.00
Performance
Investment Activity Graph PortfolioBenchmark
Initial Mkt Value: 100,000.00Final Mkt Value: 212,048.77
0.0
55.8
111.7
167.5
223.3
279.2K
2017201420112008
Trailing Returns 3 Mo 1 Yr 3 Yr 5 Yr 10 Yr
Portfolio Return 5.07 18.88 5.99 7.44 4.96Benchmark Return 6.64 21.83 11.41 15.79 8.50+/- Benchmark Return -1.57 -2.96 -5.42 -8.35 -3.53
Time Period Return Best % Worst %
3 Months 19.93 (03/09-05/09) -23.67 (09/08-11/08)1 Year 37.23 (03/09-02/10) -30.51 (03/08-02/09)3 Years 17.03 (03/09-02/12) -6.47 (03/06-02/09)
Portfolio Yield Yield %
Trailing 12 Month 1.83
Performance DisclosureThe performance data quoted represents past performance and does not guaranteefuture results. The investment return and principal value of an investment will fluctuatethus an investor's shares, when redeemed, may be worth more or less than their originalcost. Current performance may be lower or higher than return data quoted herein. Forinformation current to the most recent month-end, please visithttp://www.morningstaradvisor.com/familyinfo.asp
Holdings
Top 10 holdings out of 12 Ticker Type Holding Value % Assets
MFS® Aggressive Growth Allocation A MAAGX MF 69,585.89 32.82Jensen Quality Growth J JENSX MF 20,562.62 9.70PIMCO Income D PONDX MF 20,281.20 9.56AIG Focused Dividend Strategy A FDSAX MF 16,920.88 7.9813D Activist I DDDIX MF 15,640.72 7.38Parnassus Endeavor Investor PARWX MF 14,429.37 6.80Dodge & Cox Balanced DODBX MF 13,076.36 6.17Lazard Global Listed Infrastructure Inst GLIFX MF 12,894.38 6.08Janus Henderson US Managed Volatility I JRSIX MF 12,436.60 5.86First Eagle Gold I FEGIX MF 9,680.47 4.57
Investment start 10/1/2005 | Investment end 12/31/2017| Note: Portions of the analysis are based on pre-inception returns. Please read disclosure for more information. Page 1 of 12
2018 Morningstar. All Rights Reserved. The information, data, analyses and opinions contained herein (1) include the confidential and proprietary information of Morningstar, (2) may include, or be derived from, account information provided by your financial advisor which cannot be verified by Morningstar, (3) may not be copied or redistributed, (4) do not constitute investment advice offered by Morningstar, (5) are provided solely for informational purposes and therefore are not an offer to buy or sell a security, and (6) are not warranted to be correct, complete or accurate. Except as otherwise required by law, Morningstar shall not be responsible for any trading decisions, damages or other losses resulting from, or related to, this information, data, analyses or opinions or their use. This report is supplemental sales literature, and therefore must be preceded or accompanied by a prospectus and disclosure statement. Please read the prospectus carefully.
©
Multi Asset Strategy : Moderate AllocationPortfolio Snapshot Portfolio Value Benchmark Account Number Report Currency
212,048.77 S&P 500 TR USD 0003 USD
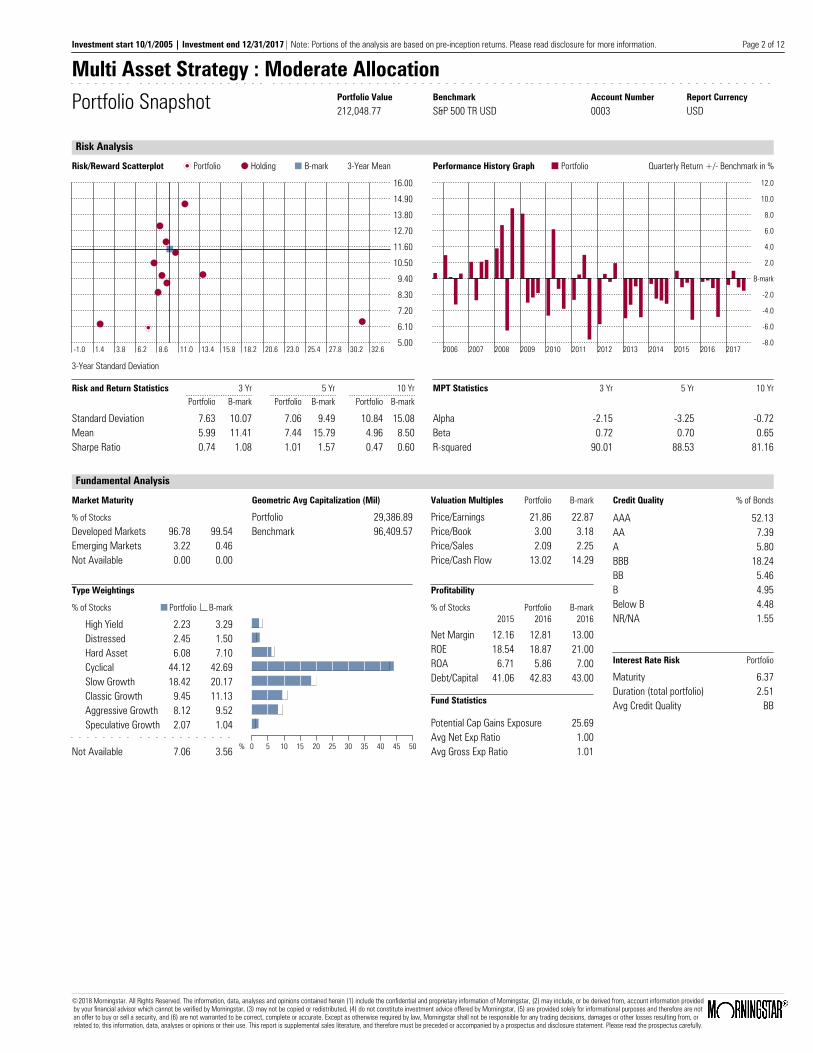
Risk Analysis
Risk/Reward Scatterplot Portfolio Holding B-mark 3-Year Mean
3-Year Standard Deviation
-1.0 1.4 3.8 6.2 8.6 11.0 13.4 15.8 18.2 20.6 23.0 25.4 27.8 30.2 32.65.006.107.208.309.40
10.5011.6012.7013.8014.9016.00
Performance History Graph Portfolio Quarterly Return +/- Benchmark in %
2006 2007 2008 2009 2010 2011 2012 2013 2014 2015 2016 2017-8.0
-6.0
-4.0
-2.0
B-mark
2.0
4.0
6.0
8.0
10.0
12.0
Risk and Return Statistics 3 Yr 5 Yr 10 YrPortfolio B-mark Portfolio B-mark Portfolio B-mark
Standard DeviationMeanSharpe Ratio
7.635.990.74
7.067.441.01
10.844.960.47
10.0711.411.08
9.4915.791.57
15.088.500.60
MPT Statistics 3 Yr 5 Yr 10 Yr
AlphaBetaR-squared
-2.150.72
90.01
-3.250.70
88.53
-0.720.65
81.16
Fundamental Analysis
Market Maturity Geometric Avg Capitalization (Mil) Valuation Multiples Credit QualityPortfolio B-mark % of Bonds
% of StocksPortfolioB-markDeveloped MarketsEmerging MarketsNot Available
96.783.220.00
99.540.460.00
PortfolioBenchmark
29,386.8996,409.57
Price/EarningsPrice/BookPrice/SalesPrice/Cash Flow
21.863.002.09
13.02
22.873.182.25
14.29
Type Weightings
% of Stocks B-markPortfolio
High Yield 2.23 3.29Distressed 2.45 1.50Hard Asset 6.08 7.10Cyclical 44.12 42.69Slow Growth 18.42 20.17Classic Growth 9.45 11.13Aggressive Growth 8.12 9.52Speculative Growth 2.07 1.04
Not Available 7.06 3.56 % 0 5 10 15 20 25 30 35 40 45 50
Profitability
Portfolio B-mark% of Stocks2015 2016 2016
Net MarginROEROADebt/Capital
12.1618.546.71
41.06
12.8118.875.86
42.83
13.0021.007.00
43.00
AAAAAABBBBBBBelow BNR/NA
52.137.395.80
18.245.464.954.481.55
Interest Rate Risk Portfolio
MaturityDuration (total portfolio)Avg Credit Quality
6.372.51
BBFund Statistics
Potential Cap Gains ExposureAvg Net Exp RatioAvg Gross Exp Ratio
25.691.001.01
Investment start 10/1/2005 | Investment end 12/31/2017| Note: Portions of the analysis are based on pre-inception returns. Please read disclosure for more information. Page 2 of 12
2018 Morningstar. All Rights Reserved. The information, data, analyses and opinions contained herein (1) include the confidential and proprietary information of Morningstar, (2) may include, or be derived from, account information provided by your financial advisor which cannot be verified by Morningstar, (3) may not be copied or redistributed, (4) do not constitute investment advice offered by Morningstar, (5) are provided solely for informational purposes and therefore are not an offer to buy or sell a security, and (6) are not warranted to be correct, complete or accurate. Except as otherwise required by law, Morningstar shall not be responsible for any trading decisions, damages or other losses resulting from, or related to, this information, data, analyses or opinions or their use. This report is supplemental sales literature, and therefore must be preceded or accompanied by a prospectus and disclosure statement. Please read the prospectus carefully.
©

Multi Asset Strategy : Moderate AllocationPortfolio Snapshot Portfolio Value Benchmark Account Number Report Currency
212,048.77 S&P 500 TR USD 0003 USD
Non-Load Adjustment Returns
Total 12 holdings as of 12/31/2017 Type HoldingsDate
% ofAssets
HoldingValue
7-dayYield
1 YrRet %
3 YrRet %
5 YrRet %
10 YrRet %
Max FrontLoad %
Max BackLoad %
MFS® Aggressive Growth Allocation A MF 11/30/2017 32.82 69,585.89 0.00 22.92 9.59 11.45 6.26 5.75__
Jensen Quality Growth J MF 9/30/2017 9.70 20,562.62 0.00 23.21 11.91 15.68 9.08__ __
PIMCO Income D MF 9/30/2017 9.56 20,281.20 0.00 8.22 6.25 6.03 8.83__ __
AIG Focused Dividend Strategy A MF 10/31/2017 7.98 16,920.88 0.00 20.24 11.17 15.96 11.32 5.75__
13D Activist I MF 9/30/2017 7.38 15,640.72 0.00 23.78 9.65 15.76__ __ __
Parnassus Endeavor Investor MF 11/30/2017 6.80 14,429.37 0.00 19.81 14.52 18.48 13.65__ __
Dodge & Cox Balanced MF 9/30/2017 6.17 13,076.36 0.00 12.59 8.43 12.24 7.09__ __
Lazard Global Listed Infrastructure Inst MF 9/30/2017 6.08 12,894.38 0.00 20.80 13.01 16.59__ __ __
Janus Henderson US Managed Volatility I MF 9/30/2017 5.86 12,436.60 0.00 20.57 10.45 14.88 7.71__ __
First Eagle Gold I MF 10/31/2017 4.57 9,680.47 0.00 8.44 6.41 -8.92 -1.51__ __
AllianzGI Global Water Institutional MF 10/31/2017 2.64 5,598.44 0.00 22.71 9.07 9.83__ __ __
Fidelity® Cash Mgmt Fds Prime Cptl Rsrvs FM 7/31/2015 0.44 941.84 0.00__ __ __ __ __ __
Performance DisclosureThe performance data quoted represents past performance and does not guarantee future results. The investment return and principal value of an investment willfluctuate thus an investor's shares, when redeemed, may be worth more or less than their original cost. Current performance may be lower or higher than returndata quoted herein. For information current to the most recent month-end, please visit http://advisor.morningstar.com/familyinfo.asp.
Investment start 10/1/2005 | Investment end 12/31/2017| Note: Portions of the analysis are based on pre-inception returns. Please read disclosure for more information. Page 3 of 12
2018 Morningstar. All Rights Reserved. The information, data, analyses and opinions contained herein (1) include the confidential and proprietary information of Morningstar, (2) may include, or be derived from, account information provided by your financial advisor which cannot be verified by Morningstar, (3) may not be copied or redistributed, (4) do not constitute investment advice offered by Morningstar, (5) are provided solely for informational purposes and therefore are not an offer to buy or sell a security, and (6) are not warranted to be correct, complete or accurate. Except as otherwise required by law, Morningstar shall not be responsible for any trading decisions, damages or other losses resulting from, or related to, this information, data, analyses or opinions or their use. This report is supplemental sales literature, and therefore must be preceded or accompanied by a prospectus and disclosure statement. Please read the prospectus carefully.
©
Disclosure for Standardized and Tax Adjusted Returns
The performance data quoted represents past performance and does notguarantee future results. The investment return and principal value of aninvestment will fluctuate thus an investor's shares, when redeemed, may beworth more or less than their original cost. Current performance may be loweror higher than return data quoted herein. For information current to the mostrecent month-end, please visithttp://www.morningstaradvisor.com/familyinfo.asp
An investment in the fund is not insured or guaranteed by the FDIC or any othergovernment agency. The current yield quotation more closely reflects thecurrent earnings of the money market fund than the total return quotation.Although the fund seeks to preserve the value of your investment at $1.00 pershare, it is possible to lose money by investing in the fund.
Standardized Returns assume reinvestment of dividends and capital gains. Itdepicts performance without adjusting for the effects of taxation, but areadjusted to reflect sales charges and ongoing fund expenses. If adjusted fortaxation, the performance quoted would be significantly reduced. For variable
annuities, additional expenses will be taken in account, including M&E riskcharges, fund-level expenses such as management fees and operating fees,and policy-level administration fees, charges such as surrender, contract andsales charges.
After-tax returns are calculated using the highest individual federal marginalincome tax rates, and do not reflect the impact of state and local taxes. Actualafter tax returns depend on the investor's tax situation and may differ fromthose shown. The after tax returns shown are not relevant to investors whohold their fund shares through tax-deferred arrangements such as 401(k) plansor an IRA. After-tax returns exclude the effects of either the alternativeminimum tax or phase-out of certain tax credits. Any taxes due are as of thetime the distributions are made, and the taxable amount and tax character ofeach distribution is as specified by the fund on the dividend declaration date.Due to foreign tax credits or realized capital losses, after-tax returns may begreater than before tax returns. After-tax returns for exchange-traded funds arebased on net asset value.
Annualized returns 12/31/2017
Standardized Return (%) 7-dayYield
1 Yr 5 Yr 10 Yr SinceInception
InceptionDate
MaximumFront Load
MaximumDefer Load
Net ExpRatio %
Gross ExpRatio %
MFS® Aggressive Growth Allocation A__
15.85 10.14 5.63 7.60 6/28/2002 5.75__
1.10 1.12Jensen Quality Growth J
__23.21 15.68 9.08 9.07 8/3/1992
__ __0.88 0.88
PIMCO Income D__
8.22 6.03 8.83 8.67 3/30/2007__ __
0.90 0.93AIG Focused Dividend Strategy A
__13.33 14.59 10.67 7.59 6/8/1998 5.75
__1.05 1.05
13D Activist I__
23.78 15.76__
16.63 12/28/2011__ __
1.51 1.51Parnassus Endeavor Investor
__19.81 18.48 13.65 12.64 4/29/2005
__ __0.95 0.95
Dodge & Cox Balanced__
12.59 12.24 7.09 9.88 6/26/1931__ __
0.53 0.53Lazard Global Listed Infrastructure...
__20.80 16.59
__13.06 12/31/2009
__ __0.97 0.97
Janus Henderson US Managed Volatili...__
20.57 14.88 7.71 7.97 12/30/2005__ __
0.65 0.65First Eagle Gold I
__8.44 -8.92 -1.51 5.73 5/15/2003
__ __0.98 0.98
AllianzGI Global Water Institutiona...__
22.71 9.83__
7.40 7/15/2008__ __
0.99 1.21Fidelity® Cash Mgmt Fds Prime Cptl ...
__0.01 0.01 1.19 3.86 1/1/1900
__ __0.99 0.99
BBgBarc US Agg Bond TR USD 3.54 2.10 4.01 - -FTSE Dvlp Core Infra 50/50 TR Hdg U... 14.93 12.87 0.00 - -FTSE Gold Mines TR USD 10.23 -10.40 -5.34 - -
Return after Taxes (%) on Distribution on Distribution and Sales of Shares
1 Yr 5 Yr 10 Yr SinceInception
InceptionDate
1 Yr 5 Yr 10 Yr SinceInception
MFS® Aggressive Growth Allocation A 14.43 9.21 4.89 6.92 6/28/2002 9.52 7.75 4.20 6.09Jensen Quality Growth J 22.05 14.00 8.03 8.31 8/3/1992 13.67 12.18 7.07 7.63PIMCO Income D 5.88 3.43 6.19 6.08 3/30/2007 4.61 3.40 5.79 5.70AIG Focused Dividend Strategy A 9.99 11.88 8.85 5.95 6/8/1998 8.75 10.63 8.00 5.5713D Activist I 23.25 14.91
__15.71 12/28/2011 13.84 12.32
__13.16
Parnassus Endeavor Investor 18.10 16.61 12.35 11.53 4/29/2005 12.63 14.59 11.12 10.46Dodge & Cox Balanced 9.88 10.56 5.79 7.09 6/26/1931 8.33 9.29 5.21 6.88Lazard Global Listed Infrastructure Inst 18.37 13.66
__10.77 12/31/2009 12.78 12.16
__9.70
Janus Henderson US Managed Volatility I 17.79 10.54 5.27 5.80 12/30/2005 11.85 10.36 5.25 5.63First Eagle Gold I 8.44 -8.92 -1.88 4.95 5/15/2003 4.78 -6.48 -0.95 4.81AllianzGI Global Water Institutional 21.36 9.36
__6.88 7/15/2008 13.26 7.65
__5.75
Page 4 of 12
2018 Morningstar. All Rights Reserved. The information, data, analyses and opinions contained herein (1) include the confidential and proprietary information of Morningstar, (2) may include, or be derived from, account information provided by your financial advisor which cannot be verified by Morningstar, (3) may not be copied or redistributed, (4) do not constitute investment advice offered by Morningstar, (5) are provided solely for informational purposes and therefore are not an offer to buy or sell a security, and (6) are not warranted to be correct, complete or accurate. Except as otherwise required by law, Morningstar shall not be responsible for any trading decisions, damages or other losses resulting from, or related to, this information, data, analyses or opinions or their use. This report is supplemental sales literature, and therefore must be preceded or accompanied by a prospectus and disclosure statement. Please read the prospectus carefully.
©
Disclosure for Standardized and Tax Adjusted Returns(continued)
The performance data quoted represents past performance and does notguarantee future results. The investment return and principal value of aninvestment will fluctuate thus an investor's shares, when redeemed, may beworth more or less than their original cost. Current performance may be loweror higher than return data quoted herein. For information current to the mostrecent month-end, please visithttp://www.morningstaradvisor.com/familyinfo.asp
An investment in the fund is not insured or guaranteed by the FDIC or any othergovernment agency. The current yield quotation more closely reflects thecurrent earnings of the money market fund than the total return quotation.Although the fund seeks to preserve the value of your investment at $1.00 pershare, it is possible to lose money by investing in the fund.
Standardized Returns assume reinvestment of dividends and capital gains. Itdepicts performance without adjusting for the effects of taxation, but areadjusted to reflect sales charges and ongoing fund expenses. If adjusted fortaxation, the performance quoted would be significantly reduced. For variable
annuities, additional expenses will be taken in account, including M&E riskcharges, fund-level expenses such as management fees and operating fees,and policy-level administration fees, charges such as surrender, contract andsales charges.
After-tax returns are calculated using the highest individual federal marginalincome tax rates, and do not reflect the impact of state and local taxes. Actualafter tax returns depend on the investor's tax situation and may differ fromthose shown. The after tax returns shown are not relevant to investors whohold their fund shares through tax-deferred arrangements such as 401(k) plansor an IRA. After-tax returns exclude the effects of either the alternativeminimum tax or phase-out of certain tax credits. Any taxes due are as of thetime the distributions are made, and the taxable amount and tax character ofeach distribution is as specified by the fund on the dividend declaration date.Due to foreign tax credits or realized capital losses, after-tax returns may begreater than before tax returns. After-tax returns for exchange-traded funds arebased on net asset value.
Annualized returns 12/31/2017
Standardized Return (%) 7-dayYield
1 Yr 5 Yr 10 Yr SinceInception
InceptionDate
MaximumFront Load
MaximumDefer Load
Net ExpRatio %
Gross ExpRatio %
ICE BofAML US High Yield TR USD 7.48 5.80 7.89 - -ICE BofAML USD 3M Dep OR CM TR USD 1.11 0.50 0.84 - -MSCI ACWI NR USD 23.97 10.80 4.65 - -MSCI EAFE NR USD 25.03 7.90 1.94 - -MSCI Europe NR USD 25.51 7.37 1.34 - -MSCI World NR USD 22.40 11.64 5.03 - -Morningstar Gbl Allocation TR USD 17.06 7.57 5.21 - -Morningstar Lifetime Mod 2035 TR US... 18.52 10.41 6.22 - -Morningstar US Industrials TR USD 22.43 17.01 8.89 - -Morningstar US Large Cap TR USD 22.69 15.77 8.37 - -Morningstar US Market TR USD 21.47 15.62 8.71 - -Morningstar US Mid Cap TR USD 19.50 15.55 9.48 - -NYSE Arca Gold Miners PR USD 11.31 -12.76 -6.44 - -Russell 1000 Growth TR USD 30.21 17.33 10.00 - -Russell 1000 TR USD 21.69 15.71 8.59 - -
Return after Taxes (%) on Distribution on Distribution and Sales of Shares
1 Yr 5 Yr 10 Yr SinceInception
InceptionDate
1 Yr 5 Yr 10 Yr SinceInception
Page 5 of 12
2018 Morningstar. All Rights Reserved. The information, data, analyses and opinions contained herein (1) include the confidential and proprietary information of Morningstar, (2) may include, or be derived from, account information provided by your financial advisor which cannot be verified by Morningstar, (3) may not be copied or redistributed, (4) do not constitute investment advice offered by Morningstar, (5) are provided solely for informational purposes and therefore are not an offer to buy or sell a security, and (6) are not warranted to be correct, complete or accurate. Except as otherwise required by law, Morningstar shall not be responsible for any trading decisions, damages or other losses resulting from, or related to, this information, data, analyses or opinions or their use. This report is supplemental sales literature, and therefore must be preceded or accompanied by a prospectus and disclosure statement. Please read the prospectus carefully.
©

Disclosure for Standardized and Tax Adjusted Returns(continued)
The performance data quoted represents past performance and does notguarantee future results. The investment return and principal value of aninvestment will fluctuate thus an investor's shares, when redeemed, may beworth more or less than their original cost. Current performance may be loweror higher than return data quoted herein. For information current to the mostrecent month-end, please visithttp://www.morningstaradvisor.com/familyinfo.asp
An investment in the fund is not insured or guaranteed by the FDIC or any othergovernment agency. The current yield quotation more closely reflects thecurrent earnings of the money market fund than the total return quotation.Although the fund seeks to preserve the value of your investment at $1.00 pershare, it is possible to lose money by investing in the fund.
Standardized Returns assume reinvestment of dividends and capital gains. Itdepicts performance without adjusting for the effects of taxation, but areadjusted to reflect sales charges and ongoing fund expenses. If adjusted fortaxation, the performance quoted would be significantly reduced. For variable
annuities, additional expenses will be taken in account, including M&E riskcharges, fund-level expenses such as management fees and operating fees,and policy-level administration fees, charges such as surrender, contract andsales charges.
After-tax returns are calculated using the highest individual federal marginalincome tax rates, and do not reflect the impact of state and local taxes. Actualafter tax returns depend on the investor's tax situation and may differ fromthose shown. The after tax returns shown are not relevant to investors whohold their fund shares through tax-deferred arrangements such as 401(k) plansor an IRA. After-tax returns exclude the effects of either the alternativeminimum tax or phase-out of certain tax credits. Any taxes due are as of thetime the distributions are made, and the taxable amount and tax character ofeach distribution is as specified by the fund on the dividend declaration date.Due to foreign tax credits or realized capital losses, after-tax returns may begreater than before tax returns. After-tax returns for exchange-traded funds arebased on net asset value.
Annualized returns 12/31/2017
Standardized Return (%) 7-dayYield
1 Yr 5 Yr 10 Yr SinceInception
InceptionDate
MaximumFront Load
MaximumDefer Load
Net ExpRatio %
Gross ExpRatio %
Russell 3000 TR USD 21.13 15.58 8.60 - -Russell 3000 Value TR USD 13.19 13.95 7.19 - -S&P 500 TR USD 21.83 15.79 8.50 - -S&P Global Water TR 27.73 12.56 6.78 - -USTREAS T-Bill Auction Ave 3 Mon 0.97 0.29 0.34 - -
Return after Taxes (%) on Distribution on Distribution and Sales of Shares
1 Yr 5 Yr 10 Yr SinceInception
InceptionDate
1 Yr 5 Yr 10 Yr SinceInception
Page 6 of 12
2018 Morningstar. All Rights Reserved. The information, data, analyses and opinions contained herein (1) include the confidential and proprietary information of Morningstar, (2) may include, or be derived from, account information provided by your financial advisor which cannot be verified by Morningstar, (3) may not be copied or redistributed, (4) do not constitute investment advice offered by Morningstar, (5) are provided solely for informational purposes and therefore are not an offer to buy or sell a security, and (6) are not warranted to be correct, complete or accurate. Except as otherwise required by law, Morningstar shall not be responsible for any trading decisions, damages or other losses resulting from, or related to, this information, data, analyses or opinions or their use. This report is supplemental sales literature, and therefore must be preceded or accompanied by a prospectus and disclosure statement. Please read the prospectus carefully.
©

Benchmark Disclosure
BBgBarc US Agg Bond TR USD : Govt/Credit Index, the Mortgage-Backed Securities Index, and the Asset-BackedSecurities Index.
FTSE Dvlp Core Infra 50/50 TR Hdg USD :
FTSE Gold Mines TR USD :
ICE BofAML US High Yield TR USD :
ICE BofAML USD 3M Dep OR CM TR USD :
MSCI ACWI NR USD :
MSCI EAFE NR USD : This Europe, Australasia, and Far East index is a market-capitalization-weighted indexof 21 non-U.S., industrialized country indexes.
MSCI Europe NR USD : A free float-adjusted market capitalization index that is designed to measuredeveloped market equity performance in Europe. As of September 2002, the MSCIEurope Index consisted of the following 16 developed market country indices: Austria,Belgium, Denmark, Finland, France, Germany, Greece, Ireland, Italy, the Netherlands,Norway, Portugal, Spain, Sweden, Switzerland and the United Kingdom.
MSCI World NR USD : Includes all 23 MSCI developed market countries.
Morningstar Gbl Allocation TR USD :
Morningstar Lifetime Mod 2035 TR USD :
Morningstar US Industrials TR USD :
Morningstar US Large Cap TR USD : Tracks the performance of large cap stocks-stocks that represent the top 70 percentcapitalization of the investable universe.
Morningstar US Market TR USD : A rule-based, float-weighted index that tracks the performance of US stock market.The Index targets 97% capitalization of the investable universe.
Morningstar US Mid Cap TR USD : Tracks the performance of mid cap stocks--stocks that represent the next 20 percentcapitalization following the top 70 percent capitalization in the investable universe.
Page 7 of 12
2018 Morningstar. All Rights Reserved. The information, data, analyses and opinions contained herein (1) include the confidential and proprietary information of Morningstar, (2) may include, or be derived from, account information provided by your financial advisor which cannot be verified by Morningstar, (3) may not be copied or redistributed, (4) do not constitute investment advice offered by Morningstar, (5) are provided solely for informational purposes and therefore are not an offer to buy or sell a security, and (6) are not warranted to be correct, complete or accurate. Except as otherwise required by law, Morningstar shall not be responsible for any trading decisions, damages or other losses resulting from, or related to, this information, data, analyses or opinions or their use. This report is supplemental sales literature, and therefore must be preceded or accompanied by a prospectus and disclosure statement. Please read the prospectus carefully.
©

Benchmark Disclosure(continued)
NYSE Arca Gold Miners PR USD :
Russell 1000 Growth TR USD : Tracks the companies within the Russell 1000 with higher price-to-book ratios andhigher forecasted growth values.
Russell 1000 TR USD : Consists of the 1000 largest companies within the Russell 3000 index, whichrepresents approximately 98% of the investable US equity market. Also known as theMarket-Oriented Index, because it represents the group of stocks from which mostactive money managers choose.
Russell 3000 TR USD : Composed of the 3000 largest U.S. companies by market capitalization, representingapproximately 98% of the U.S. equity market.
Russell 3000 Value TR USD : Measures the performance of those Russell 3000 Index companies with lowerprice-to-book ratios and lower forecasted growth values. The stocks in this index arealso members of either the Russell 1000 Value or the Russell 2000 Value indexes.
S&P 500 TR USD : A market capitalization-weighted index of 500 widely held stocks often used as aproxy for the stock market.
S&P Global Water TR :
USTREAS T-Bill Auction Ave 3 Mon : As tracked by the Wall Street Journal, this benchmark measure the yields ofbank-sponsored certificates of deposit.
Page 8 of 12
2018 Morningstar. All Rights Reserved. The information, data, analyses and opinions contained herein (1) include the confidential and proprietary information of Morningstar, (2) may include, or be derived from, account information provided by your financial advisor which cannot be verified by Morningstar, (3) may not be copied or redistributed, (4) do not constitute investment advice offered by Morningstar, (5) are provided solely for informational purposes and therefore are not an offer to buy or sell a security, and (6) are not warranted to be correct, complete or accurate. Except as otherwise required by law, Morningstar shall not be responsible for any trading decisions, damages or other losses resulting from, or related to, this information, data, analyses or opinions or their use. This report is supplemental sales literature, and therefore must be preceded or accompanied by a prospectus and disclosure statement. Please read the prospectus carefully.
©

Portfolio Snapshot ReportDisclosure Statement
GeneralInvestment portfolios illustrated in this report can be scheduled orunscheduled. With an "unscheduled" portfolio, the user inputs only theportfolio holdings and their current allocations. Morningstar calculatesreturns using the given allocations assuming monthly rebalancing. Taxes,loads, and sales charges are not taken into account.
With "scheduled" portfolios, users input the date and amount for allinvestments into and withdrawals from each holding, as well as tax rates,loads, and other factors that would have affected portfolio performance.A hypothetical illustration is one type of scheduled portfolio.
Both scheduled and unscheduled portfolios are theoretical, for illustrativepurposes only, and are not reflective of an investor's actual experience.For both scheduled and unscheduled portfolios, the performance data givenrepresents past performance and should not be considered indicative of futureresults. Principal value and investment return of stocks, mutual funds, andvariable annuity/life products will fluctuate, and an investor's shares/unitswhen redeemed will be worth more or less than the original investment.Stocks, mutual funds, and variable annuity/life products are not FDIC-insured,may lose value, and are not guaranteed by a bank or other financial institution.Portfolio statistics change over time.
Used as supplemental sales literature, the Portfolio Snapshot report must bepreceded or accompanied by the fund/policy's current prospectus or equivalent.In all cases, this disclosure statement should accompany the Portfolio Snapshotreport. Morningstar is not itself an FINRA-member firm.
The underlying holdings of the portfolio are not federally or FDIC-insured andare not deposits or obligations of, or guaranteed by, any financial institution.Investment in securities involve investment risks including possible loss ofprincipal and fluctuation in value.
The information contained in this report is from the most recent informationavailable to Morningstar as of the release date, and may or may not be anaccurate reflection of the current composition of the securities included inthe portfolio. There is no assurance that the weightings, composition andratios will remain the same.
Items to Note Regarding Certain Underlying SecuritiesA closed-end fund is an investment company, which typically makes one publicoffering of a fixed number of shares. Thereafter, shares are traded on asecondary market such as the New York Stock Exchange. As a result, thesecondary market price may be higher or lower than the closed-end fund's netasset value (NAV). If these shares trade at a price above their NAV, they aresaid to be trading at a premium. Conversely, if they are trading at a pricebelow their NAV, they are said to be trading at a discount.
An exchange-traded fund (ETF) is an investment company that typically has aninvestment objective of striving to achieve a similar return as a particularmarket index. The ETF will invest in either all or a representative sample ofthe securities included in the index it is seeking to imitate. Like closed-endfunds, ETFs can be traded on a secondary market and thus have a market price thatmay be higher or lower than its net asset value. If these shares trade at a price
above their NAV, they are said to be trading at a premium. Conversely, if theyare trading at a price below their NAV, they are said to be trading at a discount.
A money market fund is an investment company that invests in commercial paper,banker's acceptances, repurchase agreements, government securities, certificatesof deposit and other highly liquid securities, and pays money market rates ofinterest. Money markets are not FDIC-insured, may lose money, and are notguaranteed by a bank or other financial institution. Although the money marketseeks to preserve a stable per share value (i.e. $1.00 per share), it is possibleto lose money by investment in the fund.
Unit investment trust (UIT) is an investment company organized under a trustagreement between a sponsor and trustee. UITs typically purchase a fixed portfolioof securities and then sell units in the trust to investors. The major differencebetween a UIT and a mutual fund is that a mutual fund is actively managed, whilea UIT is not. On a periodic basis, UITs usually distribute to the unit holder theirpro rata share of the trust's net investment income and net realized capital gains,if any. If the trust is one that invests only in tax-free securities, then theincome from the trust is also tax-free. UITs generally make one public offeringof a fixed number of units. However, in some cases, the sponsor will maintain asecondary market that allows existing unit holders to sell their units and for newinvestors to buy units.
Variable annuities are tax-deferred investments structured to convert a sum ofmoney into a series of payments over time. Variable annuity policies havelimitations and are not viewed as short-term liquid investments. An insurancecompany's fulfillment of a commitment to pay a minimum death benefit, a scheduleof payments, a fixed investment account guaranteed by the insurance company, oranother form of guarantee depends on the claims-paying ability of the issuinginsurance company. Any such guarantee does not affect or apply to the investmentreturn or principal value of the separate account and its subaccount. The financialratings quoted for an insurance company do not apply to the separate account andits subaccount. If the variable annuity subaccount is invested in a money-marketfund, although it seeks to preserve a stable per share value (i.e. $1.00 per share),it is possible to lose money by investment in the fund.
Variable life insurance is a cash-value life insurance that has a variable cashvalue and/or death benefit depending on the investment performance of thesubaccount into which premium payments are invested. Unlike traditional lifeinsurance, variable life insurance has inherent risks associated with it, includingmarket volatility, and is not viewed as a short-term liquid investment. For moreinformation on a variable life product, including each subaccount, please read thecurrent prospectus. Please note, the financial ratings noted on the report arequoted for an insurance company and do not apply to the separate account andits subaccount. If the variable life subaccount is invested in a money-market fund,although it seeks to preserve a stable per share value (i.e. $1.00 per share),it is possible to lose money by investment in the fund.
Pre-inception ReturnsThe analysis in this report may be based, in part, on adjusted historical returns forperiods prior to the fund's actual inception. These calculated returns reflect thehistorical performance of the oldest share class of the fund, adjusted to reflect thefees and expenses of this share class. These fees and expenses are referenced inthe report's list of holdings and again on the standardized returns page. Whenpre-inception data are presented in the report, the header at the top of the reportwill indicate this and the affected data elements will be displayed in italics.
While the inclusion of pre-inception data provides valuable insight into theprobable long-term behavior of newer share classes of a fund, investors should beaware that an adjusted historical return can only provide an approximation of thatbehavior. For example, the fee structures between a retail share class will varyfrom that of an institutional share class, as retail shares tend to have higheroperating expenses and sales charges. These adjusted historical returns are notactual returns. Calculation methodologies utilized by Morningstar may differ fromthose applied by other entities, including the fund itself.
Page 9 of 12
2018 Morningstar. All Rights Reserved. The information, data, analyses and opinions contained herein (1) include the confidential and proprietary information of Morningstar, (2) may include, or be derived from, account information provided by your financial advisor which cannot be verified by Morningstar, (3) may not be copied or redistributed, (4) do not constitute investment advice offered by Morningstar, (5) are provided solely for informational purposes and therefore are not an offer to buy or sell a security, and (6) are not warranted to be correct, complete or accurate. Except as otherwise required by law, Morningstar shall not be responsible for any trading decisions, damages or other losses resulting from, or related to, this information, data, analyses or opinions or their use. This report is supplemental sales literature, and therefore must be preceded or accompanied by a prospectus and disclosure statement. Please read the prospectus carefully.
©

Portfolio Snapshot ReportDisclosure Statement (continued)
Scheduled Portfolio Trailing ReturnsScheduled Portfolios are customized by the user to account for loads, taxes,cash flows, and specific investment dates. Scheduled portfolios use theportfolio's investment history to calculate final market values and returns.For scheduled portfolios,both individual holding and portfolio returns areinternal-rate-of-return calculations that reflect the timing and dollar size ofall purchases and sales. For stocks and mutual funds, sales charges and taxrates are taken into account as specified by the user (except in the pre-taxreturns, which reflect the impact of sales charges but not taxes). Note that insome scheduled portfolio illustrations, dividends and capital gains distributions,if applicable, are reinvested at the end of the month in which they are madeat the month-end closing price. This can cause discrepancies betweencalculated returns and actual investor experience.
Scheduled Portfolio Returns-Based Performance DataFor scheduled portfolios, the monthly returns used to calculate alphas, betas,R-squareds, standard deviations, Sharpe ratios, and best/worst time-perioddata are internal rates of return.
Important VA Disclosure for Scheduled PortfoliosFor variable annuity products, policy level charges (other than front-end loads,if input by the advisor) are not factored into returns. When withdrawals andliquidations are made, increases in value over the purchase price are taxedat the capital gains rate that currently is in effect. This is not reflective ofthe actual tax treatment for these products, which requires the entire with-drawal to be taxed at the income tax rate. If adjusted for sales charges andthe effects of taxation, the subaccount returns would be reduced.
Scheduled Portfolio Investment Activity GraphThe historic portfolio values that are graphed are those used to track theportfolio when calculating returns.
Unscheduled Portfolio ReturnsMonthly total returns for unscheduled portfolios are calculated by applying theending period holding weightings supplied by the user to an individual holding'smonthly returns. When monthly returns are unavailable for a holding (ie. Due toit not being in existence during the historical period being reported), theremaining portfolio holdings are re-weighted to maintain consistent proportions.Inception dates are listed in the Disclosure for Standardized and Tax AdjustedReturns. Trailing returns are calculated by geometrically linking theseweighted-average monthly returns. Unscheduled portfolio returns thus assumemonthly rebalancing. Returns for individual holdings are simple time-weightedtrailing returns. Neither portfolio returns nor holding returns are adjustedfor loads or taxes, and if adjusted for, would reduce the returns stated. Thereturns stated assume the reinvestment of dividends and capital gains. Mutualfund returns include all ongoing fund expenses. VA/VL returns reflect subaccountlevel fund expenses, including M&E expenses, administration fees, and actualongoing fund level expenses.
Unscheduled Portfolio Investment Activity GraphThe historic performance data graphed is extrapolated from the ending port-folio value based on the monthly returns.
Benchmark ReturnsBenchmark returns may or may not be adjusted to reflect ongoing expensessuch as sales charges. An investment's portfolio may differ significantlyfrom the securities in the benchmark.
Returns for custom benchmarks are calculated by applying user-suppliedweightings to each benchmark's returns every month. Trailing returns arecalculated by geometrically linking these weighted-average monthly returns.Custom benchmark returns thus assume monthly rebalancing.
Standardized ReturnsFor mutual funds, standardized return is total return adjusted for sales charges,and reflects all ongoing fund expenses. Following this disclosure statement,standardized returns for each portfolio holding are shown.
For money market mutual funds, standardized return is total return adjusted forsales charges and reflects all ongoing fund expenses. Current 7-day yield moreclosely reflects the current earnings of the money market fund than the totalreturn quotation.
For VA subaccounts, standardized return is total return based on its inceptiondate within the separate account and is adjusted to reflect recurring andnon-recurring charges such as surrender fees, contract charges, maximum front-end load, maximum deferred load, maximum M&E risk charge, administrationfees, and actual ongoing fund-level expenses.
For ETFs, the standardized returns reflect performance, both at market priceand NAV price, without adjusting for the effects of taxation or brokerscommissions. These returns are adjusted to reflect all ongoing ETF expensesand assume reinvestment of dividends and capital gains. If adjusted, the effectsof taxation would reduce the performance quoted.
The charges and expenses used in the standardized returns are obtained fromthe most recent prospectus and/or shareholder report available to Morningstar.For mutual funds and VAs, all dividends and capital gains are assumed to bereinvested. For stocks, stock acquired via divestitures is assumed to beliquidated and reinvested in the original holding.
Non-Standardized ReturnsFor mutual funds, total return is not adjusted for sales charges and reflectsall ongoing fund expenses for various time periods. These returns assumereinvestment of dividends and capital gains. If adjusted for sales charges andthe effects of taxation, the mutual fund returns would be reduced. Please notethese returns can include pre-inception data and if included, this data will berepresented in italics.
For money market funds, total return is not adjusted for sales chargesand reflects all ongoing fund expenses for various time periods. These returnsassume reinvestment of dividends and capital gains. If adjusted forsales charges and the effects of taxation, the money market returns wouldbe reduced.
For VA and VL subaccounts, non-standardized returns illustrate performancethat is adjusted to reflect recurring and non-recurring charges such assurrender fees, contract charges, maximum front-end load, maximum deferredload, maximum M&E risk charge, administrative fees and underlying fund-levelexpenses for various time periods. Non-Standardized performance returnsassume reinvestment of dividends and capital gains. If adjusted for theeffects of taxation, the subaccount returns would be significantly reduced.Please note that these returns can include pre-incpetion data and if included,this data will be represented in italics.
Investment Advisory FeesThe investment(s) returns do not necessarily reflect the deduction of allinvestment advisory fees. Client investment returns will be reduced if addi-tional advisory fees are incurred such as deferred loads, redemption fees,wrap fees, or other account charges.
Page 10 of 12
2018 Morningstar. All Rights Reserved. The information, data, analyses and opinions contained herein (1) include the confidential and proprietary information of Morningstar, (2) may include, or be derived from, account information provided by your financial advisor which cannot be verified by Morningstar, (3) may not be copied or redistributed, (4) do not constitute investment advice offered by Morningstar, (5) are provided solely for informational purposes and therefore are not an offer to buy or sell a security, and (6) are not warranted to be correct, complete or accurate. Except as otherwise required by law, Morningstar shall not be responsible for any trading decisions, damages or other losses resulting from, or related to, this information, data, analyses or opinions or their use. This report is supplemental sales literature, and therefore must be preceded or accompanied by a prospectus and disclosure statement. Please read the prospectus carefully.
©
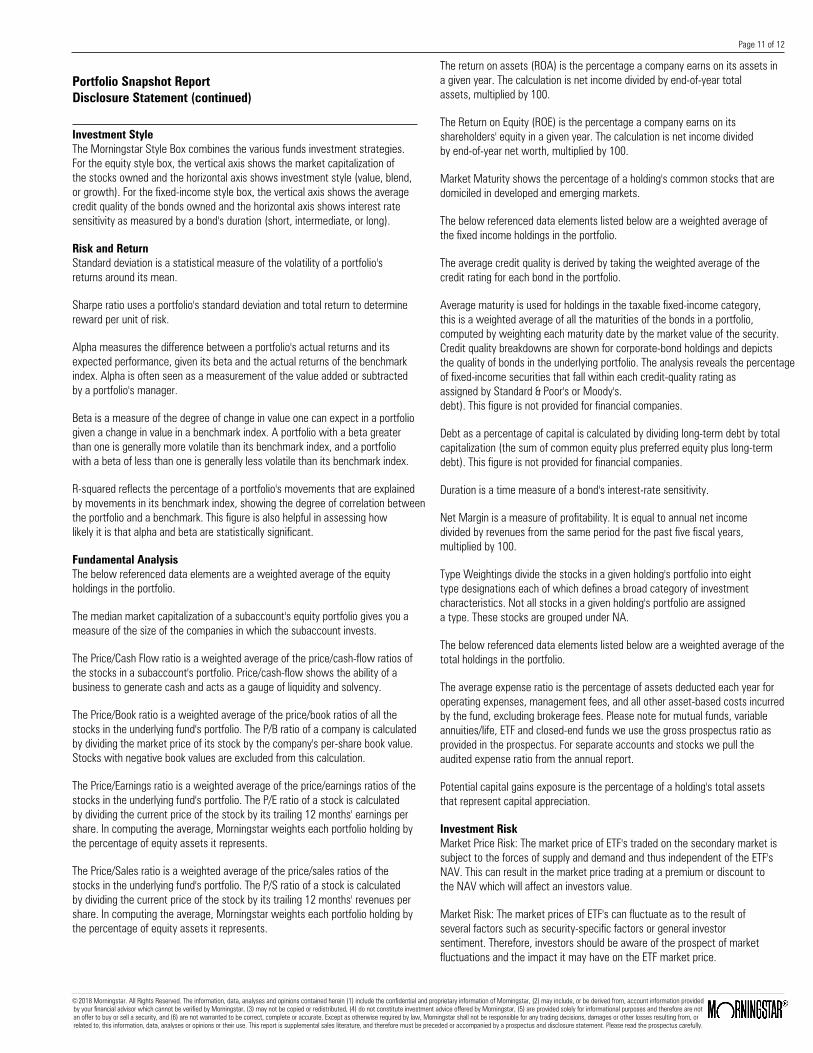
Portfolio Snapshot ReportDisclosure Statement (continued)
Investment StyleThe Morningstar Style Box combines the various funds investment strategies.For the equity style box, the vertical axis shows the market capitalization ofthe stocks owned and the horizontal axis shows investment style (value, blend,or growth). For the fixed-income style box, the vertical axis shows the averagecredit quality of the bonds owned and the horizontal axis shows interest ratesensitivity as measured by a bond's duration (short, intermediate, or long).
Risk and ReturnStandard deviation is a statistical measure of the volatility of a portfolio'sreturns around its mean.
Sharpe ratio uses a portfolio's standard deviation and total return to determinereward per unit of risk.
Alpha measures the difference between a portfolio's actual returns and itsexpected performance, given its beta and the actual returns of the benchmarkindex. Alpha is often seen as a measurement of the value added or subtractedby a portfolio's manager.
Beta is a measure of the degree of change in value one can expect in a portfoliogiven a change in value in a benchmark index. A portfolio with a beta greaterthan one is generally more volatile than its benchmark index, and a portfoliowith a beta of less than one is generally less volatile than its benchmark index.
R-squared reflects the percentage of a portfolio's movements that are explainedby movements in its benchmark index, showing the degree of correlation betweenthe portfolio and a benchmark. This figure is also helpful in assessing howlikely it is that alpha and beta are statistically significant.
Fundamental AnalysisThe below referenced data elements are a weighted average of the equityholdings in the portfolio.
The median market capitalization of a subaccount's equity portfolio gives you ameasure of the size of the companies in which the subaccount invests.
The Price/Cash Flow ratio is a weighted average of the price/cash-flow ratios ofthe stocks in a subaccount's portfolio. Price/cash-flow shows the ability of abusiness to generate cash and acts as a gauge of liquidity and solvency.
The Price/Book ratio is a weighted average of the price/book ratios of all thestocks in the underlying fund's portfolio. The P/B ratio of a company is calculatedby dividing the market price of its stock by the company's per-share book value.Stocks with negative book values are excluded from this calculation.
The Price/Earnings ratio is a weighted average of the price/earnings ratios of thestocks in the underlying fund's portfolio. The P/E ratio of a stock is calculatedby dividing the current price of the stock by its trailing 12 months' earnings pershare. In computing the average, Morningstar weights each portfolio holding bythe percentage of equity assets it represents.
The Price/Sales ratio is a weighted average of the price/sales ratios of thestocks in the underlying fund's portfolio. The P/S ratio of a stock is calculatedby dividing the current price of the stock by its trailing 12 months' revenues pershare. In computing the average, Morningstar weights each portfolio holding bythe percentage of equity assets it represents.
The return on assets (ROA) is the percentage a company earns on its assets ina given year. The calculation is net income divided by end-of-year totalassets, multiplied by 100.
The Return on Equity (ROE) is the percentage a company earns on itsshareholders' equity in a given year. The calculation is net income dividedby end-of-year net worth, multiplied by 100.
Market Maturity shows the percentage of a holding's common stocks that aredomiciled in developed and emerging markets.
The below referenced data elements listed below are a weighted average ofthe fixed income holdings in the portfolio.
The average credit quality is derived by taking the weighted average of thecredit rating for each bond in the portfolio.
Average maturity is used for holdings in the taxable fixed-income category,this is a weighted average of all the maturities of the bonds in a portfolio,computed by weighting each maturity date by the market value of the security.Credit quality breakdowns are shown for corporate-bond holdings and depictsthe quality of bonds in the underlying portfolio. The analysis reveals the percentageof fixed-income securities that fall within each credit-quality rating asassigned by Standard & Poor's or Moody's.debt). This figure is not provided for financial companies.
Debt as a percentage of capital is calculated by dividing long-term debt by totalcapitalization (the sum of common equity plus preferred equity plus long-termdebt). This figure is not provided for financial companies.
Duration is a time measure of a bond's interest-rate sensitivity.
Net Margin is a measure of profitability. It is equal to annual net incomedivided by revenues from the same period for the past five fiscal years,multiplied by 100.
Type Weightings divide the stocks in a given holding's portfolio into eighttype designations each of which defines a broad category of investmentcharacteristics. Not all stocks in a given holding's portfolio are assigneda type. These stocks are grouped under NA.
The below referenced data elements listed below are a weighted average of thetotal holdings in the portfolio.
The average expense ratio is the percentage of assets deducted each year foroperating expenses, management fees, and all other asset-based costs incurredby the fund, excluding brokerage fees. Please note for mutual funds, variableannuities/life, ETF and closed-end funds we use the gross prospectus ratio asprovided in the prospectus. For separate accounts and stocks we pull theaudited expense ratio from the annual report.
Potential capital gains exposure is the percentage of a holding's total assetsthat represent capital appreciation.
Investment RiskMarket Price Risk: The market price of ETF's traded on the secondary market issubject to the forces of supply and demand and thus independent of the ETF'sNAV. This can result in the market price trading at a premium or discount tothe NAV which will affect an investors value.
Market Risk: The market prices of ETF's can fluctuate as to the result ofseveral factors such as security-specific factors or general investorsentiment. Therefore, investors should be aware of the prospect of marketfluctuations and the impact it may have on the ETF market price.
Page 11 of 12
2018 Morningstar. All Rights Reserved. The information, data, analyses and opinions contained herein (1) include the confidential and proprietary information of Morningstar, (2) may include, or be derived from, account information provided by your financial advisor which cannot be verified by Morningstar, (3) may not be copied or redistributed, (4) do not constitute investment advice offered by Morningstar, (5) are provided solely for informational purposes and therefore are not an offer to buy or sell a security, and (6) are not warranted to be correct, complete or accurate. Except as otherwise required by law, Morningstar shall not be responsible for any trading decisions, damages or other losses resulting from, or related to, this information, data, analyses or opinions or their use. This report is supplemental sales literature, and therefore must be preceded or accompanied by a prospectus and disclosure statement. Please read the prospectus carefully.
©

Portfolio Snapshot ReportDisclosure Statement (continued)
International Emerging Market Funds/Subaccounts: The investor should notethat funds and subaccounts that invest in international securities take onspecial additional risks. These risks include, but are not limited to,currency risk, political risk, and risk associated with varying accountingstandards. Investing in emerging markets normally accentuates these risks.
Sector Funds/Subaccounts: The investor should note that funds and subacc-ounts that invest exclusively in one sector or industry involve additionalrisks. The lack of industry diversification subjects the investor to increasedindustry-specific risks.
Non-Diversified Funds/Subaccounts: The investor should note that funds orsubaccounts that invest more of their assets in a single issuer involveadditional risks, including share price fluctuations, because of the increasedconcentration of investments.
Small Cap Funds/Subaccounts: The investor should note that funds andsubaccounts that invest in stocks of small companies involve additional risks.Smaller companies typically have a higher risk of failure, and are not as wellestablished as larger blue-chip companies. Historically, smaller-companystocks have experienced a greater degree of price volatility than the overallmarket average.
Mid Cap Funds/Subaccounts: The investor should note that funds andsubaccounts that invest in companies with market capitalizations below $10billion involve additional risks. The securities of these companies may be morevolatile and less liquid than the securities of larger companies.
High-Yield Bond Funds/Subaccounts: The investor should note that funds andsubaccounts that invest in lower-rated debt securities (commonly referred toas junk bonds) involve additional risks because of the lower credit quality ofthe securities in the portfolio. The investor should be aware of the possiblehigher level of volatility and increased risk of default.
Tax-Free Municipal Bond Funds: The investor should note that the incomefrom tax-free municipal bond funds may be subject to state and local taxationand the Alternative Minimum Tax.
Page 12 of 12
2018 Morningstar. All Rights Reserved. The information, data, analyses and opinions contained herein (1) include the confidential and proprietary information of Morningstar, (2) may include, or be derived from, account information provided by your financial advisor which cannot be verified by Morningstar, (3) may not be copied or redistributed, (4) do not constitute investment advice offered by Morningstar, (5) are provided solely for informational purposes and therefore are not an offer to buy or sell a security, and (6) are not warranted to be correct, complete or accurate. Except as otherwise required by law, Morningstar shall not be responsible for any trading decisions, damages or other losses resulting from, or related to, this information, data, analyses or opinions or their use. This report is supplemental sales literature, and therefore must be preceded or accompanied by a prospectus and disclosure statement. Please read the prospectus carefully.
©
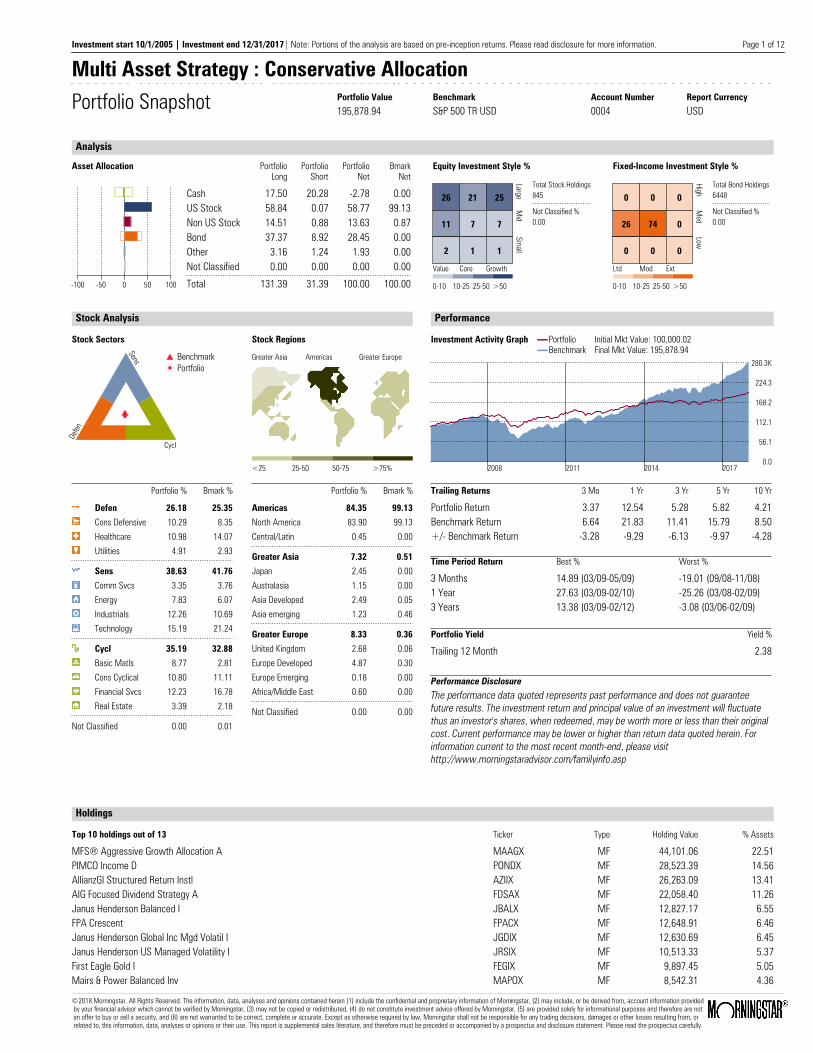
Multi Asset Strategy : Conservative AllocationPortfolio Snapshot Portfolio Value Benchmark Account Number Report Currency
195,878.94 S&P 500 TR USD 0004 USD
Analysis
Asset Allocation Equity Investment Style % Fixed-Income Investment Style %
-100 -50 0 50 100
PortfolioLong
PortfolioShort
PortfolioNet
BmarkNet
Cash 17.50 20.28 -2.78 0.00US Stock 58.84 0.07 58.77 99.13Non US Stock 14.51 0.88 13.63 0.87Bond 37.37 8.92 28.45 0.00Other 3.16 1.24 1.93 0.00Not Classified 0.00 0.00 0.00 0.00Total 131.39 31.39 100.00 100.00 0-10 10-25 25-50 >50
26
Value
21
Core
25
Growth
Large
11 7 7
Mid
2 1 1
Small
Total Stock Holdings845
Not Classified %0.00
0-10 10-25 25-50 >50
0
Ltd
0
Mod
0
Ext
High
26 74 0
Med
0 0 0
Low
Total Bond Holdings6448
Not Classified %0.00
Stock Analysis
Stock Sectors
Defen
Sens
Cycl
BenchmarkPortfolio
Portfolio % Bmark %
Defen 26.18 25.35Cons Defensive 10.29 8.35Healthcare 10.98 14.07Utilities 4.91 2.93
Sens 38.63 41.76Comm Svcs 3.35 3.76Energy 7.83 6.07Industrials 12.26 10.69Technology 15.19 21.24
Cycl 35.19 32.88Basic Matls 8.77 2.81Cons Cyclical 10.80 11.11Financial Svcs 12.23 16.78Real Estate 3.39 2.18
Not Classified 0.00 0.01
Stock Regions
Greater Asia Americas Greater Europe
<25 25-50 50-75 >75%
Portfolio % Bmark %
Americas 84.35 99.13North America 83.90 99.13Central/Latin 0.45 0.00
Greater Asia 7.32 0.51Japan 2.45 0.00Australasia 1.15 0.00Asia Developed 2.49 0.05Asia emerging 1.23 0.46
Greater Europe 8.33 0.36United Kingdom 2.68 0.06Europe Developed 4.87 0.30Europe Emerging 0.18 0.00Africa/Middle East 0.60 0.00
Not Classified 0.00 0.00
Performance
Investment Activity Graph PortfolioBenchmark
Initial Mkt Value: 100,000.02Final Mkt Value: 195,878.94
0.0
56.1
112.1
168.2
224.3
280.3K
2017201420112008
Trailing Returns 3 Mo 1 Yr 3 Yr 5 Yr 10 Yr
Portfolio Return 3.37 12.54 5.28 5.82 4.21Benchmark Return 6.64 21.83 11.41 15.79 8.50+/- Benchmark Return -3.28 -9.29 -6.13 -9.97 -4.28
Time Period Return Best % Worst %
3 Months 14.89 (03/09-05/09) -19.01 (09/08-11/08)1 Year 27.63 (03/09-02/10) -25.26 (03/08-02/09)3 Years 13.38 (03/09-02/12) -3.08 (03/06-02/09)
Portfolio Yield Yield %
Trailing 12 Month 2.38
Performance DisclosureThe performance data quoted represents past performance and does not guaranteefuture results. The investment return and principal value of an investment will fluctuatethus an investor's shares, when redeemed, may be worth more or less than their originalcost. Current performance may be lower or higher than return data quoted herein. Forinformation current to the most recent month-end, please visithttp://www.morningstaradvisor.com/familyinfo.asp
Holdings
Top 10 holdings out of 13 Ticker Type Holding Value % Assets
MFS® Aggressive Growth Allocation A MAAGX MF 44,101.06 22.51PIMCO Income D PONDX MF 28,523.39 14.56AllianzGI Structured Return Instl AZIIX MF 26,263.09 13.41AIG Focused Dividend Strategy A FDSAX MF 22,058.40 11.26Janus Henderson Balanced I JBALX MF 12,827.17 6.55FPA Crescent FPACX MF 12,648.91 6.46Janus Henderson Global Inc Mgd Volatil I JGDIX MF 12,630.69 6.45Janus Henderson US Managed Volatility I JRSIX MF 10,513.33 5.37First Eagle Gold I FEGIX MF 9,897.45 5.05Mairs & Power Balanced Inv MAPOX MF 8,542.31 4.36
Investment start 10/1/2005 | Investment end 12/31/2017| Note: Portions of the analysis are based on pre-inception returns. Please read disclosure for more information. Page 1 of 12
2018 Morningstar. All Rights Reserved. The information, data, analyses and opinions contained herein (1) include the confidential and proprietary information of Morningstar, (2) may include, or be derived from, account information provided by your financial advisor which cannot be verified by Morningstar, (3) may not be copied or redistributed, (4) do not constitute investment advice offered by Morningstar, (5) are provided solely for informational purposes and therefore are not an offer to buy or sell a security, and (6) are not warranted to be correct, complete or accurate. Except as otherwise required by law, Morningstar shall not be responsible for any trading decisions, damages or other losses resulting from, or related to, this information, data, analyses or opinions or their use. This report is supplemental sales literature, and therefore must be preceded or accompanied by a prospectus and disclosure statement. Please read the prospectus carefully.
©

Multi Asset Strategy : Conservative AllocationPortfolio Snapshot Portfolio Value Benchmark Account Number Report Currency
195,878.94 S&P 500 TR USD 0004 USD
Risk Analysis
Risk/Reward Scatterplot Portfolio Holding B-mark 3-Year Mean
3-Year Standard Deviation
-3.0 -0.5 2.1 4.6 7.1 9.7 12.2 14.7 17.3 19.8 22.3 24.9 27.4 29.9 32.5-9.00-6.70-4.40-2.100.202.504.807.109.40
11.7014.00
Performance History Graph Portfolio Quarterly Return +/- Benchmark in %
2006 2007 2008 2009 2010 2011 2012 2013 2014 2015 2016 2017-12.0
-9.0
-6.0
-3.0
B-mark
3.0
6.0
9.0
12.0
15.0
18.0
Risk and Return Statistics 3 Yr 5 Yr 10 YrPortfolio B-mark Portfolio B-mark Portfolio B-mark
Standard DeviationMeanSharpe Ratio
5.645.280.86
5.375.821.03
8.524.210.49
10.0711.411.08
9.4915.791.57
15.088.500.60
MPT Statistics 3 Yr 5 Yr 10 Yr
AlphaBetaR-squared
-1.010.54
92.99
-2.410.53
89.09
-0.360.50
79.07
Fundamental Analysis
Market Maturity Geometric Avg Capitalization (Mil) Valuation Multiples Credit QualityPortfolio B-mark % of Bonds
% of StocksPortfolioB-markDeveloped MarketsEmerging MarketsNot Available
97.552.450.00
99.540.460.00
PortfolioBenchmark
37,182.2796,409.57
Price/EarningsPrice/BookPrice/SalesPrice/Cash Flow
20.752.731.86
12.25
22.873.182.25
14.29
Type Weightings
% of Stocks B-markPortfolio
High Yield 4.95 3.29Distressed 1.40 1.50Hard Asset 10.21 7.10Cyclical 39.20 42.69Slow Growth 19.61 20.17Classic Growth 10.02 11.13Aggressive Growth 7.79 9.52Speculative Growth 1.15 1.04
Not Available 5.67 3.56 % 0 5 10 15 20 25 30 35 40 45 50
Profitability
Portfolio B-mark% of Stocks2015 2016 2016
Net MarginROEROADebt/Capital
12.8019.356.62
40.22
13.1820.526.13
43.21
13.0021.007.00
43.00
AAAAAABBBBBBBelow BNR/NA
44.748.437.04
19.596.016.764.283.14
Interest Rate Risk Portfolio
MaturityDuration (total portfolio)Avg Credit Quality
6.582.76
BBFund Statistics
Potential Cap Gains ExposureAvg Net Exp RatioAvg Gross Exp Ratio
15.410.991.05
Investment start 10/1/2005 | Investment end 12/31/2017| Note: Portions of the analysis are based on pre-inception returns. Please read disclosure for more information. Page 2 of 12
2018 Morningstar. All Rights Reserved. The information, data, analyses and opinions contained herein (1) include the confidential and proprietary information of Morningstar, (2) may include, or be derived from, account information provided by your financial advisor which cannot be verified by Morningstar, (3) may not be copied or redistributed, (4) do not constitute investment advice offered by Morningstar, (5) are provided solely for informational purposes and therefore are not an offer to buy or sell a security, and (6) are not warranted to be correct, complete or accurate. Except as otherwise required by law, Morningstar shall not be responsible for any trading decisions, damages or other losses resulting from, or related to, this information, data, analyses or opinions or their use. This report is supplemental sales literature, and therefore must be preceded or accompanied by a prospectus and disclosure statement. Please read the prospectus carefully.
©
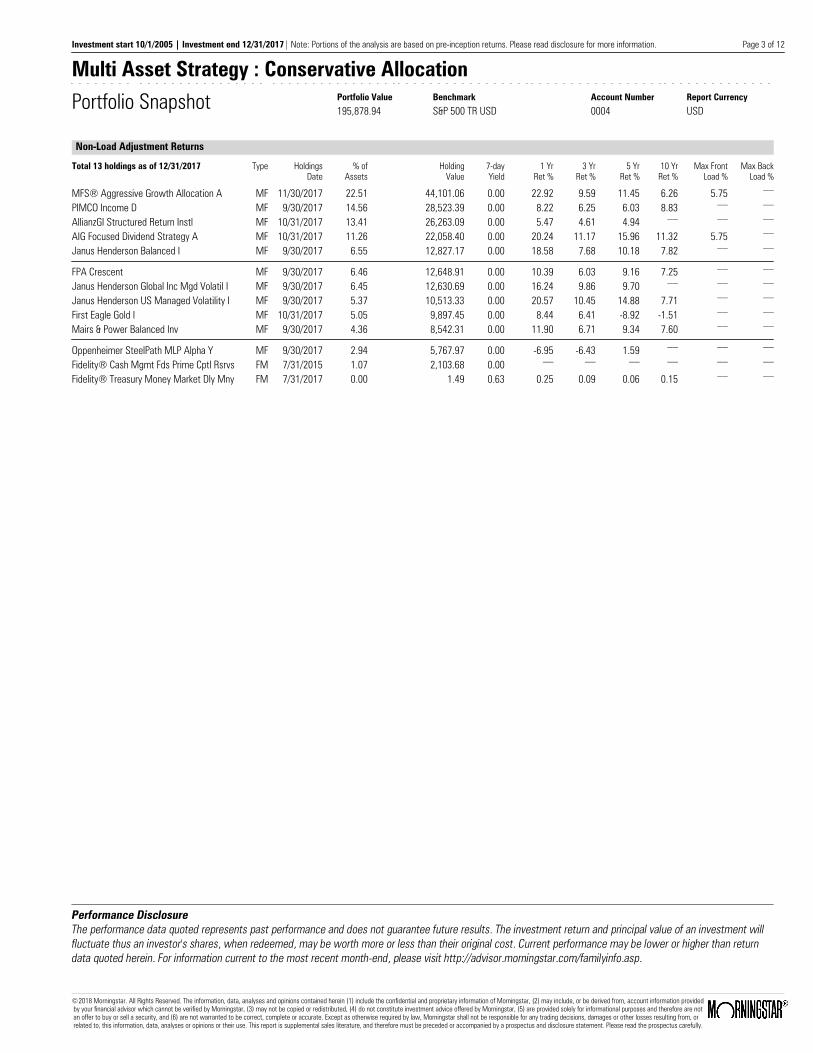
Multi Asset Strategy : Conservative AllocationPortfolio Snapshot Portfolio Value Benchmark Account Number Report Currency
195,878.94 S&P 500 TR USD 0004 USD
Non-Load Adjustment Returns
Total 13 holdings as of 12/31/2017 Type HoldingsDate
% ofAssets
HoldingValue
7-dayYield
1 YrRet %
3 YrRet %
5 YrRet %
10 YrRet %
Max FrontLoad %
Max BackLoad %
MFS® Aggressive Growth Allocation A MF 11/30/2017 22.51 44,101.06 0.00 22.92 9.59 11.45 6.26 5.75__
PIMCO Income D MF 9/30/2017 14.56 28,523.39 0.00 8.22 6.25 6.03 8.83__ __
AllianzGI Structured Return Instl MF 10/31/2017 13.41 26,263.09 0.00 5.47 4.61 4.94__ __ __
AIG Focused Dividend Strategy A MF 10/31/2017 11.26 22,058.40 0.00 20.24 11.17 15.96 11.32 5.75__
Janus Henderson Balanced I MF 9/30/2017 6.55 12,827.17 0.00 18.58 7.68 10.18 7.82__ __
FPA Crescent MF 9/30/2017 6.46 12,648.91 0.00 10.39 6.03 9.16 7.25__ __
Janus Henderson Global Inc Mgd Volatil I MF 9/30/2017 6.45 12,630.69 0.00 16.24 9.86 9.70__ __ __
Janus Henderson US Managed Volatility I MF 9/30/2017 5.37 10,513.33 0.00 20.57 10.45 14.88 7.71__ __
First Eagle Gold I MF 10/31/2017 5.05 9,897.45 0.00 8.44 6.41 -8.92 -1.51__ __
Mairs & Power Balanced Inv MF 9/30/2017 4.36 8,542.31 0.00 11.90 6.71 9.34 7.60__ __
Oppenheimer SteelPath MLP Alpha Y MF 9/30/2017 2.94 5,767.97 0.00 -6.95 -6.43 1.59__ __ __
Fidelity® Cash Mgmt Fds Prime Cptl Rsrvs FM 7/31/2015 1.07 2,103.68 0.00__ __ __ __ __ __
Fidelity® Treasury Money Market Dly Mny FM 7/31/2017 0.00 1.49 0.63 0.25 0.09 0.06 0.15__ __
Performance DisclosureThe performance data quoted represents past performance and does not guarantee future results. The investment return and principal value of an investment willfluctuate thus an investor's shares, when redeemed, may be worth more or less than their original cost. Current performance may be lower or higher than returndata quoted herein. For information current to the most recent month-end, please visit http://advisor.morningstar.com/familyinfo.asp.
Investment start 10/1/2005 | Investment end 12/31/2017| Note: Portions of the analysis are based on pre-inception returns. Please read disclosure for more information. Page 3 of 12
2018 Morningstar. All Rights Reserved. The information, data, analyses and opinions contained herein (1) include the confidential and proprietary information of Morningstar, (2) may include, or be derived from, account information provided by your financial advisor which cannot be verified by Morningstar, (3) may not be copied or redistributed, (4) do not constitute investment advice offered by Morningstar, (5) are provided solely for informational purposes and therefore are not an offer to buy or sell a security, and (6) are not warranted to be correct, complete or accurate. Except as otherwise required by law, Morningstar shall not be responsible for any trading decisions, damages or other losses resulting from, or related to, this information, data, analyses or opinions or their use. This report is supplemental sales literature, and therefore must be preceded or accompanied by a prospectus and disclosure statement. Please read the prospectus carefully.
©

Disclosure for Standardized and Tax Adjusted Returns
The performance data quoted represents past performance and does notguarantee future results. The investment return and principal value of aninvestment will fluctuate thus an investor's shares, when redeemed, may beworth more or less than their original cost. Current performance may be loweror higher than return data quoted herein. For information current to the mostrecent month-end, please visithttp://www.morningstaradvisor.com/familyinfo.asp
An investment in the fund is not insured or guaranteed by the FDIC or any othergovernment agency. The current yield quotation more closely reflects thecurrent earnings of the money market fund than the total return quotation.Although the fund seeks to preserve the value of your investment at $1.00 pershare, it is possible to lose money by investing in the fund.
Standardized Returns assume reinvestment of dividends and capital gains. Itdepicts performance without adjusting for the effects of taxation, but areadjusted to reflect sales charges and ongoing fund expenses. If adjusted fortaxation, the performance quoted would be significantly reduced. For variable
annuities, additional expenses will be taken in account, including M&E riskcharges, fund-level expenses such as management fees and operating fees,and policy-level administration fees, charges such as surrender, contract andsales charges.
After-tax returns are calculated using the highest individual federal marginalincome tax rates, and do not reflect the impact of state and local taxes. Actualafter tax returns depend on the investor's tax situation and may differ fromthose shown. The after tax returns shown are not relevant to investors whohold their fund shares through tax-deferred arrangements such as 401(k) plansor an IRA. After-tax returns exclude the effects of either the alternativeminimum tax or phase-out of certain tax credits. Any taxes due are as of thetime the distributions are made, and the taxable amount and tax character ofeach distribution is as specified by the fund on the dividend declaration date.Due to foreign tax credits or realized capital losses, after-tax returns may begreater than before tax returns. After-tax returns for exchange-traded funds arebased on net asset value.
Annualized returns 12/31/2017
Standardized Return (%) 7-dayYield
1 Yr 5 Yr 10 Yr SinceInception
InceptionDate
MaximumFront Load
MaximumDefer Load
Net ExpRatio %
Gross ExpRatio %
MFS® Aggressive Growth Allocation A__
15.85 10.14 5.63 7.60 6/28/2002 5.75__
1.10 1.12PIMCO Income D
__8.22 6.03 8.83 8.67 3/30/2007
__ __0.90 0.93
AllianzGI Structured Return Instl__
5.47 4.94__
4.79 12/3/2012__ __
0.81 1.00AIG Focused Dividend Strategy A
__13.33 14.59 10.67 7.59 6/8/1998 5.75
__1.05 1.05
Janus Henderson Balanced I__
18.58 10.18 7.82 10.55 7/6/2009__ __
0.67 0.67FPA Crescent
__10.39 9.16 7.25 10.38 6/2/1993
__ __1.07 1.09
Janus Henderson Global Inc Mgd Vola...__
16.24 9.70__
10.62 12/15/2011__ __
0.58 0.76Janus Henderson US Managed Volatili...
__20.57 14.88 7.71 7.97 12/30/2005
__ __0.65 0.65
First Eagle Gold I__
8.44 -8.92 -1.51 5.73 5/15/2003__ __
0.98 0.98Mairs & Power Balanced Inv
__11.90 9.34 7.60
__11/10/1961
__ __0.72 0.72
Oppenheimer SteelPath MLP Alpha Y__
-6.95 1.59__
4.10 3/31/2010__ __
3.82 3.93Fidelity® Cash Mgmt Fds Prime Cptl ...
__0.01 0.01 1.19 3.86 1/1/1900
__ __0.99 0.99
Fidelity® Treasury Money Market Dly...__
0.25 0.06 0.15 3.49 1/1/1900__ __
0.70 0.72Alerian MLP TR USD -6.52 -0.06 6.05 - -BBgBarc US Agg Bond TR USD 3.54 2.10 4.01 - -
Return after Taxes (%) on Distribution on Distribution and Sales of Shares
1 Yr 5 Yr 10 Yr SinceInception
InceptionDate
1 Yr 5 Yr 10 Yr SinceInception
MFS® Aggressive Growth Allocation A 14.43 9.21 4.89 6.92 6/28/2002 9.52 7.75 4.20 6.09PIMCO Income D 5.88 3.43 6.19 6.08 3/30/2007 4.61 3.40 5.79 5.70AllianzGI Structured Return Instl 3.75 3.70
__3.57 12/3/2012 3.19 3.40
__3.30
AIG Focused Dividend Strategy A 9.99 11.88 8.85 5.95 6/8/1998 8.75 10.63 8.00 5.57Janus Henderson Balanced I 16.65 8.44
__9.00 7/6/2009 11.23 7.47
__8.06
FPA Crescent 9.22 7.68 6.21 8.85 6/2/1993 6.44 6.95 5.60 8.31Janus Henderson Global Inc Mgd Volatil I 14.46 7.53
__8.57 12/15/2011 9.16 6.64
__7.51
Janus Henderson US Managed Volatility I 17.79 10.54 5.27 5.80 12/30/2005 11.85 10.36 5.25 5.63First Eagle Gold I 8.44 -8.92 -1.88 4.95 5/15/2003 4.78 -6.48 -0.95 4.81Mairs & Power Balanced Inv 10.41 8.07 6.39
__11/10/1961 7.05 6.85 5.58 0.00
Oppenheimer SteelPath MLP Alpha Y -9.56 -0.31__
2.25 3/31/2010 -3.53 0.98__
2.95
Page 4 of 12
2018 Morningstar. All Rights Reserved. The information, data, analyses and opinions contained herein (1) include the confidential and proprietary information of Morningstar, (2) may include, or be derived from, account information provided by your financial advisor which cannot be verified by Morningstar, (3) may not be copied or redistributed, (4) do not constitute investment advice offered by Morningstar, (5) are provided solely for informational purposes and therefore are not an offer to buy or sell a security, and (6) are not warranted to be correct, complete or accurate. Except as otherwise required by law, Morningstar shall not be responsible for any trading decisions, damages or other losses resulting from, or related to, this information, data, analyses or opinions or their use. This report is supplemental sales literature, and therefore must be preceded or accompanied by a prospectus and disclosure statement. Please read the prospectus carefully.
©
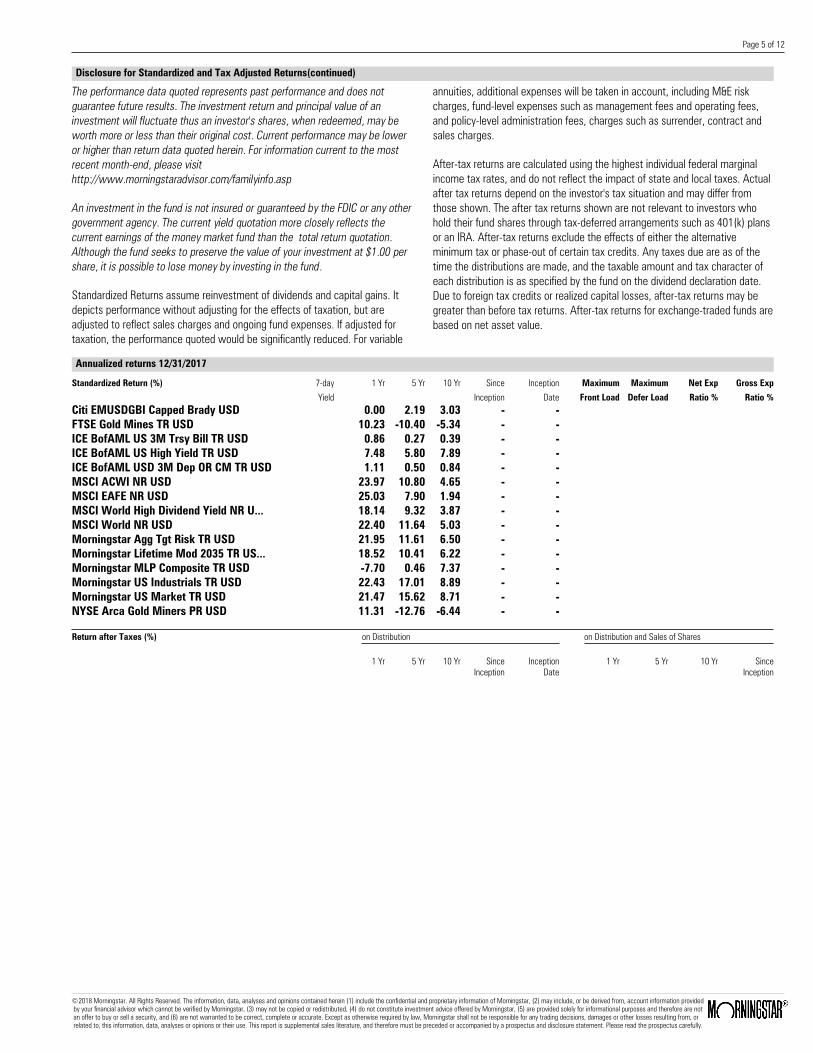
Disclosure for Standardized and Tax Adjusted Returns(continued)
The performance data quoted represents past performance and does notguarantee future results. The investment return and principal value of aninvestment will fluctuate thus an investor's shares, when redeemed, may beworth more or less than their original cost. Current performance may be loweror higher than return data quoted herein. For information current to the mostrecent month-end, please visithttp://www.morningstaradvisor.com/familyinfo.asp
An investment in the fund is not insured or guaranteed by the FDIC or any othergovernment agency. The current yield quotation more closely reflects thecurrent earnings of the money market fund than the total return quotation.Although the fund seeks to preserve the value of your investment at $1.00 pershare, it is possible to lose money by investing in the fund.
Standardized Returns assume reinvestment of dividends and capital gains. Itdepicts performance without adjusting for the effects of taxation, but areadjusted to reflect sales charges and ongoing fund expenses. If adjusted fortaxation, the performance quoted would be significantly reduced. For variable
annuities, additional expenses will be taken in account, including M&E riskcharges, fund-level expenses such as management fees and operating fees,and policy-level administration fees, charges such as surrender, contract andsales charges.
After-tax returns are calculated using the highest individual federal marginalincome tax rates, and do not reflect the impact of state and local taxes. Actualafter tax returns depend on the investor's tax situation and may differ fromthose shown. The after tax returns shown are not relevant to investors whohold their fund shares through tax-deferred arrangements such as 401(k) plansor an IRA. After-tax returns exclude the effects of either the alternativeminimum tax or phase-out of certain tax credits. Any taxes due are as of thetime the distributions are made, and the taxable amount and tax character ofeach distribution is as specified by the fund on the dividend declaration date.Due to foreign tax credits or realized capital losses, after-tax returns may begreater than before tax returns. After-tax returns for exchange-traded funds arebased on net asset value.
Annualized returns 12/31/2017
Standardized Return (%) 7-dayYield
1 Yr 5 Yr 10 Yr SinceInception
InceptionDate
MaximumFront Load
MaximumDefer Load
Net ExpRatio %
Gross ExpRatio %
Citi EMUSDGBI Capped Brady USD 0.00 2.19 3.03 - -FTSE Gold Mines TR USD 10.23 -10.40 -5.34 - -ICE BofAML US 3M Trsy Bill TR USD 0.86 0.27 0.39 - -ICE BofAML US High Yield TR USD 7.48 5.80 7.89 - -ICE BofAML USD 3M Dep OR CM TR USD 1.11 0.50 0.84 - -MSCI ACWI NR USD 23.97 10.80 4.65 - -MSCI EAFE NR USD 25.03 7.90 1.94 - -MSCI World High Dividend Yield NR U... 18.14 9.32 3.87 - -MSCI World NR USD 22.40 11.64 5.03 - -Morningstar Agg Tgt Risk TR USD 21.95 11.61 6.50 - -Morningstar Lifetime Mod 2035 TR US... 18.52 10.41 6.22 - -Morningstar MLP Composite TR USD -7.70 0.46 7.37 - -Morningstar US Industrials TR USD 22.43 17.01 8.89 - -Morningstar US Market TR USD 21.47 15.62 8.71 - -NYSE Arca Gold Miners PR USD 11.31 -12.76 -6.44 - -
Return after Taxes (%) on Distribution on Distribution and Sales of Shares
1 Yr 5 Yr 10 Yr SinceInception
InceptionDate
1 Yr 5 Yr 10 Yr SinceInception
Page 5 of 12
2018 Morningstar. All Rights Reserved. The information, data, analyses and opinions contained herein (1) include the confidential and proprietary information of Morningstar, (2) may include, or be derived from, account information provided by your financial advisor which cannot be verified by Morningstar, (3) may not be copied or redistributed, (4) do not constitute investment advice offered by Morningstar, (5) are provided solely for informational purposes and therefore are not an offer to buy or sell a security, and (6) are not warranted to be correct, complete or accurate. Except as otherwise required by law, Morningstar shall not be responsible for any trading decisions, damages or other losses resulting from, or related to, this information, data, analyses or opinions or their use. This report is supplemental sales literature, and therefore must be preceded or accompanied by a prospectus and disclosure statement. Please read the prospectus carefully.
©

Disclosure for Standardized and Tax Adjusted Returns(continued)
The performance data quoted represents past performance and does notguarantee future results. The investment return and principal value of aninvestment will fluctuate thus an investor's shares, when redeemed, may beworth more or less than their original cost. Current performance may be loweror higher than return data quoted herein. For information current to the mostrecent month-end, please visithttp://www.morningstaradvisor.com/familyinfo.asp
An investment in the fund is not insured or guaranteed by the FDIC or any othergovernment agency. The current yield quotation more closely reflects thecurrent earnings of the money market fund than the total return quotation.Although the fund seeks to preserve the value of your investment at $1.00 pershare, it is possible to lose money by investing in the fund.
Standardized Returns assume reinvestment of dividends and capital gains. Itdepicts performance without adjusting for the effects of taxation, but areadjusted to reflect sales charges and ongoing fund expenses. If adjusted fortaxation, the performance quoted would be significantly reduced. For variable
annuities, additional expenses will be taken in account, including M&E riskcharges, fund-level expenses such as management fees and operating fees,and policy-level administration fees, charges such as surrender, contract andsales charges.
After-tax returns are calculated using the highest individual federal marginalincome tax rates, and do not reflect the impact of state and local taxes. Actualafter tax returns depend on the investor's tax situation and may differ fromthose shown. The after tax returns shown are not relevant to investors whohold their fund shares through tax-deferred arrangements such as 401(k) plansor an IRA. After-tax returns exclude the effects of either the alternativeminimum tax or phase-out of certain tax credits. Any taxes due are as of thetime the distributions are made, and the taxable amount and tax character ofeach distribution is as specified by the fund on the dividend declaration date.Due to foreign tax credits or realized capital losses, after-tax returns may begreater than before tax returns. After-tax returns for exchange-traded funds arebased on net asset value.
Annualized returns 12/31/2017
Standardized Return (%) 7-dayYield
1 Yr 5 Yr 10 Yr SinceInception
InceptionDate
MaximumFront Load
MaximumDefer Load
Net ExpRatio %
Gross ExpRatio %
Russell 1000 Growth TR USD 30.21 17.33 10.00 - -Russell 1000 TR USD 21.69 15.71 8.59 - -Russell 1000 Value TR USD 13.66 14.04 7.10 - -S&P 500 TR USD 21.83 15.79 8.50 - -S&P 500 VIX Short Term Futures TR U... -72.11 -57.02 -51.68 - -S&P Global REIT TR USD 8.63 8.08 5.34 - -USTREAS T-Bill Auction Ave 3 Mon 0.97 0.29 0.34 - -
Return after Taxes (%) on Distribution on Distribution and Sales of Shares
1 Yr 5 Yr 10 Yr SinceInception
InceptionDate
1 Yr 5 Yr 10 Yr SinceInception
Page 6 of 12
2018 Morningstar. All Rights Reserved. The information, data, analyses and opinions contained herein (1) include the confidential and proprietary information of Morningstar, (2) may include, or be derived from, account information provided by your financial advisor which cannot be verified by Morningstar, (3) may not be copied or redistributed, (4) do not constitute investment advice offered by Morningstar, (5) are provided solely for informational purposes and therefore are not an offer to buy or sell a security, and (6) are not warranted to be correct, complete or accurate. Except as otherwise required by law, Morningstar shall not be responsible for any trading decisions, damages or other losses resulting from, or related to, this information, data, analyses or opinions or their use. This report is supplemental sales literature, and therefore must be preceded or accompanied by a prospectus and disclosure statement. Please read the prospectus carefully.
©
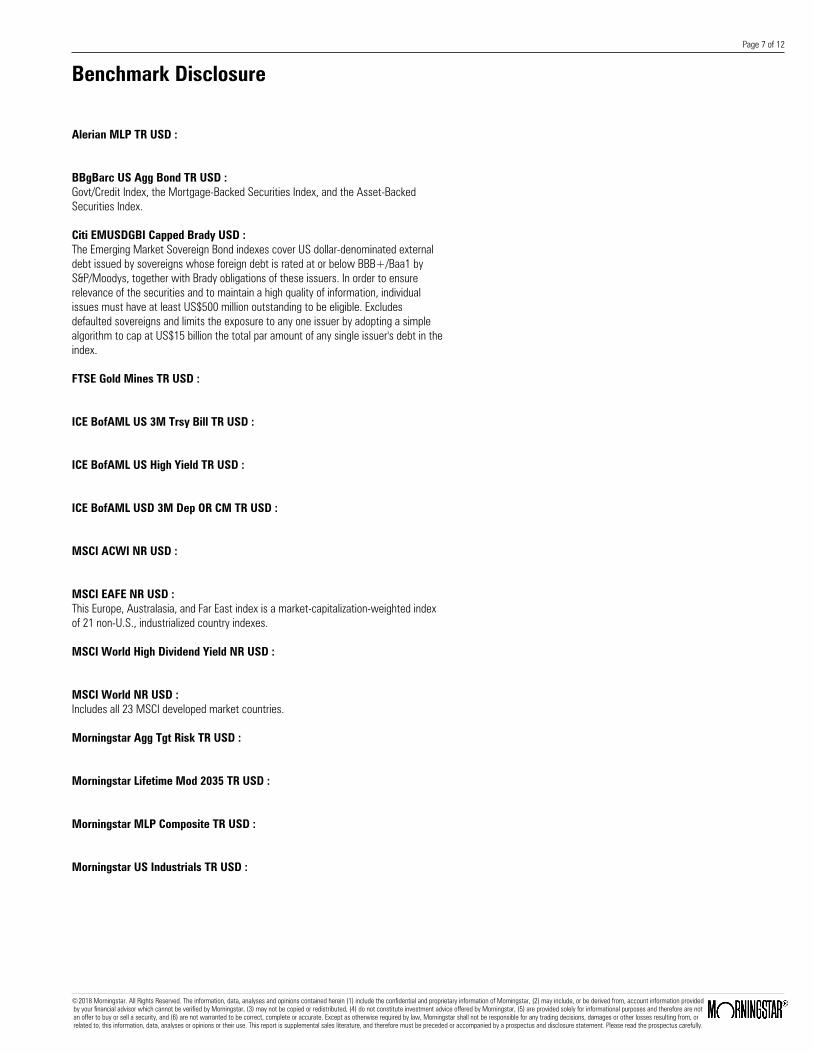
Benchmark Disclosure
Alerian MLP TR USD :
BBgBarc US Agg Bond TR USD : Govt/Credit Index, the Mortgage-Backed Securities Index, and the Asset-BackedSecurities Index.
Citi EMUSDGBI Capped Brady USD : The Emerging Market Sovereign Bond indexes cover US dollar-denominated externaldebt issued by sovereigns whose foreign debt is rated at or below BBB+/Baa1 byS&P/Moodys, together with Brady obligations of these issuers. In order to ensurerelevance of the securities and to maintain a high quality of information, individualissues must have at least US$500 million outstanding to be eligible. Excludesdefaulted sovereigns and limits the exposure to any one issuer by adopting a simplealgorithm to cap at US$15 billion the total par amount of any single issuer's debt in theindex.
FTSE Gold Mines TR USD :
ICE BofAML US 3M Trsy Bill TR USD :
ICE BofAML US High Yield TR USD :
ICE BofAML USD 3M Dep OR CM TR USD :
MSCI ACWI NR USD :
MSCI EAFE NR USD : This Europe, Australasia, and Far East index is a market-capitalization-weighted indexof 21 non-U.S., industrialized country indexes.
MSCI World High Dividend Yield NR USD :
MSCI World NR USD : Includes all 23 MSCI developed market countries.
Morningstar Agg Tgt Risk TR USD :
Morningstar Lifetime Mod 2035 TR USD :
Morningstar MLP Composite TR USD :
Morningstar US Industrials TR USD :
Page 7 of 12
2018 Morningstar. All Rights Reserved. The information, data, analyses and opinions contained herein (1) include the confidential and proprietary information of Morningstar, (2) may include, or be derived from, account information provided by your financial advisor which cannot be verified by Morningstar, (3) may not be copied or redistributed, (4) do not constitute investment advice offered by Morningstar, (5) are provided solely for informational purposes and therefore are not an offer to buy or sell a security, and (6) are not warranted to be correct, complete or accurate. Except as otherwise required by law, Morningstar shall not be responsible for any trading decisions, damages or other losses resulting from, or related to, this information, data, analyses or opinions or their use. This report is supplemental sales literature, and therefore must be preceded or accompanied by a prospectus and disclosure statement. Please read the prospectus carefully.
©

Benchmark Disclosure(continued)
Morningstar US Market TR USD : A rule-based, float-weighted index that tracks the performance of US stock market.The Index targets 97% capitalization of the investable universe.
NYSE Arca Gold Miners PR USD :
Russell 1000 Growth TR USD : Tracks the companies within the Russell 1000 with higher price-to-book ratios andhigher forecasted growth values.
Russell 1000 TR USD : Consists of the 1000 largest companies within the Russell 3000 index, whichrepresents approximately 98% of the investable US equity market. Also known as theMarket-Oriented Index, because it represents the group of stocks from which mostactive money managers choose.
Russell 1000 Value TR USD : Tracks the companies within the Russell 1000 with lower price-to-book ratios andlower forecasted growth values.
S&P 500 TR USD : A market capitalization-weighted index of 500 widely held stocks often used as aproxy for the stock market.
S&P 500 VIX Short Term Futures TR USD :
S&P Global REIT TR USD :
USTREAS T-Bill Auction Ave 3 Mon : As tracked by the Wall Street Journal, this benchmark measure the yields ofbank-sponsored certificates of deposit.
Page 8 of 12
2018 Morningstar. All Rights Reserved. The information, data, analyses and opinions contained herein (1) include the confidential and proprietary information of Morningstar, (2) may include, or be derived from, account information provided by your financial advisor which cannot be verified by Morningstar, (3) may not be copied or redistributed, (4) do not constitute investment advice offered by Morningstar, (5) are provided solely for informational purposes and therefore are not an offer to buy or sell a security, and (6) are not warranted to be correct, complete or accurate. Except as otherwise required by law, Morningstar shall not be responsible for any trading decisions, damages or other losses resulting from, or related to, this information, data, analyses or opinions or their use. This report is supplemental sales literature, and therefore must be preceded or accompanied by a prospectus and disclosure statement. Please read the prospectus carefully.
©
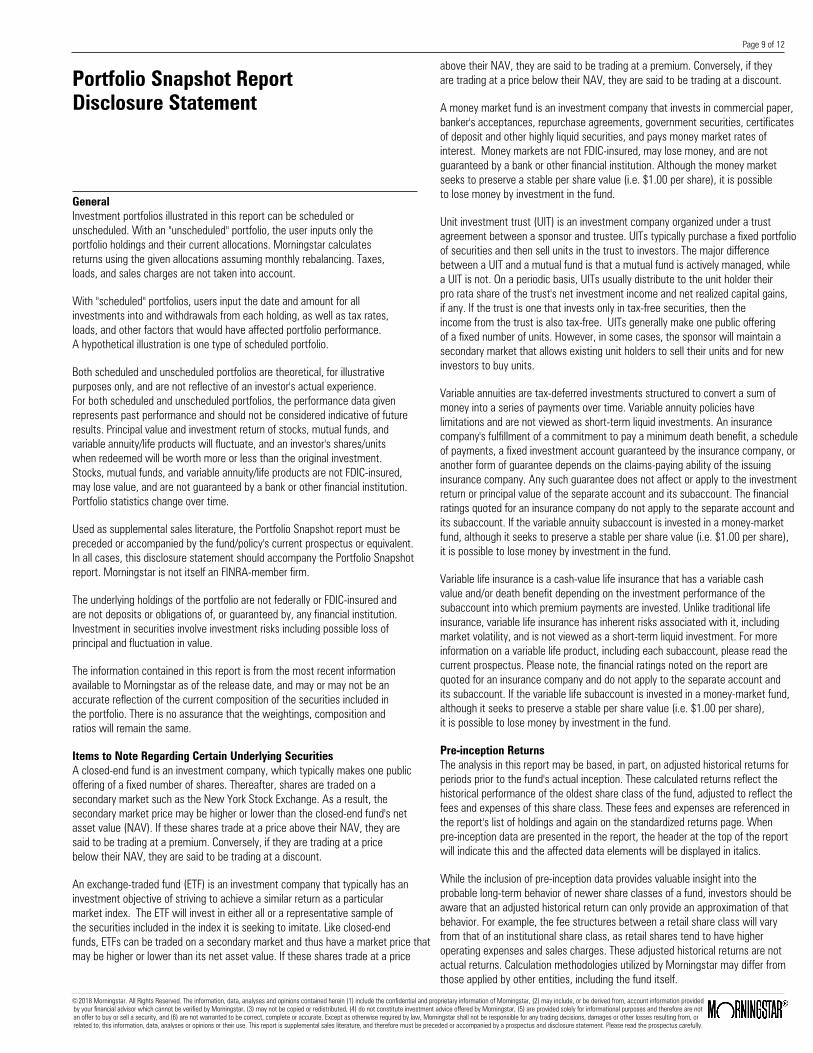
Portfolio Snapshot ReportDisclosure Statement
GeneralInvestment portfolios illustrated in this report can be scheduled orunscheduled. With an "unscheduled" portfolio, the user inputs only theportfolio holdings and their current allocations. Morningstar calculatesreturns using the given allocations assuming monthly rebalancing. Taxes,loads, and sales charges are not taken into account.
With "scheduled" portfolios, users input the date and amount for allinvestments into and withdrawals from each holding, as well as tax rates,loads, and other factors that would have affected portfolio performance.A hypothetical illustration is one type of scheduled portfolio.
Both scheduled and unscheduled portfolios are theoretical, for illustrativepurposes only, and are not reflective of an investor's actual experience.For both scheduled and unscheduled portfolios, the performance data givenrepresents past performance and should not be considered indicative of futureresults. Principal value and investment return of stocks, mutual funds, andvariable annuity/life products will fluctuate, and an investor's shares/unitswhen redeemed will be worth more or less than the original investment.Stocks, mutual funds, and variable annuity/life products are not FDIC-insured,may lose value, and are not guaranteed by a bank or other financial institution.Portfolio statistics change over time.
Used as supplemental sales literature, the Portfolio Snapshot report must bepreceded or accompanied by the fund/policy's current prospectus or equivalent.In all cases, this disclosure statement should accompany the Portfolio Snapshotreport. Morningstar is not itself an FINRA-member firm.
The underlying holdings of the portfolio are not federally or FDIC-insured andare not deposits or obligations of, or guaranteed by, any financial institution.Investment in securities involve investment risks including possible loss ofprincipal and fluctuation in value.
The information contained in this report is from the most recent informationavailable to Morningstar as of the release date, and may or may not be anaccurate reflection of the current composition of the securities included inthe portfolio. There is no assurance that the weightings, composition andratios will remain the same.
Items to Note Regarding Certain Underlying SecuritiesA closed-end fund is an investment company, which typically makes one publicoffering of a fixed number of shares. Thereafter, shares are traded on asecondary market such as the New York Stock Exchange. As a result, thesecondary market price may be higher or lower than the closed-end fund's netasset value (NAV). If these shares trade at a price above their NAV, they aresaid to be trading at a premium. Conversely, if they are trading at a pricebelow their NAV, they are said to be trading at a discount.
An exchange-traded fund (ETF) is an investment company that typically has aninvestment objective of striving to achieve a similar return as a particularmarket index. The ETF will invest in either all or a representative sample ofthe securities included in the index it is seeking to imitate. Like closed-endfunds, ETFs can be traded on a secondary market and thus have a market price thatmay be higher or lower than its net asset value. If these shares trade at a price
above their NAV, they are said to be trading at a premium. Conversely, if theyare trading at a price below their NAV, they are said to be trading at a discount.
A money market fund is an investment company that invests in commercial paper,banker's acceptances, repurchase agreements, government securities, certificatesof deposit and other highly liquid securities, and pays money market rates ofinterest. Money markets are not FDIC-insured, may lose money, and are notguaranteed by a bank or other financial institution. Although the money marketseeks to preserve a stable per share value (i.e. $1.00 per share), it is possibleto lose money by investment in the fund.
Unit investment trust (UIT) is an investment company organized under a trustagreement between a sponsor and trustee. UITs typically purchase a fixed portfolioof securities and then sell units in the trust to investors. The major differencebetween a UIT and a mutual fund is that a mutual fund is actively managed, whilea UIT is not. On a periodic basis, UITs usually distribute to the unit holder theirpro rata share of the trust's net investment income and net realized capital gains,if any. If the trust is one that invests only in tax-free securities, then theincome from the trust is also tax-free. UITs generally make one public offeringof a fixed number of units. However, in some cases, the sponsor will maintain asecondary market that allows existing unit holders to sell their units and for newinvestors to buy units.
Variable annuities are tax-deferred investments structured to convert a sum ofmoney into a series of payments over time. Variable annuity policies havelimitations and are not viewed as short-term liquid investments. An insurancecompany's fulfillment of a commitment to pay a minimum death benefit, a scheduleof payments, a fixed investment account guaranteed by the insurance company, oranother form of guarantee depends on the claims-paying ability of the issuinginsurance company. Any such guarantee does not affect or apply to the investmentreturn or principal value of the separate account and its subaccount. The financialratings quoted for an insurance company do not apply to the separate account andits subaccount. If the variable annuity subaccount is invested in a money-marketfund, although it seeks to preserve a stable per share value (i.e. $1.00 per share),it is possible to lose money by investment in the fund.
Variable life insurance is a cash-value life insurance that has a variable cashvalue and/or death benefit depending on the investment performance of thesubaccount into which premium payments are invested. Unlike traditional lifeinsurance, variable life insurance has inherent risks associated with it, includingmarket volatility, and is not viewed as a short-term liquid investment. For moreinformation on a variable life product, including each subaccount, please read thecurrent prospectus. Please note, the financial ratings noted on the report arequoted for an insurance company and do not apply to the separate account andits subaccount. If the variable life subaccount is invested in a money-market fund,although it seeks to preserve a stable per share value (i.e. $1.00 per share),it is possible to lose money by investment in the fund.
Pre-inception ReturnsThe analysis in this report may be based, in part, on adjusted historical returns forperiods prior to the fund's actual inception. These calculated returns reflect thehistorical performance of the oldest share class of the fund, adjusted to reflect thefees and expenses of this share class. These fees and expenses are referenced inthe report's list of holdings and again on the standardized returns page. Whenpre-inception data are presented in the report, the header at the top of the reportwill indicate this and the affected data elements will be displayed in italics.
While the inclusion of pre-inception data provides valuable insight into theprobable long-term behavior of newer share classes of a fund, investors should beaware that an adjusted historical return can only provide an approximation of thatbehavior. For example, the fee structures between a retail share class will varyfrom that of an institutional share class, as retail shares tend to have higheroperating expenses and sales charges. These adjusted historical returns are notactual returns. Calculation methodologies utilized by Morningstar may differ fromthose applied by other entities, including the fund itself.
Page 9 of 12
2018 Morningstar. All Rights Reserved. The information, data, analyses and opinions contained herein (1) include the confidential and proprietary information of Morningstar, (2) may include, or be derived from, account information provided by your financial advisor which cannot be verified by Morningstar, (3) may not be copied or redistributed, (4) do not constitute investment advice offered by Morningstar, (5) are provided solely for informational purposes and therefore are not an offer to buy or sell a security, and (6) are not warranted to be correct, complete or accurate. Except as otherwise required by law, Morningstar shall not be responsible for any trading decisions, damages or other losses resulting from, or related to, this information, data, analyses or opinions or their use. This report is supplemental sales literature, and therefore must be preceded or accompanied by a prospectus and disclosure statement. Please read the prospectus carefully.
©
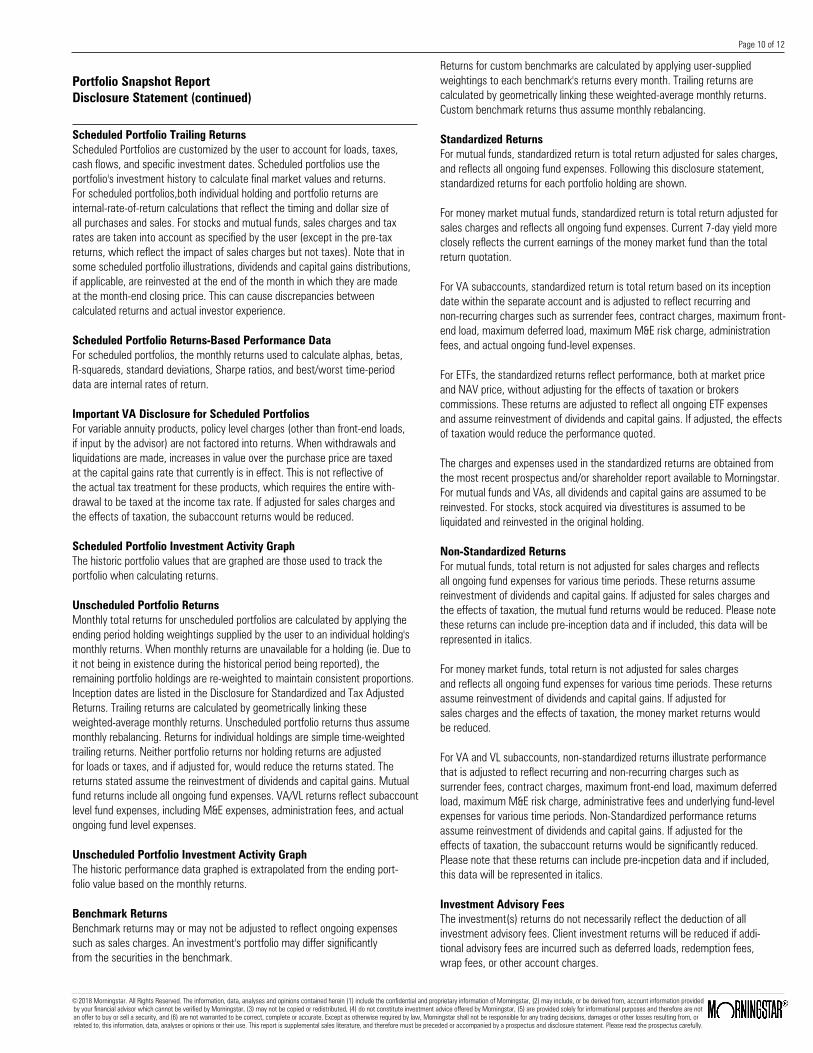
Portfolio Snapshot ReportDisclosure Statement (continued)
Scheduled Portfolio Trailing ReturnsScheduled Portfolios are customized by the user to account for loads, taxes,cash flows, and specific investment dates. Scheduled portfolios use theportfolio's investment history to calculate final market values and returns.For scheduled portfolios,both individual holding and portfolio returns areinternal-rate-of-return calculations that reflect the timing and dollar size ofall purchases and sales. For stocks and mutual funds, sales charges and taxrates are taken into account as specified by the user (except in the pre-taxreturns, which reflect the impact of sales charges but not taxes). Note that insome scheduled portfolio illustrations, dividends and capital gains distributions,if applicable, are reinvested at the end of the month in which they are madeat the month-end closing price. This can cause discrepancies betweencalculated returns and actual investor experience.
Scheduled Portfolio Returns-Based Performance DataFor scheduled portfolios, the monthly returns used to calculate alphas, betas,R-squareds, standard deviations, Sharpe ratios, and best/worst time-perioddata are internal rates of return.
Important VA Disclosure for Scheduled PortfoliosFor variable annuity products, policy level charges (other than front-end loads,if input by the advisor) are not factored into returns. When withdrawals andliquidations are made, increases in value over the purchase price are taxedat the capital gains rate that currently is in effect. This is not reflective ofthe actual tax treatment for these products, which requires the entire with-drawal to be taxed at the income tax rate. If adjusted for sales charges andthe effects of taxation, the subaccount returns would be reduced.
Scheduled Portfolio Investment Activity GraphThe historic portfolio values that are graphed are those used to track theportfolio when calculating returns.
Unscheduled Portfolio ReturnsMonthly total returns for unscheduled portfolios are calculated by applying theending period holding weightings supplied by the user to an individual holding'smonthly returns. When monthly returns are unavailable for a holding (ie. Due toit not being in existence during the historical period being reported), theremaining portfolio holdings are re-weighted to maintain consistent proportions.Inception dates are listed in the Disclosure for Standardized and Tax AdjustedReturns. Trailing returns are calculated by geometrically linking theseweighted-average monthly returns. Unscheduled portfolio returns thus assumemonthly rebalancing. Returns for individual holdings are simple time-weightedtrailing returns. Neither portfolio returns nor holding returns are adjustedfor loads or taxes, and if adjusted for, would reduce the returns stated. Thereturns stated assume the reinvestment of dividends and capital gains. Mutualfund returns include all ongoing fund expenses. VA/VL returns reflect subaccountlevel fund expenses, including M&E expenses, administration fees, and actualongoing fund level expenses.
Unscheduled Portfolio Investment Activity GraphThe historic performance data graphed is extrapolated from the ending port-folio value based on the monthly returns.
Benchmark ReturnsBenchmark returns may or may not be adjusted to reflect ongoing expensessuch as sales charges. An investment's portfolio may differ significantlyfrom the securities in the benchmark.
Returns for custom benchmarks are calculated by applying user-suppliedweightings to each benchmark's returns every month. Trailing returns arecalculated by geometrically linking these weighted-average monthly returns.Custom benchmark returns thus assume monthly rebalancing.
Standardized ReturnsFor mutual funds, standardized return is total return adjusted for sales charges,and reflects all ongoing fund expenses. Following this disclosure statement,standardized returns for each portfolio holding are shown.
For money market mutual funds, standardized return is total return adjusted forsales charges and reflects all ongoing fund expenses. Current 7-day yield moreclosely reflects the current earnings of the money market fund than the totalreturn quotation.
For VA subaccounts, standardized return is total return based on its inceptiondate within the separate account and is adjusted to reflect recurring andnon-recurring charges such as surrender fees, contract charges, maximum front-end load, maximum deferred load, maximum M&E risk charge, administrationfees, and actual ongoing fund-level expenses.
For ETFs, the standardized returns reflect performance, both at market priceand NAV price, without adjusting for the effects of taxation or brokerscommissions. These returns are adjusted to reflect all ongoing ETF expensesand assume reinvestment of dividends and capital gains. If adjusted, the effectsof taxation would reduce the performance quoted.
The charges and expenses used in the standardized returns are obtained fromthe most recent prospectus and/or shareholder report available to Morningstar.For mutual funds and VAs, all dividends and capital gains are assumed to bereinvested. For stocks, stock acquired via divestitures is assumed to beliquidated and reinvested in the original holding.
Non-Standardized ReturnsFor mutual funds, total return is not adjusted for sales charges and reflectsall ongoing fund expenses for various time periods. These returns assumereinvestment of dividends and capital gains. If adjusted for sales charges andthe effects of taxation, the mutual fund returns would be reduced. Please notethese returns can include pre-inception data and if included, this data will berepresented in italics.
For money market funds, total return is not adjusted for sales chargesand reflects all ongoing fund expenses for various time periods. These returnsassume reinvestment of dividends and capital gains. If adjusted forsales charges and the effects of taxation, the money market returns wouldbe reduced.
For VA and VL subaccounts, non-standardized returns illustrate performancethat is adjusted to reflect recurring and non-recurring charges such assurrender fees, contract charges, maximum front-end load, maximum deferredload, maximum M&E risk charge, administrative fees and underlying fund-levelexpenses for various time periods. Non-Standardized performance returnsassume reinvestment of dividends and capital gains. If adjusted for theeffects of taxation, the subaccount returns would be significantly reduced.Please note that these returns can include pre-incpetion data and if included,this data will be represented in italics.
Investment Advisory FeesThe investment(s) returns do not necessarily reflect the deduction of allinvestment advisory fees. Client investment returns will be reduced if addi-tional advisory fees are incurred such as deferred loads, redemption fees,wrap fees, or other account charges.
Page 10 of 12
2018 Morningstar. All Rights Reserved. The information, data, analyses and opinions contained herein (1) include the confidential and proprietary information of Morningstar, (2) may include, or be derived from, account information provided by your financial advisor which cannot be verified by Morningstar, (3) may not be copied or redistributed, (4) do not constitute investment advice offered by Morningstar, (5) are provided solely for informational purposes and therefore are not an offer to buy or sell a security, and (6) are not warranted to be correct, complete or accurate. Except as otherwise required by law, Morningstar shall not be responsible for any trading decisions, damages or other losses resulting from, or related to, this information, data, analyses or opinions or their use. This report is supplemental sales literature, and therefore must be preceded or accompanied by a prospectus and disclosure statement. Please read the prospectus carefully.
©

Portfolio Snapshot ReportDisclosure Statement (continued)
Investment StyleThe Morningstar Style Box combines the various funds investment strategies.For the equity style box, the vertical axis shows the market capitalization ofthe stocks owned and the horizontal axis shows investment style (value, blend,or growth). For the fixed-income style box, the vertical axis shows the averagecredit quality of the bonds owned and the horizontal axis shows interest ratesensitivity as measured by a bond's duration (short, intermediate, or long).
Risk and ReturnStandard deviation is a statistical measure of the volatility of a portfolio'sreturns around its mean.
Sharpe ratio uses a portfolio's standard deviation and total return to determinereward per unit of risk.
Alpha measures the difference between a portfolio's actual returns and itsexpected performance, given its beta and the actual returns of the benchmarkindex. Alpha is often seen as a measurement of the value added or subtractedby a portfolio's manager.
Beta is a measure of the degree of change in value one can expect in a portfoliogiven a change in value in a benchmark index. A portfolio with a beta greaterthan one is generally more volatile than its benchmark index, and a portfoliowith a beta of less than one is generally less volatile than its benchmark index.
R-squared reflects the percentage of a portfolio's movements that are explainedby movements in its benchmark index, showing the degree of correlation betweenthe portfolio and a benchmark. This figure is also helpful in assessing howlikely it is that alpha and beta are statistically significant.
Fundamental AnalysisThe below referenced data elements are a weighted average of the equityholdings in the portfolio.
The median market capitalization of a subaccount's equity portfolio gives you ameasure of the size of the companies in which the subaccount invests.
The Price/Cash Flow ratio is a weighted average of the price/cash-flow ratios ofthe stocks in a subaccount's portfolio. Price/cash-flow shows the ability of abusiness to generate cash and acts as a gauge of liquidity and solvency.
The Price/Book ratio is a weighted average of the price/book ratios of all thestocks in the underlying fund's portfolio. The P/B ratio of a company is calculatedby dividing the market price of its stock by the company's per-share book value.Stocks with negative book values are excluded from this calculation.
The Price/Earnings ratio is a weighted average of the price/earnings ratios of thestocks in the underlying fund's portfolio. The P/E ratio of a stock is calculatedby dividing the current price of the stock by its trailing 12 months' earnings pershare. In computing the average, Morningstar weights each portfolio holding bythe percentage of equity assets it represents.
The Price/Sales ratio is a weighted average of the price/sales ratios of thestocks in the underlying fund's portfolio. The P/S ratio of a stock is calculatedby dividing the current price of the stock by its trailing 12 months' revenues pershare. In computing the average, Morningstar weights each portfolio holding bythe percentage of equity assets it represents.
The return on assets (ROA) is the percentage a company earns on its assets ina given year. The calculation is net income divided by end-of-year totalassets, multiplied by 100.
The Return on Equity (ROE) is the percentage a company earns on itsshareholders' equity in a given year. The calculation is net income dividedby end-of-year net worth, multiplied by 100.
Market Maturity shows the percentage of a holding's common stocks that aredomiciled in developed and emerging markets.
The below referenced data elements listed below are a weighted average ofthe fixed income holdings in the portfolio.
The average credit quality is derived by taking the weighted average of thecredit rating for each bond in the portfolio.
Average maturity is used for holdings in the taxable fixed-income category,this is a weighted average of all the maturities of the bonds in a portfolio,computed by weighting each maturity date by the market value of the security.Credit quality breakdowns are shown for corporate-bond holdings and depictsthe quality of bonds in the underlying portfolio. The analysis reveals the percentageof fixed-income securities that fall within each credit-quality rating asassigned by Standard & Poor's or Moody's.debt). This figure is not provided for financial companies.
Debt as a percentage of capital is calculated by dividing long-term debt by totalcapitalization (the sum of common equity plus preferred equity plus long-termdebt). This figure is not provided for financial companies.
Duration is a time measure of a bond's interest-rate sensitivity.
Net Margin is a measure of profitability. It is equal to annual net incomedivided by revenues from the same period for the past five fiscal years,multiplied by 100.
Type Weightings divide the stocks in a given holding's portfolio into eighttype designations each of which defines a broad category of investmentcharacteristics. Not all stocks in a given holding's portfolio are assigneda type. These stocks are grouped under NA.
The below referenced data elements listed below are a weighted average of thetotal holdings in the portfolio.
The average expense ratio is the percentage of assets deducted each year foroperating expenses, management fees, and all other asset-based costs incurredby the fund, excluding brokerage fees. Please note for mutual funds, variableannuities/life, ETF and closed-end funds we use the gross prospectus ratio asprovided in the prospectus. For separate accounts and stocks we pull theaudited expense ratio from the annual report.
Potential capital gains exposure is the percentage of a holding's total assetsthat represent capital appreciation.
Investment RiskMarket Price Risk: The market price of ETF's traded on the secondary market issubject to the forces of supply and demand and thus independent of the ETF'sNAV. This can result in the market price trading at a premium or discount tothe NAV which will affect an investors value.
Market Risk: The market prices of ETF's can fluctuate as to the result ofseveral factors such as security-specific factors or general investorsentiment. Therefore, investors should be aware of the prospect of marketfluctuations and the impact it may have on the ETF market price.
Page 11 of 12
2018 Morningstar. All Rights Reserved. The information, data, analyses and opinions contained herein (1) include the confidential and proprietary information of Morningstar, (2) may include, or be derived from, account information provided by your financial advisor which cannot be verified by Morningstar, (3) may not be copied or redistributed, (4) do not constitute investment advice offered by Morningstar, (5) are provided solely for informational purposes and therefore are not an offer to buy or sell a security, and (6) are not warranted to be correct, complete or accurate. Except as otherwise required by law, Morningstar shall not be responsible for any trading decisions, damages or other losses resulting from, or related to, this information, data, analyses or opinions or their use. This report is supplemental sales literature, and therefore must be preceded or accompanied by a prospectus and disclosure statement. Please read the prospectus carefully.
©

Portfolio Snapshot ReportDisclosure Statement (continued)
International Emerging Market Funds/Subaccounts: The investor should notethat funds and subaccounts that invest in international securities take onspecial additional risks. These risks include, but are not limited to,currency risk, political risk, and risk associated with varying accountingstandards. Investing in emerging markets normally accentuates these risks.
Sector Funds/Subaccounts: The investor should note that funds and subacc-ounts that invest exclusively in one sector or industry involve additionalrisks. The lack of industry diversification subjects the investor to increasedindustry-specific risks.
Non-Diversified Funds/Subaccounts: The investor should note that funds orsubaccounts that invest more of their assets in a single issuer involveadditional risks, including share price fluctuations, because of the increasedconcentration of investments.
Small Cap Funds/Subaccounts: The investor should note that funds andsubaccounts that invest in stocks of small companies involve additional risks.Smaller companies typically have a higher risk of failure, and are not as wellestablished as larger blue-chip companies. Historically, smaller-companystocks have experienced a greater degree of price volatility than the overallmarket average.
Mid Cap Funds/Subaccounts: The investor should note that funds andsubaccounts that invest in companies with market capitalizations below $10billion involve additional risks. The securities of these companies may be morevolatile and less liquid than the securities of larger companies.
High-Yield Bond Funds/Subaccounts: The investor should note that funds andsubaccounts that invest in lower-rated debt securities (commonly referred toas junk bonds) involve additional risks because of the lower credit quality ofthe securities in the portfolio. The investor should be aware of the possiblehigher level of volatility and increased risk of default.
Tax-Free Municipal Bond Funds: The investor should note that the incomefrom tax-free municipal bond funds may be subject to state and local taxationand the Alternative Minimum Tax.
Page 12 of 12
2018 Morningstar. All Rights Reserved. The information, data, analyses and opinions contained herein (1) include the confidential and proprietary information of Morningstar, (2) may include, or be derived from, account information provided by your financial advisor which cannot be verified by Morningstar, (3) may not be copied or redistributed, (4) do not constitute investment advice offered by Morningstar, (5) are provided solely for informational purposes and therefore are not an offer to buy or sell a security, and (6) are not warranted to be correct, complete or accurate. Except as otherwise required by law, Morningstar shall not be responsible for any trading decisions, damages or other losses resulting from, or related to, this information, data, analyses or opinions or their use. This report is supplemental sales literature, and therefore must be preceded or accompanied by a prospectus and disclosure statement. Please read the prospectus carefully.
©