investment strategy for india - ministry of finance · investment strategy for india ... india has...
TRANSCRIPT
Investment Commission
1
Investment Strategy for India Investment Commission Report
February 2006
Executive Summary
India has achieved impressive GDP growth of over 7% per annum in the last few years. However, sustaining growth at over 8% per annum will require a significant increase in investment levels in the economy - from approximately 30% of GDP to about 34% of GDP1. Over the next 5 years, this translates to a cumulative investment of over $ 1.5 trillion. The report undertakes to define a strategy that could enable India to achieve this investment goal. While expansion of domestic investment is essential to achieve this goal, FDI, which has been stagnant at about $ 5 billion2 in the past, also needs to be increased significantly - the Investment Commission has set itself the goal to increase the level of FDI to $ 15 billion by 2007-08. To this end, 25 key sectors spanning Infrastructure, Manufacturing, Services, Natural Resources and the Knowledge Economy have been studied. They represent a significant part of the economy, and between them would require an aggregate investment of $ 525 – $ 550 billion over the next 5 years. The sector studies also identified past investment levels, plans/ forecasts for future investment, as currently visible, and identification of the deterrents to investment. Extensive investor interactions have provided key insights on policy and other impediments faced by investors. The Commission has interacted with industry bodies, associations, Ministries at the Centre and State level, business delegations and companies. Interactions also included meetings with business delegations from the US, UK, Italy, Japan and the Scandinavian countries with over 130 companies represented, altogether. Direct investor interactions (mostly personal meetings) were undertaken with an additional 64 international and domestic investors. Arising out of these interactions, projects were identified for facilitation/ support totalling to a likely investment of about $ 30 billion. Representations on policy/ procedures or other impediments were either resolved through reference to the Finance Ministry or have been incorporated in the recommendations in this report.
The major impediments to investment that span multiple sectors have been identified as:
1. Investment restrictions and/ or entry route barriers in several sectors of significant investment potential/ investor interest
1 Assuming an Incremental Capital Output Ratio (ICOR) of 4.0; while this is higher than the current ICOR of ~3.6, it is based on the assumption that greater investment in infrastructure and manufacturing will increase ICOR going forward 2 Less than 10% of China’s FDI
Investment Commission
2
2. Absence of long-term policies, non-implementation / reversal of policy and breach of contract
3. Lack of level playing field - especially in sectors with PSU dominance
4. Inflexible labour laws
5. Many agencies engaged in doing the same or similar activities relating to FDI
6. Bureaucratic delays, discretionary interpretation, vested interest, bias and subjective practices (In particular, approvals from Ministry of Environment & Forests seen as a major impediment in terms of inordinate delay).
7. Centre-State divergence on investment related policies
8. High cost of entry, transactions and exit; ineffective dispute resolution
9. Poor infrastructure
10. Priority Sectors are not clearly identified/ specified
Based on the investment goals and the identified impediments, a set of broad recommendations have been made which could facilitate and improve the investment climate. These are listed below:
1. Remove/ reduce restrictions on sector caps and entry route on all sectors other than those considered “strategic”. Permit “automatic route” for all investments within the sector cap.
2. Provide labour flexibility by removing the requirement of State Government approval from Chapter V-B and permitting Contract Labour in all areas
3. Promote SEZs for key sectors. Redefine norms on the basis of scale, investment quantum/ levels and sector focus. Separate the Developer of the SEZ from the Occupants
4. Provide a level playing field in sectors with PSU dominance - establish an Independent Central Regulatory Commission headed by a Chief Commissioner appointed by the President or the Prime Minister with independent Regulators for each regulated sector
5. Provide long term visibility and consistency of policy
6. Improve business environment – reduce number of procedures and approvals; make all approvals time bound and non-discretionary
7. Eliminate scope for discretionary interpretation to stem corruption – update key laws and statutes using Study Groups or Committees (with Government and Industry participation) to reflect this
8. Establish effective mechanisms to resolve centre-state issues – establish an Empowered Committee framework (as done for VAT implementation) for implementation of key policies that require Centre-State cooperation such as Power sector reform, Labour law reform, Urban Land reforms (including ULC Act), APMC amendment
9. Other Recommendations
Create a special high level fast track mechanism for priority sector projects
Investment Commission
3
Enhance availability of skilled manpower for sectors like Biotechnology, Automotive Engineering, Textile Engineering, IT – establish new private educational institutes with international collaborators
Facilitate upgradation of Urban infrastructure by having a directly elected Mayor in key cities - as is the case with major cities in China and the USA.
Establish a single point contact at the Centre to implement policies and procedures to enhance investment as well as facilitate high value projects across Ministries and Departments.
In addition, recommendations have also been made for specific sectors - Energy, Civil Aviation, Telecom, Metals and Mining, Textiles and Garments, Auto and Auto components, Food and Agro processing, Financial Services, Real Estate & Construction, Tourism and IT / ITES.
As the next phase of taking investment levels to a higher plane, the Investment Commission recommends:
1. The creation of National Thrust Areas – where the Government removes all impediments and provides special incentives for a pre-determined time period in order to achieve a specified growth. These could include Tourism, Power, Textiles and Agro-processing.
2. The hosting of Mega Events which will focus the country’s attention on infrastructure development while also building national pride. Some ideas are: 2010 Commonwealth Games, 2020 Olympics, Football World Cup, Formula One Racing etc.
Investment Commission
4
Overview
The Investment Commission was constituted in December 2004 with the objective of enhancing both foreign and domestic investment levels in India. It is estimated that to support the GDP growth target of over 8% per annum, a total investment of over $ 1.5 trillion is required over a 5 year3 period, of which FDI should be $ 72 billion. The mandate of the Commission entailed identifying and interacting with investors, promoting investment opportunities in India; facilitating investors in their investments; and recommending policy / implementation changes which would remove or reduce present deterrents to higher levels of investment, particularly in FDI, where India is attracting only about $5 billion per year or less than 1% of world FDI flows4 (as compared to $60 billion or almost 10% of world FDI flows by China). The Investment Commission has set itself the goal to increase the level of FDI to $ 15 billion by 2007-08.
The Commission has undertaken their task through the following activities: A sectoral assessment of investment opportunities The preparation of an ‘Investment Handbook’ and a website, to promote India Identification of, and personal meetings with, current and potential investors Meetings with foreign embassies, foreign investor groups, Indian business councils and
trade associations Identification of policy / regulations which are deterrents to investment and
recommendations for changes in policy and procedures.
Further, on a continuing basis, the Commission has also been facilitating and supporting individual investors in their specific projects, with references to the Finance Ministry, other Ministries and relevant State Governments.
This report covers the activities of the Commission to-date.
The 1st section defines the Investment Goals to support a GDP growth rate of over 8% per annum, with sector-wise investment goals estimated for the 25 sectors studied to-date.
The 2nd section summarizes the Investor Interactions by the Investment Commission, including the status of the Projects facilitated, and concludes with the impediments to investment brought to the notice of the Investment Commission by investors.
The 3rd section presents the Recommendations for policy or regulatory changes which the Commission believes would be needed to enable India to achieve its investment goals and growth targets on a sustainable basis.
The concluding section Looking Ahead, discusses possible future options with specific suggestions for Government consideration which could contribute to a higher growth rate.
3 FY 2006 to FY 2010 4 Global foreign direct investment (FDI) inflows in 2004 are estimated at $612 billion, according to the United Nations Conference on Trade and Development (UNCTAD)
Investment Objectives
Investment Commission
5
Investment Objectives
Investment Commission
6
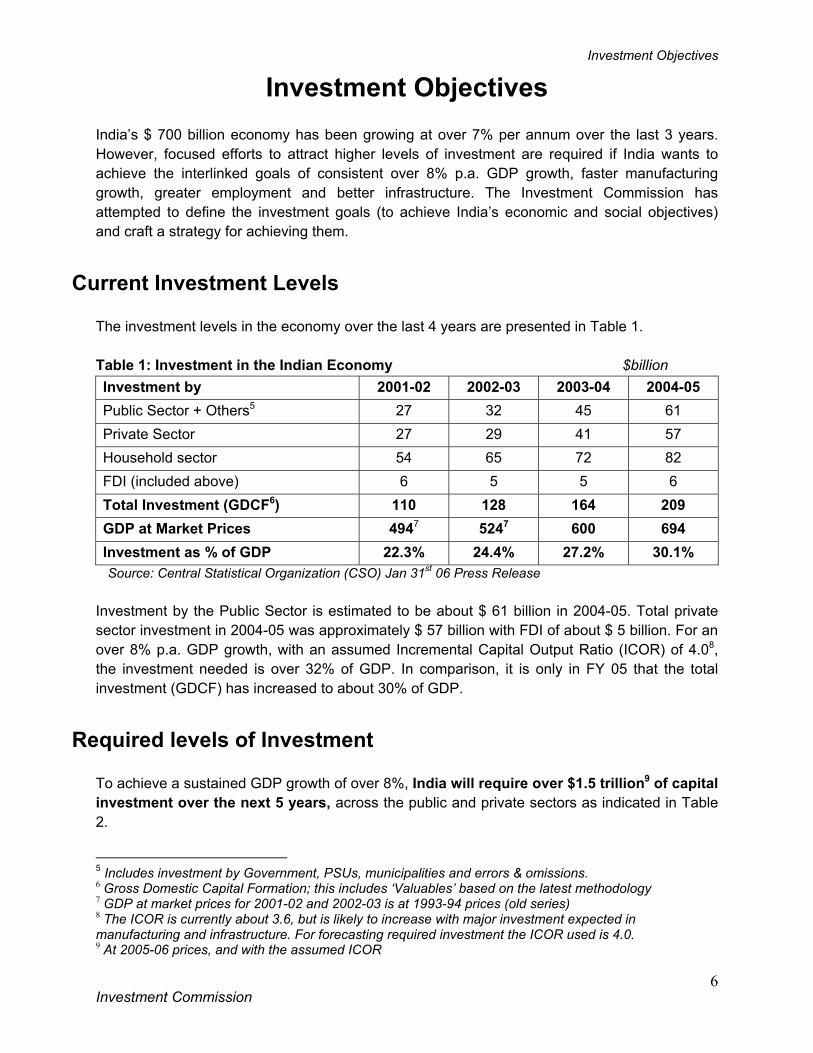
Investment Objectives India’s $ 700 billion economy has been growing at over 7% per annum over the last 3 years. However, focused efforts to attract higher levels of investment are required if India wants to achieve the interlinked goals of consistent over 8% p.a. GDP growth, faster manufacturing growth, greater employment and better infrastructure. The Investment Commission has attempted to define the investment goals (to achieve India’s economic and social objectives) and craft a strategy for achieving them.
Current Investment Levels
The investment levels in the economy over the last 4 years are presented in Table 1. Table 1: Investment in the Indian Economy $billion Investment by 2001-02 2002-03 2003-04 2004-05 Public Sector + Others5 27 32 45 61 Private Sector 27 29 41 57 Household sector 54 65 72 82 FDI (included above) 6 5 5 6 Total Investment (GDCF6) 110 128 164 209 GDP at Market Prices 4947 5247 600 694 Investment as % of GDP 22.3% 24.4% 27.2% 30.1% Source: Central Statistical Organization (CSO) Jan 31st 06 Press Release
Investment by the Public Sector is estimated to be about $ 61 billion in 2004-05. Total private sector investment in 2004-05 was approximately $ 57 billion with FDI of about $ 5 billion. For an over 8% p.a. GDP growth, with an assumed Incremental Capital Output Ratio (ICOR) of 4.08, the investment needed is over 32% of GDP. In comparison, it is only in FY 05 that the total investment (GDCF) has increased to about 30% of GDP.
Required levels of Investment
To achieve a sustained GDP growth of over 8%, India will require over $1.5 trillion9 of capital investment over the next 5 years, across the public and private sectors as indicated in Table 2.
5 Includes investment by Government, PSUs, municipalities and errors & omissions. 6 Gross Domestic Capital Formation; this includes ‘Valuables’ based on the latest methodology 7 GDP at market prices for 2001-02 and 2002-03 is at 1993-94 prices (old series) 8 The ICOR is currently about 3.6, but is likely to increase with major investment expected in manufacturing and infrastructure. For forecasting required investment the ICOR used is 4.0. 9 At 2005-06 prices, and with the assumed ICOR
Investment Objectives
Investment Commission
7
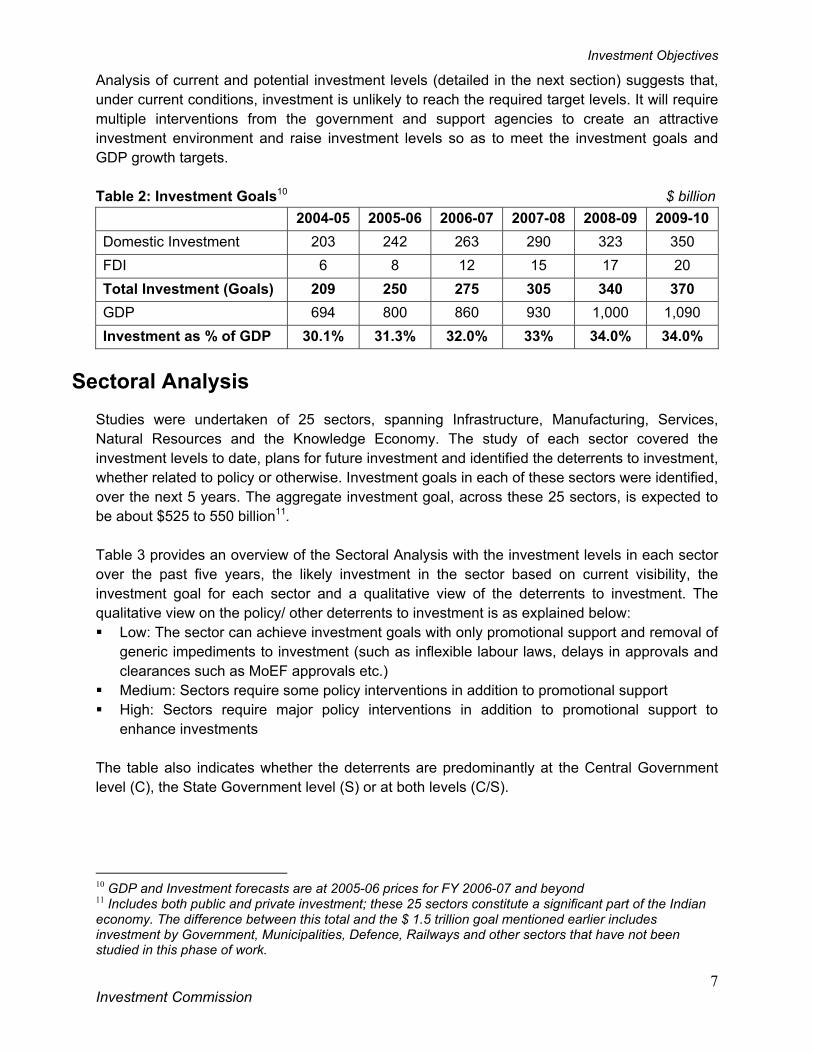
Analysis of current and potential investment levels (detailed in the next section) suggests that, under current conditions, investment is unlikely to reach the required target levels. It will require multiple interventions from the government and support agencies to create an attractive investment environment and raise investment levels so as to meet the investment goals and GDP growth targets. Table 2: Investment Goals10 $ billion
2004-05 2005-06 2006-07 2007-08 2008-09 2009-10 Domestic Investment 203 242 263 290 323 350 FDI 6 8 12 15 17 20 Total Investment (Goals) 209 250 275 305 340 370 GDP 694 800 860 930 1,000 1,090 Investment as % of GDP 30.1% 31.3% 32.0% 33% 34.0% 34.0%
Sectoral Analysis
Studies were undertaken of 25 sectors, spanning Infrastructure, Manufacturing, Services, Natural Resources and the Knowledge Economy. The study of each sector covered the investment levels to date, plans for future investment and identified the deterrents to investment, whether related to policy or otherwise. Investment goals in each of these sectors were identified, over the next 5 years. The aggregate investment goal, across these 25 sectors, is expected to be about $525 to 550 billion11. Table 3 provides an overview of the Sectoral Analysis with the investment levels in each sector over the past five years, the likely investment in the sector based on current visibility, the investment goal for each sector and a qualitative view of the deterrents to investment. The qualitative view on the policy/ other deterrents to investment is as explained below: Low: The sector can achieve investment goals with only promotional support and removal of
generic impediments to investment (such as inflexible labour laws, delays in approvals and clearances such as MoEF approvals etc.)
Medium: Sectors require some policy interventions in addition to promotional support High: Sectors require major policy interventions in addition to promotional support to
enhance investments The table also indicates whether the deterrents are predominantly at the Central Government level (C), the State Government level (S) or at both levels (C/S).
10 GDP and Investment forecasts are at 2005-06 prices for FY 2006-07 and beyond 11 Includes both public and private investment; these 25 sectors constitute a significant part of the Indian economy. The difference between this total and the $ 1.5 trillion goal mentioned earlier includes investment by Government, Municipalities, Defence, Railways and other sectors that have not been studied in this phase of work.
Investment Objectives
Investment Commission
8
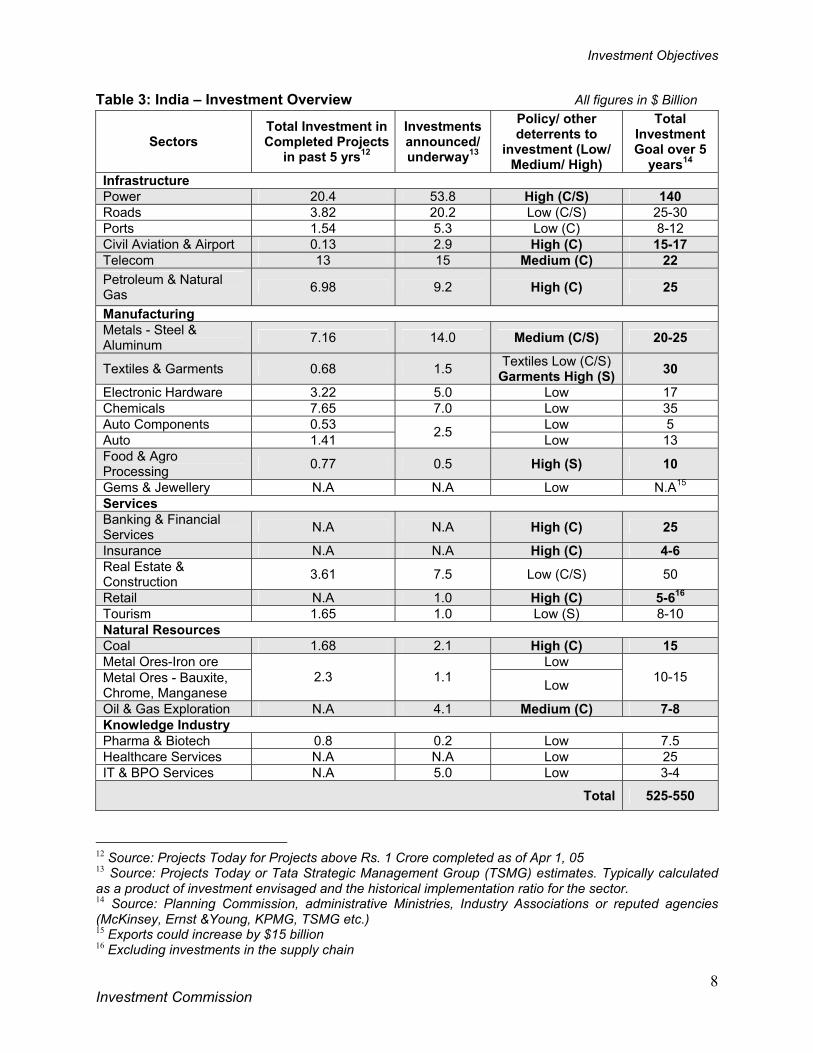
Table 3: India – Investment Overview All figures in $ Billion
Sectors Total Investment in Completed Projects
in past 5 yrs12
Investments announced/ underway13
Policy/ other deterrents to
investment (Low/ Medium/ High)
Total Investment Goal over 5
years14 Infrastructure Power 20.4 53.8 High (C/S) 140 Roads 3.82 20.2 Low (C/S) 25-30 Ports 1.54 5.3 Low (C) 8-12 Civil Aviation & Airport 0.13 2.9 High (C) 15-17 Telecom 13 15 Medium (C) 22 Petroleum & Natural Gas 6.98 9.2 High (C) 25
Manufacturing Metals - Steel & Aluminum 7.16 14.0 Medium (C/S) 20-25
Textiles & Garments 0.68 1.5 Textiles Low (C/S) Garments High (S) 30
Electronic Hardware 3.22 5.0 Low 17 Chemicals 7.65 7.0 Low 35 Auto Components 0.53 Low 5 Auto 1.41 2.5 Low 13 Food & Agro Processing 0.77 0.5 High (S) 10
Gems & Jewellery N.A N.A Low N.A15 Services Banking & Financial Services N.A N.A High (C) 25
Insurance N.A N.A High (C) 4-6 Real Estate & Construction 3.61 7.5 Low (C/S) 50
Retail N.A 1.0 High (C) 5-616 Tourism 1.65 1.0 Low (S) 8-10 Natural Resources Coal 1.68 2.1 High (C) 15 Metal Ores-Iron ore Low Metal Ores - Bauxite, Chrome, Manganese
2.3 1.1 Low 10-15
Oil & Gas Exploration N.A 4.1 Medium (C) 7-8 Knowledge Industry Pharma & Biotech 0.8 0.2 Low 7.5 Healthcare Services N.A N.A Low 25 IT & BPO Services N.A 5.0 Low 3-4
Total 525-550
12 Source: Projects Today for Projects above Rs. 1 Crore completed as of Apr 1, 05 13 Source: Projects Today or Tata Strategic Management Group (TSMG) estimates. Typically calculated as a product of investment envisaged and the historical implementation ratio for the sector. 14 Source: Planning Commission, administrative Ministries, Industry Associations or reputed agencies (McKinsey, Ernst &Young, KPMG, TSMG etc.) 15 Exports could increase by $15 billion 16 Excluding investments in the supply chain
Investor Interactions
Investment Commission
9
Investor Interactions
Investment Commission
10
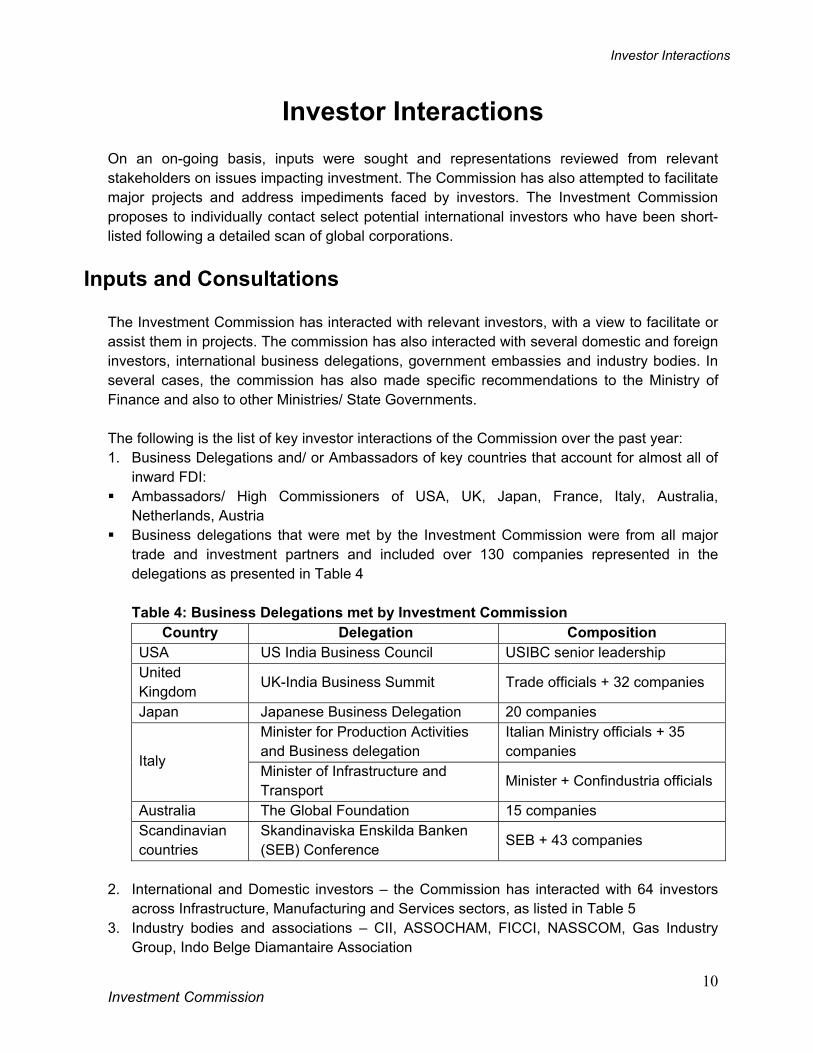
Investor Interactions On an on-going basis, inputs were sought and representations reviewed from relevant stakeholders on issues impacting investment. The Commission has also attempted to facilitate major projects and address impediments faced by investors. The Investment Commission proposes to individually contact select potential international investors who have been short-listed following a detailed scan of global corporations.
Inputs and Consultations The Investment Commission has interacted with relevant investors, with a view to facilitate or assist them in projects. The commission has also interacted with several domestic and foreign investors, international business delegations, government embassies and industry bodies. In several cases, the commission has also made specific recommendations to the Ministry of Finance and also to other Ministries/ State Governments.
The following is the list of key investor interactions of the Commission over the past year: 1. Business Delegations and/ or Ambassadors of key countries that account for almost all of
inward FDI: Ambassadors/ High Commissioners of USA, UK, Japan, France, Italy, Australia,
Netherlands, Austria Business delegations that were met by the Investment Commission were from all major
trade and investment partners and included over 130 companies represented in the delegations as presented in Table 4 Table 4: Business Delegations met by Investment Commission
Country Delegation Composition USA US India Business Council USIBC senior leadership United Kingdom UK-India Business Summit Trade officials + 32 companies
Japan Japanese Business Delegation 20 companies Minister for Production Activities and Business delegation
Italian Ministry officials + 35 companies
Italy Minister of Infrastructure and Transport Minister + Confindustria officials
Australia The Global Foundation 15 companies Scandinavian countries
Skandinaviska Enskilda Banken (SEB) Conference SEB + 43 companies
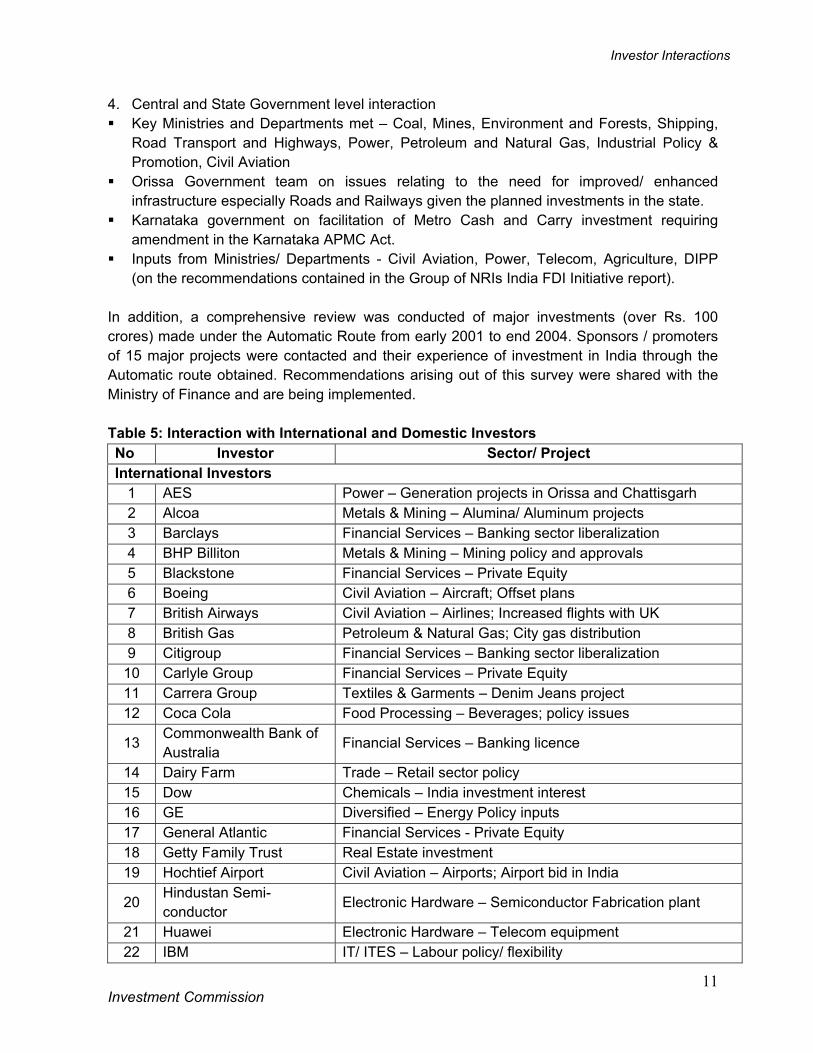
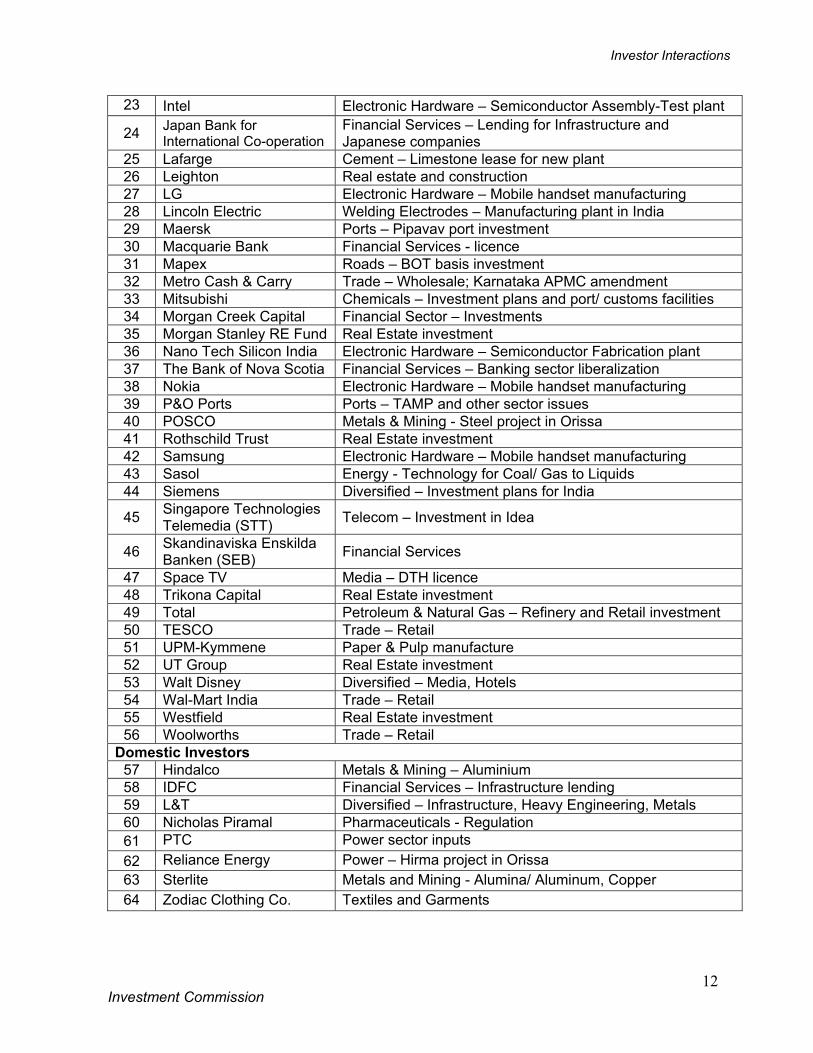
2. International and Domestic investors – the Commission has interacted with 64 investors
across Infrastructure, Manufacturing and Services sectors, as listed in Table 5 3. Industry bodies and associations – CII, ASSOCHAM, FICCI, NASSCOM, Gas Industry
Group, Indo Belge Diamantaire Association
Investor Interactions
Investment Commission
11
4. Central and State Government level interaction Key Ministries and Departments met – Coal, Mines, Environment and Forests, Shipping,
Road Transport and Highways, Power, Petroleum and Natural Gas, Industrial Policy & Promotion, Civil Aviation
Orissa Government team on issues relating to the need for improved/ enhanced infrastructure especially Roads and Railways given the planned investments in the state.
Karnataka government on facilitation of Metro Cash and Carry investment requiring amendment in the Karnataka APMC Act.
Inputs from Ministries/ Departments - Civil Aviation, Power, Telecom, Agriculture, DIPP (on the recommendations contained in the Group of NRIs India FDI Initiative report).
In addition, a comprehensive review was conducted of major investments (over Rs. 100 crores) made under the Automatic Route from early 2001 to end 2004. Sponsors / promoters of 15 major projects were contacted and their experience of investment in India through the Automatic route obtained. Recommendations arising out of this survey were shared with the Ministry of Finance and are being implemented. Table 5: Interaction with International and Domestic Investors No Investor Sector/ Project International Investors
1 AES Power – Generation projects in Orissa and Chattisgarh 2 Alcoa Metals & Mining – Alumina/ Aluminum projects 3 Barclays Financial Services – Banking sector liberalization 4 BHP Billiton Metals & Mining – Mining policy and approvals 5 Blackstone Financial Services – Private Equity 6 Boeing Civil Aviation – Aircraft; Offset plans 7 British Airways Civil Aviation – Airlines; Increased flights with UK 8 British Gas Petroleum & Natural Gas; City gas distribution 9 Citigroup Financial Services – Banking sector liberalization
10 Carlyle Group Financial Services – Private Equity 11 Carrera Group Textiles & Garments – Denim Jeans project 12 Coca Cola Food Processing – Beverages; policy issues
13 Commonwealth Bank of Australia Financial Services – Banking licence
14 Dairy Farm Trade – Retail sector policy 15 Dow Chemicals – India investment interest 16 GE Diversified – Energy Policy inputs 17 General Atlantic Financial Services - Private Equity 18 Getty Family Trust Real Estate investment 19 Hochtief Airport Civil Aviation – Airports; Airport bid in India
20 Hindustan Semi-conductor Electronic Hardware – Semiconductor Fabrication plant
21 Huawei Electronic Hardware – Telecom equipment 22 IBM IT/ ITES – Labour policy/ flexibility
Investor Interactions
Investment Commission
12
23 Intel Electronic Hardware – Semiconductor Assembly-Test plant
24 Japan Bank for International Co-operation
Financial Services – Lending for Infrastructure and Japanese companies
25 Lafarge Cement – Limestone lease for new plant 26 Leighton Real estate and construction 27 LG Electronic Hardware – Mobile handset manufacturing 28 Lincoln Electric Welding Electrodes – Manufacturing plant in India 29 Maersk Ports – Pipavav port investment 30 Macquarie Bank Financial Services - licence 31 Mapex Roads – BOT basis investment 32 Metro Cash & Carry Trade – Wholesale; Karnataka APMC amendment 33 Mitsubishi Chemicals – Investment plans and port/ customs facilities 34 Morgan Creek Capital Financial Sector – Investments 35 Morgan Stanley RE Fund Real Estate investment 36 Nano Tech Silicon India Electronic Hardware – Semiconductor Fabrication plant 37 The Bank of Nova Scotia Financial Services – Banking sector liberalization 38 Nokia Electronic Hardware – Mobile handset manufacturing 39 P&O Ports Ports – TAMP and other sector issues 40 POSCO Metals & Mining - Steel project in Orissa 41 Rothschild Trust Real Estate investment 42 Samsung Electronic Hardware – Mobile handset manufacturing 43 Sasol Energy - Technology for Coal/ Gas to Liquids 44 Siemens Diversified – Investment plans for India
45 Singapore Technologies Telemedia (STT) Telecom – Investment in Idea
46 Skandinaviska Enskilda Banken (SEB) Financial Services
47 Space TV Media – DTH licence 48 Trikona Capital Real Estate investment 49 Total Petroleum & Natural Gas – Refinery and Retail investment 50 TESCO Trade – Retail 51 UPM-Kymmene Paper & Pulp manufacture 52 UT Group Real Estate investment 53 Walt Disney Diversified – Media, Hotels 54 Wal-Mart India Trade – Retail 55 Westfield Real Estate investment 56 Woolworths Trade – Retail
Domestic Investors 57 Hindalco Metals & Mining – Aluminium 58 IDFC Financial Services – Infrastructure lending 59 L&T Diversified – Infrastructure, Heavy Engineering, Metals 60 Nicholas Piramal Pharmaceuticals - Regulation 61 PTC Power sector inputs 62 Reliance Energy Power – Hirma project in Orissa 63 Sterlite Metals and Mining - Alumina/ Aluminum, Copper 64 Zodiac Clothing Co. Textiles and Garments
Investor Interactions
Investment Commission
13
Projects and Representations
Arising out of the Investment Commission’s interaction with investors, projects were identified for facilitation/ support; and representations17 on policy/ procedures or other impediments were either resolved through reference to the Finance Ministry or have been incorporated in the recommendations outlined later in this report.
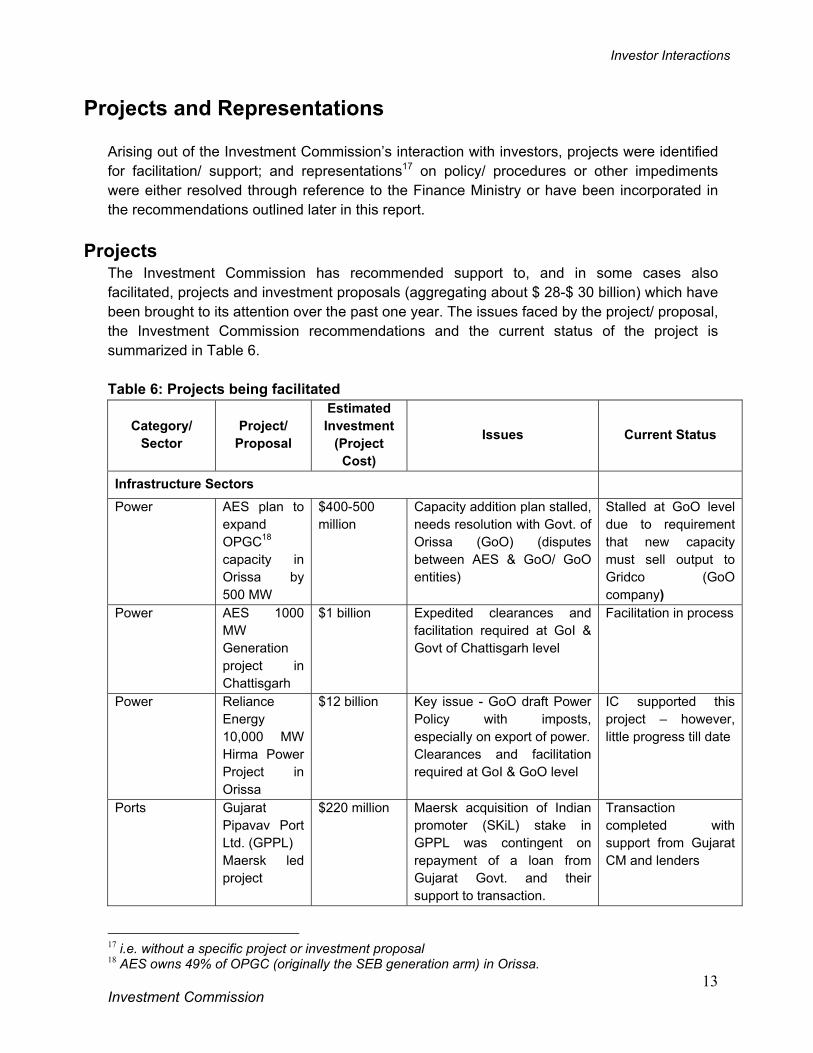
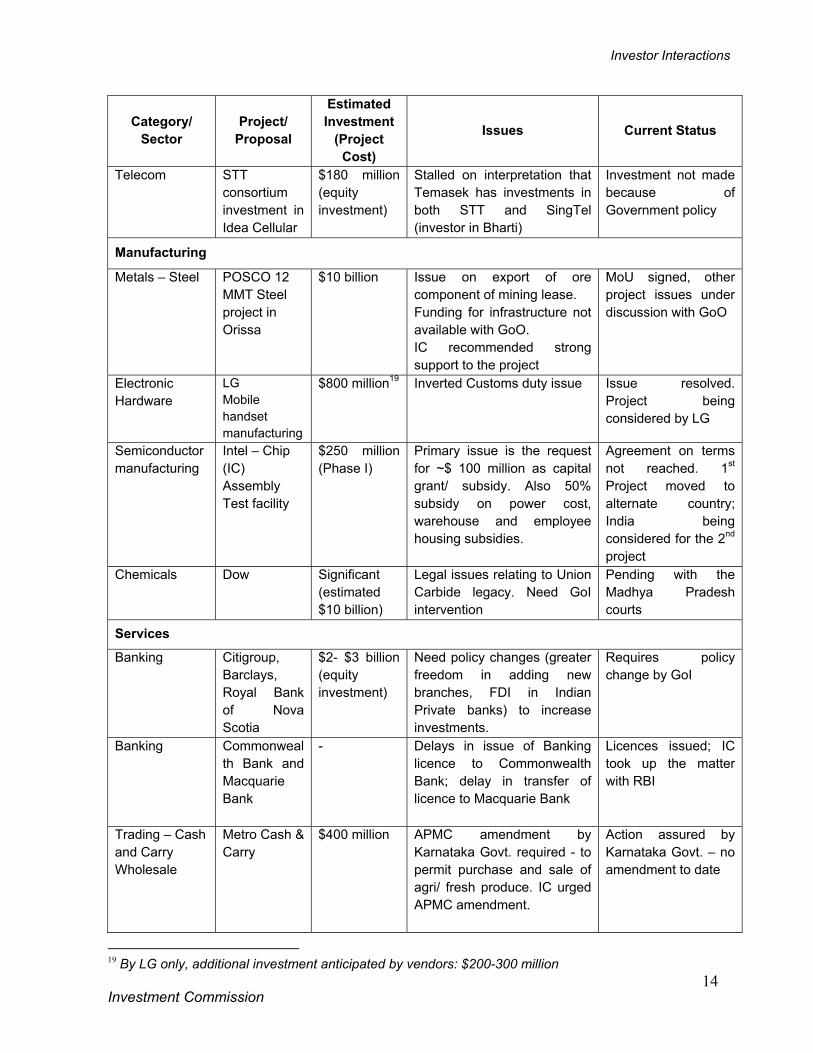
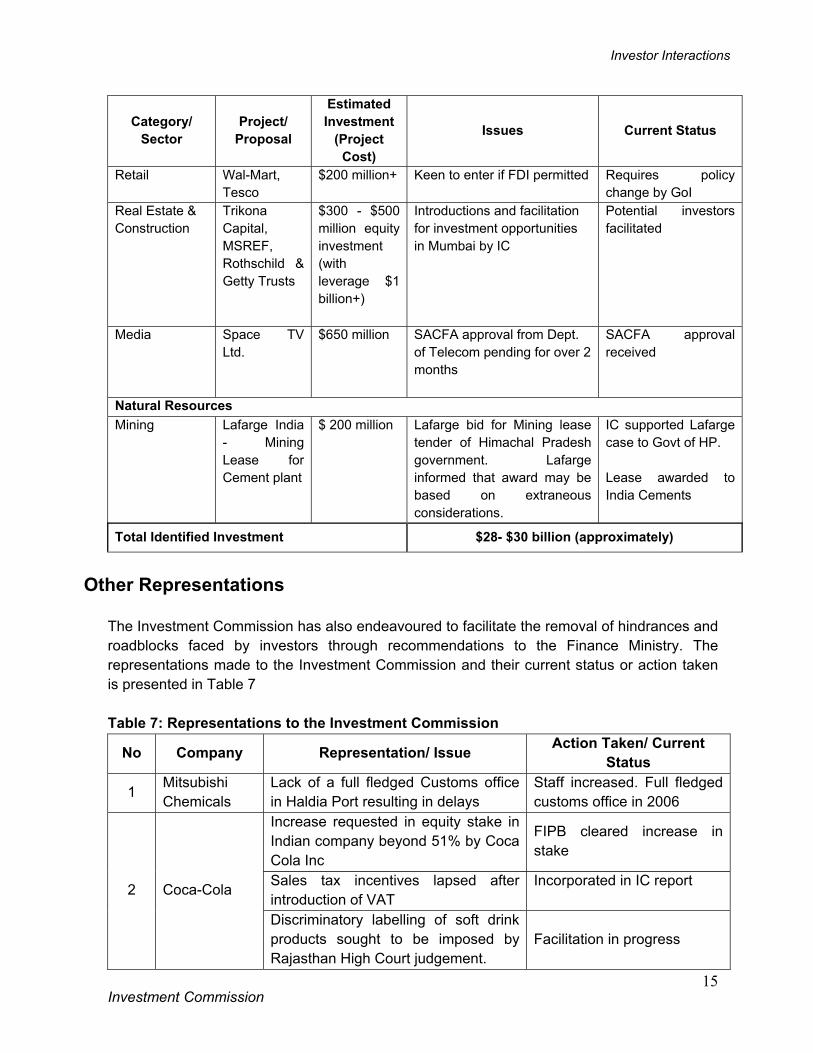
Projects The Investment Commission has recommended support to, and in some cases also facilitated, projects and investment proposals (aggregating about $ 28-$ 30 billion) which have been brought to its attention over the past one year. The issues faced by the project/ proposal, the Investment Commission recommendations and the current status of the project is summarized in Table 6. Table 6: Projects being facilitated
Category/ Sector
Project/ Proposal
Estimated Investment
(Project Cost)
Issues Current Status
Infrastructure Sectors
Power AES plan to expand OPGC18 capacity in Orissa by 500 MW
$400-500 million
Capacity addition plan stalled, needs resolution with Govt. of Orissa (GoO) (disputes between AES & GoO/ GoO entities)
Stalled at GoO level due to requirement that new capacity must sell output to Gridco (GoO company)
Power AES 1000 MW Generation project in Chattisgarh
$1 billion Expedited clearances and facilitation required at GoI & Govt of Chattisgarh level
Facilitation in process
Power Reliance Energy 10,000 MW Hirma Power Project in Orissa
$12 billion Key issue - GoO draft Power Policy with imposts, especially on export of power. Clearances and facilitation required at GoI & GoO level
IC supported this project – however, little progress till date
Ports
Gujarat Pipavav Port Ltd. (GPPL) Maersk led project
$220 million Maersk acquisition of Indian promoter (SKiL) stake in GPPL was contingent on repayment of a loan from Gujarat Govt. and their support to transaction.
Transaction completed with support from Gujarat CM and lenders
17 i.e. without a specific project or investment proposal 18 AES owns 49% of OPGC (originally the SEB generation arm) in Orissa.
Investor Interactions
Investment Commission
14
Category/ Sector
Project/ Proposal
Estimated Investment
(Project Cost)
Issues Current Status
Telecom
STT consortium investment in Idea Cellular
$180 million (equity investment)
Stalled on interpretation that Temasek has investments in both STT and SingTel (investor in Bharti)
Investment not made because of Government policy
Manufacturing
Metals – Steel POSCO 12 MMT Steel project in Orissa
$10 billion
Issue on export of ore component of mining lease. Funding for infrastructure not available with GoO. IC recommended strong support to the project
MoU signed, other project issues under discussion with GoO
Electronic Hardware
LG Mobile handset manufacturing
$800 million19
Inverted Customs duty issue Issue resolved. Project being considered by LG
Semiconductor manufacturing
Intel – Chip (IC) Assembly Test facility
$250 million (Phase I)
Primary issue is the request for ~$ 100 million as capital grant/ subsidy. Also 50% subsidy on power cost, warehouse and employee housing subsidies.
Agreement on terms not reached. 1st Project moved to alternate country; India being considered for the 2nd project
Chemicals
Dow
Significant (estimated $10 billion)
Legal issues relating to Union Carbide legacy. Need GoI intervention
Pending with the Madhya Pradesh courts
Services
Banking Citigroup, Barclays, Royal Bank of Nova Scotia
$2- $3 billion (equity investment)
Need policy changes (greater freedom in adding new branches, FDI in Indian Private banks) to increase investments.
Requires policy change by GoI
Banking Commonwealth Bank and Macquarie Bank
- Delays in issue of Banking licence to Commonwealth Bank; delay in transfer of licence to Macquarie Bank
Licences issued; IC took up the matter with RBI
Trading – Cash and Carry Wholesale
Metro Cash & Carry
$400 million APMC amendment by Karnataka Govt. required - to permit purchase and sale of agri/ fresh produce. IC urged APMC amendment.
Action assured by Karnataka Govt. – no amendment to date
19 By LG only, additional investment anticipated by vendors: $200-300 million
Investor Interactions
Investment Commission
15
Category/ Sector
Project/ Proposal
Estimated Investment
(Project Cost)
Issues Current Status
Retail Wal-Mart, Tesco
$200 million+ Keen to enter if FDI permitted Requires policy change by GoI
Real Estate & Construction
Trikona Capital, MSREF, Rothschild & Getty Trusts
$300 - $500 million equity investment (with leverage $1 billion+)
Introductions and facilitation for investment opportunities in Mumbai by IC
Potential investors facilitated
Media Space TV Ltd.
$650 million SACFA approval from Dept. of Telecom pending for over 2 months
SACFA approval received
Natural Resources Mining
Lafarge India - Mining Lease for Cement plant
$ 200 million Lafarge bid for Mining lease tender of Himachal Pradesh government. Lafarge informed that award may be based on extraneous considerations.
IC supported Lafarge case to Govt of HP. Lease awarded to India Cements
Total Identified Investment $28- $30 billion (approximately)
Other Representations
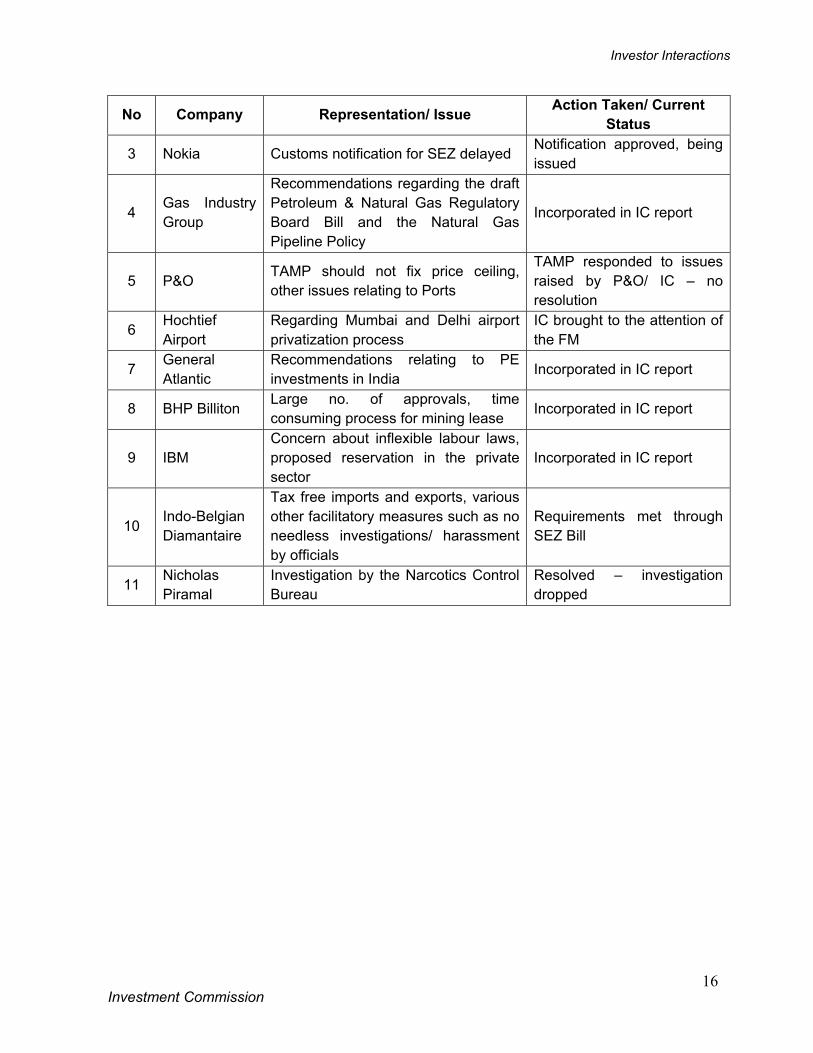
The Investment Commission has also endeavoured to facilitate the removal of hindrances and roadblocks faced by investors through recommendations to the Finance Ministry. The representations made to the Investment Commission and their current status or action taken is presented in Table 7 Table 7: Representations to the Investment Commission
No Company Representation/ Issue Action Taken/ Current Status
1 Mitsubishi Chemicals
Lack of a full fledged Customs office in Haldia Port resulting in delays
Staff increased. Full fledged customs office in 2006
Increase requested in equity stake in Indian company beyond 51% by Coca Cola Inc
FIPB cleared increase in stake
Sales tax incentives lapsed after introduction of VAT
Incorporated in IC report
2 Coca-Cola
Discriminatory labelling of soft drink products sought to be imposed by Rajasthan High Court judgement.
Facilitation in progress
Investor Interactions
Investment Commission
16
No Company Representation/ Issue Action Taken/ Current Status
3 Nokia Customs notification for SEZ delayed Notification approved, being issued
4 Gas Industry Group
Recommendations regarding the draft Petroleum & Natural Gas Regulatory Board Bill and the Natural Gas Pipeline Policy
Incorporated in IC report
5 P&O TAMP should not fix price ceiling, other issues relating to Ports
TAMP responded to issues raised by P&O/ IC – no resolution
6 Hochtief Airport
Regarding Mumbai and Delhi airport privatization process
IC brought to the attention of the FM
7 General Atlantic
Recommendations relating to PE investments in India
Incorporated in IC report
8 BHP Billiton Large no. of approvals, time consuming process for mining lease Incorporated in IC report
9 IBM Concern about inflexible labour laws, proposed reservation in the private sector
Incorporated in IC report
10 Indo-Belgian Diamantaire
Tax free imports and exports, various other facilitatory measures such as no needless investigations/ harassment by officials
Requirements met through SEZ Bill
11 Nicholas Piramal
Investigation by the Narcotics Control Bureau
Resolved – investigation dropped
Investor Interactions
Investment Commission
17
Potential Investors & Issues
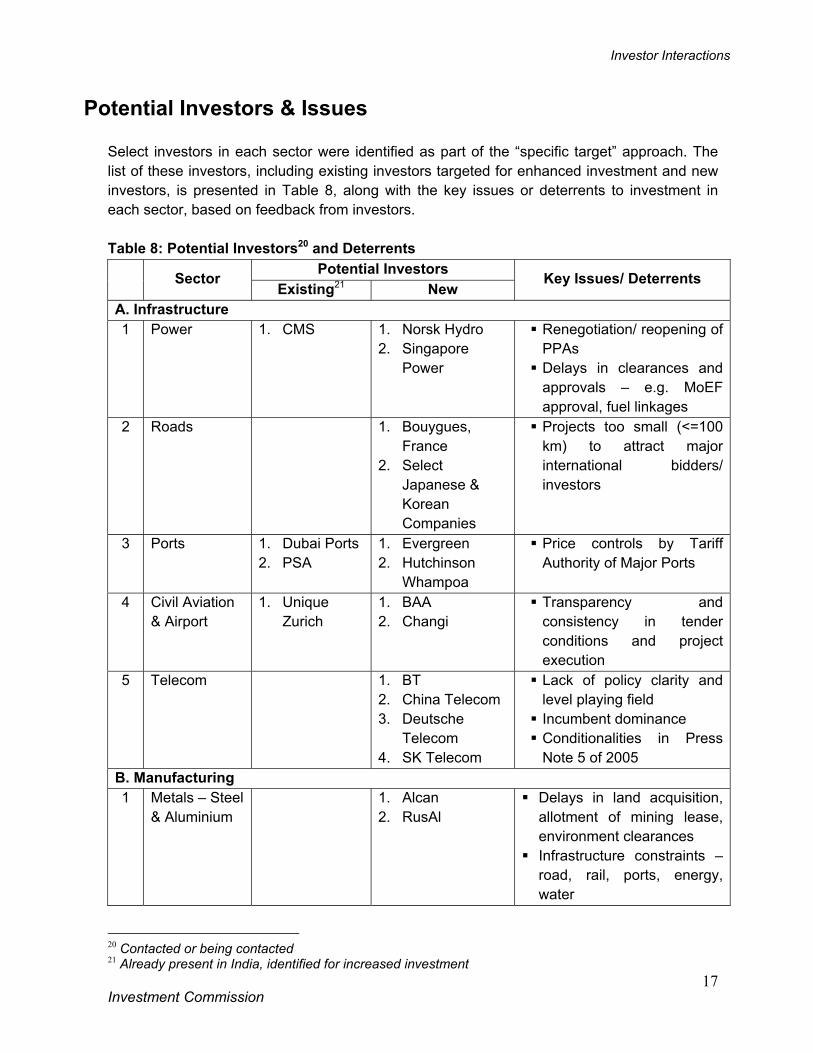
Select investors in each sector were identified as part of the “specific target” approach. The list of these investors, including existing investors targeted for enhanced investment and new investors, is presented in Table 8, along with the key issues or deterrents to investment in each sector, based on feedback from investors. Table 8: Potential Investors20 and Deterrents
Potential Investors Sector
Existing21 New Key Issues/ Deterrents
A. Infrastructure 1 Power 1. CMS 1. Norsk Hydro
2. Singapore Power
Renegotiation/ reopening of PPAs
Delays in clearances and approvals – e.g. MoEF approval, fuel linkages
2 Roads 1. Bouygues, France
2. Select Japanese & Korean Companies
Projects too small (<=100 km) to attract major international bidders/ investors
3 Ports 1. Dubai Ports 2. PSA
1. Evergreen 2. Hutchinson
Whampoa
Price controls by Tariff Authority of Major Ports
4 Civil Aviation & Airport
1. Unique Zurich
1. BAA 2. Changi
Transparency and consistency in tender conditions and project execution
5 Telecom 1. BT 2. China Telecom 3. Deutsche
Telecom 4. SK Telecom
Lack of policy clarity and level playing field
Incumbent dominance Conditionalities in Press Note 5 of 2005
B. Manufacturing 1 Metals – Steel
& Aluminium 1. Alcan
2. RusAl Delays in land acquisition,
allotment of mining lease, environment clearances
Infrastructure constraints – road, rail, ports, energy, water
20 Contacted or being contacted 21 Already present in India, identified for increased investment
Investor Interactions
Investment Commission
18
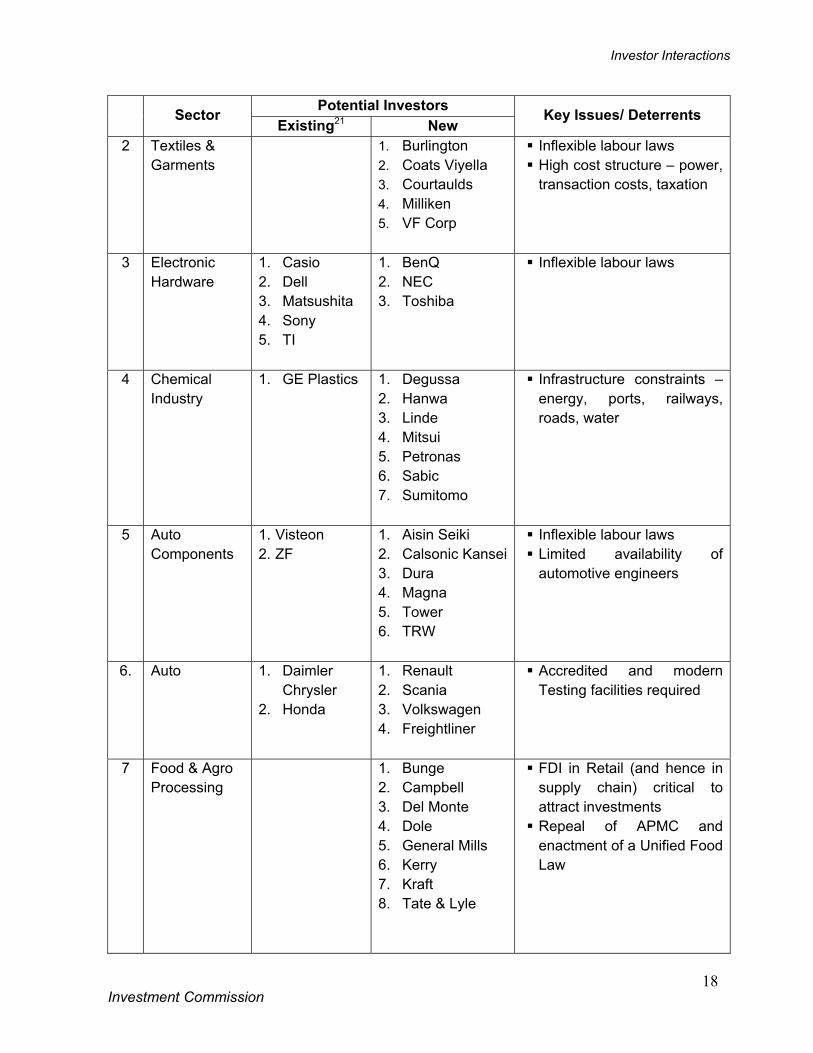
Potential Investors Sector
Existing21 New Key Issues/ Deterrents
2 Textiles & Garments
1. Burlington 2. Coats Viyella 3. Courtaulds 4. Milliken 5. VF Corp
Inflexible labour laws High cost structure – power, transaction costs, taxation
3 Electronic Hardware
1. Casio 2. Dell 3. Matsushita 4. Sony 5. TI
1. BenQ 2. NEC 3. Toshiba
Inflexible labour laws
4 Chemical Industry
1. GE Plastics
1. Degussa 2. Hanwa 3. Linde 4. Mitsui 5. Petronas 6. Sabic 7. Sumitomo
Infrastructure constraints – energy, ports, railways, roads, water
5 Auto Components
1. Visteon 2. ZF
1. Aisin Seiki 2. Calsonic Kansei3. Dura 4. Magna 5. Tower 6. TRW
Inflexible labour laws Limited availability of automotive engineers
6. Auto 1. Daimler Chrysler
2. Honda
1. Renault 2. Scania 3. Volkswagen 4. Freightliner
Accredited and modern Testing facilities required
7 Food & Agro Processing
1. Bunge 2. Campbell 3. Del Monte 4. Dole 5. General Mills 6. Kerry 7. Kraft 8. Tate & Lyle
FDI in Retail (and hence in supply chain) critical to attract investments
Repeal of APMC and enactment of a Unified Food Law
Investor Interactions
Investment Commission
19
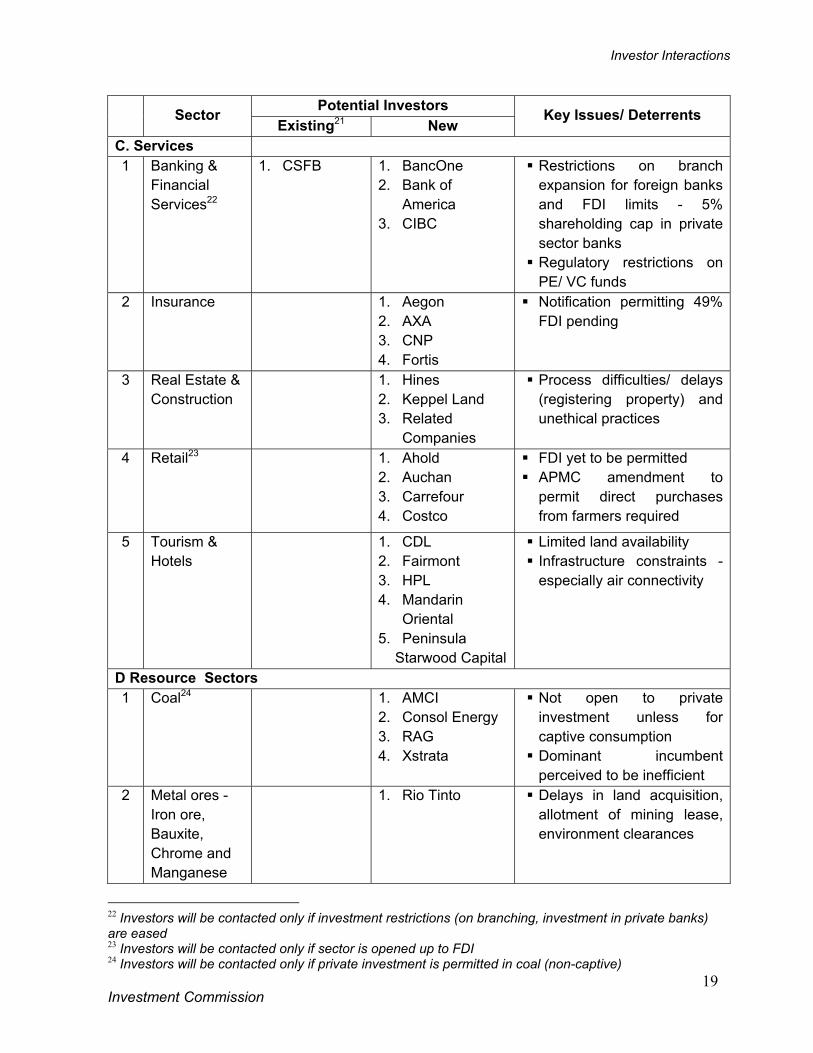
Potential Investors Sector
Existing21 New Key Issues/ Deterrents
C. Services 1 Banking &
Financial Services22
1. CSFB 1. BancOne 2. Bank of
America 3. CIBC
Restrictions on branch expansion for foreign banks and FDI limits - 5% shareholding cap in private sector banks
Regulatory restrictions on PE/ VC funds
2 Insurance 1. Aegon 2. AXA 3. CNP 4. Fortis
Notification permitting 49% FDI pending
3 Real Estate & Construction
1. Hines 2. Keppel Land 3. Related
Companies
Process difficulties/ delays (registering property) and unethical practices
4 Retail23 1. Ahold 2. Auchan 3. Carrefour 4. Costco
FDI yet to be permitted APMC amendment to
permit direct purchases from farmers required
5 Tourism & Hotels
1. CDL 2. Fairmont 3. HPL 4. Mandarin
Oriental 5. Peninsula
Starwood Capital
Limited land availability Infrastructure constraints - especially air connectivity
D Resource Sectors 1 Coal24 1. AMCI
2. Consol Energy 3. RAG 4. Xstrata
Not open to private investment unless for captive consumption
Dominant incumbent perceived to be inefficient
2 Metal ores - Iron ore, Bauxite, Chrome and Manganese
1. Rio Tinto
Delays in land acquisition, allotment of mining lease, environment clearances
22 Investors will be contacted only if investment restrictions (on branching, investment in private banks) are eased 23 Investors will be contacted only if sector is opened up to FDI 24 Investors will be contacted only if private investment is permitted in coal (non-captive)
Investor Interactions
Investment Commission
20
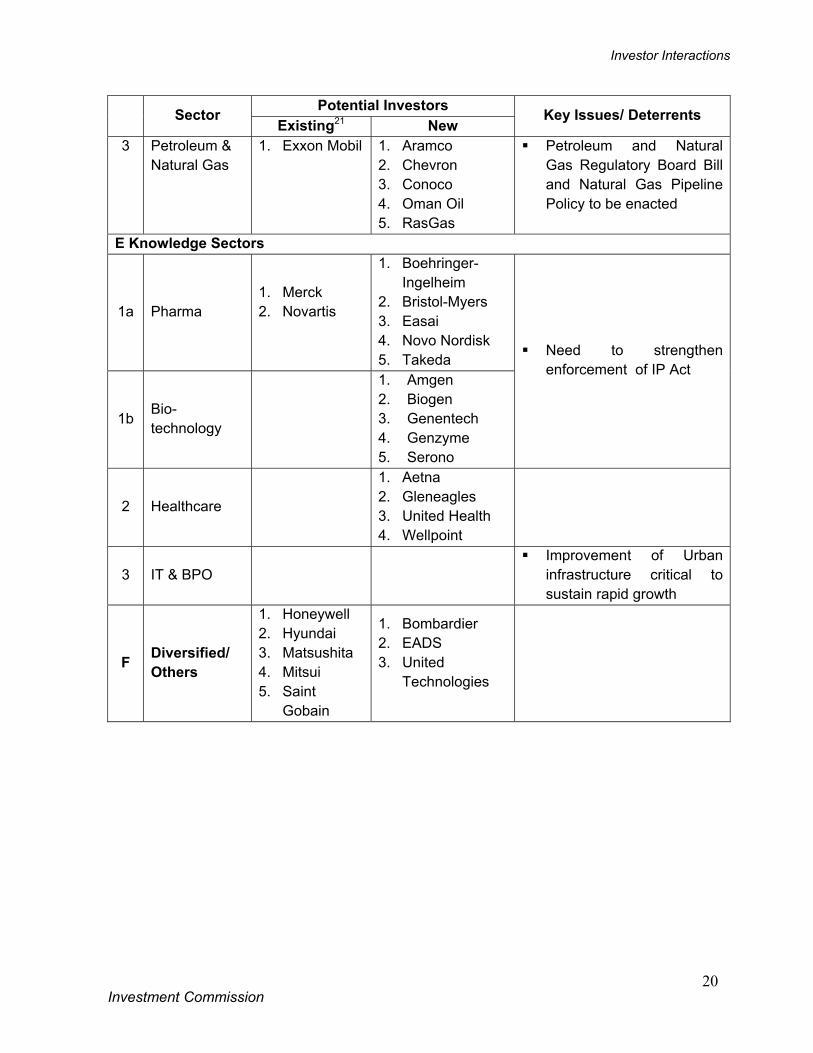
Potential Investors Sector
Existing21 New Key Issues/ Deterrents
3 Petroleum & Natural Gas
1. Exxon Mobil
1. Aramco 2. Chevron 3. Conoco 4. Oman Oil 5. RasGas
Petroleum and Natural Gas Regulatory Board Bill and Natural Gas Pipeline Policy to be enacted
E Knowledge Sectors
1a Pharma 1. Merck 2. Novartis
1. Boehringer-Ingelheim
2. Bristol-Myers 3. Easai 4. Novo Nordisk 5. Takeda
1b Bio-technology
1. Amgen 2. Biogen 3. Genentech 4. Genzyme 5. Serono
Need to strengthen enforcement of IP Act
2 Healthcare
1. Aetna 2. Gleneagles 3. United Health 4. Wellpoint
3 IT & BPO Improvement of Urban
infrastructure critical to sustain rapid growth
F Diversified/ Others
1. Honeywell 2. Hyundai 3. Matsushita 4. Mitsui 5. Saint
Gobain
1. Bombardier 2. EADS 3. United
Technologies
Investor Interactions
Investment Commission
21
Impediments to Investment Based on interaction with investors the following major impediments have been identified. These impact multiple sectors and prevent realization of India’s investment potential.
Policy related impediments 1. Investment restrictions and/ or entry route barriers in several sectors of significant
investment potential/ investor interest Specific sectors include Banking (RBI approval required for FDI beyond 5% in private
banks, restrictions on branching), Private Equity and Venture Capital (regulatory constraints), Insurance (26% FDI cap), Retail (closed to FDI for multi-brand), Coal Mining (closed to private sector investment except for captive mines) and Media (0% to 49% for various services) • Over 20% of FDI outflows from developed countries25 are in Banking, Financial
Services and Insurance. China has secured FDI of over $16 billion in Banking26 in 2005 alone.
• Retail and Mining have also received high FDI from developed countries.
2. Absence of long-term policies, non-implementation / reversal of policy and breach of contract
Absence of broad time-line to increase FDI sector caps/ opening up sectors such as Banking and Insurance. CONCOR monopoly still largely in place despite announcement to end this in Feb 05.
Lack of long-term Taxation policy. Reversal of stated policy e.g. Withdrawal of Sales tax benefits post VAT
implementation without transition / remission measures (Japanese Ambassador representation on Honda Motorcycle case, Coca-Cola representation on sales tax incentive withdrawal)
Breach of contract, especially at the State Government level e.g. re-opening/ renegotiation of PPA’s – Tamil Nadu IPPs, AES.
3. Lack of level playing field - especially in sectors with PSU dominance
Sectors brought to the attention of the IC where PSUs receive preferential treatment include Telecom (BSNL Interconnect issues, ADC), Power (preferential treatment in allotment of fuel/ fuel linkages, payment guarantees), Mining & Metals (allotment of mining leases, land acquisition) and LPG (subsidies to PSUs).
Issue exacerbated by a perceived lack of regulator independence. In sectors like Banking foreign investors face discrimination compared to domestic
investors (branching restrictions on foreign banks). Discrimination against certain investors by approvals delayed or denied – IC has
received representations from Huawei27, Space TV. 25 Such as USA, Japan, UK and Canada 26 By sale of minority stakes (5-20%) in Chinese Government owned banks.
Investor Interactions
Investment Commission
22
4. Inflexible labour laws
Two primary concerns: • Chapter V (B) of the Industrial Disputes (ID) Act – state government approval
required for retrenchment or closure (which is almost never granted). • Contract Labour (Abolition & Regulation) Act – contract labour permitted only in
‘non-core’28 areas. Serious concerns expressed regarding proposed caste/ ethnicity based employment
reservation in the private sector.
5. Many agencies engaged in doing the same or similar activities relating to FDI Overlap between activities of FIPB, DIPP, FIIA, IC, SIA etc. No One- Stop-Shop / Single Window for foreign investors ; neither in the Centre nor
in the States No ‘ownership’ in the government for ensuring/ facilitating Investment – investors
often find themselves shuffled from one Ministry to another.
Business environment related Impediments 1. Bureaucratic delays, discretionary interpretation, vested interest, bias and
subjective practices Too many touch points with officials – numerous approvals and agencies at Central
and State Government level e.g. REL Hirma Project, BHP Billiton29. Laws, policy statutes inadequately defined – excessive scope for discretionary
interpretation e.g. Coca Cola labelling issue. Vested interests constrain investment in a host of sectors, driven by interested
private and public sector groups resisting competition. Government policy has often been changed to support the causes of such groups.
Subjective decisions and corrupt practices • India has been ranked 90 in the Corruption Perception Index, worse than China
(71), Brazil (59), and Singapore (5) by Transparency International • Special Mention: Approvals from Ministry of Environment & Forests seen
as a major hurdle.
2. Centre-State divergence on investment related policies Divergence between state government and central government on policy e.g. Power
reforms/ Draft Power Policy in Orissa30, VAT implementation.
27 Huawei proposal to supply to turnkey telecom projects in India. Application to FIPB of March 14th 2005 has still not been cleared whereas Nokia, Nortel, Alcatel etc. are all in the same business. 28 Non-core definition also lacks specificity 29 79 different approvals required for a mining licence as per BHP Billiton 30 Orissa Government’s Draft Power Policy intends to levy environment charges on a per MW capacity basis as well as requires a proportion of power generated and power exported from the State to be sold to the State at variable cost.
Investor Interactions
Investment Commission
23
Some state governments are less welcoming of investors than others e.g. experience of Metro Cash & Carry in Karnataka.
3. High cost of entry, transactions and exit; ineffective dispute resolution
India ranked 116 among 155 countries on ease of doing business (World Bank). • Setting up or closing business in India requires 20% to 100% more paper-work
and takes twice as long as the average of other Asian countries. Lack of adequate trade facilitation and high transaction costs31. Archaic laws - Industrial Disputes Act, The Companies Act, Telegraph Act, Contract
Labour (Abolition & Regulation) Act, and Coastal Regulation Zone (CRZ) Act applied to cities.
Lack of speedy resolution of disputes. • In-ordinate delays in dispute resolution – lack of Government resolution, long
court procedures and ability of NGOs and others to litigate endlessly e.g. Dabhol power, Tamil Nadu IPPs, Dow Chemicals – Bhopal issue.
4. Poor infrastructure
Power, Urban Infrastructure, Airports, Railways and water. • Roads and Ports have made a good beginning but need additional investments
and faster execution.
5. Priority Sectors are not clearly identified/ specified Queries from several investors and country delegations suggest the need for
identification of “Focus Sectors” by the Government where investments are welcomed or even incentivized.
31 Customs clearance takes 2.1 days in developed countries, ~7 days in China and ~ 10 days in India. In India the process requires 29 documents with 118 copies and 258 signatures.
Recommendations
Investment Commission
24
Recommendations
Investment Commission
25
Recommendations The recommended strategy to enhance investment requires policy interventions at a sectoral level, especially for those sectors facing significant impediments. In addition, certain changes in policy and procedures that impact multiple sectors also need to be undertaken to improve the investment environment.
Sector specific recommendations Based on the detailed sectoral analysis carried out by the Investment Commission the investment goal, impediments and recommendations for select sectors32 are presented in this section33.
Infrastructure Sectors
1. Energy Power Investment Goal - $ 140 billion by 2010
Sustained growth in power generation is fundamental to enabling economic growth. About 90,000 MW of new generation capacity is required by 2012, along with associated increase in transmission capacity and upgradation and expansion of distribution assets. An estimated investment of $ 140 billion is required over a 5 year period. Based on current investment plans, only about $54 billion34 worth of investment appears likely at present leaving a gap of about $ 85 billion. Current and projected capacity addition plans of CPSUs, SEBs and private sector will still leave an expected shortfall in generation of 35,000 MW by 2012. It is strongly recommended that India’s strategy for growth in power generation should be coal based. Impediments Poor financial health of the SEBs, resulting from power theft, high technical losses and
free/ subsidised power, is deterring investment in generation Uncertainty of fuel availability
• India’s large thermal coal reserves are not being leveraged – CIL operations result in supply shortages
32 Sectors requiring significant policy intervention and/ or high potential 33 For a comprehensive coverage of all 25 sectors see Annexure 2 34 Investment projects of about $ 158 billion with a historical conversion ration of 34%
Recommendations
Investment Commission
26
Recommendations Establish 25-30 sites for mega projects with land acquired and with all approvals in place35,
for a total of 35,000 MW with an estimated investment of over $ 30 billion • Combination of pithead coal based (of >2,000 MW), coastal plants based on coal and
gas (~1,000 MW each) and hydel of average 250 MW capacity Coal to be the fuel of choice for setting up generation capacity
• Ten year PPAs on competitive bidding on tariffs In energy rich States, discourage policies that impose additional charges on generation and
export of power Improve output of existing assets – Reduce theft, Improve PLF, Operate idle plants,
Increase hydel peaking capacities – could increase power availability by 11,000 MW Expedite the implementation of large Hydel projects, by review of environmental norms/
clearances, if necessary • Joint development of Nepal’s estimated potential of 80,000 MW • Projects in the North East (e.g. Siang Hydro project in AP) and in the North (HP,
Uttaranchal, J&K) Enhance Transmission capacity to facilitate flexibility of energy transfer – especially on the
East North and East West corridors • The Tala Project could be used as a PPP model
Reform distribution to energize investment in generation, by: • Dividing state distcoms into manageable-sized business units; operate on commercial
lines with transitional support for pre-determined period • Encouraging PPPs in distcoms based on the Delhi model
Ensure Regulator autonomy36
(It is suggested that Power be considered by the Government as a National Thrust Area –outlined in the Looking Ahead section on page 45) Coal Investment Goal - $15 billion by 2010 Given India’s large reserves of 240 billion tonnes, it is assumed that coal would be the major source of energy, especially for power generation. Despite its vast reserves, India produces only 360 Mtpa of coal. An investment of about $30-40 billion is required over the next 10 years ($15 billion by 2010) for India to double its annual coal production apart from modernizing existing mines and developing related infrastructure. Current visibility on investments in this sector is less than $2.5 billion.
Impediments Monopoly of CIL is the largest impediment to investment in this sector. The dominant
incumbent is not only perceived to be inefficient, but also carries a poor record of quality, quantity and on-time delivery of coal
35 Especially Environmental approvals, fuel linkage 36 Detailed in the Cross Sectoral recommendations
Recommendations
Investment Commission
27
Restrictions on private and foreign investment (except for captive consumption) Recommendations Carve out specified viable mining blocks from Coal India Ltd (CIL) for captive exploitation.
Alternatively, encourage the subsidiaries of CIL to induct strategic partners from leading mining companies – partners could develop existing blocks on a production share basis • Offer all mines that have been closed by CIL to the private sector – in case there are
viable recoverable reserves Adapt the NELP model for private sector participation in Coal mining by offering good
quality coal blocks for bids: • As in NELP, award to be based on a quantitative evaluation of financial package/ bid,
technical capability, financial capability and work programme • Fixed Royalty payments per tonne extracted, as currently notified, to be offset against
upfront bid amount37 Institute a "use or loose" policy for all blocks, to prevent hoarding and ensure best
competitive use Permit 50% FDI under the automatic route Permit merchant sale of coal by coal mines
Oil & Gas Investment Goal - $30- $35 billion by 2010 India imports over 65% of its crude oil and almost 45% of its gas - with demand growing at 6-7% p.a. An equitable and sustainable policy regime with an independent regulator needs to be put in place to enhance private investment and especially FDI. While the refinery segment is expected to see large investment, areas such as gas pipelines and city gas distribution need greater investment. An estimated $ 30 billion across all elements of the value chain (E&P: $7-8 billion, Refining: $10-12 billion, Retail: $2-3 billion and Gas Distribution: $5 billion) is required to meet the expected demand in this sector over the next 5 years. Current commitments and plans account for only $13.3 billion. Impediments Administered pricing mechanism resulting in distortions in pricing and unpredictable
returns Dominance of PSUs at all points in the value chain – perceived lack of a level playing field
as policies appear to favour PSU incumbents Restrictions on FDI/ minimum investment clauses especially in marketing
Recommendations Permit 100% FDI under automatic route in all segments of the value chain from Petroleum
and Natural Gas exploration to retailing without subsequent divestment of 26% or any
37 Upfront bid amounts would be paid to respective State Governments
Recommendations
Investment Commission
28
upstream investment criteria Tender and award City Gas Distribution (CGD) licences for Local Distribution Companies
to invest in retail gas grid/ distribution networks • Offer CGD in cities38 through competitive bidding39; use the Phased Competition
model. Enact Petroleum and Natural Gas Board Bill and the Natural Gas Pipeline Policy
• Set up Regulator speedily, thereafter Phase out APM – subsidy for LPG and Kerosene should be funded by a surcharge on all
refining output, both in the Public as well as private sector units.
2. Roads Investment Goal - $25–30 billion by 2010 Execution of the NHDP needs to be speeded up. Greater efforts need to be made to attract large international investors and contractors – by better outreach, offering tender blocks that are larger and with specifications that ensure long term quality of the assets created. Excluding development of rural roads and the North East Road Development Project, this sector requires investment of about $30 billion, spanning completion of NHDP projects ($15-18 billion), expansion of express-ways ($4-5 billion) and development of urban roads ($4-5 billion) over the next 5 years. Based on existing plans, an investment of $20 billion seems likely. Impediments The projects for road development and maintenance are too small (<=100 km) to attract
major international bidders and strategic investors Recommendations Award BOT, for NHDP III, IV and parts of II, in larger blocks of at least 300-500 km
stretches rather than sub 100 km stretches so as to attract strategic investors and enable better/ faster implementation • Initiate an outreach programme, as for NELP, to attract international bidders/ investors
Privatize maintenance of highways
3. Ports Investment Goal - $ 8 - $10 billion by 2010 With significant success in attracting domestic and foreign private investment, this sector should be subject to minimal regulation/ restrictions with the focus on creating opportunities 38 Start with top 10 cities initially of the 35 cities with over 1 million population 39 Competitive bidding could be for the lowest retail tariff proposed (at specified/ reference international market gas prices) for the monopoly period in the Phased Competition model
Recommendations
Investment Commission
29
for greater investment and competition. The National Maritime Development Project (NMDP) is an ambitious plan for upgradation of Major and Minor Ports, based on which the sector will require investment of over $15-$17 billion over the next 10 years and over $8 billion in the next 5 years to grow cargo handled at 8% p.a. Based on current plans, an investment of only about $5 billion seems likely. Impediments Price controls by Tariff Authority of Major Ports (TAMP) Poor connectivity to road and rail; monopoly of railways/CONCOR on movement of
container traffic Recommendations Complete transition of all Major Ports to landlord ports by outsourcing port activities to
private operators Put Minor ports up for re-bid if no development after 3 years from award. Convert Tariff Authority of Major Ports (TAMP) into a Regulator
• Free up tariff setting - interventions restricted to abuse of pricing power • Regulator to smoothen relationship between operators and landlord ports e.g. in
disputes arising out of calculation of revenue in revenue sharing model. Implement proposed removal of monopoly of railways/ CONCOR on movement of
container traffic
4. Civil Aviation & Airports Investment Goal - $ 15–17 billion by 2010 Rapid growth in passenger and cargo traffic can be sustained only if there is significant improvement in aviation infrastructure. Delays in execution of green-field airports and leasing of existing airports are unaffordable. Apart from green-field airports at Hyderabad, Bangalore, Navi Mumbai, Ludhiana, Pune and Goa, the sector also requires investments in up-gradation and modernization of about 30 major air-ports which account for over 95% of the country’s aviation traffic. The visibility of investments currently is only about 20% of the total requirement of about $ 15 billion over the next 5 years. Impediments Lack of transparency and consistency in tender conditions and project execution Inordinate delay between decision to set up a green-field airport and its financial closure
Recommendations Permit 100% FDI in green-field airports Invite bids for green-field airports in select cities based on demand forecasts
• E.g. Navi Mumbai, NOIDA, Nagpur, Goa, Ludhiana Implement privatization of Chennai and Kolkata expeditiously
Recommendations
Investment Commission
30
• Incorporate learnings from Delhi/ Mumbai tenders Form SPVs for the next 10 large airports40 (mix of city and resort destinations), and
privatize - provide viability gap funding where required Ensure developers have adequate experience and develop world-class facilities for all
airports (green-field as well as up-gradation and modernization of existing) Modernize Air Traffic Control (ATC) systems and enhance capabilities of personnel Ensure airport facilities and ATC are comparable to best in class airports like Singapore,
Dubai, Hong Kong etc. Remove restrictions on foreign ownership in domestic airlines Complete “open skies” at the earliest (as done with the US) with all other key markets e.g.
UK, Singapore – no seasonal ‘window’, no restrictions Reduce cost of ATF to international levels
5. Telecom Investment Goal - $ 22 billion by 2010 The telecom sector is the back-bone for sustaining India’s growth momentum in services including IT and ITeS. This sector needs to cater to the needs of over 150 million new subscribers in addition to the existing 100 million subscribers over the next 5 years. This would require an investment of over $20 billion. Achieving the investment goal (with a large FDI component anticipated) is contingent on a fair and transparent long term policy regime.
Impediments Lack of an equitable and sustainable policy environment Lack of regulator independence leading to a perceived absence of a level playing field FDI regulations and other conditionalities seen to be detrimental to increased investment
Recommendations Allow 74% FDI under the automatic route without additional conditionalities Encourage new services (e.g. Mobile Virtual Network Operators (MVNOs)), and more
efficient utilisation of existing infrastructure (e.g. through local loop unbundling), while ensuring a level playing field and “no worse-off” situation for existing telecom service licencees
Establish an equitable and sustainable spectrum policy Establish an equitable policy covering incumbent and private service providers’ operations
and growth Align levies and fees on telecom with international benchmarks, especially in the Asian
region Ensure Regulator autonomy41
40 After the major metros of Mumbai, Delhi, Kolkata, Chennai, Bangalore and Hyderabad 41 Detailed in the Cross Sectoral recommendations
Recommendations
Investment Commission
31
B. Manufacturing Sectors
1. Metals & Mining
Investment Goal - $30– $40 billion by 2010
India has tremendous potential in metal mining and manufacture with its vast reserves of over 82 billion tonnes of various metal ores42 which are yet to be tapped. India could benefit tremendously from a modern mining industry and become a leading player in the global metal manufacturing industry. The sector requires a total investment of over $ 30 billion spanning mining & quarrying ($10-15 billion), metal manufacturing ($20–25 billion) and transportation. There is current visibility for only about 50% of this investment.
Impediments Delays in land acquisition, allotment of mining lease and environment clearances Infrastructure bottlenecks - poor road and rail connectivity, inadequate port capacity and
shortage in supply of energy and water. Recommendations Enhance exploration of mineral reserves through a progressive policy framework
• Institute and strictly enforce transparent criteria for award of mining permits - include technical expertise and financial capability. Faster grant of Reconnaissance Permit (RP) and Prospecting Licence (PL); Increase areas for RP and PL
• Automatic flow through of title from RP/PL to Mining Lease in case of discovery. Eliminate risk of reservation for public sector over areas where discoveries may be made
State governments should take responsibility for providing land for major mining and metal-making plant projects (as in the case of POSCO)
Simplify process and reduce number of approvals at the state level (actual Single window clearance) for Mining Leases
Institute a "use or loose" policy for leases awarded for metal ores, in order to prevent hoarding and ensure best competitive use
Streamline and expedite environmental approval / clearance process Provide infrastructure to support major projects such as rail and road linkages, water,
power, ports, etc.
2. Textiles & Garments
Investment Goal - $ 35 billion by 2010
India’s competitive advantages of availability of good quality cotton with highly skilled and low cost labour need to be exploited to enable it realize a larger share of the world textile and garments market, where it has a meagre 4% share (compared to >20% for China43) despite
42 Especially in Iron ore, Bauxite, Chrome, Manganese 43 China’s key advantages being labour flexibility and large scale SEZs
Recommendations
Investment Commission
32
these advantages. The sector has a large employment potential, especially for economically weaker sections and women. To achieve a 13% share in global exports by 2010 ($ 40 billion v/s $ 13 billion currently), an investment of about $ 35 billion spanning spinning, weaving, processing and garmenting is required, against which there is visibility on only about $ 1.5 billion worth of investment44. Impediments Inflexible labour laws that do not allow for seasonality in business or for loss of orders
constrain investment in the sector. Cost disadvantages to Indian manufacturers relative to other country exporters due to
higher power costs, higher domestic taxation and transaction costs as well as higher import duties by USA/ EU on Indian textiles and garments.
Recommendations Set-up dedicated Textile and Garment Parks/ SEZs. Provide labour flexibility in these
Parks/ SEZs as the business is seasonal and fashion based. Sign favourable bilateral / multilateral trade agreements with the USA and EU to lower
import duties and increase competitiveness in these markets Reduce taxation & transaction costs:
• Provide WTO compatible tax benefits • Ensure that no excise duty needs to be paid at any point in the value chain for exports. • Reduce transaction costs (clearing and forwarding, brokerage etc). • Increase duty drawback rates (China has 13% v/s India 5%)
Extend the TUFS Scheme till 2010 • Consider proposals in conjunction with other schemes • Ensure that lending institutions/ nodal agencies are more proactive
Remove all items relating to textiles and garments from small scale reservation
(It is suggested that Textiles & Garments be considered by the Government as a National Thrust Area – outlined in the Looking Ahead section on page 45)
3. Auto & Auto Components
Investment Goal - $ 18 billion by 2010
With its vast resource pool of engineering talent and high skill labour at competitive costs, India has the potential to become a significant player in the global auto industry, especially in engineering and component manufacturing. The projected 150% growth over the next 5 years in the domestic market for automobiles will require large scale capacity expansion; and India has the unique opportunity to emerge as a major global player in the auto component space. The sector would require investments of over $ 18 billion over the next 5 years.
44 Investment projects of $2.7 billion currently with a historical conversion ratio of 53%.
Recommendations
Investment Commission
33
Impediments Inflexible labour laws preventing setting up of large scale labour intensive units Lack of modern testing and research facilities Inadequate advanced engineering talent
Recommendations Make India the engineering and design hub for the automotive industry Incentivize the upgrade of facilities and capabilities of component manufacturers Develop accredited modern testing facilities
• Up-gradation of the ARAI and VRDE test facilities and at least 2 new, state-of-the art test centres, 1 in South and 1 in North India.
Increase availability of trained human resources through the introduction of curricula in Automotive Engineering in engineering colleges and Technical Training institutes. Establish new specialised institutes.
4. Food & Agro-processing
Investment Goal - $ 10 billion by 2010
India is among the largest producers of a variety of agricultural products45. However, there is significant wastage and most produce undergoes only primary processing. The sector needs large investments in processing as well as storage and transport infrastructure – investment in these segments are usually linked to growth in organized retail. The Food Processing industry is very small, with only about 2% of fruits and vegetables being processed. The goal for the sector should be to achieve a three-fold growth in size over 10 years. However, there appears to be a large investment gap in this sector - against an estimated requirement of about $10 billion, less than $1 billion is currently planned or under implementation. Impediments Multiple governing laws leading to lack of clarity and delays in investment approvals The APMC Act prevents food processors and retailers from direct purchase of produce
from the farmers • Many intermediaries result in wastage and high prices to consumer without benefiting
the farmer High levels of local taxation on processed foods. Lack of a developed supply chain infrastructure leading to large scale wastage.
Recommendations Permit 100% FDI under automatic route in all plantations Amend APMC Act in all states to permit purchases directly from the farmers and
encourage contract farming Accord ‘priority sector’ status to food processing units
• Provide single window clearances for food processing industries
45 Tea, Wheat, Sugarcane, Rice, Fruits, Vegetables, Milk

Recommendations
Investment Commission
34
Enact the proposed “Unified Food Law” Remove restrictions on movement, stocking and forward trading in agricultural
commodities
(It is suggested that Food & Agro-processing be considered by the Government as a National Thrust Area – outlined in the Looking Ahead section on page 45)
Recommendations
Investment Commission
35
C. Service Sectors
1. Financial Sector A healthy and vibrant financial sector is a necessary backbone for economic growth and investment in all other sectors. In addition, the financial sector presents an opportunity to attract a large quantum of FDI46.
Banking Investment Goal: $ 25 billion by 2010
Total assets of Indian banks are expected to double to $ 915 billion by 2010. Total capital required (for growth in assets and for Basel II norms) would be $ 75 billion, compared to $ 26 billion in 2004. Internal generation is expected to meet only $ 20-25 billion of the $ 50 billion additional capital required. Additional equity (domestic and FDI) would need to bridge the remaining $ 25 billion capital funding gap. Impediments Restrictions on ownership of private banks by foreigners (FDI) and Indian corporates Restrictions on the number of new branches a foreign bank can open Restrictions on FDI/ FII holding in PSU banks
Recommendations Permit ownership in Indian banks up to 15% by Indian corporates Increase limits of holdings by any one foreign bank upto 15% (for private banks)
• Make voting rights equal to equity interest for foreign banks and Indian corporates47 Permit foreign banks operating in India to open branches upto a limit of 5% market share
of deposits. The RBI could specify additional capital for each new branch. Permit FII investment upto 49% in public sector banks
Financial Services Impediments Regulatory Restrictions on PE/VC funds
Recommendations Equity markets Permit investment by Pension Funds, Provident Funds and Public Charitable Trusts - in
46 Outbound FDI flows from major economies like USA and Japan have a 20+% share towards Banking and Finance – the largest sector in most developed countries. Restricting FDI in this sector means India excludes over 20% of its FDI potential. 47 Requires amendment of the Banking Regulation Act which restricts voting rights of any one person/ entity to 10%
Recommendations
Investment Commission
36
listed securities that are AA rated or better - of upto 10% of their Investible Funds. Simplify registration norms for FIIs. Approvals (within, say, 2 months) should be based
purely on a confirmation of compliance on specified criteria. Encourage Private Equity by:
• Raising the 15% limit for open offers to 25%; thereafter open offers to be for all the remaining shares.
• Permitting PE firms to raise local borrowings and/ or ECBs for their investments/ acquisition of shares.
Debt/ Bond Markets Exempt all bond issuances that do not have retail participation from filing a prospectus
with SEBI. Permit Public Charitable Trusts to invest in Fixed Deposits of FAAA rated companies (i.e.
in addition to PSU FDs). Venture Capital Permit FVCIs to invest a substantial portion (say two-thirds) of their investible funds in
listed securities Permit FVCIs to invest in a listed company by way of acquisition of shares in the
secondary market Non-performing Assets Unlock investments in NPAs by strengthening lenders rights and defining Bankruptcy with
respect to default over a pre-determined period of time (rather than the current Networth based criteria).
Insurance Recommendation Raise FDI cap to promised level of 49%.
2. Real Estate & Construction Investment Goal: $ 50 billion by 2010
The high rate of growth of over 30% p.a. in the real estate and construction sector can be sustained only if regulatory and policy bottlenecks are removed. Investment in the sector is a pre-requisite for several high potential sectors including Tourism (over 50,000 new hotel rooms required), Retail (over 200 million square feet required) IT/ ITeS and Financial Services (over five-fold growth required in commercial area). Consequently, reforms in this sector must be a priority. The sector requires an investment of $50 billion over the next five years, of which there is current visibility on less than $10 billion.
Impediments Multiple approvals and clearances, high transaction costs, lack of transparency and
unethical practices. Unclear land titles
Recommendations
Investment Commission
37
Limited land availability in cities for investment – large tracts are blocked either with Government bodies or due to ULC Act
Recommendations Bar disbursements from the National Urban Renewal Mission (NURM) to those states that
have not repealed the Urban Land Ceiling (ULC) Act (e.g. Maharashtra, Bihar, Andhra Pradesh, Assam, West Bengal)
Reduce the minimum scale for FDI to 10,000 sq. mtrs. for construction development projects and 10 acres for housing projects
Approve all residential and commercial development within Municipal limits by the State/ local Pollution Control Board without needing clearance from MoEF
Sell surplus land under the Ministries of Railways, Surface Transport (Ports) and Defence48 to improve land availability
Reduce stamp duties and registration fees, while increasing property taxes Permit the establishment of Real Estate Investment Trusts (REITs) with FDI upto 49% and
tax benefits as in mutual funds
3. Retail Investment Goal: $ 5 – $6 billion by 2010
An efficient and competitive retail sector can increase private consumption leading to growth in manufacturing and agriculture, and will create jobs for the unskilled and for women. Organized retail will draw investment into the entire value chain till agriculture, which is underdeveloped at present. India has a nascent organized retail sector with less than 3% of retail being through modern formats. With the right policy enablers, organized retail has the potential to grow over five-fold in the next 5 years requiring an investment of about $5-$6 billion. Impediments Restrictions on FDI in retail APMC amendment to permit direct purchases from farmers yet to be implemented in many
states Recommendations Permit FDI in retail
• 49% under automatic route, in the first instance • No conditional restrictions should be imposed such as location/ category/ number of
outlets or brands Amend APMC Act in all states – allow farmers to sell outside the market yard to licensed
retailers/ wholesalers 48 Relax restrictive pre-qualification criteria of ‘construction or development experience’ from Government land tenders, as this results in exclusion of FDI/ foreign funds

Recommendations
Investment Commission
38
4. Tourism
Investment Goal: $ 8 – $10 billion by 2010
India’s annual inflow of 3.9 million foreign tourists (2005) is only a fraction of its true potential. Being the highest employment generator per unit of investment, tourism spends have tremendous drill down effects benefiting the economically weaker sections, semi-literate, women and rural areas, while also harnessing and nurturing India’s natural beauty and cultural heritage. Infrastructure created for tourism, paid for by foreign and domestic tourists, is enjoyed by all citizens. India needs to set an ambitious target of attracting 10 million international tourists by 2010. To meet this inflow, and the requirements of the domestic market, the sector will need to target $8-$10 billion of investment in the next 5 years. Impediments Infrastructure constraints; specifically the capacity constraints and poor quality of existing
airports and insufficient international airports Inadequate and poorly classified hotel stock – land title and availability issues delay
capacity additions, approvals and permissions are problematic and many, hotel classification has no international basis
Recommendations Designate certain areas for tourism and provide single window approvals for tourism
development Provide incentives (interest subsidy like TUF) to encourage investment in key components
such as hotels and resort development Prepare and implement a holistic Tourism Master Plan covering airport development/
international gateways, enhanced open sky policy, streamline Visa/immigration and customs processes (bench-mark with Dubai, Singapore) and target a large scaling up in the sector – 10 million international tourists by 2010.
Permit visa on arrival for key source countries – USA, UK, EU, Singapore & Australia Remove requirements of foreigners to report at police stations (Foreigner Regional
Registration Office – FRO/FRRO), at least of the above mentioned countries.
(It is suggested that Tourism be considered by the Government as a National Thrust Area –outlined in the Looking Ahead section on page 45)
Recommendations
Investment Commission
39
D. Knowledge Economy
1. IT & ITES
Investment Goal
India is the leading destination for providing IT & ITES. The industry is growing at a fast pace; with over 25% CAGR expected in the next seven years. India needs to build upon its competitive advantages in this sector. Impediments Shortage of Human Resource - In order to sustain leadership, India requires about 2.3
million graduates49, as against an estimated supply of only 1.8 million. An additional 500,000 suitable graduates are needed in the next 5 years
Poor Supporting Infrastructure: bottlenecks include poor air, road, rail connectivity, poor quality of international airports, difficulties in securing land/ building clearances etc
Recommendations Develop Human Resources bench strength
• Set up focused Education Zones to improve quality of higher education • De-centralize higher education in stages and shift to a demand based funding system • Pilot ‘industry owned” and Government facilitated integrated skill development and
certification programme for ITES Improve overall Infrastructure
• Develop 10-12 integrated townships with associated urban infrastructure including international airports, roads and land development
Reduce barriers to trade in IT/ITES services • Accelerate efforts to ensure free trade in services (especially for Movement of People
and Export of Services) through trade agreements with select countries and negotiations at the WTO
49 NASSCOM McKinsey Report 2005
Recommendations
Investment Commission
40
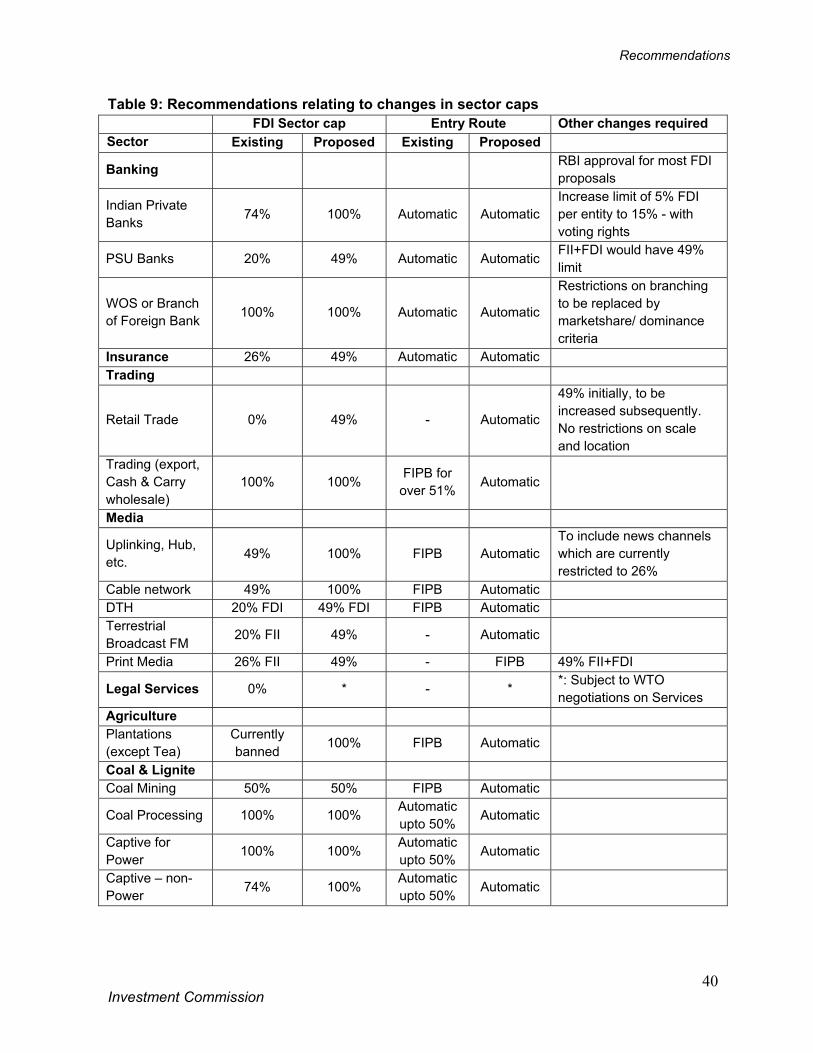
Table 9: Recommendations relating to changes in sector caps FDI Sector cap Entry Route Other changes required Sector Existing Proposed Existing Proposed
Banking RBI approval for most FDI proposals
Indian Private Banks 74% 100% Automatic Automatic
Increase limit of 5% FDI per entity to 15% - with voting rights
PSU Banks 20% 49% Automatic Automatic FII+FDI would have 49% limit
WOS or Branch of Foreign Bank 100% 100% Automatic Automatic
Restrictions on branching to be replaced by marketshare/ dominance criteria
Insurance 26% 49% Automatic Automatic Trading
Retail Trade 0% 49% - Automatic
49% initially, to be increased subsequently. No restrictions on scale and location
Trading (export, Cash & Carry wholesale)
100% 100% FIPB for over 51% Automatic
Media
Uplinking, Hub, etc. 49% 100% FIPB Automatic
To include news channels which are currently restricted to 26%
Cable network 49% 100% FIPB Automatic DTH 20% FDI 49% FDI FIPB Automatic Terrestrial Broadcast FM 20% FII 49% - Automatic
Print Media 26% FII 49% - FIPB 49% FII+FDI
Legal Services 0% * - * *: Subject to WTO negotiations on Services
Agriculture Plantations (except Tea)
Currently banned 100% FIPB Automatic
Coal & Lignite Coal Mining 50% 50% FIPB Automatic
Coal Processing 100% 100% Automatic upto 50% Automatic
Captive for Power 100% 100% Automatic
upto 50% Automatic
Captive – non-Power 74% 100% Automatic
upto 50% Automatic
Recommendations
Investment Commission
41
Multi Sectoral Recommendations The following recommendations impact multiple industry sectors and are aimed at improving the over-all business and investment environment: 1. Remove/ reduce restrictions on sector caps and entry route
Open all sectors, other than those of strategic importance, to FDI by raising/ removing sector caps. The recommended changes in sector caps (incorporating sectoral recommendations from the previous section) are tabulated in Table 9.
Reduce the number of sectors that need FIPB approval – all FDI proposals that are within the sector cap to be permitted under the automatic route.
2. Provide labour flexibility
Remove deterrents to investment, especially in manufacturing, due to rigidities in labour laws:
Provisions in Chapter V-B50 of the ID Act need to be amended to provide employers the flexibility to right-size labour or close unit / factory subject to meeting specific separation requirements, without prior state government approval.
Amend Contract Labour (Regulation & Abolition) Act: Remove distinction between regular/ core and non-core activities, provided employers ensure statutory benefits and minimum wages. • Exclude IT/ ITeS from the purview of this Act.
3. Promote SEZs for key sectors
The current development of SEZs may result in abuse of the concept which should be redefined on the basis of scale, investment quantum/ levels and sector focus. There is also a need to separate the Developer of the SEZ from the Occupants. No existing plants or facilities should be permitted to register as an SEZ.
SEZs should be promoted for the following major “thrust sectors”: • Textiles and Garments • Auto Components • Electronics • Chemicals • Gems & Jewellery
Notify/ issue SEZ Rules
50 Chapter V-B covers Factories, Mines and Plantations. Sectors not covered include services such as software development, airlines, telecom, hotels, private banking & insurance, management consultancy, etc. which have not only generated growth and jobs, but also have an excellent record of labour compliance.
Recommendations
Investment Commission
42
4. Provide a level playing field in sectors with PSU dominance
Ensure a ‘genuine’ level playing field in all sectors - especially those with significant Government/ PSU presence
Establish an Independent Central Regulatory Commission headed by a Chief Commissioner appointed by the President or the Prime Minister with independent Regulators for each regulated sector
Ensure rules and policies apply uniformly to all participants, including PSUs, in each sector, with no preferential treatment.
PSUs to operate independent of their administrative Ministry
5. Provide long term visibility and consistency of policy
Provide policy visibility and continuity/ consistency to reassure investors: Provide a definitive timeframe/ 3 year visibility for FDI (sector caps, entry routes,
other restrictions) and taxation levels Ensure adherence to policy announcements and contractual commitments without
any reversals (e.g. Insurance sector cap increase to 49%, PPAs to be considered inviolate).
6. Improve business environment
India suffers from an image of being a difficult country in which to invest and to do business. Delays in approvals from multiple agencies at the central and state levels, conflicting decisions at different levels often stall projects. Once in operation, the licence and inspector “Raj” adds to the difficulties of focusing on running a competitive enterprise. The current environment has been one of the major causes for investment decisions being made in favour of other countries (like China). Suggested changes are:
Reduce procedures and approvals and time to set-up a business Target a top 25 position on the ‘Ease of doing business’ rating of the World Bank in 5
years (from existing India rank of 116) • Benchmark improvements with China (ranked 91) and Singapore (ranked 2)
Make Environment/ MoEF approvals time bound and non-discretionary Enable Faster settlement of commercial disputes in the courts (disputes are currently
protracted due to an inadequate number of judges, multiple adjournments and prolonged court holidays)
7. Eliminate scope for discretionary interpretation to stem corruption
Update/ clarify key laws and regulatory frameworks - ensure minimal scope for discretionary interpretation • Create Study Groups or Committees with government and industry
participation to identify areas of ambiguity and undertake corrective measures All approvals from government/ regulatory bodies to be based on conformance to
clearly articulated criteria/ parameters and within a specified time-line.
Recommendations
Investment Commission
43
Target a top quartile position on the Corruption Perception Index (currently rank 90) – top 50 by 2008 and top 25 by 2010 • Enforce action against corruption and economic offenders.
8. Establish effective mechanisms to resolve centre-state issues
Establish an Empowered Committee framework (as done for VAT implementation) for implementation of key policies that require Centre-State cooperation such as Power sector reform, Labour law reform, Urban Land reforms (including ULC Act), APMC amendment.
Speed up processes/ approvals at the state level • Set up empowered Investment Boards at the state level to provide single
window clearance for projects above Rs. 100 Crores. • GoI could define a model process to be implemented by the States
Submission of applications, movement through the process and tracking to be e-enabled.
Speed up processes for providing land and infrastructure for setting up units • Corporatise state level Industrial Development Corporations (especially those
that have large estates) with a Board for each IDC with members drawn from industry and government.
Other Recommendations
9. Create a special high level fast track mechanism for priority sector projects (including Power, Ports, Roads) to provide all approvals expeditiously
10. Promote the establishment of new private educational institutes, with international collaborators, to provide skilled manpower to meet the increased needs of various sectors like Biotechnology, Automotive Engineering, Textile Engineering, IT etc.
11. Facilitate the upgradation of Urban infrastructure - while the funding of improvement in urban infrastructure is being addressed, the execution of this upgradation would be facilitated by a directly elected Mayor as an accountable CEO of the Municipal area/ corporation for major cities such as Mumbai, Bangalore, Kolkata, Chennai and Hyderabad - as is the case with major cities in both China and the USA.
12. Establish a single point contact at the Centre (similar to the Investment Boards at the State level mentioned above) to implement policies and procedures to enhance investment as well as facilitate high value projects across Ministries and Departments.

Looking Ahead
Investment Commission
44
Looking Ahead
Investment Commission
45
Looking Ahead Suggestions for Enhancing Growth
While continuing its interaction with investors and the facilitation of projects, the Investment Commission recommends the creation of National Thrust Areas and the hosting of Mega Events in the next phase of taking investment levels to a higher plane.
National Thrust Areas There is a need to identify a few National Thrust Areas with defined national goals, where all impediments for growth are removed, and where appropriate incentives are provided, to encourage investment in the Thrust Areas and/ or in supporting infrastructure. The purpose of the defined Thrust Areas would be to elevate India’s presence in these areas regionally or even globally. This has been successfully done in countries such as Singapore (Biotechnology) and Ireland (Pharmaceuticals, IT).
The “Thrust Areas” could include:
Tourism
Power
Textiles
Agro-processing
These specific sectors would also create enormous job opportunities (both direct and indirect) resulting in a considerable boost to the economy
Mega Events India’s hosting of mega events will focus the country’s attention on infrastructure development while also building national pride. Some ideas are: 2010 Commonwealth Games, 2020 Olympics, Football World Cup, Formula One Racing etc.

Annexures
Investment Commission
46
Annexures
Investment Commission
47
Annexure 1
FDI in India – Review of Performance and Prospects
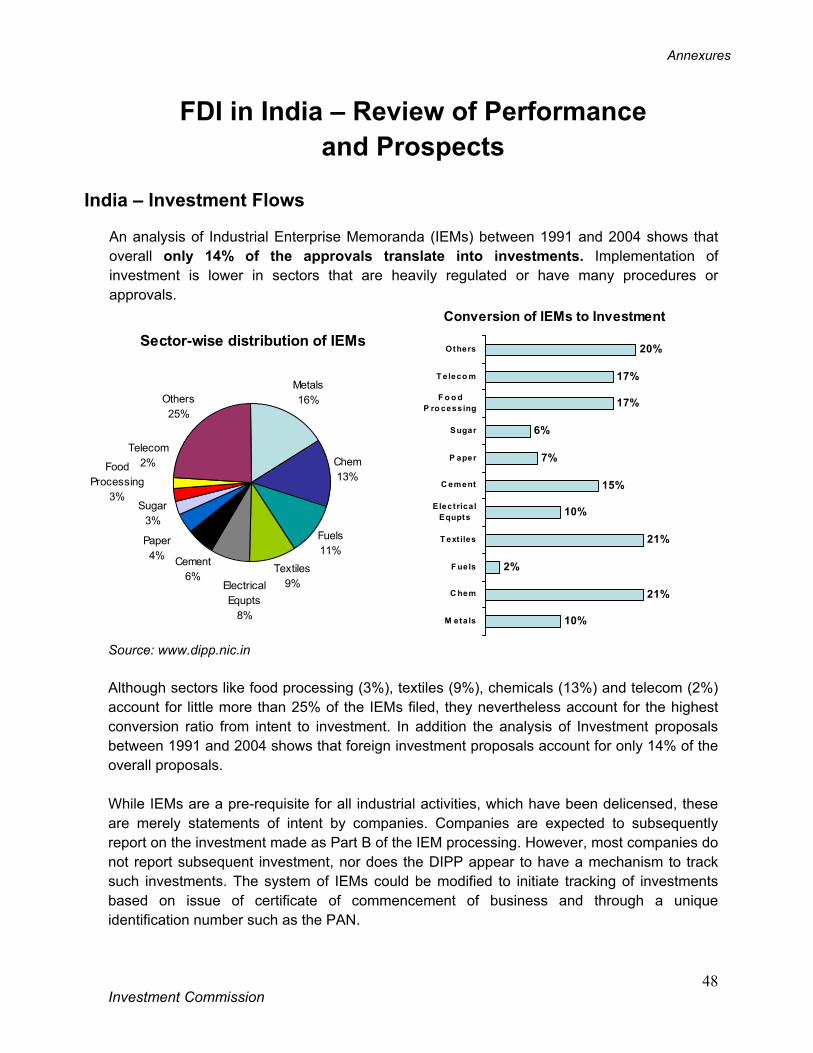
Annexures
Investment Commission
48
FDI in India – Review of Performance and Prospects
India – Investment Flows
An analysis of Industrial Enterprise Memoranda (IEMs) between 1991 and 2004 shows that overall only 14% of the approvals translate into investments. Implementation of investment is lower in sectors that are heavily regulated or have many procedures or approvals.
Source: www.dipp.nic.in Although sectors like food processing (3%), textiles (9%), chemicals (13%) and telecom (2%) account for little more than 25% of the IEMs filed, they nevertheless account for the highest conversion ratio from intent to investment. In addition the analysis of Investment proposals between 1991 and 2004 shows that foreign investment proposals account for only 14% of the overall proposals. While IEMs are a pre-requisite for all industrial activities, which have been delicensed, these are merely statements of intent by companies. Companies are expected to subsequently report on the investment made as Part B of the IEM processing. However, most companies do not report subsequent investment, nor does the DIPP appear to have a mechanism to track such investments. The system of IEMs could be modified to initiate tracking of investments based on issue of certificate of commencement of business and through a unique identification number such as the PAN.
Metals16%
Chem13%
Fuels11%
Textiles9%
Others25%
Sugar3%
Telecom2%Food
Processing3%
Paper4% Cement
6%Electrical Equpts
8%
Sector-wise distribution of IEMs
10%
21%
2%
21%
10%
15%
7%
6%
17%
17%
20%
M etals
C hem
F uels
T ext iles
ElectricalEqupts
C ement
P aper
Sugar
F o o dP ro cessing
T eleco m
Others
Conversion of IEMs to Investment
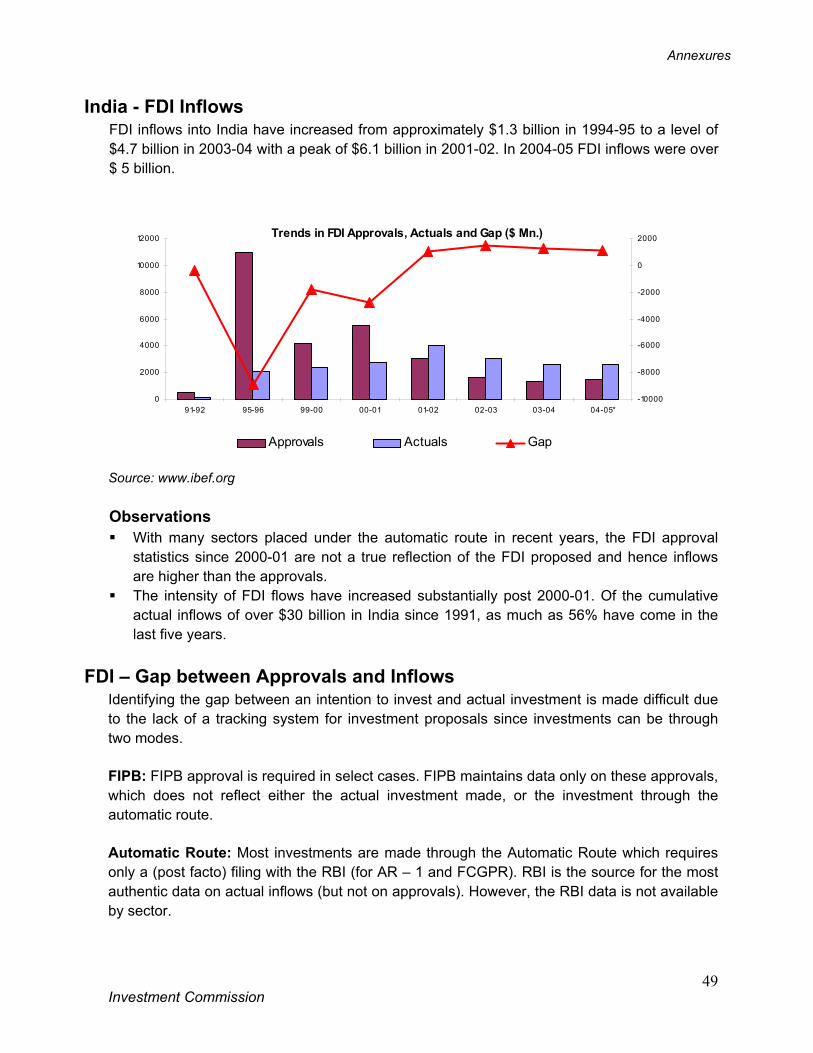
Annexures
Investment Commission
49
India - FDI Inflows FDI inflows into India have increased from approximately $1.3 billion in 1994-95 to a level of $4.7 billion in 2003-04 with a peak of $6.1 billion in 2001-02. In 2004-05 FDI inflows were over $ 5 billion. Source: www.ibef.org Observations With many sectors placed under the automatic route in recent years, the FDI approval
statistics since 2000-01 are not a true reflection of the FDI proposed and hence inflows are higher than the approvals.
The intensity of FDI flows have increased substantially post 2000-01. Of the cumulative actual inflows of over $30 billion in India since 1991, as much as 56% have come in the last five years.
FDI – Gap between Approvals and Inflows
Identifying the gap between an intention to invest and actual investment is made difficult due to the lack of a tracking system for investment proposals since investments can be through two modes.
FIPB: FIPB approval is required in select cases. FIPB maintains data only on these approvals, which does not reflect either the actual investment made, or the investment through the automatic route.
Automatic Route: Most investments are made through the Automatic Route which requires only a (post facto) filing with the RBI (for AR – 1 and FCGPR). RBI is the source for the most authentic data on actual inflows (but not on approvals). However, the RBI data is not available by sector.
0
2000
4000
6000
8000
10000
12000
91-92 95-96 99-00 00-01 01-02 02-03 03-04 04-05*-10000
-8000
-6000
-4000
-2000
0
2000
Approvals Actuals Gap
Trends in FDI Approvals, Actuals and Gap ($ Mn.)
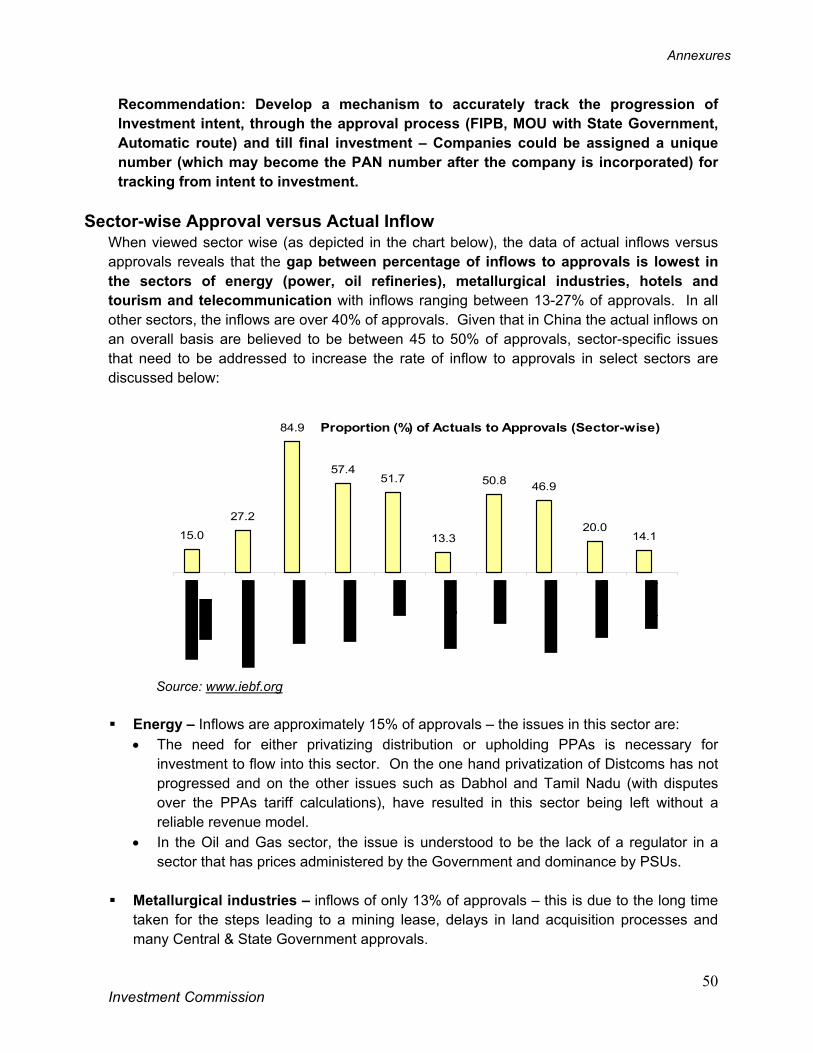
Annexures
Investment Commission
50
Recommendation: Develop a mechanism to accurately track the progression of Investment intent, through the approval process (FIPB, MOU with State Government, Automatic route) and till final investment – Companies could be assigned a unique number (which may become the PAN number after the company is incorporated) for tracking from intent to investment.
Sector-wise Approval versus Actual Inflow When viewed sector wise (as depicted in the chart below), the data of actual inflows versus approvals reveals that the gap between percentage of inflows to approvals is lowest in the sectors of energy (power, oil refineries), metallurgical industries, hotels and tourism and telecommunication with inflows ranging between 13-27% of approvals. In all other sectors, the inflows are over 40% of approvals. Given that in China the actual inflows on an overall basis are believed to be between 45 to 50% of approvals, sector-specific issues that need to be addressed to increase the rate of inflow to approvals in select sectors are discussed below:
Source: www.iebf.org
Energy – Inflows are approximately 15% of approvals – the issues in this sector are: • The need for either privatizing distribution or upholding PPAs is necessary for
investment to flow into this sector. On the one hand privatization of Distcoms has not progressed and on the other issues such as Dabhol and Tamil Nadu (with disputes over the PPAs tariff calculations), have resulted in this sector being left without a reliable revenue model.
• In the Oil and Gas sector, the issue is understood to be the lack of a regulator in a sector that has prices administered by the Government and dominance by PSUs.
Metallurgical industries – inflows of only 13% of approvals – this is due to the long time
taken for the steps leading to a mining lease, delays in land acquisition processes and many Central & State Government approvals.
15.0
27.2
84.9
57.451.7
13.3
50.8 46.9
20.014.1
Proportion (%) of Actuals to Approvals (Sector-wise)
Annexures
Investment Commission
51
Telecommunication – the 27% inflow to approval ratio is due to the large number of proposals that were received at an initial stage. Several proposals were subsequently withdrawn – due to the uncertainty on policy/ regulation, at that time.
Recommendation: For every sector (Ministry/ Department) a target could be set of converting 50% of approvals into investment every year (for long lead time sectors such as energy and infrastructure this could be 33% for the initial 2 years, but over a period of time the ratio should rise to 50%).
FDI through Automatic Route
The Investment Commission reviewed in detail the FDI through the automatic route based on data provided by RBI from January 2001 to December, 2004. The overall view is that FDI through automatic route poses no problems or issues at the
GoI level since there are no holdups there. However, issues do arise in the case where the State Government is required to approve,
facilitate or set tariffs, usually in infrastructure and related projects. There is obviously a need for the State Government to play a facilitating role in promoting
FDI perhaps through a single point contact at a senior level in the State bureaucracy reporting directly to the Chief Minister.
The key findings of the detailed review which covers discussions with 15 different companies that had received FDI through the automatic route (from 2000 to 2004) were: A large part of the investment related to portfolio investments in existing companies /
enterprises – there were no issues or delays. Some investments were in entities that were de-merged divisions of existing companies –
in this category as well there were no delays or issues In the case of infrastructure projects such as for roads and highways (Mapex
Infrastructure), power (ST-CMS, Samalpatti Power) and ports (Mundra / P&O), while the investments have been made in the respective projects, there have been several issues relating to implementation and post implementation usually relating to the State Government.
• With respect to roads and highways the issues related to coordination and approvals • In the case of power, ST-CMS continues to disagree with the tariff setting by TNEB
where the capital cost remains disputed and unresolved more than 2 years after power supply commenced
Case Study: Mapex Infrastructure – For Mapex bringing in FDI (from Malaysian road developer Gamuda Engineering) was very easy through the automatic route – however, during implementation (Calcutta – Durgapur highway, part of NHDP Phase I - 130 km, toll road on Annuity basis) Mapex needed a lot of interaction with the State Government, where due to lack of ownership and appreciation of the need for quick approvals significant delay and hardship was faced. Mapex felt a need for coordination between Centre and State so that projects do not get delayed – principally GoI approvals must be very specific and the State must take on these commitments thereafter
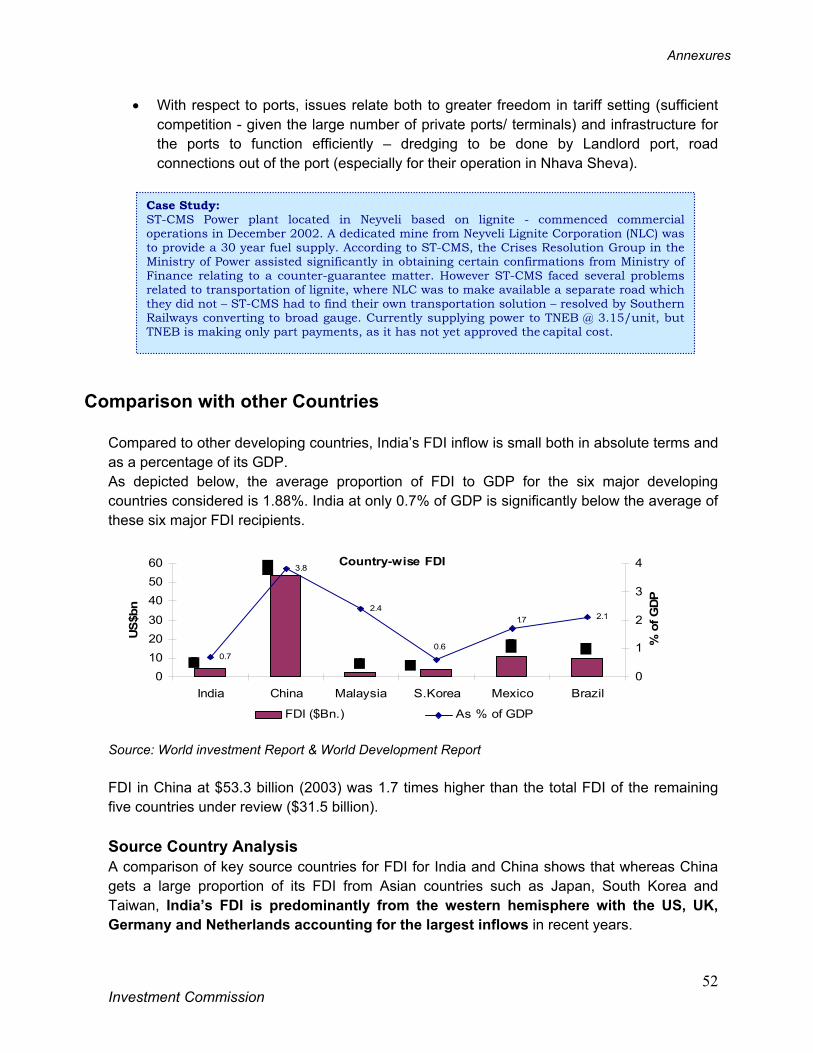
Annexures
Investment Commission
52
• With respect to ports, issues relate both to greater freedom in tariff setting (sufficient competition - given the large number of private ports/ terminals) and infrastructure for the ports to function efficiently – dredging to be done by Landlord port, road connections out of the port (especially for their operation in Nhava Sheva).
Comparison with other Countries
Compared to other developing countries, India’s FDI inflow is small both in absolute terms and as a percentage of its GDP. As depicted below, the average proportion of FDI to GDP for the six major developing countries considered is 1.88%. India at only 0.7% of GDP is significantly below the average of these six major FDI recipients. Source: World investment Report & World Development Report FDI in China at $53.3 billion (2003) was 1.7 times higher than the total FDI of the remaining five countries under review ($31.5 billion). Source Country Analysis A comparison of key source countries for FDI for India and China shows that whereas China gets a large proportion of its FDI from Asian countries such as Japan, South Korea and Taiwan, India’s FDI is predominantly from the western hemisphere with the US, UK, Germany and Netherlands accounting for the largest inflows in recent years.
0.7
3.8
2.42.11.7
0.6
0102030
405060
India China Malaysia S.Korea Mexico Brazil
US
$bn
0
1
2
3
4
% o
f GD
P
FDI ($Bn.) As % of GDP
Country-wise FDI
Case Study: ST-CMS Power plant located in Neyveli based on lignite - commenced commercial operations in December 2002. A dedicated mine from Neyveli Lignite Corporation (NLC) was to provide a 30 year fuel supply. According to ST-CMS, the Crises Resolution Group in the Ministry of Power assisted significantly in obtaining certain confirmations from Ministry of Finance relating to a counter-guarantee matter. However ST-CMS faced several problems related to transportation of lignite, where NLC was to make available a separate road which they did not – ST-CMS had to find their own transportation solution – resolved by Southern Railways converting to broad gauge. Currently supplying power to TNEB @ 3.15/unit, but TNEB is making only part payments, as it has not yet approved the capital cost.
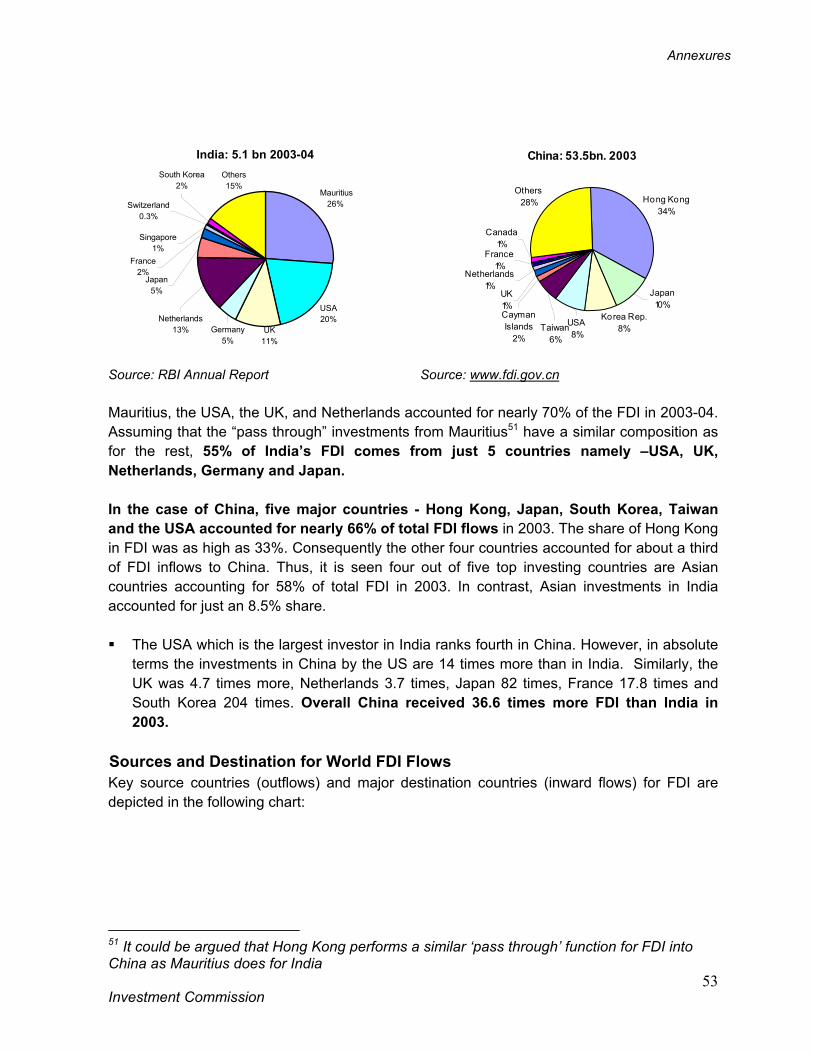
Annexures
Investment Commission
53
Mauritius26%
USA20%
Japan5%
France2%
Switzerland0.3%
Others15%
South Korea2%
Singapore1%
Netherlands13% UK
11%Germany
5%
India: 5.1 bn 2003-04
Source: RBI Annual Report Source: www.fdi.gov.cn Mauritius, the USA, the UK, and Netherlands accounted for nearly 70% of the FDI in 2003-04. Assuming that the “pass through” investments from Mauritius51 have a similar composition as for the rest, 55% of India’s FDI comes from just 5 countries namely –USA, UK, Netherlands, Germany and Japan. In the case of China, five major countries - Hong Kong, Japan, South Korea, Taiwan and the USA accounted for nearly 66% of total FDI flows in 2003. The share of Hong Kong in FDI was as high as 33%. Consequently the other four countries accounted for about a third of FDI inflows to China. Thus, it is seen four out of five top investing countries are Asian countries accounting for 58% of total FDI in 2003. In contrast, Asian investments in India accounted for just an 8.5% share. The USA which is the largest investor in India ranks fourth in China. However, in absolute
terms the investments in China by the US are 14 times more than in India. Similarly, the UK was 4.7 times more, Netherlands 3.7 times, Japan 82 times, France 17.8 times and South Korea 204 times. Overall China received 36.6 times more FDI than India in 2003.
Sources and Destination for World FDI Flows Key source countries (outflows) and major destination countries (inward flows) for FDI are depicted in the following chart:
51 It could be argued that Hong Kong performs a similar ‘pass through’ function for FDI into China as Mauritius does for India
Others28%
Japan10%
USA8%
Taiwan6%
Cayman Islands
2%
Canada1%
Netherlands1%
France1%
UK1%
Hong Kong34%
Korea Rep.8%
China: 53.5bn. 2003
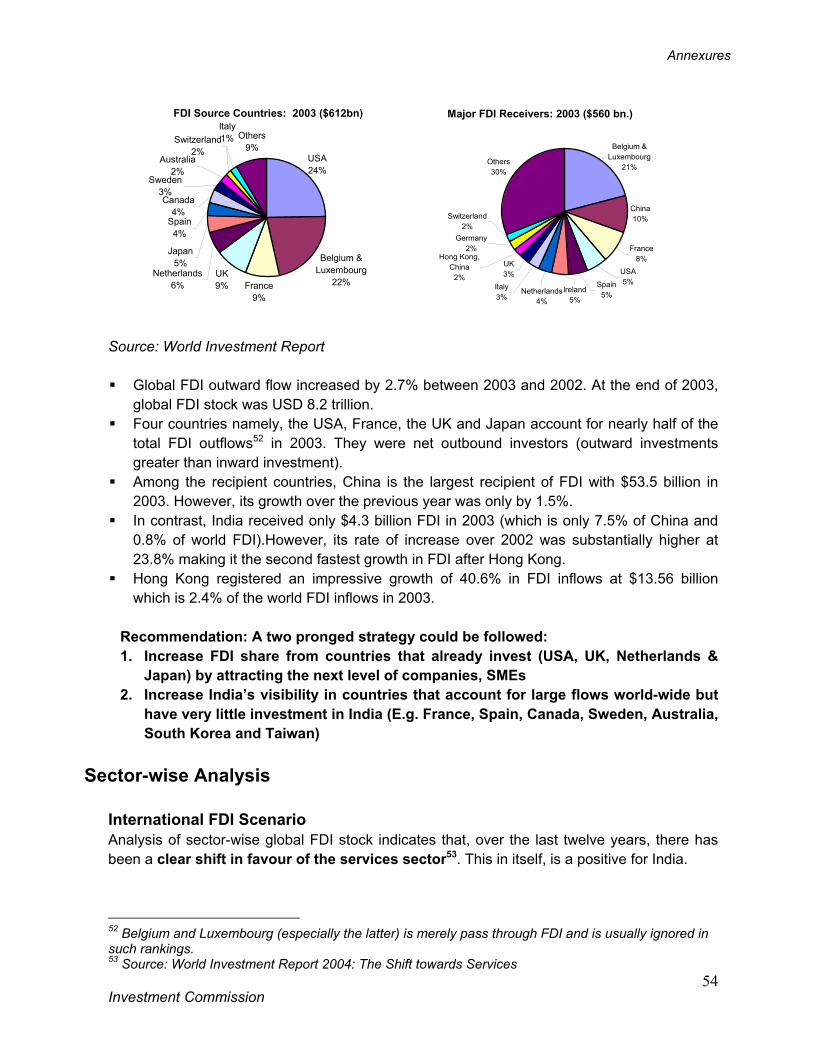
Annexures
Investment Commission
54
France9%
UK9%
Netherlands6%
Japan5%
Spain4%
Canada4%
Sweden3%
Others9%
Italy1%Switzerland
2%Australia
2%
Belgium & Luxembourg
22%
USA24%
FDI Source Countries: 2003 ($612bn)
Source: World Investment Report Global FDI outward flow increased by 2.7% between 2003 and 2002. At the end of 2003,
global FDI stock was USD 8.2 trillion. Four countries namely, the USA, France, the UK and Japan account for nearly half of the
total FDI outflows52 in 2003. They were net outbound investors (outward investments greater than inward investment).
Among the recipient countries, China is the largest recipient of FDI with $53.5 billion in 2003. However, its growth over the previous year was only by 1.5%.
In contrast, India received only $4.3 billion FDI in 2003 (which is only 7.5% of China and 0.8% of world FDI).However, its rate of increase over 2002 was substantially higher at 23.8% making it the second fastest growth in FDI after Hong Kong.
Hong Kong registered an impressive growth of 40.6% in FDI inflows at $13.56 billion which is 2.4% of the world FDI inflows in 2003.
Recommendation: A two pronged strategy could be followed: 1. Increase FDI share from countries that already invest (USA, UK, Netherlands &
Japan) by attracting the next level of companies, SMEs 2. Increase India’s visibility in countries that account for large flows world-wide but
have very little investment in India (E.g. France, Spain, Canada, Sweden, Australia, South Korea and Taiwan)
Sector-wise Analysis
International FDI Scenario Analysis of sector-wise global FDI stock indicates that, over the last twelve years, there has been a clear shift in favour of the services sector53. This in itself, is a positive for India.
52 Belgium and Luxembourg (especially the latter) is merely pass through FDI and is usually ignored in such rankings. 53 Source: World Investment Report 2004: The Shift towards Services
China10%
Others30%
Belgium & Luxembourg
21%
Switzerland2%
Germany2%
Netherlands4%
Hong Kong, China
2%
UK3% USA
5%Spain5%
Ireland5%
Italy3%
France8%
Major FDI Receivers: 2003 ($560 bn.)
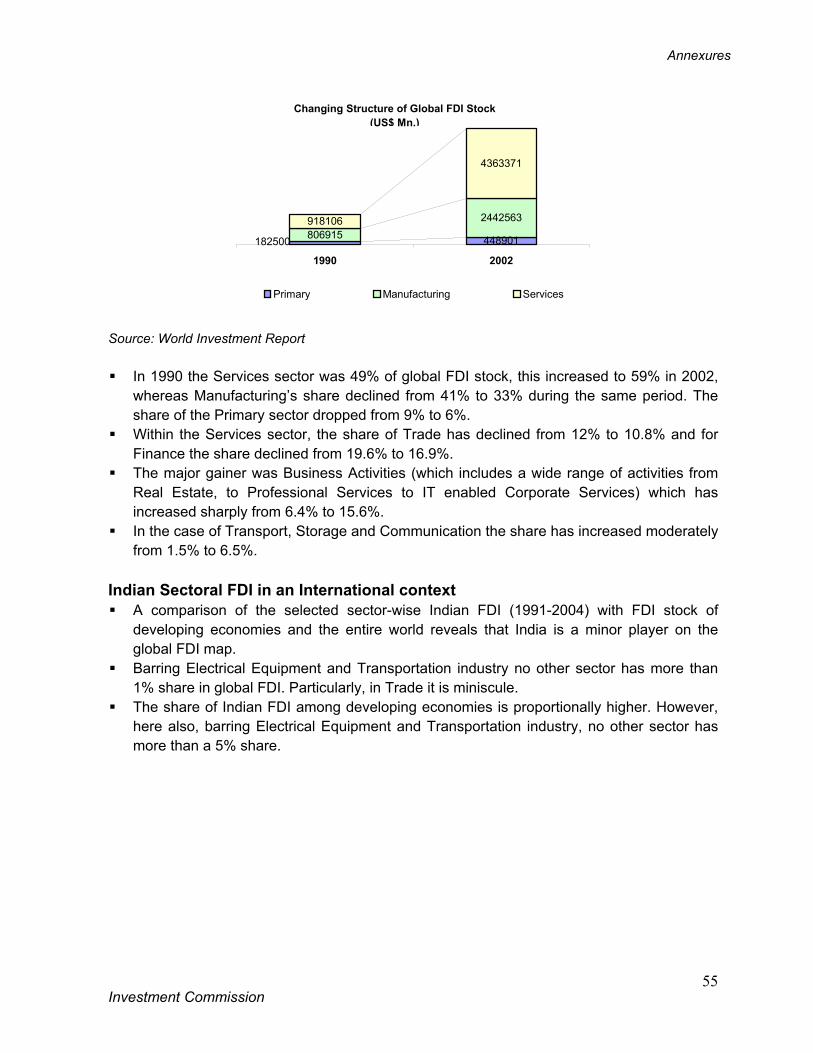
Annexures
Investment Commission
55
4489018069152442563918106
4363371
182500
1990 2002
Primary Manufacturing Services
Changing Structure of Global FDI Stock(US$ Mn.)
Source: World Investment Report In 1990 the Services sector was 49% of global FDI stock, this increased to 59% in 2002,
whereas Manufacturing’s share declined from 41% to 33% during the same period. The share of the Primary sector dropped from 9% to 6%.
Within the Services sector, the share of Trade has declined from 12% to 10.8% and for Finance the share declined from 19.6% to 16.9%.
The major gainer was Business Activities (which includes a wide range of activities from Real Estate, to Professional Services to IT enabled Corporate Services) which has increased sharply from 6.4% to 15.6%.
In the case of Transport, Storage and Communication the share has increased moderately from 1.5% to 6.5%.
Indian Sectoral FDI in an International context A comparison of the selected sector-wise Indian FDI (1991-2004) with FDI stock of
developing economies and the entire world reveals that India is a minor player on the global FDI map.
Barring Electrical Equipment and Transportation industry no other sector has more than 1% share in global FDI. Particularly, in Trade it is miniscule.
The share of Indian FDI among developing economies is proportionally higher. However, here also, barring Electrical Equipment and Transportation industry, no other sector has more than a 5% share.
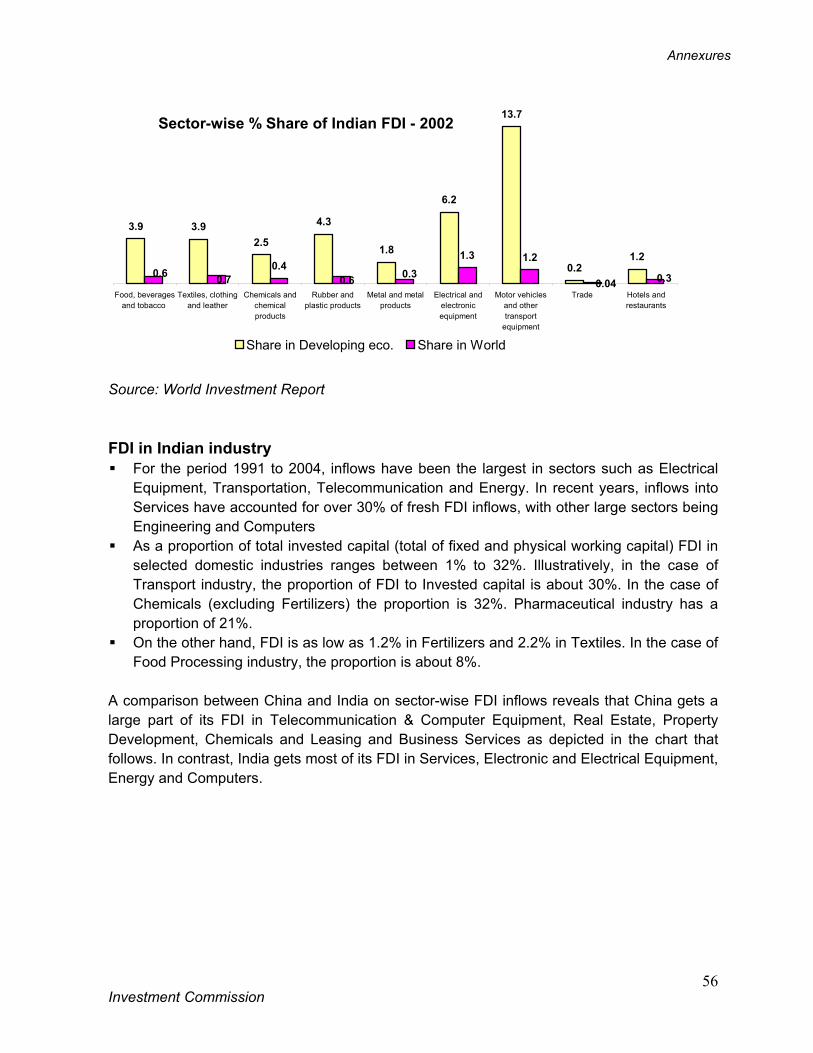
Annexures
Investment Commission
56
3.9 3.92.5
4.3
1.8
6.2
13.7
0.21.2
0.41.3 1.2
0.30.040.30.70.6 0.6
Food, beveragesand tobacco
Textiles, clothingand leather
Chemicals andchemicalproducts
Rubber andplastic products
Metal and metalproducts
Electrical andelectronicequipment
Motor vehiclesand othertransport
equipment
Trade Hotels andrestaurants
Share in Developing eco. Share in World
Sector-wise % Share of Indian FDI - 2002
Source: World Investment Report FDI in Indian industry For the period 1991 to 2004, inflows have been the largest in sectors such as Electrical
Equipment, Transportation, Telecommunication and Energy. In recent years, inflows into Services have accounted for over 30% of fresh FDI inflows, with other large sectors being Engineering and Computers
As a proportion of total invested capital (total of fixed and physical working capital) FDI in selected domestic industries ranges between 1% to 32%. Illustratively, in the case of Transport industry, the proportion of FDI to Invested capital is about 30%. In the case of Chemicals (excluding Fertilizers) the proportion is 32%. Pharmaceutical industry has a proportion of 21%.
On the other hand, FDI is as low as 1.2% in Fertilizers and 2.2% in Textiles. In the case of Food Processing industry, the proportion is about 8%.
A comparison between China and India on sector-wise FDI inflows reveals that China gets a large part of its FDI in Telecommunication & Computer Equipment, Real Estate, Property Development, Chemicals and Leasing and Business Services as depicted in the chart that follows. In contrast, India gets most of its FDI in Services, Electronic and Electrical Equipment, Energy and Computers.
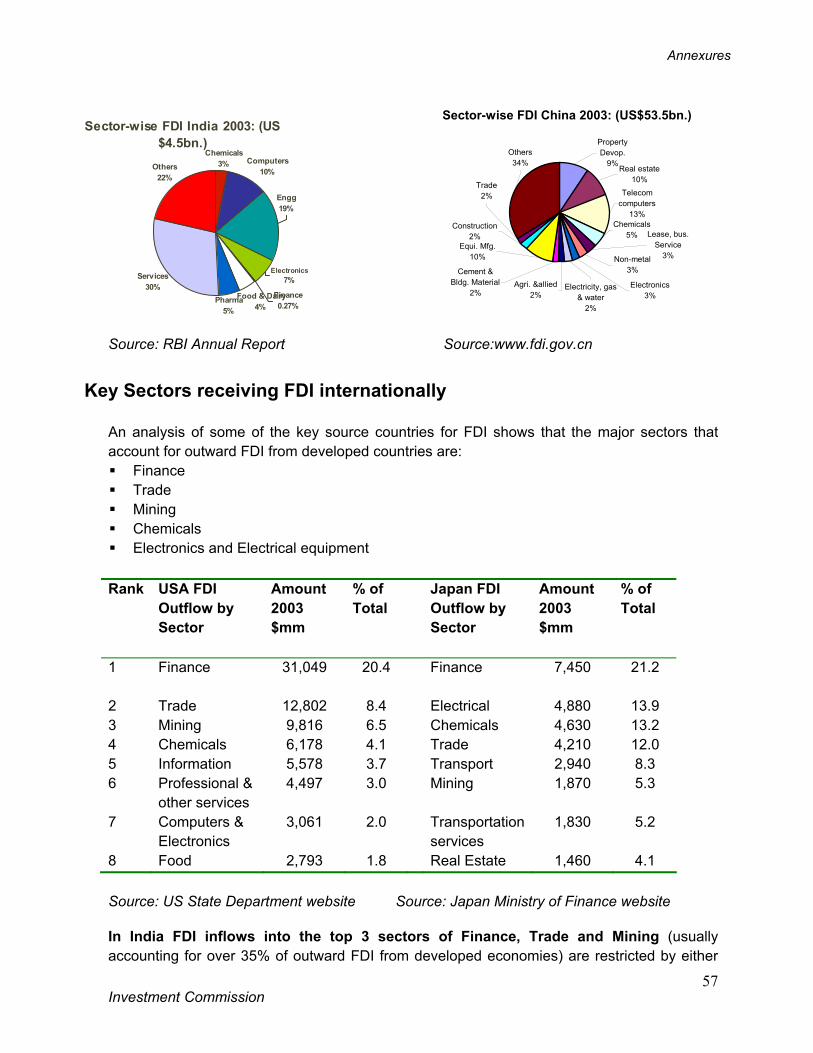
Annexures
Investment Commission
57
Others34%
Electronics3%
Electricity, gas & water
2%
Real estate10%
Telecom computers
13%
Agri. &allied2%
Non-metal3%
Lease, bus. Service
3%
Chemicals5%
Cement & Bldg. Material
2%
Equi. Mfg.10%
Construction2%
Trade2%
Property Devop.
9%
Sector-wise FDI China 2003: (US$53.5bn.)
Source: RBI Annual Report Source:www.fdi.gov.cn
Key Sectors receiving FDI internationally
An analysis of some of the key source countries for FDI shows that the major sectors that account for outward FDI from developed countries are: Finance Trade Mining Chemicals Electronics and Electrical equipment
Rank USA FDI
Outflow by Sector
Amount 2003 $mm
% of Total
Japan FDI Outflow by Sector
Amount 2003 $mm
% of Total
1 Finance 31,049 20.4 Finance 7,450
21.2
2 Trade 12,802 8.4 Electrical 4,880 13.9 3 Mining 9,816 6.5 Chemicals 4,630 13.2 4 Chemicals 6,178 4.1 Trade 4,210 12.0 5 Information 5,578 3.7 Transport 2,940 8.3 6 Professional &
other services 4,497 3.0 Mining 1,870 5.3
7 Computers & Electronics
3,061 2.0 Transportation services
1,830 5.2
8 Food 2,793 1.8 Real Estate 1,460 4.1 Source: US State Department website Source: Japan Ministry of Finance website In India FDI inflows into the top 3 sectors of Finance, Trade and Mining (usually accounting for over 35% of outward FDI from developed economies) are restricted by either
Sector-wise FDI India 2003: (US $4.5bn.)
Chemicals3% Computers
10%
Engg19%
Electronics7%
Finance0.27%
Food & Dairy4%
Pharma5%
Services30%
Others22%
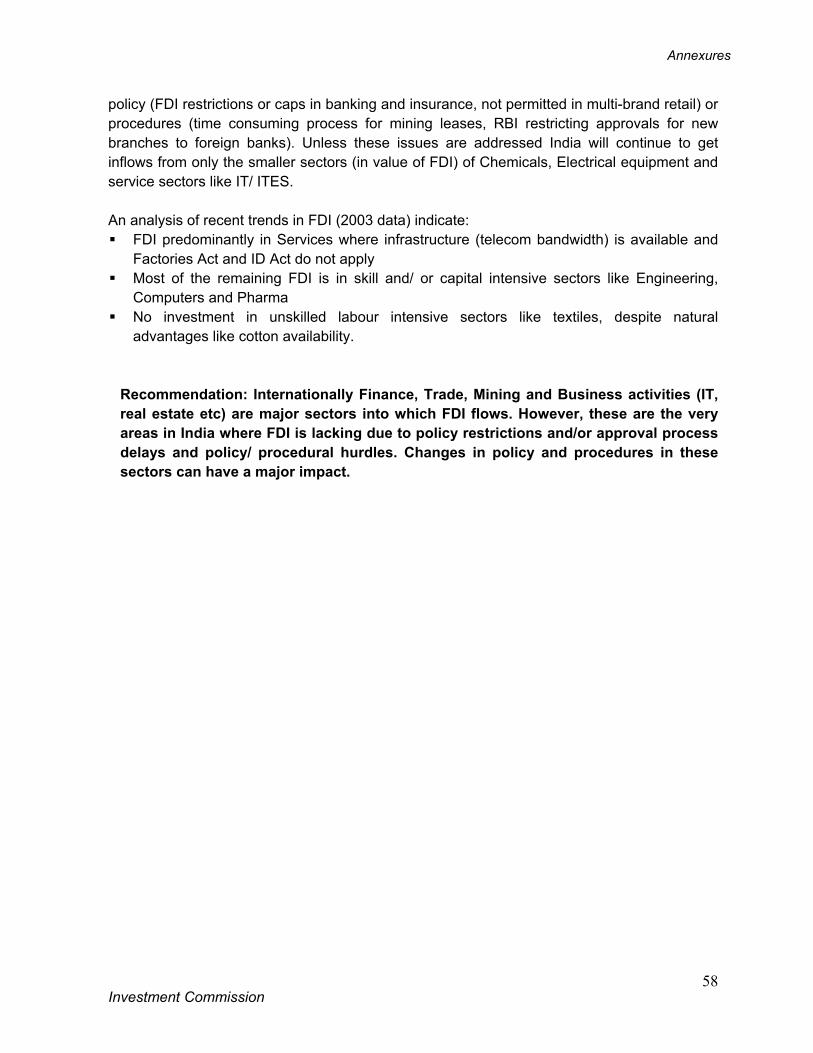
Annexures
Investment Commission
58
policy (FDI restrictions or caps in banking and insurance, not permitted in multi-brand retail) or procedures (time consuming process for mining leases, RBI restricting approvals for new branches to foreign banks). Unless these issues are addressed India will continue to get inflows from only the smaller sectors (in value of FDI) of Chemicals, Electrical equipment and service sectors like IT/ ITES. An analysis of recent trends in FDI (2003 data) indicate: FDI predominantly in Services where infrastructure (telecom bandwidth) is available and
Factories Act and ID Act do not apply Most of the remaining FDI is in skill and/ or capital intensive sectors like Engineering,
Computers and Pharma No investment in unskilled labour intensive sectors like textiles, despite natural
advantages like cotton availability.
Recommendation: Internationally Finance, Trade, Mining and Business activities (IT, real estate etc) are major sectors into which FDI flows. However, these are the very areas in India where FDI is lacking due to policy restrictions and/or approval process delays and policy/ procedural hurdles. Changes in policy and procedures in these sectors can have a major impact.
Annexures
Investment Commission
59
Annexure 2
Detailed Sector Notes
Annexures
Investment Commission
60
Investment Goal: 140 Bn
• Over 70,000MW of
new power
generation ($70 Bn
investment)
• Expansion &
upgradation in
distribution assets
and new transmission
capacity (Over $ 70
Bn investment)
Current Investment
Visibility: $54 Bn
Detailed Sector Notes Background information of the 25 sectors studied by the Investment Commission (termed as “Current Status” and “Outlook” for each sector) is provided in this Annexure. Impediments and Recommendations for most sectors have been presented in the Recommendations section of the main report. For the sectors not covered earlier, the Impediments and Recommendations have been included in this Annexure.
A. Infrastructure Sectors
1. Power
Current Status India has a generation capacity of 122 GW; 590 billion units produced (1 unit = 1kwh)
• Fifth largest electricity generation capacity in the world • CAGR of 4.6% over the last four years
Coal fired plants constitute 57% of the installed generation capacity, followed by 25% from hydel power, 10% gas based, 3% from nuclear energy and 5% from renewable sources
T & D network of 5.7 million circuit km – the 3rd largest in the world India suffers from an average energy short-fall of 7% and a peak shortfall of about 12%
• Low per capita consumption at 606 units; less than half of China High AT & C losses (35% in India as against international benchmark of 10%) which, if
reduced, could address the power deficit.
Outlook Over 90,000 MW of new generation capacity is required to
meet the “power for all” target by 2012 • A corresponding investment is required to increase
capacity and upgrade transmission and distribution networks
Power costs in India need to be reduced from the current high rate of 8-10 cents/unit by a combination of lower AT & C losses, increased generation efficiencies and new low cost generating capacity
Total Investment requirement is estimated at $ 140 billion by 2010, across generation (70,000 MW), transmission and distribution
Based on current investment plans, only about $54 billion54 worth of investment appears likely at present, leaving a gap of about $ 85 billion
Current and projected capacity addition plans of CPSUs,
54 Investment projects of about $ 158 billion with a historical conversion ration of 34%
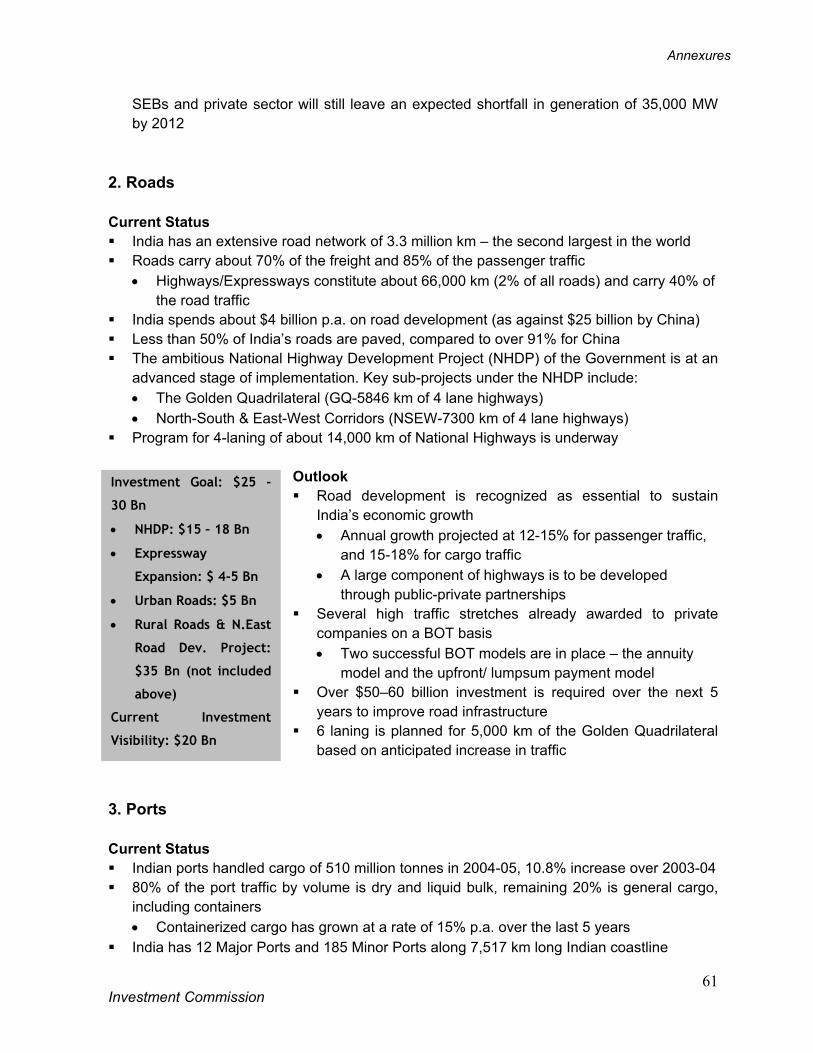
Annexures
Investment Commission
61
Investment Goal: $25 -
30 Bn
• NHDP: $15 – 18 Bn
• Expressway
Expansion: $ 4-5 Bn
• Urban Roads: $5 Bn
• Rural Roads & N.East
Road Dev. Project:
$35 Bn (not included
above)
Current Investment
Visibility: $20 Bn
SEBs and private sector will still leave an expected shortfall in generation of 35,000 MW by 2012
2. Roads Current Status India has an extensive road network of 3.3 million km – the second largest in the world Roads carry about 70% of the freight and 85% of the passenger traffic
• Highways/Expressways constitute about 66,000 km (2% of all roads) and carry 40% of the road traffic
India spends about $4 billion p.a. on road development (as against $25 billion by China) Less than 50% of India’s roads are paved, compared to over 91% for China The ambitious National Highway Development Project (NHDP) of the Government is at an
advanced stage of implementation. Key sub-projects under the NHDP include: • The Golden Quadrilateral (GQ-5846 km of 4 lane highways) • North-South & East-West Corridors (NSEW-7300 km of 4 lane highways)
Program for 4-laning of about 14,000 km of National Highways is underway
Outlook Road development is recognized as essential to sustain
India’s economic growth • Annual growth projected at 12-15% for passenger traffic,
and 15-18% for cargo traffic • A large component of highways is to be developed
through public-private partnerships Several high traffic stretches already awarded to private
companies on a BOT basis • Two successful BOT models are in place – the annuity
model and the upfront/ lumpsum payment model Over $50–60 billion investment is required over the next 5
years to improve road infrastructure 6 laning is planned for 5,000 km of the Golden Quadrilateral
based on anticipated increase in traffic
3. Ports
Current Status Indian ports handled cargo of 510 million tonnes in 2004-05, 10.8% increase over 2003-04 80% of the port traffic by volume is dry and liquid bulk, remaining 20% is general cargo,
including containers • Containerized cargo has grown at a rate of 15% p.a. over the last 5 years
India has 12 Major Ports and 185 Minor Ports along 7,517 km long Indian coastline
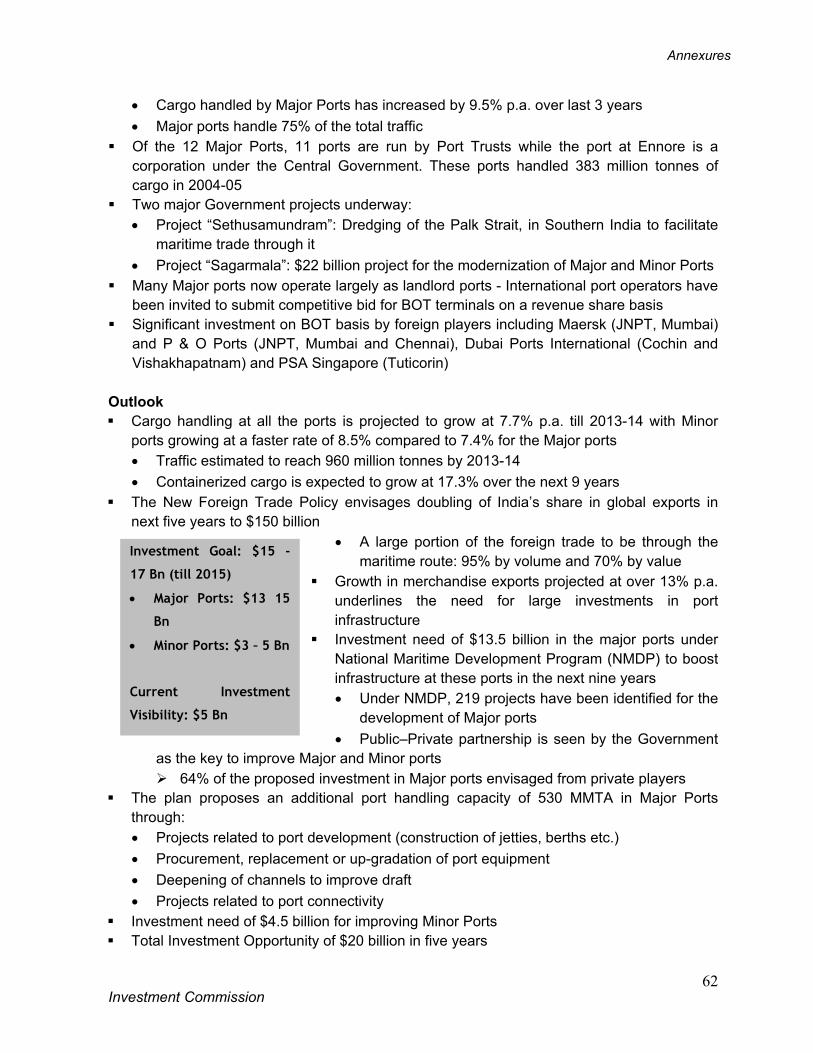
Annexures
Investment Commission
62
Investment Goal: $15 -
17 Bn (till 2015)
• Major Ports: $13 15
Bn
• Minor Ports: $3 – 5 Bn
Current Investment
Visibility: $5 Bn
• Cargo handled by Major Ports has increased by 9.5% p.a. over last 3 years • Major ports handle 75% of the total traffic
Of the 12 Major Ports, 11 ports are run by Port Trusts while the port at Ennore is a corporation under the Central Government. These ports handled 383 million tonnes of cargo in 2004-05
Two major Government projects underway: • Project “Sethusamundram”: Dredging of the Palk Strait, in Southern India to facilitate
maritime trade through it • Project “Sagarmala”: $22 billion project for the modernization of Major and Minor Ports
Many Major ports now operate largely as landlord ports - International port operators have been invited to submit competitive bid for BOT terminals on a revenue share basis
Significant investment on BOT basis by foreign players including Maersk (JNPT, Mumbai) and P & O Ports (JNPT, Mumbai and Chennai), Dubai Ports International (Cochin and Vishakhapatnam) and PSA Singapore (Tuticorin)
Outlook Cargo handling at all the ports is projected to grow at 7.7% p.a. till 2013-14 with Minor
ports growing at a faster rate of 8.5% compared to 7.4% for the Major ports • Traffic estimated to reach 960 million tonnes by 2013-14 • Containerized cargo is expected to grow at 17.3% over the next 9 years
The New Foreign Trade Policy envisages doubling of India’s share in global exports in next five years to $150 billion
• A large portion of the foreign trade to be through the maritime route: 95% by volume and 70% by value
Growth in merchandise exports projected at over 13% p.a. underlines the need for large investments in port infrastructure
Investment need of $13.5 billion in the major ports under National Maritime Development Program (NMDP) to boost infrastructure at these ports in the next nine years • Under NMDP, 219 projects have been identified for the
development of Major ports • Public–Private partnership is seen by the Government
as the key to improve Major and Minor ports 64% of the proposed investment in Major ports envisaged from private players
The plan proposes an additional port handling capacity of 530 MMTA in Major Ports through: • Projects related to port development (construction of jetties, berths etc.) • Procurement, replacement or up-gradation of port equipment • Deepening of channels to improve draft • Projects related to port connectivity
Investment need of $4.5 billion for improving Minor Ports Total Investment Opportunity of $20 billion in five years
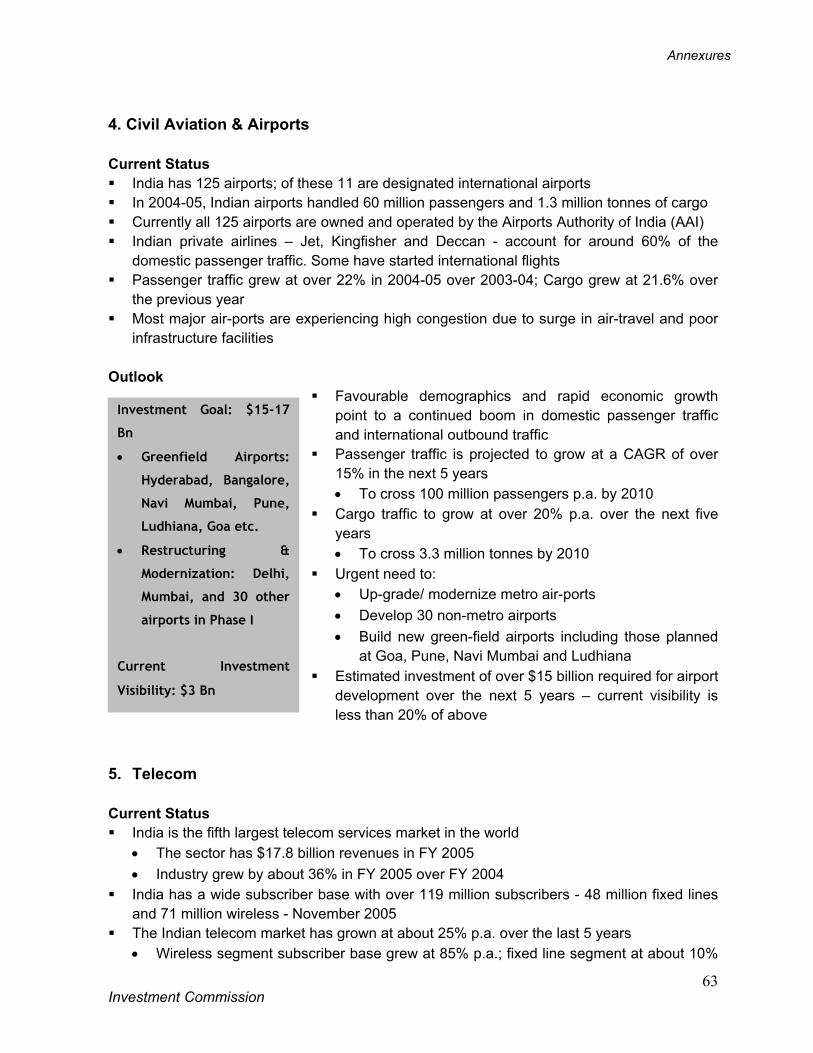
Annexures
Investment Commission
63
Investment Goal: $15-17
Bn
• Greenfield Airports:
Hyderabad, Bangalore,
Navi Mumbai, Pune,
Ludhiana, Goa etc.
• Restructuring &
Modernization: Delhi,
Mumbai, and 30 other
airports in Phase I
Current Investment
Visibility: $3 Bn
4. Civil Aviation & Airports Current Status India has 125 airports; of these 11 are designated international airports In 2004-05, Indian airports handled 60 million passengers and 1.3 million tonnes of cargo Currently all 125 airports are owned and operated by the Airports Authority of India (AAI) Indian private airlines – Jet, Kingfisher and Deccan - account for around 60% of the
domestic passenger traffic. Some have started international flights Passenger traffic grew at over 22% in 2004-05 over 2003-04; Cargo grew at 21.6% over
the previous year Most major air-ports are experiencing high congestion due to surge in air-travel and poor
infrastructure facilities Outlook
Favourable demographics and rapid economic growth point to a continued boom in domestic passenger traffic and international outbound traffic
Passenger traffic is projected to grow at a CAGR of over 15% in the next 5 years • To cross 100 million passengers p.a. by 2010
Cargo traffic to grow at over 20% p.a. over the next five years • To cross 3.3 million tonnes by 2010
Urgent need to: • Up-grade/ modernize metro air-ports • Develop 30 non-metro airports • Build new green-field airports including those planned
at Goa, Pune, Navi Mumbai and Ludhiana Estimated investment of over $15 billion required for airport
development over the next 5 years – current visibility is less than 20% of above
5. Telecom Current Status India is the fifth largest telecom services market in the world
• The sector has $17.8 billion revenues in FY 2005 • Industry grew by about 36% in FY 2005 over FY 2004
India has a wide subscriber base with over 119 million subscribers - 48 million fixed lines and 71 million wireless - November 2005
The Indian telecom market has grown at about 25% p.a. over the last 5 years • Wireless segment subscriber base grew at 85% p.a.; fixed line segment at about 10%
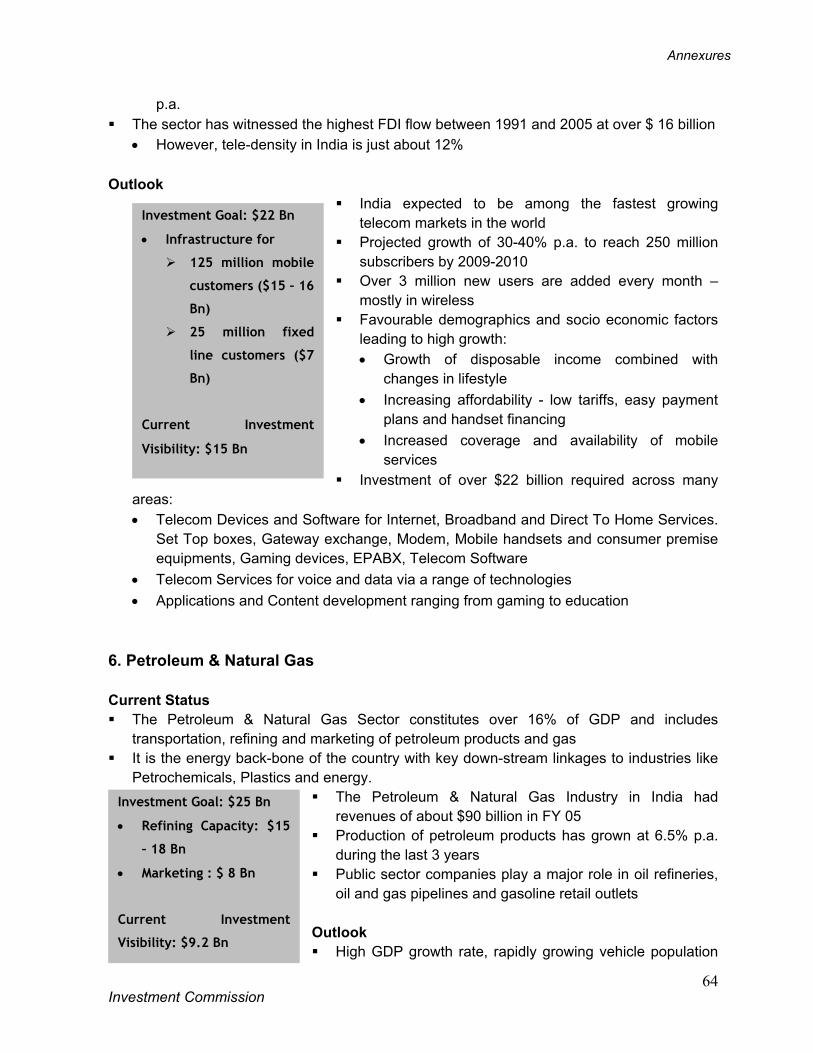
Annexures
Investment Commission
64
Investment Goal: $25 Bn
• Refining Capacity: $15
– 18 Bn
• Marketing : $ 8 Bn
Current Investment
Visibility: $9.2 Bn
Investment Goal: $22 Bn
• Infrastructure for
125 million mobile
customers ($15 – 16
Bn)
25 million fixed
line customers ($7
Bn)
Current Investment
Visibility: $15 Bn
p.a. The sector has witnessed the highest FDI flow between 1991 and 2005 at over $ 16 billion
• However, tele-density in India is just about 12% Outlook
India expected to be among the fastest growing telecom markets in the world
Projected growth of 30-40% p.a. to reach 250 million subscribers by 2009-2010
Over 3 million new users are added every month – mostly in wireless
Favourable demographics and socio economic factors leading to high growth: • Growth of disposable income combined with
changes in lifestyle • Increasing affordability - low tariffs, easy payment
plans and handset financing • Increased coverage and availability of mobile
services Investment of over $22 billion required across many
areas: • Telecom Devices and Software for Internet, Broadband and Direct To Home Services.
Set Top boxes, Gateway exchange, Modem, Mobile handsets and consumer premise equipments, Gaming devices, EPABX, Telecom Software
• Telecom Services for voice and data via a range of technologies • Applications and Content development ranging from gaming to education
6. Petroleum & Natural Gas Current Status The Petroleum & Natural Gas Sector constitutes over 16% of GDP and includes
transportation, refining and marketing of petroleum products and gas It is the energy back-bone of the country with key down-stream linkages to industries like
Petrochemicals, Plastics and energy. The Petroleum & Natural Gas Industry in India had
revenues of about $90 billion in FY 05 Production of petroleum products has grown at 6.5% p.a.
during the last 3 years Public sector companies play a major role in oil refineries,
oil and gas pipelines and gasoline retail outlets Outlook High GDP growth rate, rapidly growing vehicle population
Annexures
Investment Commission
65
and better road infrastructure will drive consumption of petroleum products • Industry is expected to grow at a CAGR of about 8% to 10% • Over 190 MMT of refining capacity required by 2010 – Current crude oil refining
capacity of about 127 MMT Natural gas demand is about 150 MMSCMD (2004) with only 54% being met through
domestic sources Over 120MMSCMD of additional demand for Natural Gas estimated in the next five years Large investments are required at every step of the value chain to meet the growing
demand Over $15 billion and $8 billion of investment required in refining and marketing
respectively by 2010
Annexures
Investment Commission
66
Investment Goal: $25 Bn
• Doubling of assets
• High capital required
to meet Basel II
norms ($50 Bn)
• Internal
generation:$20-25 Bn
• Incremental capital
required: $25 Bn
B. Services 1. Banking and Financial Services Current Status India has a rapidly growing Banking and Financial Services sector based on sound
fundamentals (low NPAs, Basel I compliant) Total banking assets in Indian banks total about $450 billion in 2004; growth of 15% p.a.
since 1991 • Public Sector banks account for 75% of the assets
Liquid and well regulated equity markets – Market cap of over $500 billion Mutual Funds assets of $45 billion; growth of 13% p.a. since 1993 when private mutual
funds were launched Need for liberalizing FDI in Banking - FDI outward flows from major economies like USA
and Japan have over 20% share in Banking and Finance – the largest sector in most developed countries.
Outlook Total banking assets are expected to double and grow to
$915 billion by 2010 - a CAGR of 15% • $70 billion additional capital (equity) needed for growth
as well as for Basel II compliance • Existing capital is about $25 billion, while internal
generation is expected to meet only about $20-25 billion of the $70 billion required. FDI is required to bridge part of the remaining $20-25 billion capital funding gap.
Mutual Funds: Assets Under Management (AUM) are expected to grow by 15% till 2010
Retail Finance is expected to grow at an annual rate of 18%, from $27.6 billion in 2003-04 to $64.2 billion by 2008-09
Several factors favour high growth in this sector: • Demographic profile favours higher retail offtake - 54% of the population is in the 15-35
years age group • Growth in the economy of about 12% p.a. in nominal terms likely
Future requirements from the Banking and Financial Services sector are likely to be different: • Growing economy will warrant larger investments, requiring more lending • Gross international current account flows to increase from 35% of GDP in 2004 to 45%
in 2015. Capital flows will add an extra 20%. • Increase in share of services sector in the economy augers well for offtake of banking
and financial services • Changing banking needs of customers
Total investment of about $25 billion required in the next five years
Annexures
Investment Commission
67
2. Insurance Current Status Insurance is a $10 billion (premiums) industry in India: The Industry grew by 25% in 2004-
05 over the previous year India constitutes only about 0.6% of the global insurance market despite accounting for
17% of the world’s population Insurance penetration is low at 2.9% as compared to the world average of over 8%
• Non-life penetration is even lower - less than 1% in 2003 • Nearly 80% of the Indian population is without Life, Health and Non-life insurance
Per capita life insurance premium in India in 2004 was $16 as compared to the world average of $292
In Life insurance, the total premium collected in FY 2004-05 was $5.8 billion for 26.2 million policies: Growth of 36% over 2003-04
Non-life insurance - Motor, marine, fire and health insurance are the key segments • For Non-life, the total premium collected in FY 2004-05 was $4.2 billion
Growth of about 12.8% over 2003-04 Life Insurance market is still dominated by Life Insurance Corporation (LIC) which has a
78% share of the market In Non-life, private sector companies (almost all are joint ventures with foreign insurers)
account for 20% of the market and have grown at 60% p.a. Outlook Indian insurance market is set to touch US $25 billion by 2010, on the assumption that the
real annual growth in GDP would be 7% p.a. Given India’s large population, the number of potential buyers of insurance makes it an
attractive industry. In most developed countries insurance premiums constitute 10 per cent of the GDP.
Strong economic growth with increase in affluence and rising risk awareness leading to rapid growth in the Insurance sector
Many more international players including AXA have announced plans to enter India Investment needs exist in both Life and Non-life segments
• Total estimated investment need of $4-5 billion in five years 3. Real Estate & Construction Current Status Real Estate and Construction is a $12 billion (by revenue) industry in India Highly fragmented sector with few organized players of scale
• Most real estate developers have only a local or regional presence • Modest participation of large corporations in the sector • Margins are higher in India (>20%) as compared to developed markets (5% - 6%) • Multiple approvals and clearances required
Annexures
Investment Commission
68
Investment Goal: $50 Bn
• 200 Mn sqft of retail
space
• Over 50,00 additional
hotel room stock
• Five-fold growth in
IT/ITES requirements
Current Investment
Visibility: $7.5 Bn
Participation of institutional finance in Real Estate is just beginning Real estate venture funds permitted: Prominent Indian corporates like ICICI Bank, SBI and
HDFC have promoted real estate venture funds Real Estate Investment Trusts (REITs) are yet to be allowed Various foreign Real Estate and Finance companies like GE Commercial Finance,
Tishman Speyer, Ascendas and Farallon Capital have already entered the Indian market Outlook
The Real Estate market is projected to grow to $50 billion by 2010 • CAGR of over 30% p.a. is expected over the next five
years Several factors are expected to contribute to the rapid
growth in Real Estate • Large demand-supply gap in affordable housing
Demand fuelled by the availability of loans at low interest rates, tax incentives and a growing middle class with higher savings
• Increasing demand for commercial and office space especially from the rapidly growing Retail, IT/ ITeS and Hospitality sectors
• The recently announced National Urban Renewal Mission is expected to give a boost to the sector.
$22 billion (Rs. 100,000 crores) earmarked over the next five years for 60 cities
• Commercial space for organized retailing: over 200 million sq. ft. required by 2010 • Hotels & Hospitality: Over 50,000 new rooms need to be added in the next 5 years
Major foreign institutional investors including Morgan Stanley, Merrill Lynch, AIG, Rothschild Trust, Getty Trust, Blackstone and Calpers have shown interest in investing in Indian real estate
The sector requires a estimated Investment of over $50 billion in the next five years 4. Retail Current Status India is one of the ten largest retail markets in the world; however the sector has not been
opened fully to foreign investment • Retail sales were $206 billion in 2004, constituting over 30% of total GDP
Despite having a high growth rate of over 20% in the last 5 years, ‘Organized Retail’ constitutes only 3% of total retail sales - about $6.4 billion p.a. • Compared with 85% for USA, 40% for Thailand and 20% for China.
The Indian Retail sector is highly fragmented: mostly owner-run ‘Mom and Pop’ outlets • Over 12 million retail outlets
Annexures
Investment Commission
69
Investment Goal: $5-6 Bn
• Five-fold growth in
organized retail
Current Investment
Visibility: $1 Bn
• Average outlet size < 500 sq.ft. There are a few medium sized Indian retail chains like Pantaloon, Shoppers’ Stop,
Foodworld (RPG Group) and Trent/ Westside (Tata Group) – all growing rapidly • Mainly in the apparel and food & grocery segments
Dairy Farm and Metro have a presence in India, while Shoprite, Marks & Spencer etc. are present through franchisees
Outlook
The overall retail market is expected to grow three-fold in the next 10 years from $206 billion today to about $660 billion by 2015 • India is expected to be among the top 5 retail markets
in the world in 10 years Organized retail is expected to grow rapidly to reach $100
billion by 2015 • Likely to account for 12-15% of total retail sales by
2015 High growth projected in domestic retail demand; fuelled by:
• The migration of population to higher income segments with increasing per capita incomes
• An increase in urbanization • Changing consumer attitudes especially the increasing use of credit cards • The growth of the population in the 20 to 49 years age band
There is retail opportunity in most product categories and for all types of formats • Food and Grocery: The largest category; largely unorganized today • Home Improvement and Consumer Durables: Over 20% p.a. CAGR estimated in the
next 10 years • Apparel and Eating Out: 13% p.a. CAGR projected over 10 years • Opportunities for investment in supply chain infrastructure: Cold chain and logistics
India also has significant potential to emerge as a sourcing base for a wide variety of goods for international retail companies • Many international retailers including Wal-Mart, GAP, JC Penney etc. are already
procuring from India Many of the global leaders in retail have expressed high degree of interest in the Indian
retail market Total estimated investment of $5-$6 Billion required in the next five years
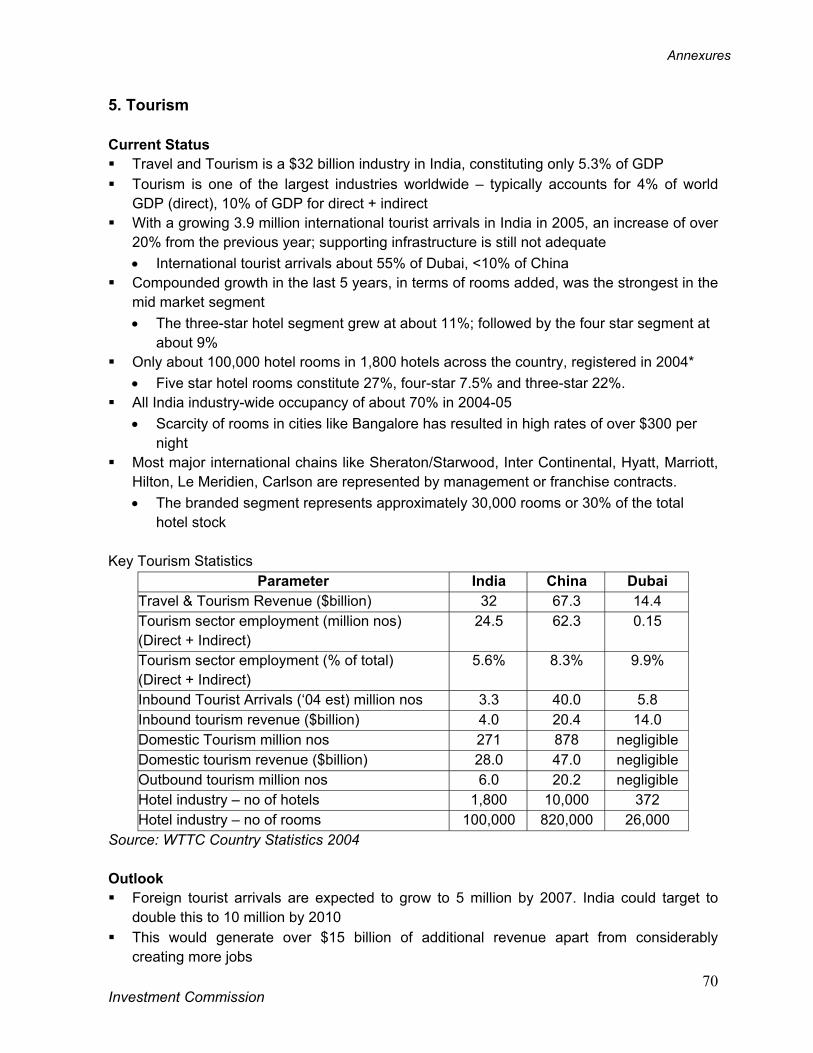
Annexures
Investment Commission
70
5. Tourism Current Status Travel and Tourism is a $32 billion industry in India, constituting only 5.3% of GDP Tourism is one of the largest industries worldwide – typically accounts for 4% of world
GDP (direct), 10% of GDP for direct + indirect With a growing 3.9 million international tourist arrivals in India in 2005, an increase of over
20% from the previous year; supporting infrastructure is still not adequate • International tourist arrivals about 55% of Dubai, <10% of China
Compounded growth in the last 5 years, in terms of rooms added, was the strongest in the mid market segment • The three-star hotel segment grew at about 11%; followed by the four star segment at
about 9% Only about 100,000 hotel rooms in 1,800 hotels across the country, registered in 2004*
• Five star hotel rooms constitute 27%, four-star 7.5% and three-star 22%. All India industry-wide occupancy of about 70% in 2004-05
• Scarcity of rooms in cities like Bangalore has resulted in high rates of over $300 per night
Most major international chains like Sheraton/Starwood, Inter Continental, Hyatt, Marriott, Hilton, Le Meridien, Carlson are represented by management or franchise contracts. • The branded segment represents approximately 30,000 rooms or 30% of the total
hotel stock
Key Tourism Statistics Parameter India China Dubai
Travel & Tourism Revenue ($billion) 32 67.3 14.4 Tourism sector employment (million nos) (Direct + Indirect)
24.5
62.3
0.15
Tourism sector employment (% of total) (Direct + Indirect)
5.6% 8.3% 9.9%
Inbound Tourist Arrivals (‘04 est) million nos 3.3 40.0 5.8 Inbound tourism revenue ($billion) 4.0 20.4 14.0 Domestic Tourism million nos 271 878 negligible Domestic tourism revenue ($billion) 28.0 47.0 negligible Outbound tourism million nos 6.0 20.2 negligible Hotel industry – no of hotels 1,800 10,000 372 Hotel industry – no of rooms 100,000 820,000 26,000
Source: WTTC Country Statistics 2004 Outlook Foreign tourist arrivals are expected to grow to 5 million by 2007. India could target to
double this to 10 million by 2010 This would generate over $15 billion of additional revenue apart from considerably
creating more jobs
Annexures
Investment Commission
71
Total Investment
Need: $8-10 Billion
• Over 100,000
additional hotel
rooms needed
Current Investment
Visibility: $1 Billion
Domestic tourism is expected to increase by 15% to 20% p.a. over the next five years Rapid growth in average room rates is expected to continue until sufficient new supply
comes on stream • Average room rates increased by 21% in 2005 over 2004
Favourable demographics and rapid economic growth point to a long term secular uptrend in the domestic demand for hotels – for business and leisure
International inbound traffic is expected to grow rapidly with increasing investment and trade activity • India’s rich heritage and natural beauty are just
beginning to be marketed to international leisure travellers.
The growth momentum in domestic and international travel is expected to receive a further boost with more budget airlines/lower air-fares, open sky policies and expected improvements in travel infrastructure (roads, airports, railways)
Investment requirement of about $8-10 billion in the next 5 years across hotel-rooms, resorts, spas, entertainment parks etc.
Annexures
Investment Commission
72
Investment Goal: $ 20-
25 Bn
• 70% increase in
steel demand
• 35 to 40% increase
in aluminium
demand in 5 years
Current Investment
Visibility: $14 Bn
C. Manufacturing 1. Metals: Steel & Aluminium Current Status India is among the top 10 global suppliers of aluminum and steel in the world
• About 35 million tonnes of steel is produced in India • India is also the largest producer of sponge iron in the world
The Metals industry employs about one million people and generates over $13 billion in revenues (2004-05)
India consumes over 0.75 million tonnes of aluminum and 0.4 million tonnes of copper annually • Low per capita consumption today: 30 kg of steel as compared to 150 kg
Globally, 0.6 kg of aluminum as compared to 3–4 kg in the developing countries The industry is dominated by large integrated players like SAIL and Tata Steel in steel and
Hindalco and Nalco in aluminium • The Public sector has a significant presence in most metal industries
Steel Authority of India Ltd. (SAIL) has 32% of India’s installed capacity of crude steel
Nalco has 38% of India’s installed capacity of aluminium • Tata Steel, Hindalco and Sterlite are the major private players in the industry
Outlook
India has the potential to become one of the world’s top five suppliers and top five markets for aluminium and steel • Steel consumption is expected to grow by 8% p.a. to 60
million tonnes by 2010 • Aluminium demand is expected to grow by 10% p.a. for the
next ten years • Low per capita consumption of metals is projected to
increase substantially in the future Large integrated international metal manufacturers including
POSCO, Mittal Steel and Dubai Aluminium have announced plans for setting up plants in India
Investment need of over $15 billion for integrated steel manufacturing and about $5 billion for aluminium manufacture by 2010
2. Textiles & Garments Current Status Textiles is a $36 billion industry in India; it constitutes about 5% of the GDP
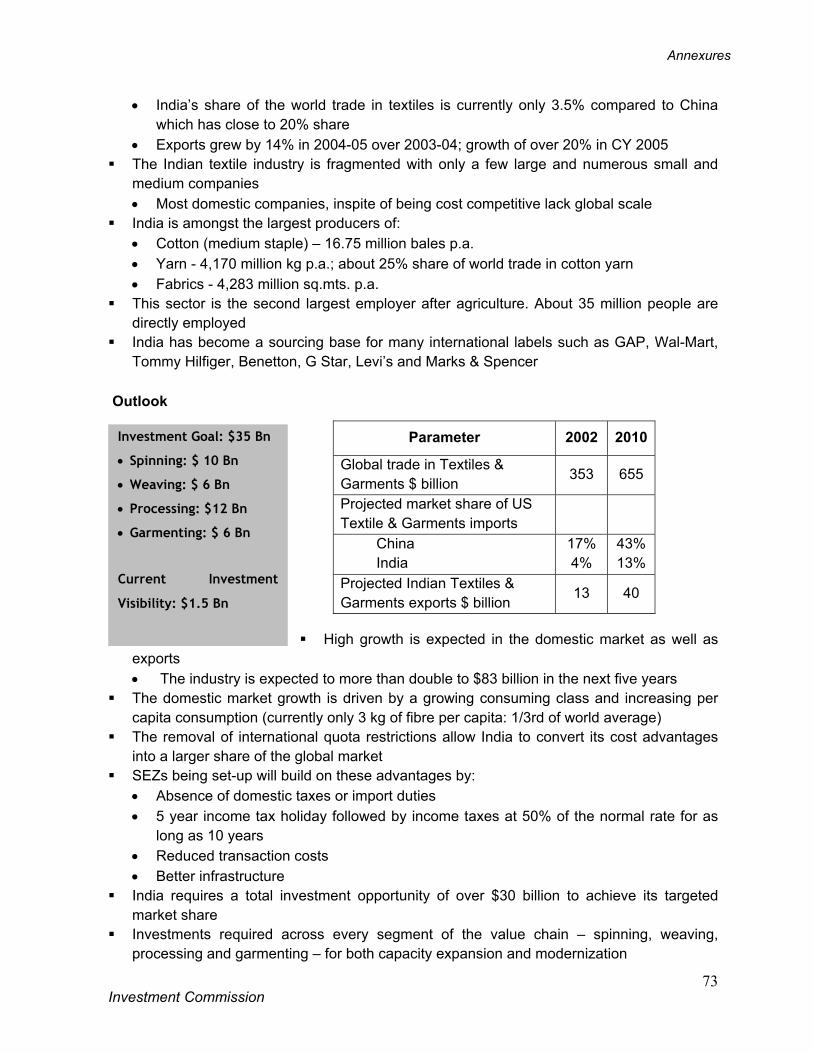
Annexures
Investment Commission
73
Investment Goal: $35 Bn
• Spinning: $ 10 Bn
• Weaving: $ 6 Bn
• Processing: $12 Bn
• Garmenting: $ 6 Bn
Current Investment
Visibility: $1.5 Bn
• India’s share of the world trade in textiles is currently only 3.5% compared to China which has close to 20% share
• Exports grew by 14% in 2004-05 over 2003-04; growth of over 20% in CY 2005 The Indian textile industry is fragmented with only a few large and numerous small and
medium companies • Most domestic companies, inspite of being cost competitive lack global scale
India is amongst the largest producers of: • Cotton (medium staple) – 16.75 million bales p.a. • Yarn - 4,170 million kg p.a.; about 25% share of world trade in cotton yarn • Fabrics - 4,283 million sq.mts. p.a.
This sector is the second largest employer after agriculture. About 35 million people are directly employed
India has become a sourcing base for many international labels such as GAP, Wal-Mart, Tommy Hilfiger, Benetton, G Star, Levi’s and Marks & Spencer
Outlook
High growth is expected in the domestic market as well as exports • The industry is expected to more than double to $83 billion in the next five years
The domestic market growth is driven by a growing consuming class and increasing per capita consumption (currently only 3 kg of fibre per capita: 1/3rd of world average)
The removal of international quota restrictions allow India to convert its cost advantages into a larger share of the global market
SEZs being set-up will build on these advantages by: • Absence of domestic taxes or import duties • 5 year income tax holiday followed by income taxes at 50% of the normal rate for as
long as 10 years • Reduced transaction costs • Better infrastructure
India requires a total investment opportunity of over $30 billion to achieve its targeted market share
Investments required across every segment of the value chain – spinning, weaving, processing and garmenting – for both capacity expansion and modernization
Parameter 2002 2010
Global trade in Textiles & Garments $ billion
353 655
Projected market share of US Textile & Garments imports
China India
17% 4%
43% 13%
Projected Indian Textiles & Garments exports $ billion
13 40
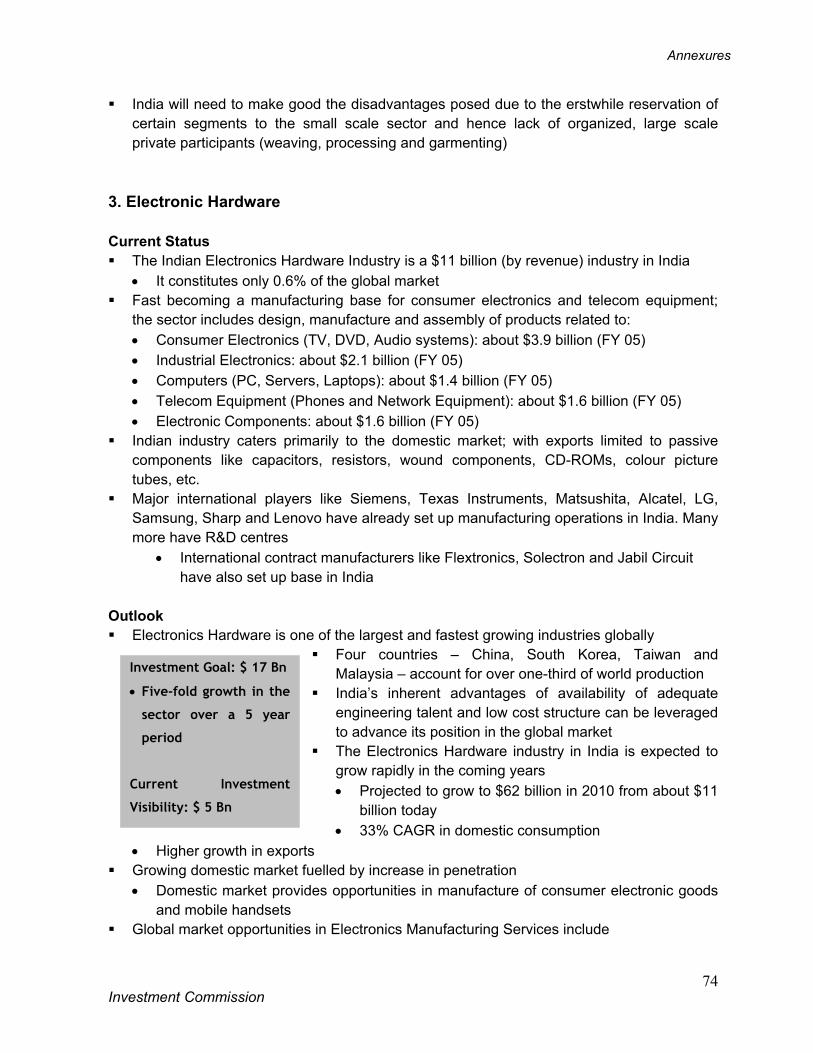
Annexures
Investment Commission
74
Investment Goal: $ 17 Bn
• Five-fold growth in the
sector over a 5 year
period
Current Investment
Visibility: $ 5 Bn
India will need to make good the disadvantages posed due to the erstwhile reservation of certain segments to the small scale sector and hence lack of organized, large scale private participants (weaving, processing and garmenting)
3. Electronic Hardware Current Status The Indian Electronics Hardware Industry is a $11 billion (by revenue) industry in India
• It constitutes only 0.6% of the global market Fast becoming a manufacturing base for consumer electronics and telecom equipment;
the sector includes design, manufacture and assembly of products related to: • Consumer Electronics (TV, DVD, Audio systems): about $3.9 billion (FY 05) • Industrial Electronics: about $2.1 billion (FY 05) • Computers (PC, Servers, Laptops): about $1.4 billion (FY 05) • Telecom Equipment (Phones and Network Equipment): about $1.6 billion (FY 05) • Electronic Components: about $1.6 billion (FY 05)
Indian industry caters primarily to the domestic market; with exports limited to passive components like capacitors, resistors, wound components, CD-ROMs, colour picture tubes, etc.
Major international players like Siemens, Texas Instruments, Matsushita, Alcatel, LG, Samsung, Sharp and Lenovo have already set up manufacturing operations in India. Many more have R&D centres
• International contract manufacturers like Flextronics, Solectron and Jabil Circuit have also set up base in India
Outlook Electronics Hardware is one of the largest and fastest growing industries globally
Four countries – China, South Korea, Taiwan and Malaysia – account for over one-third of world production
India’s inherent advantages of availability of adequate engineering talent and low cost structure can be leveraged to advance its position in the global market
The Electronics Hardware industry in India is expected to grow rapidly in the coming years • Projected to grow to $62 billion in 2010 from about $11
billion today • 33% CAGR in domestic consumption
• Higher growth in exports Growing domestic market fuelled by increase in penetration
• Domestic market provides opportunities in manufacture of consumer electronic goods and mobile handsets
Global market opportunities in Electronics Manufacturing Services include
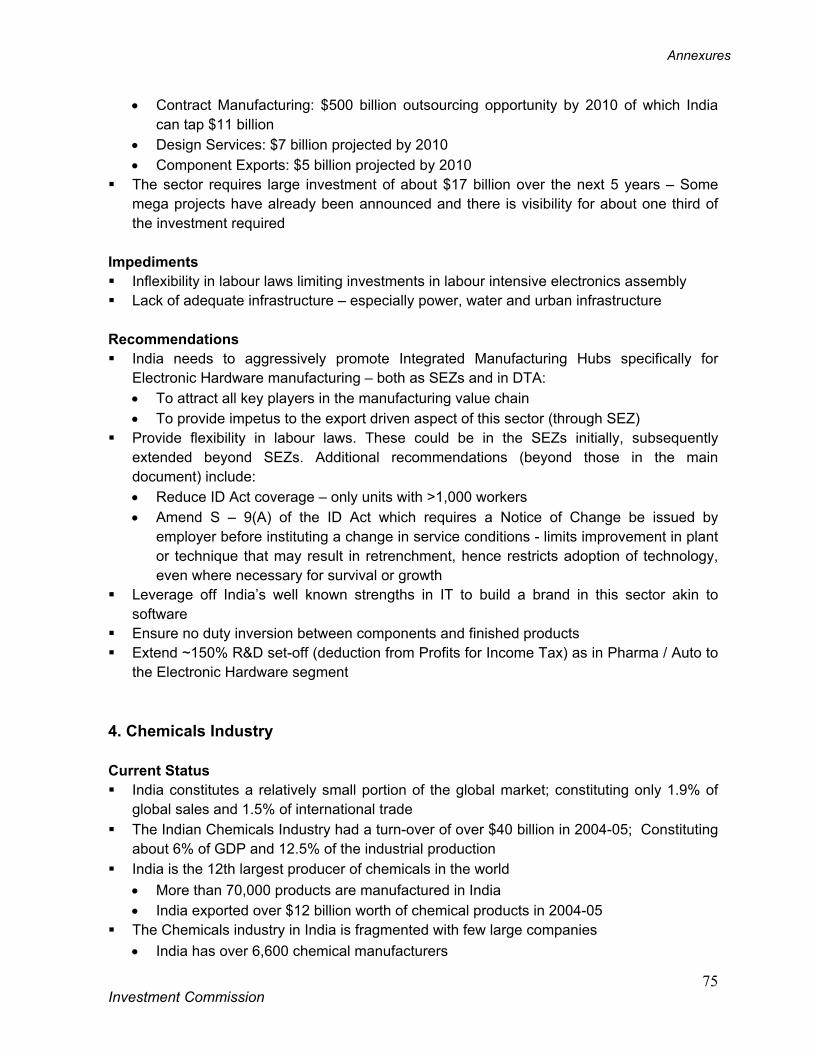
Annexures
Investment Commission
75
• Contract Manufacturing: $500 billion outsourcing opportunity by 2010 of which India can tap $11 billion
• Design Services: $7 billion projected by 2010 • Component Exports: $5 billion projected by 2010
The sector requires large investment of about $17 billion over the next 5 years – Some mega projects have already been announced and there is visibility for about one third of the investment required
Impediments Inflexibility in labour laws limiting investments in labour intensive electronics assembly Lack of adequate infrastructure – especially power, water and urban infrastructure
Recommendations India needs to aggressively promote Integrated Manufacturing Hubs specifically for
Electronic Hardware manufacturing – both as SEZs and in DTA: • To attract all key players in the manufacturing value chain • To provide impetus to the export driven aspect of this sector (through SEZ)
Provide flexibility in labour laws. These could be in the SEZs initially, subsequently extended beyond SEZs. Additional recommendations (beyond those in the main document) include: • Reduce ID Act coverage – only units with >1,000 workers • Amend S – 9(A) of the ID Act which requires a Notice of Change be issued by
employer before instituting a change in service conditions - limits improvement in plant or technique that may result in retrenchment, hence restricts adoption of technology, even where necessary for survival or growth
Leverage off India’s well known strengths in IT to build a brand in this sector akin to software
Ensure no duty inversion between components and finished products Extend ~150% R&D set-off (deduction from Profits for Income Tax) as in Pharma / Auto to
the Electronic Hardware segment
4. Chemicals Industry Current Status India constitutes a relatively small portion of the global market; constituting only 1.9% of
global sales and 1.5% of international trade The Indian Chemicals Industry had a turn-over of over $40 billion in 2004-05; Constituting
about 6% of GDP and 12.5% of the industrial production India is the 12th largest producer of chemicals in the world
• More than 70,000 products are manufactured in India • India exported over $12 billion worth of chemical products in 2004-05
The Chemicals industry in India is fragmented with few large companies • India has over 6,600 chemical manufacturers
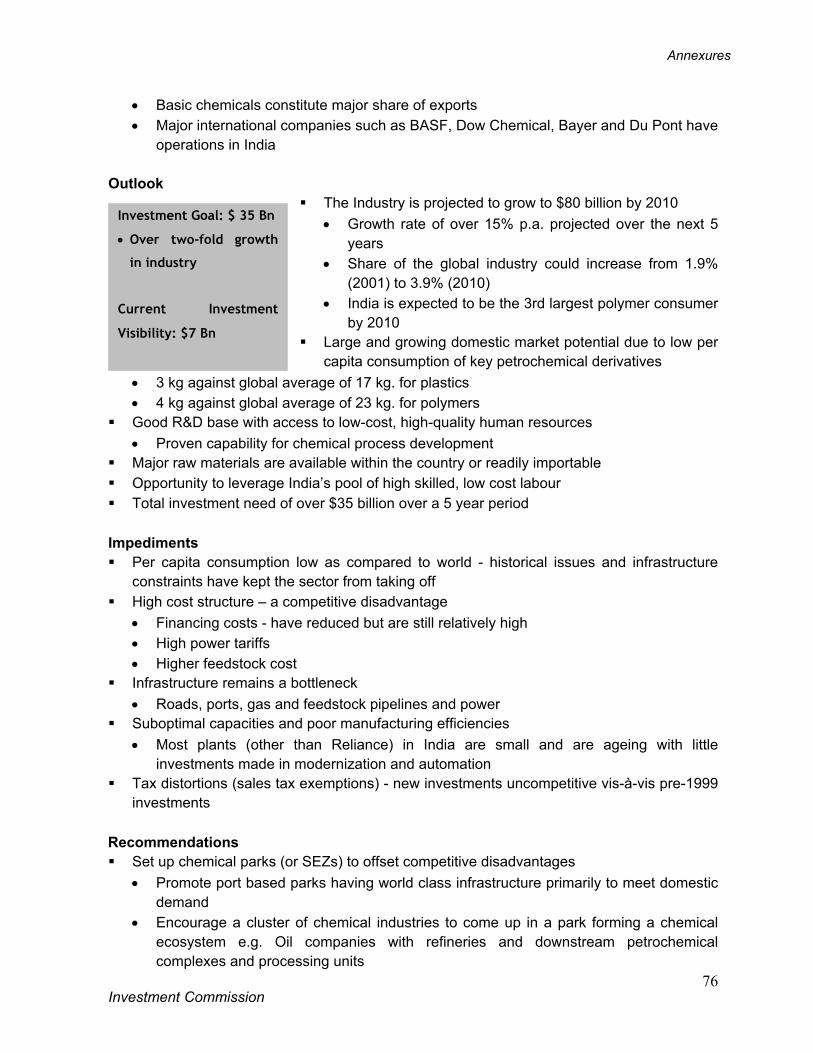
Annexures
Investment Commission
76
Investment Goal: $ 35 Bn
• Over two-fold growth
in industry
Current Investment
Visibility: $7 Bn
• Basic chemicals constitute major share of exports • Major international companies such as BASF, Dow Chemical, Bayer and Du Pont have
operations in India Outlook
The Industry is projected to grow to $80 billion by 2010 • Growth rate of over 15% p.a. projected over the next 5
years • Share of the global industry could increase from 1.9%
(2001) to 3.9% (2010) • India is expected to be the 3rd largest polymer consumer
by 2010 Large and growing domestic market potential due to low per
capita consumption of key petrochemical derivatives • 3 kg against global average of 17 kg. for plastics • 4 kg against global average of 23 kg. for polymers
Good R&D base with access to low-cost, high-quality human resources • Proven capability for chemical process development
Major raw materials are available within the country or readily importable Opportunity to leverage India’s pool of high skilled, low cost labour Total investment need of over $35 billion over a 5 year period
Impediments Per capita consumption low as compared to world - historical issues and infrastructure
constraints have kept the sector from taking off High cost structure – a competitive disadvantage
• Financing costs - have reduced but are still relatively high • High power tariffs • Higher feedstock cost
Infrastructure remains a bottleneck • Roads, ports, gas and feedstock pipelines and power
Suboptimal capacities and poor manufacturing efficiencies • Most plants (other than Reliance) in India are small and are ageing with little
investments made in modernization and automation Tax distortions (sales tax exemptions) - new investments uncompetitive vis-à-vis pre-1999
investments Recommendations Set up chemical parks (or SEZs) to offset competitive disadvantages
• Promote port based parks having world class infrastructure primarily to meet domestic demand
• Encourage a cluster of chemical industries to come up in a park forming a chemical ecosystem e.g. Oil companies with refineries and downstream petrochemical complexes and processing units
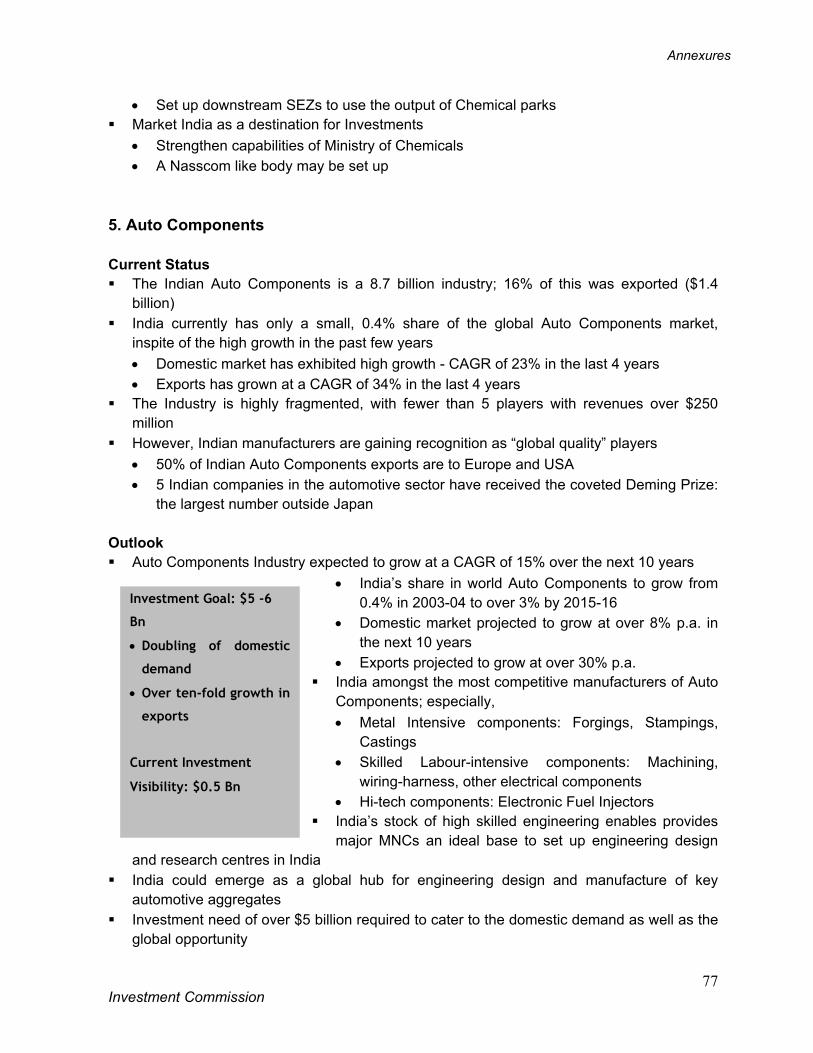
Annexures
Investment Commission
77
Investment Goal: $5 -6
Bn
• Doubling of domestic
demand
• Over ten-fold growth in
exports
Current Investment
Visibility: $0.5 Bn
• Set up downstream SEZs to use the output of Chemical parks Market India as a destination for Investments
• Strengthen capabilities of Ministry of Chemicals • A Nasscom like body may be set up
5. Auto Components Current Status The Indian Auto Components is a 8.7 billion industry; 16% of this was exported ($1.4
billion) India currently has only a small, 0.4% share of the global Auto Components market,
inspite of the high growth in the past few years • Domestic market has exhibited high growth - CAGR of 23% in the last 4 years • Exports has grown at a CAGR of 34% in the last 4 years
The Industry is highly fragmented, with fewer than 5 players with revenues over $250 million
However, Indian manufacturers are gaining recognition as “global quality” players • 50% of Indian Auto Components exports are to Europe and USA • 5 Indian companies in the automotive sector have received the coveted Deming Prize:
the largest number outside Japan Outlook Auto Components Industry expected to grow at a CAGR of 15% over the next 10 years
• India’s share in world Auto Components to grow from 0.4% in 2003-04 to over 3% by 2015-16
• Domestic market projected to grow at over 8% p.a. in the next 10 years
• Exports projected to grow at over 30% p.a. India amongst the most competitive manufacturers of Auto
Components; especially, • Metal Intensive components: Forgings, Stampings,
Castings • Skilled Labour-intensive components: Machining,
wiring-harness, other electrical components • Hi-tech components: Electronic Fuel Injectors
India’s stock of high skilled engineering enables provides major MNCs an ideal base to set up engineering design
and research centres in India India could emerge as a global hub for engineering design and manufacture of key
automotive aggregates Investment need of over $5 billion required to cater to the domestic demand as well as the
global opportunity

Annexures
Investment Commission
78
Investment Goal: $13 Bn
• Two-fold growth in
domestic market
• R&D and Engineering
Investments
Current Investment
Visibility: $2 Bn
6. Auto Current Status The Indian Auto Industry is a $24 billion industry; About 4% of GDP Exports constitute 5% of Indian revenues The Auto Industry in India has witnessed very high growth rates: A growth rate of over
15% CAGR in vehicle production in the last 4 years 8.6 million vehicles produced in India in 2004-05, of which
• 1.2 million Passenger Cars; 13.5% CAGR over the last 4 years • 6.6 million Two-wheelers (motor cycles and scooters); 15% CAGR over the last 4
years • 0.38 million Commercial Vehicles; 24% CAGR over the last 4 years • 0.37 million Three-wheelers; 17% CAGR over the last 4 years
However, India still has low vehicle penetration • Only 3 cars, 50 two-wheelers per 1000 individuals
Global Auto OEMs are setting up new manufacturing facilities in mainly six low cost regions - Mexico, South America, Eastern Europe, China, South East Asia and India.
Outlook
Auto market expected to double in the next 7 years • Vehicle production expected to increase from 8.6 million
vehicles in 2004-05 to 15 million by 2010-11 Overall growth of over 12% p.a. will have some segments
that outperform: • Passenger Cars and Two-wheelers expected to be the
fastest growing segments • Heavy Trucks to drive growth in commercial vehicles
Potential need for investment of over $13 billion in the next 5 years
Global majors including Suzuki, Hyundai and Honda have committed resources of over $2 billion for capacity expansion
India has the opportunity to become a major player in the global CV and two-wheeler market, a global hub for manufacture of small cars and for Engineering and Design Services
7. Food & Agro-processing Current Status India has only a 1.7% share in world exports of agri products (2003) inspite of having a
large output of agricultural produce, with the 2nd largest arable land area in the world • India is the largest producer of milk, pulses, sugarcane and tea in the world • The 2nd largest producer of wheat, rice, fruits and vegetables in the world
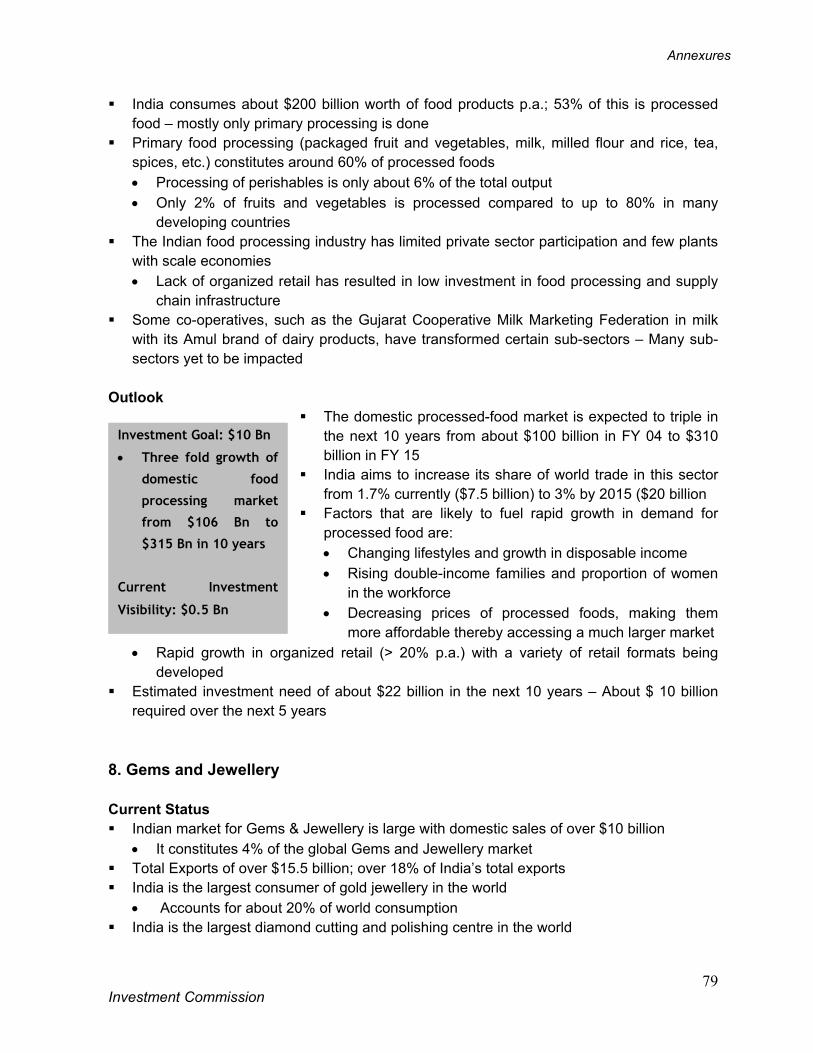
Annexures
Investment Commission
79
Investment Goal: $10 Bn
• Three fold growth of
domestic food
processing market
from $106 Bn to
$315 Bn in 10 years
Current Investment
Visibility: $0.5 Bn
India consumes about $200 billion worth of food products p.a.; 53% of this is processed food – mostly only primary processing is done
Primary food processing (packaged fruit and vegetables, milk, milled flour and rice, tea, spices, etc.) constitutes around 60% of processed foods • Processing of perishables is only about 6% of the total output • Only 2% of fruits and vegetables is processed compared to up to 80% in many
developing countries The Indian food processing industry has limited private sector participation and few plants
with scale economies • Lack of organized retail has resulted in low investment in food processing and supply
chain infrastructure Some co-operatives, such as the Gujarat Cooperative Milk Marketing Federation in milk
with its Amul brand of dairy products, have transformed certain sub-sectors – Many sub-sectors yet to be impacted
Outlook
The domestic processed-food market is expected to triple in the next 10 years from about $100 billion in FY 04 to $310 billion in FY 15
India aims to increase its share of world trade in this sector from 1.7% currently ($7.5 billion) to 3% by 2015 ($20 billion
Factors that are likely to fuel rapid growth in demand for processed food are: • Changing lifestyles and growth in disposable income • Rising double-income families and proportion of women
in the workforce • Decreasing prices of processed foods, making them
more affordable thereby accessing a much larger market • Rapid growth in organized retail (> 20% p.a.) with a variety of retail formats being
developed Estimated investment need of about $22 billion in the next 10 years – About $ 10 billion
required over the next 5 years 8. Gems and Jewellery Current Status Indian market for Gems & Jewellery is large with domestic sales of over $10 billion
• It constitutes 4% of the global Gems and Jewellery market Total Exports of over $15.5 billion; over 18% of India’s total exports India is the largest consumer of gold jewellery in the world
• Accounts for about 20% of world consumption India is the largest diamond cutting and polishing centre in the world
Annexures
Investment Commission
80
• 60% value share, 85% volume share and 92% share of the world market by number of pieces
• Third largest consumer of polished diamonds after USA and Japan The Indian Gems & Jewellery industry is highly fragmented with a large number of
domestic private sector companies • A large portion of the market is in the unorganized sector
India is gaining prominence as an international sourcing destination for high quality designer jewellery • Walmart, JC Penney etc. procure jewellery from India
Outlook India is the fastest-growing jewellery market in the world
• Branded jewellery likely to be the fastest-growing segment in domestic sales Expected to grow at 40% p.a. to $2.2 billion by 2010
• Exports expected to grow from $15.5 billion in 2005 to over $25 billion by 2010 India has several well recognized strengths which have made it a significant force in the
global Gems and Jewellery business • Highly skilled, yet low-cost labour • Established manufacturing excellence in jewellery and diamond polishing • India is the most technologically advanced diamond cutting centre in the world
Impediments Global threats from other competing regions – Africa, Israel and Dubai
• Africa is the leading rough diamond producer in the world (of which Botswana has a 50% share) valued at $10 billion annually. South Africa is leading an African initiative to raise local content in beneficiation to increase value and generate employment. This poses a major threat to India regarding access to smaller size roughs and even greater competition for the higher value larger size, both from Africa as well as Russia.
• Belgian Diamantaires are looking to relocate due to rising costs and unhelpful EU legislation - Dubai and Israel are actively wooing these relocatees
Recommendations The key elements to attract the bulk of relocates out of Belgium are:
• Identify and develop SEZs for Gems & Jewellery • Flexible labour policies (as detailed in the Electronic Hardware section) • Remove import duty on polished diamonds; continue zero import duty on rough
diamonds. • Adopt a presumptive tax regime of 0.5-1.0% on turnover, as in Belgium and Israel.
Rule of Law and a welcoming attitude from government agencies (customs, tax) is necessary – actions such as seizure of goods and pressure tactics lower India’s attractiveness.
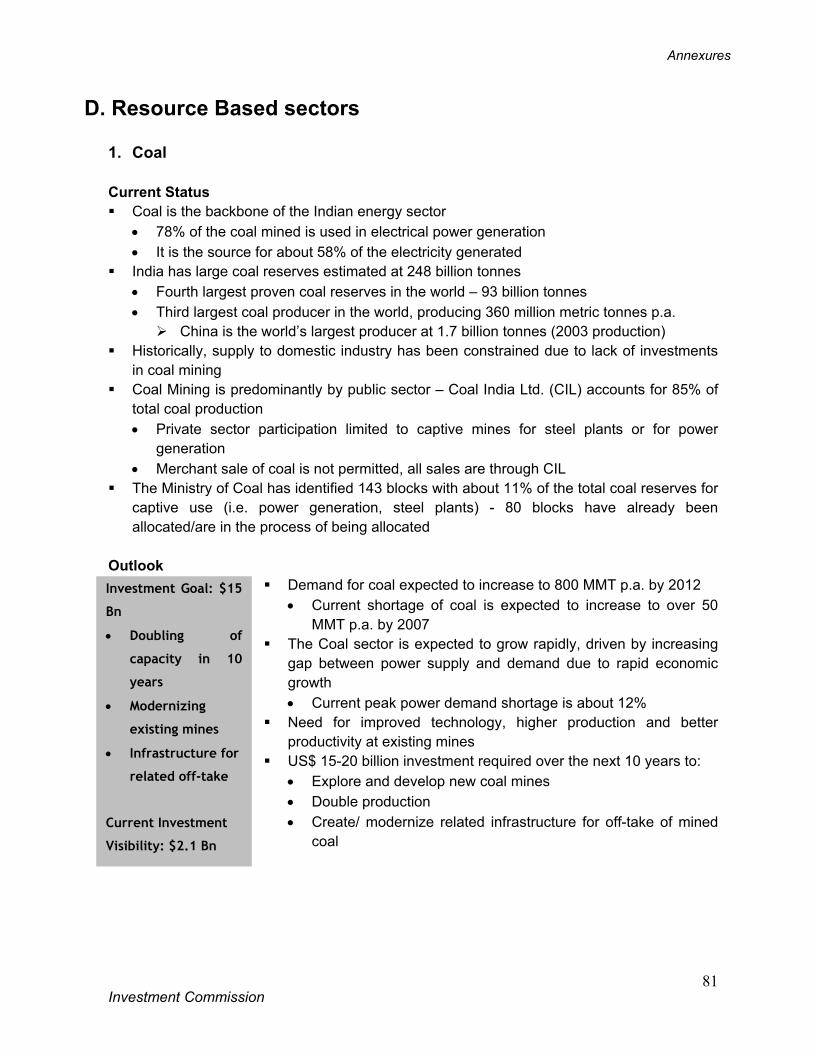
Annexures
Investment Commission
81
Investment Goal: $15
Bn
• Doubling of
capacity in 10
years
• Modernizing
existing mines
• Infrastructure for
related off-take
Current Investment
Visibility: $2.1 Bn
D. Resource Based sectors 1. Coal Current Status Coal is the backbone of the Indian energy sector
• 78% of the coal mined is used in electrical power generation • It is the source for about 58% of the electricity generated
India has large coal reserves estimated at 248 billion tonnes • Fourth largest proven coal reserves in the world – 93 billion tonnes • Third largest coal producer in the world, producing 360 million metric tonnes p.a.
China is the world’s largest producer at 1.7 billion tonnes (2003 production) Historically, supply to domestic industry has been constrained due to lack of investments
in coal mining Coal Mining is predominantly by public sector – Coal India Ltd. (CIL) accounts for 85% of
total coal production • Private sector participation limited to captive mines for steel plants or for power
generation • Merchant sale of coal is not permitted, all sales are through CIL
The Ministry of Coal has identified 143 blocks with about 11% of the total coal reserves for captive use (i.e. power generation, steel plants) - 80 blocks have already been allocated/are in the process of being allocated
Outlook
Demand for coal expected to increase to 800 MMT p.a. by 2012 • Current shortage of coal is expected to increase to over 50
MMT p.a. by 2007 The Coal sector is expected to grow rapidly, driven by increasing
gap between power supply and demand due to rapid economic growth • Current peak power demand shortage is about 12%
Need for improved technology, higher production and better productivity at existing mines
US$ 15-20 billion investment required over the next 10 years to: • Explore and develop new coal mines • Double production • Create/ modernize related infrastructure for off-take of mined
coal
Annexures
Investment Commission
82
Investment Goal: $10 -
15 Bn
• Mining & Quarrying
• Modernization of
Mines
• Off-take
infrastructure
Current Investment
Visibility: $1.1 Bn
2. Metal Ores Current Status India is rich in mineral resources with large reserves of several primary metal ores like iron
ore, bauxite, chromium, manganese and titanium India has
• 13 billion tonnes of iron ore reserves - the 5th largest reserve base in the world • 2.3 billion tonnes of bauxite reserves - the 4th largest reserve base in the world • 160 million tonnes of manganese reserves – the 2nd largest reserve base in the world • 57 million tonnes of chromium reserves – the 3rd largest reserve base in the world
Indian deposits of bauxite and iron-ore are among the best in the world in terms of quality and mineability
The Mining Sector continues to be dominated largely by public sector companies which account for over 80% of the total value of minerals produced
Orissa, Jharkhand and Chattisgarh are the most mineral-rich states of India • Orissa has over 50% of India’s bauxite reserves and over 20% of India’s reserves of
iron ore Outlook
Indian mineral production is expected to grow rapidly in the coming years – driven by growth in metal manufacturing • Iron ore production is expected to grow at a CAGR of 10 -
12% over the next five years, in step with rapid growth in the steel industry
• Bauxite production is expected to double to over 23 million tonnes by 2010
High growth is expected in the consumption of manganese and chromium as well
While India has 7.5% of the world’s total bauxite deposits, aluminium production capacity is only 3% of world capacity, indicating the scope and need for new capacities
Estimated 82 billion tonnes of reserves of various metals yet to be tapped resulting in large scope for investments in mining of Iron ore and Bauxite
India’s advantage of good quality ores, low labour and conversion cost, strategic location (proximity to South East Asia and Europe) can be leveraged to expand export of steel and Aluminium
Total Investment of $10-$15 billion required in five years 3. Oil & Gas Exploration Current Status Oil & Gas provides for 35% of India’s energy requirements
• It is a critical input for downstream industries like petrochemicals, fertilizers and energy
Annexures
Investment Commission
83
Investment Goal: $7–8
Bn
• Investments under
current and future
blocks through
NELP
Current Investment
Visibility: $4.1 Bn
Crude oil demand is currently about 116 MMT while the domestic production of crude is only 33.4 MMT • Crude oil imports increased by 7% p.a. during the last 3 years
Natural gas demand is about 150 MMSCMD (2004) while the domestic supply is only 81 MMSCMD • Several major gas finds have taken place in India in the last few years
Oil and Natural Gas Commission (ONGC) and Oil India Limited (OIL), both public sector companies, are the largest with about 83% share of the total domestic oil and gas production
The Exploration and Production (E&P) sector is witnessing increasing private sector participation: both domestic & foreign • In the last four years, private sector/JV companies have made 32 significant
hydrocarbon discoveries • The world’s largest gas discovery in 2002 (about 5 trillion cubic metres) was made by
Reliance Industries Ltd. International E&P companies like Hardy Oil & Gas, Niko Resources and Cairn Energy are
already present in India Outlook
Crude Oil demand is projected to increase to about 190 MMT by 2012 • Rising global Crude Oil prices have triggered increased E &
P focus to expand domestic production Gas demand is expected to reach 330 MMSCMD by 2012
• A CAGR of 10% for the next seven years • Increased use of gas for power generation, petrochemicals,
fertilizers and city gas distribution will drive demand growth Growing demand supply mismatch provides ample opportunities
for investment • Exploration and production of Crude Oil, Gas and CBM
32% of the Indian sedimentary area is unexplored – discovery of oil fields by investors such as Cairn Energy and ‘giant’ gas fields by Reliance, ONGC, etc. indicate a large potential for profitable investment in exploration
Investment need of $7-8 billion in exploration and production by 2010
Annexures
Investment Commission
84
Total Investment
Need: $ 7.5 Bn
Three-fold
growth in the
Pharma industry
Five-fold growth
in Biotech
Current Investment
Visibility: $ 0.2 Bn
E. Knowledge based sectors 1. Pharma & Biotechnology Current Status The Indian Pharmaceutical industry is about $8.8 billion (FY04) constituting only 1.3% of
the GDP • The domestic market is about $4.8 billion
India occupies a significant position in the world Pharma market, especially in generics • 8% by volume (4th largest in the world) and 1.5% by value (13th largest) • Export of generics accounts for 38% of the Pharma sector revenues
However, per capita spend on Pharma products is low at only $5 p.a.; India ranks 67th in the world
India has a nascent but rapidly growing Biotech industry – $750 million in revenues in 2003-04 • Currently, it constitutes only 1.5% share of the global Biotech market
The Pharmaceutical industry in India is fragmented with over 3,000 small/medium sized generic pharma manufacturers
Outlook
The Indian Pharmaceutical industry (including exports) is expected to grow at 23% p.a. till 2010. From $ 9 billion in 2004 to $25 billion by 2010 • The domestic market is also expected to double in the next 5
years to over $10 billion The Biotech industry is also projected to grow at a CAGR of 39%;
from 0.75 billion in 2004 to over $ billion by 2009. • India’s share of the global market is also expected to increase
significantly India could effectively leverage its position of a low cost
destination for high end research and manufacturing to carve a significant position in the world market
Total Investment of about $7 billion required in the next five years Impediments Lack of adequate enforcement of IP Act is a deterrent to increased spend in pharma and
biotech research Inadequate infrastructure facilities, especially urban infrastructure Need for larger pool of trained personnel to cater to the segment’s employment needs
Recommendations New Biotechnology Policy to simplify the regulatory processes for the sector:
• Reduce clearance time for new products by differentiating between low risk and high risk products (as proposed)
Annexures
Investment Commission
85
• Need for a single window Regulatory Authority • Encourage stem cell research while avoiding ethical issues interfering with the
development of this sector – like China • Public-private partnerships and venture firms (on the lines of IDFC for infrastructure)
for funding pharma and biotech start-ups on the lines of Singapore’s investment group Bio*One Capital.
Set up Special Economic Zones and Biotech Parks with world class infrastructure Ensure clarity, consistency and long term stability of tax regime Higher tax incentives for R&D to attract multinational drug research investment alongside
manufacturing Set up science parks, create a cluster of research organizations
• World class facilities and living environment • Close proximity to centres of education
Encourage partnerships between academia and commercial research Invest in University system (and not only Research Institute) education for this sector and
create a pool of scientific and technical manpower 2. Healthcare Current Status Healthcare delivery is one of the largest service-sector industries in India
• Estimated revenue of about $30 billion (FY 2005) • However it constitutes only 5% of the GDP
Industry growth at over 12% p.a. in the past four years However India's health expenditure per capita is only 35 per cent of middle-income
countries and 3.6 per cent of rich countries (adjusted for purchasing power parity). Large domestic market complemented by the inflow of medical tourists
• Medical tourists have increased ten-fold from 10,000 in 2000-01 to about 100,000 in 2004-05
The industry is fragmented with a large number of independent, privately-run hospital and healthcare centres • Private healthcare providers account for 63% of the total spend • The Government sector and corporate employers account for the rest
There is a modest presence of private sector corporate entities like Apollo Hospitals and Fortis Healthcare
Indian hospitals are gaining reputation globally as ‘quality’ service providers • Many Indian hospitals have secured accreditation from the British Standards Institute
and Joint Commission on Accreditation of Healthcare Organizations • NHS, UK has indicated India as a preferred destination for surgery
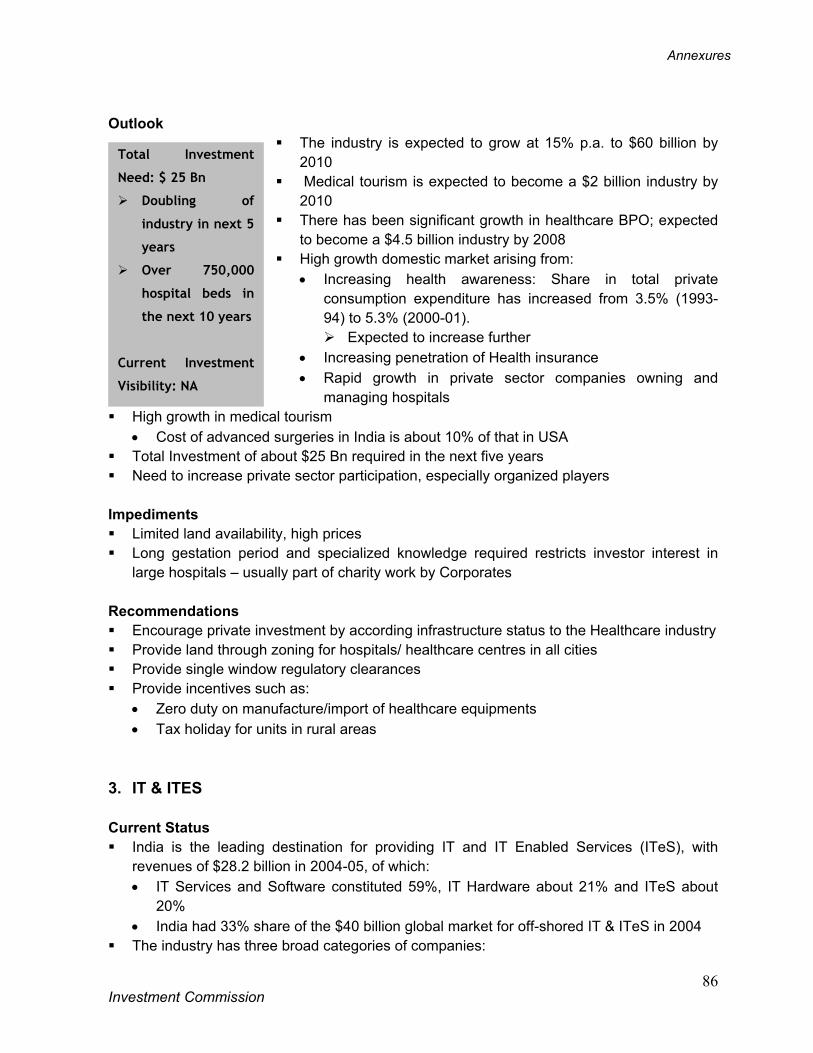
Annexures
Investment Commission
86
Total Investment
Need: $ 25 Bn
Doubling of
industry in next 5
years
Over 750,000
hospital beds in
the next 10 years
Current Investment
Visibility: NA
Outlook
The industry is expected to grow at 15% p.a. to $60 billion by 2010
Medical tourism is expected to become a $2 billion industry by 2010
There has been significant growth in healthcare BPO; expected to become a $4.5 billion industry by 2008
High growth domestic market arising from: • Increasing health awareness: Share in total private
consumption expenditure has increased from 3.5% (1993-94) to 5.3% (2000-01).
Expected to increase further • Increasing penetration of Health insurance • Rapid growth in private sector companies owning and
managing hospitals High growth in medical tourism
• Cost of advanced surgeries in India is about 10% of that in USA Total Investment of about $25 Bn required in the next five years Need to increase private sector participation, especially organized players
Impediments Limited land availability, high prices Long gestation period and specialized knowledge required restricts investor interest in
large hospitals – usually part of charity work by Corporates Recommendations Encourage private investment by according infrastructure status to the Healthcare industry Provide land through zoning for hospitals/ healthcare centres in all cities Provide single window regulatory clearances Provide incentives such as:
• Zero duty on manufacture/import of healthcare equipments • Tax holiday for units in rural areas
3. IT & ITES Current Status India is the leading destination for providing IT and IT Enabled Services (ITeS), with
revenues of $28.2 billion in 2004-05, of which: • IT Services and Software constituted 59%, IT Hardware about 21% and ITeS about
20% • India had 33% share of the $40 billion global market for off-shored IT & ITeS in 2004
The industry has three broad categories of companies:
Annexures
Investment Commission
87
• Indian IT and ITeS companies – ranging from large companies (Tata Consultancy Services, Infosys, Wipro, HCL) to small niche companies
• Global IT companies such as IBM, Dell, Microsoft, HP, etc. all of whom have set up development centres in India
• Captive back office operations of large global corporations like JP Morgan, American Express, GE, Citigroup, HSBC, British Airways, etc.
Indian companies account for over 69% of the industry revenues. International companies account for the rest
About 45% of Fortune 500 corporations source software from India Outlook The Indian IT and ITeS industry is expected to grow to $148 billion by 2012
• Over 25% p.a. CAGR expected over the next seven years India aims to achieve a 50% share in the global off-shored IT and ITeS services by 2008 Recognition of India’s strengths internationally
• Increasing awareness among global companies about India’s capabilities in higher, value added activities and in the Global Delivery Model
• Leading international companies have identified custom application development and maintenance as priority areas due to high off-shoreable component
High growth of domestic IT & ITeS market due to several regulatory and technological factors: • Initiatives to reduce software piracy and increase in PC adoption, usage and
penetration • Measures to increase affordability of PCs
Opportunity to supply to the global market in addition to serving the growing domestic demand
According to Nasscom, the sector could generate over 2.3 million direct jobs and over 6.8 million indirect jobs by 2010

Annexures
Investment Commission
88
Annexure 3
Recommendations and Status Update – Feb ‘05
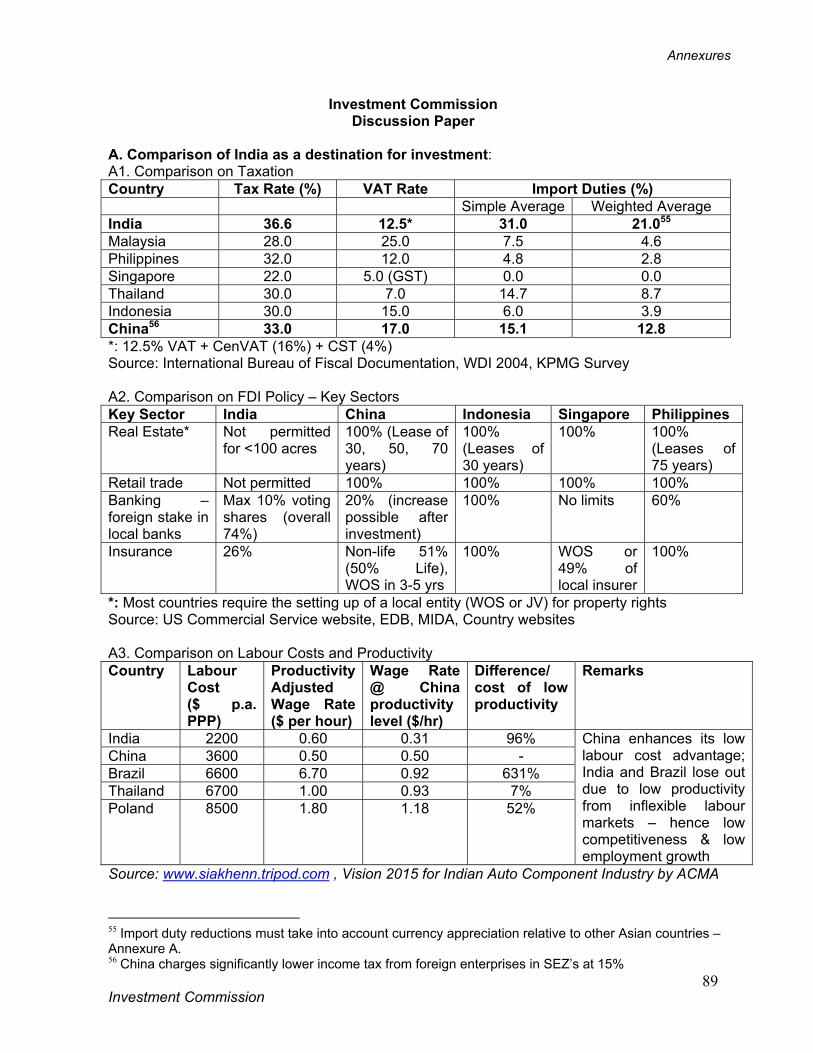
Annexures
Investment Commission
89
Investment Commission Discussion Paper
A. Comparison of India as a destination for investment: A1. Comparison on Taxation Country Tax Rate (%) VAT Rate Import Duties (%) Simple Average Weighted Average India 36.6 12.5* 31.0 21.055 Malaysia 28.0 25.0 7.5 4.6 Philippines 32.0 12.0 4.8 2.8 Singapore 22.0 5.0 (GST) 0.0 0.0 Thailand 30.0 7.0 14.7 8.7 Indonesia 30.0 15.0 6.0 3.9 China56 33.0 17.0 15.1 12.8 *: 12.5% VAT + CenVAT (16%) + CST (4%) Source: International Bureau of Fiscal Documentation, WDI 2004, KPMG Survey A2. Comparison on FDI Policy – Key Sectors Key Sector India China Indonesia Singapore Philippines Real Estate* Not permitted
for <100 acres 100% (Lease of 30, 50, 70 years)
100% (Leases of 30 years)
100% 100% (Leases of 75 years)
Retail trade Not permitted 100% 100% 100% 100% Banking – foreign stake in local banks
Max 10% voting shares (overall 74%)
20% (increase possible after investment)
100% No limits 60%
Insurance 26% Non-life 51% (50% Life), WOS in 3-5 yrs
100% WOS or 49% of local insurer
100%
*: Most countries require the setting up of a local entity (WOS or JV) for property rights Source: US Commercial Service website, EDB, MIDA, Country websites A3. Comparison on Labour Costs and Productivity Country Labour
Cost ($ p.a. PPP)
Productivity Adjusted Wage Rate ($ per hour)
Wage Rate @ China productivity level ($/hr)
Difference/ cost of low productivity
Remarks
India 2200 0.60 0.31 96% China 3600 0.50 0.50 - Brazil 6600 6.70 0.92 631% Thailand 6700 1.00 0.93 7% Poland 8500 1.80 1.18 52%
China enhances its low labour cost advantage; India and Brazil lose out due to low productivity from inflexible labour markets – hence low competitiveness & low employment growth
Source: www.siakhenn.tripod.com , Vision 2015 for Indian Auto Component Industry by ACMA
55 Import duty reductions must take into account currency appreciation relative to other Asian countries – Annexure A. 56 China charges significantly lower income tax from foreign enterprises in SEZ’s at 15%
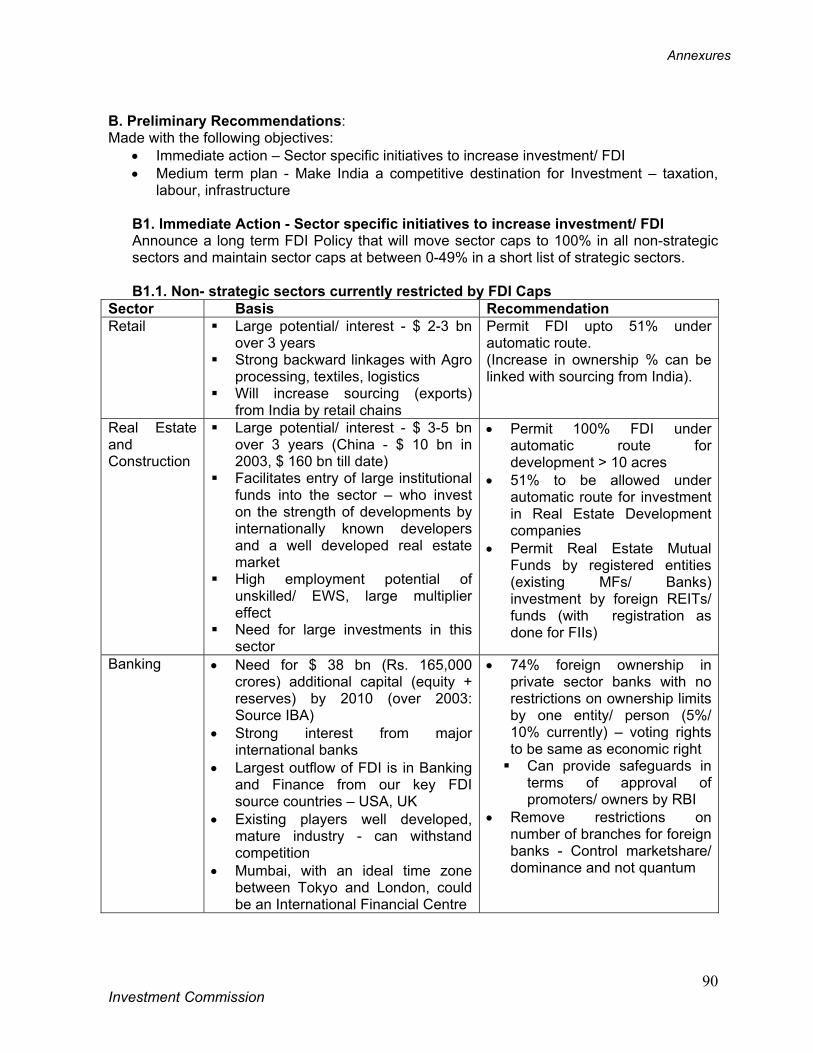
Annexures
Investment Commission
90
B. Preliminary Recommendations: Made with the following objectives:
• Immediate action – Sector specific initiatives to increase investment/ FDI • Medium term plan - Make India a competitive destination for Investment – taxation,
labour, infrastructure
B1. Immediate Action - Sector specific initiatives to increase investment/ FDI Announce a long term FDI Policy that will move sector caps to 100% in all non-strategic sectors and maintain sector caps at between 0-49% in a short list of strategic sectors. B1.1. Non- strategic sectors currently restricted by FDI Caps
Sector Basis Recommendation Retail Large potential/ interest - $ 2-3 bn
over 3 years Strong backward linkages with Agro
processing, textiles, logistics Will increase sourcing (exports)
from India by retail chains
Permit FDI upto 51% under automatic route. (Increase in ownership % can be linked with sourcing from India).
Real Estate and Construction
Large potential/ interest - $ 3-5 bn over 3 years (China - $ 10 bn in 2003, $ 160 bn till date)
Facilitates entry of large institutional funds into the sector – who invest on the strength of developments by internationally known developers and a well developed real estate market
High employment potential of unskilled/ EWS, large multiplier effect
Need for large investments in this sector
• Permit 100% FDI under automatic route for development > 10 acres
• 51% to be allowed under automatic route for investment in Real Estate Development companies
• Permit Real Estate Mutual Funds by registered entities (existing MFs/ Banks) investment by foreign REITs/ funds (with registration as done for FIIs)
Banking • Need for $ 38 bn (Rs. 165,000 crores) additional capital (equity + reserves) by 2010 (over 2003: Source IBA)
• Strong interest from major international banks
• Largest outflow of FDI is in Banking and Finance from our key FDI source countries – USA, UK
• Existing players well developed, mature industry - can withstand competition
• Mumbai, with an ideal time zone between Tokyo and London, could be an International Financial Centre
• 74% foreign ownership in private sector banks with no restrictions on ownership limits by one entity/ person (5%/ 10% currently) – voting rights to be same as economic right Can provide safeguards in
terms of approval of promoters/ owners by RBI
• Remove restrictions on number of branches for foreign banks - Control marketshare/ dominance and not quantum
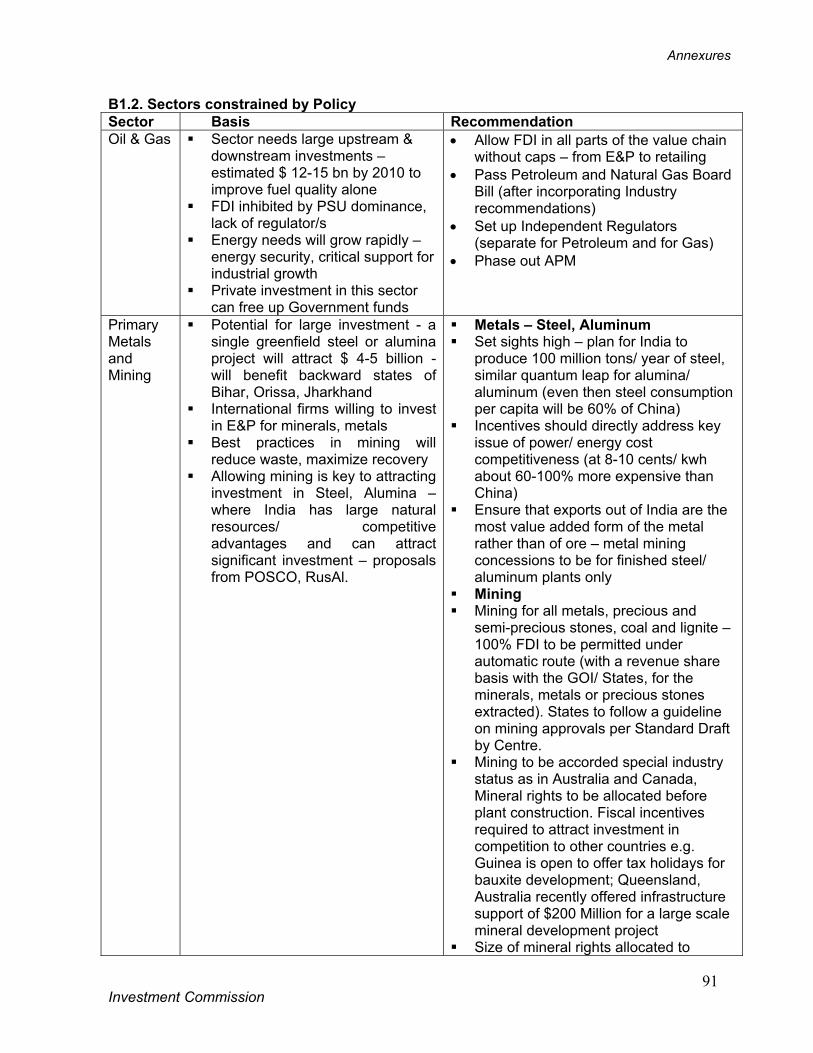
Annexures
Investment Commission
91
B1.2. Sectors constrained by Policy Sector Basis Recommendation Oil & Gas Sector needs large upstream &
downstream investments – estimated $ 12-15 bn by 2010 to improve fuel quality alone
FDI inhibited by PSU dominance, lack of regulator/s
Energy needs will grow rapidly – energy security, critical support for industrial growth
Private investment in this sector can free up Government funds
• Allow FDI in all parts of the value chain without caps – from E&P to retailing
• Pass Petroleum and Natural Gas Board Bill (after incorporating Industry recommendations)
• Set up Independent Regulators (separate for Petroleum and for Gas)
• Phase out APM
Primary Metals and Mining
Potential for large investment - a single greenfield steel or alumina project will attract $ 4-5 billion - will benefit backward states of Bihar, Orissa, Jharkhand
International firms willing to invest in E&P for minerals, metals
Best practices in mining will reduce waste, maximize recovery
Allowing mining is key to attracting investment in Steel, Alumina – where India has large natural resources/ competitive advantages and can attract significant investment – proposals from POSCO, RusAl.
Metals – Steel, Aluminum Set sights high – plan for India to
produce 100 million tons/ year of steel, similar quantum leap for alumina/ aluminum (even then steel consumption per capita will be 60% of China)
Incentives should directly address key issue of power/ energy cost competitiveness (at 8-10 cents/ kwh about 60-100% more expensive than China)
Ensure that exports out of India are the most value added form of the metal rather than of ore – metal mining concessions to be for finished steel/ aluminum plants only
Mining Mining for all metals, precious and
semi-precious stones, coal and lignite –100% FDI to be permitted under automatic route (with a revenue share basis with the GOI/ States, for the minerals, metals or precious stones extracted). States to follow a guideline on mining approvals per Standard Draft by Centre.
Mining to be accorded special industry status as in Australia and Canada, Mineral rights to be allocated before plant construction. Fiscal incentives required to attract investment in competition to other countries e.g. Guinea is open to offer tax holidays for bauxite development; Queensland, Australia recently offered infrastructure support of $200 Million for a large scale mineral development project
Size of mineral rights allocated to
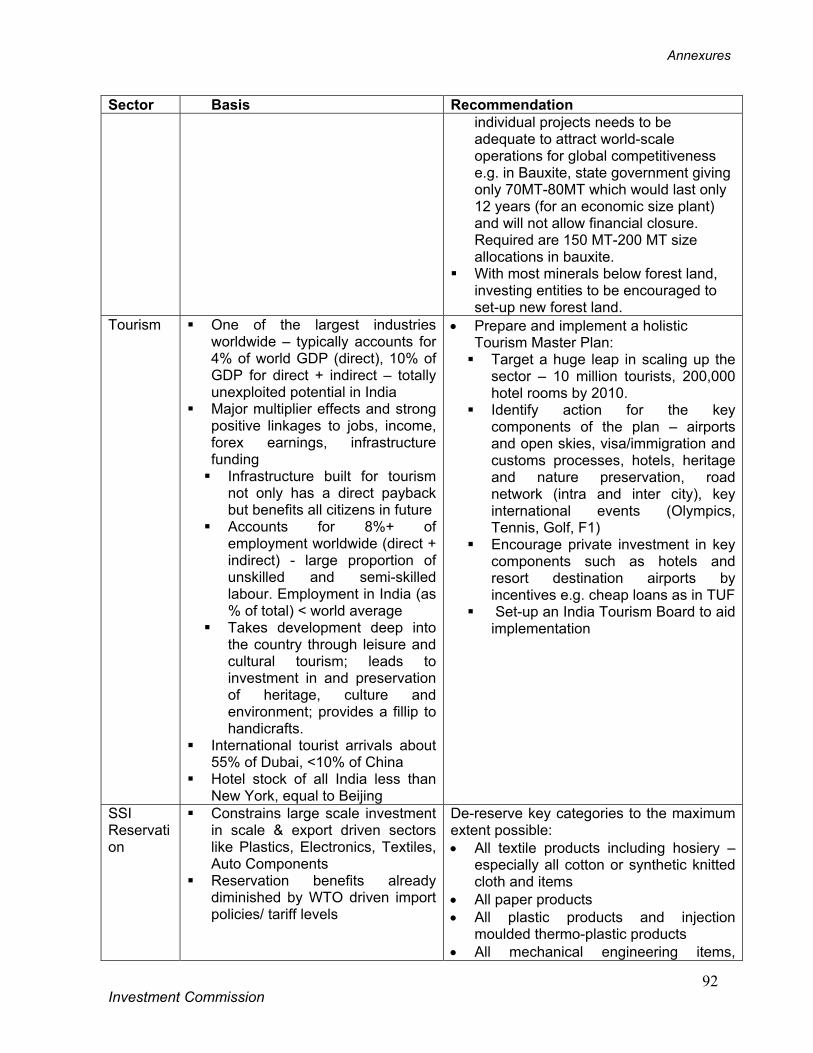
Annexures
Investment Commission
92
Sector Basis Recommendation individual projects needs to be adequate to attract world-scale operations for global competitiveness e.g. in Bauxite, state government giving only 70MT-80MT which would last only 12 years (for an economic size plant) and will not allow financial closure. Required are 150 MT-200 MT size allocations in bauxite.
With most minerals below forest land, investing entities to be encouraged to set-up new forest land.
Tourism One of the largest industries worldwide – typically accounts for 4% of world GDP (direct), 10% of GDP for direct + indirect – totally unexploited potential in India
Major multiplier effects and strong positive linkages to jobs, income, forex earnings, infrastructure funding Infrastructure built for tourism
not only has a direct payback but benefits all citizens in future
Accounts for 8%+ of employment worldwide (direct + indirect) - large proportion of unskilled and semi-skilled labour. Employment in India (as % of total) < world average
Takes development deep into the country through leisure and cultural tourism; leads to investment in and preservation of heritage, culture and environment; provides a fillip to handicrafts.
International tourist arrivals about 55% of Dubai, <10% of China
Hotel stock of all India less than New York, equal to Beijing
• Prepare and implement a holistic Tourism Master Plan: Target a huge leap in scaling up the
sector – 10 million tourists, 200,000 hotel rooms by 2010.
Identify action for the key components of the plan – airports and open skies, visa/immigration and customs processes, hotels, heritage and nature preservation, road network (intra and inter city), key international events (Olympics, Tennis, Golf, F1)
Encourage private investment in key components such as hotels and resort destination airports by incentives e.g. cheap loans as in TUF
Set-up an India Tourism Board to aid implementation
SSI Reservation
Constrains large scale investment in scale & export driven sectors like Plastics, Electronics, Textiles, Auto Components
Reservation benefits already diminished by WTO driven import policies/ tariff levels
De-reserve key categories to the maximum extent possible: • All textile products including hosiery –
especially all cotton or synthetic knitted cloth and items
• All paper products • All plastic products and injection
moulded thermo-plastic products • All mechanical engineering items,
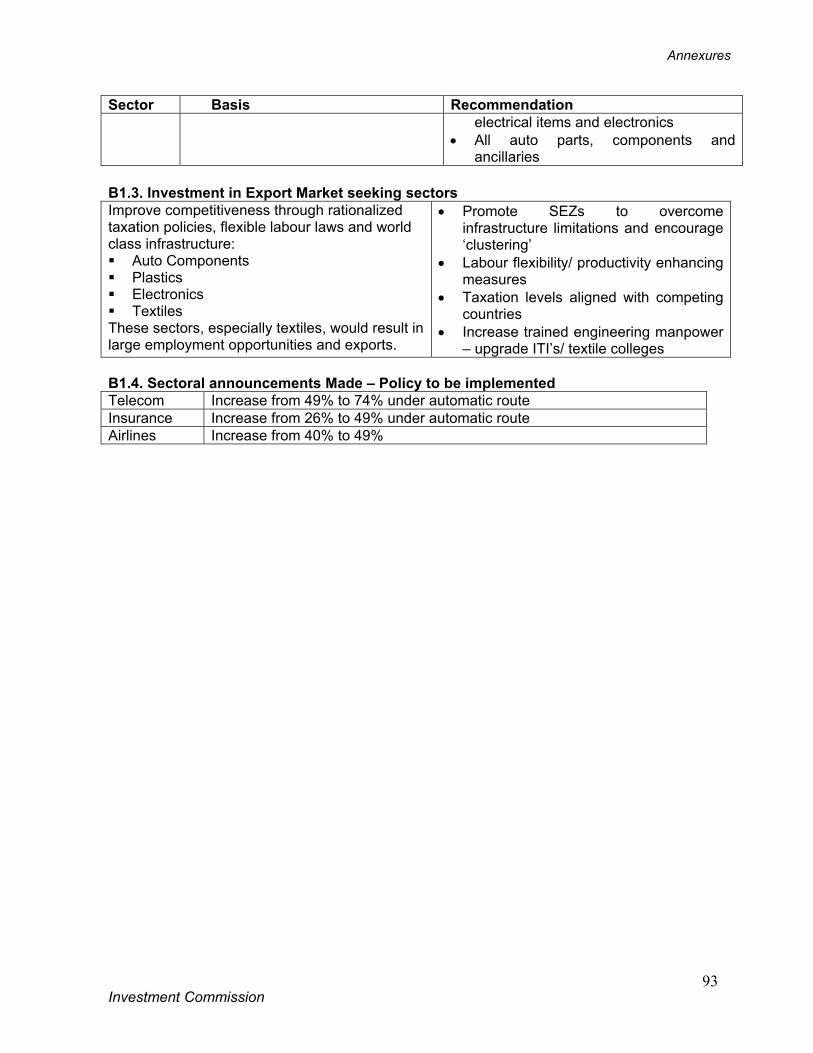
Annexures
Investment Commission
93
Sector Basis Recommendation electrical items and electronics
• All auto parts, components and ancillaries
B1.3. Investment in Export Market seeking sectors Improve competitiveness through rationalized taxation policies, flexible labour laws and world class infrastructure: Auto Components Plastics Electronics Textiles
These sectors, especially textiles, would result in large employment opportunities and exports.
• Promote SEZs to overcome infrastructure limitations and encourage ‘clustering’
• Labour flexibility/ productivity enhancing measures
• Taxation levels aligned with competing countries
• Increase trained engineering manpower – upgrade ITI’s/ textile colleges
B1.4. Sectoral announcements Made – Policy to be implemented Telecom Increase from 49% to 74% under automatic route Insurance Increase from 26% to 49% under automatic route Airlines Increase from 40% to 49%
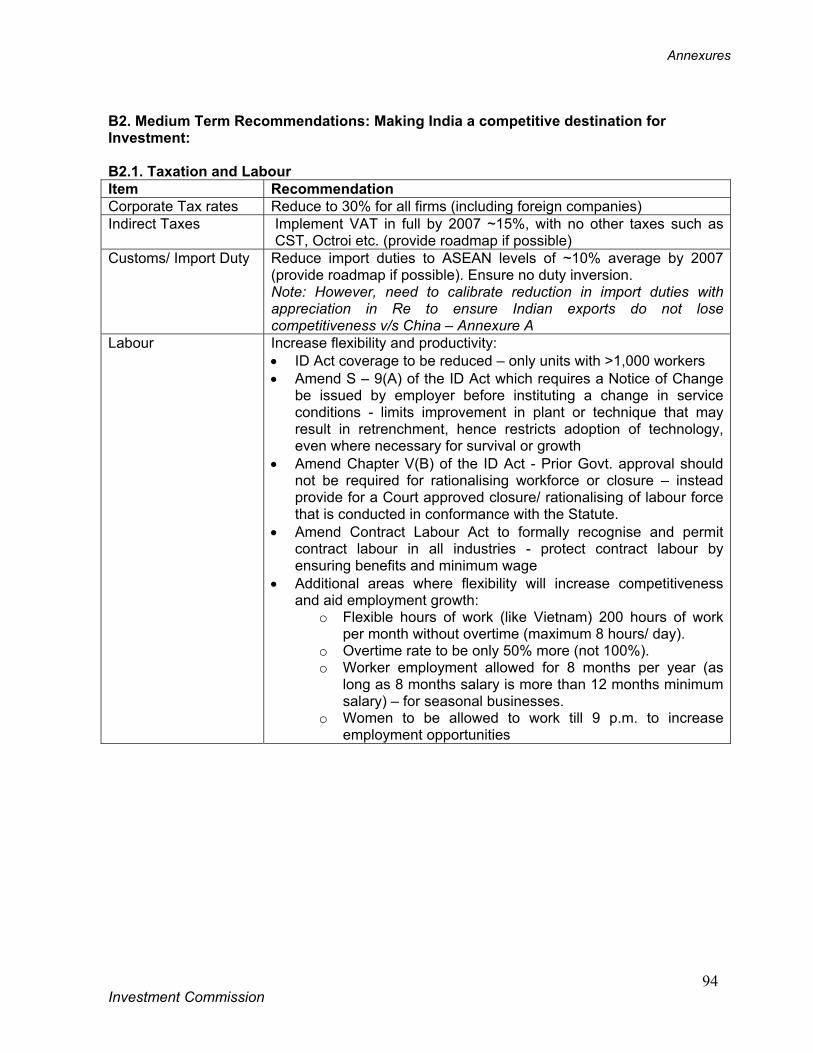
Annexures
Investment Commission
94
B2. Medium Term Recommendations: Making India a competitive destination for Investment: B2.1. Taxation and Labour Item Recommendation Corporate Tax rates Reduce to 30% for all firms (including foreign companies) Indirect Taxes Implement VAT in full by 2007 ~15%, with no other taxes such as
CST, Octroi etc. (provide roadmap if possible) Customs/ Import Duty
Reduce import duties to ASEAN levels of ~10% average by 2007 (provide roadmap if possible). Ensure no duty inversion. Note: However, need to calibrate reduction in import duties with appreciation in Re to ensure Indian exports do not lose competitiveness v/s China – Annexure A
Labour Increase flexibility and productivity: • ID Act coverage to be reduced – only units with >1,000 workers • Amend S – 9(A) of the ID Act which requires a Notice of Change
be issued by employer before instituting a change in service conditions - limits improvement in plant or technique that may result in retrenchment, hence restricts adoption of technology, even where necessary for survival or growth
• Amend Chapter V(B) of the ID Act - Prior Govt. approval should not be required for rationalising workforce or closure – instead provide for a Court approved closure/ rationalising of labour force that is conducted in conformance with the Statute.
• Amend Contract Labour Act to formally recognise and permit contract labour in all industries - protect contract labour by ensuring benefits and minimum wage
• Additional areas where flexibility will increase competitiveness and aid employment growth:
o Flexible hours of work (like Vietnam) 200 hours of work per month without overtime (maximum 8 hours/ day).
o Overtime rate to be only 50% more (not 100%). o Worker employment allowed for 8 months per year (as
long as 8 months salary is more than 12 months minimum salary) – for seasonal businesses.
o Women to be allowed to work till 9 p.m. to increase employment opportunities
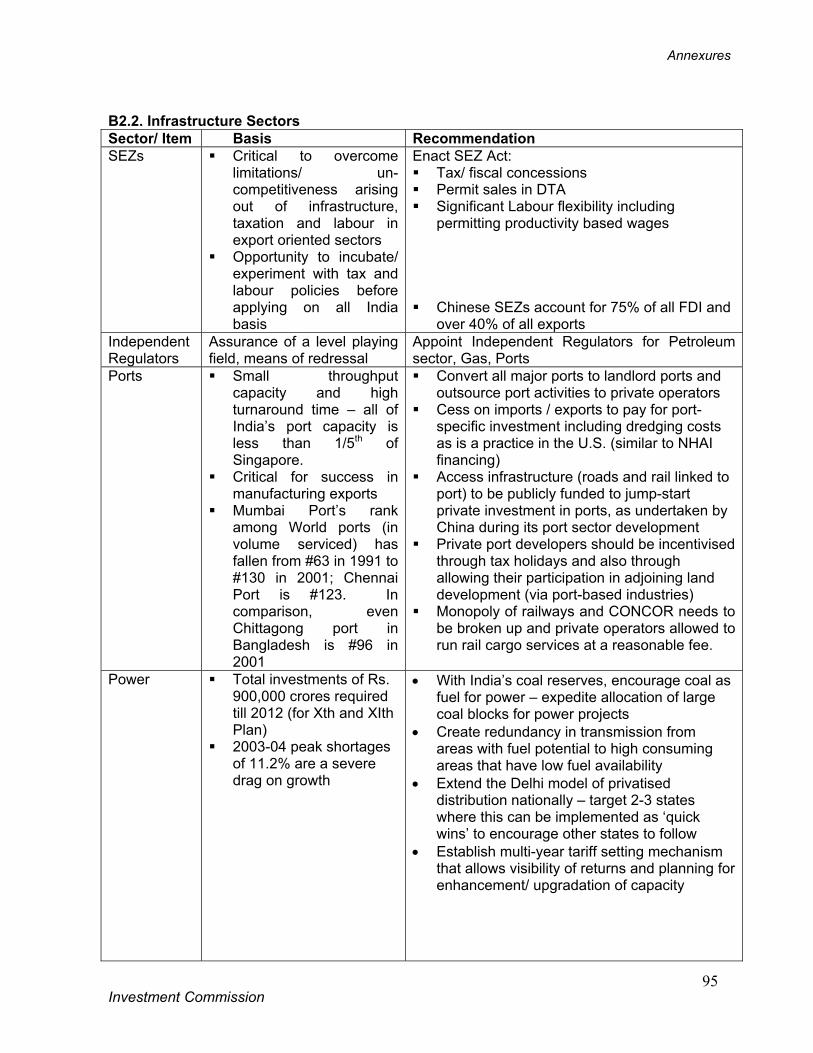
Annexures
Investment Commission
95
B2.2. Infrastructure Sectors Sector/ Item Basis Recommendation SEZs Critical to overcome
limitations/ un-competitiveness arising out of infrastructure, taxation and labour in export oriented sectors
Opportunity to incubate/ experiment with tax and labour policies before applying on all India basis
Enact SEZ Act: Tax/ fiscal concessions Permit sales in DTA Significant Labour flexibility including
permitting productivity based wages Chinese SEZs account for 75% of all FDI and
over 40% of all exports Independent Regulators
Assurance of a level playing field, means of redressal
Appoint Independent Regulators for Petroleum sector, Gas, Ports
Ports Small throughput capacity and high turnaround time – all of India’s port capacity is less than 1/5th of Singapore.
Critical for success in manufacturing exports
Mumbai Port’s rank among World ports (in volume serviced) has fallen from #63 in 1991 to #130 in 2001; Chennai Port is #123. In comparison, even Chittagong port in Bangladesh is #96 in 2001
Convert all major ports to landlord ports and outsource port activities to private operators
Cess on imports / exports to pay for port-specific investment including dredging costs as is a practice in the U.S. (similar to NHAI financing)
Access infrastructure (roads and rail linked to port) to be publicly funded to jump-start private investment in ports, as undertaken by China during its port sector development
Private port developers should be incentivised through tax holidays and also through allowing their participation in adjoining land development (via port-based industries)
Monopoly of railways and CONCOR needs to be broken up and private operators allowed to run rail cargo services at a reasonable fee.
Power Total investments of Rs. 900,000 crores required till 2012 (for Xth and XIth Plan)
2003-04 peak shortages of 11.2% are a severe drag on growth
• With India’s coal reserves, encourage coal as fuel for power – expedite allocation of large coal blocks for power projects
• Create redundancy in transmission from areas with fuel potential to high consuming areas that have low fuel availability
• Extend the Delhi model of privatised distribution nationally – target 2-3 states where this can be implemented as ‘quick wins’ to encourage other states to follow
• Establish multi-year tariff setting mechanism that allows visibility of returns and planning for enhancement/ upgradation of capacity
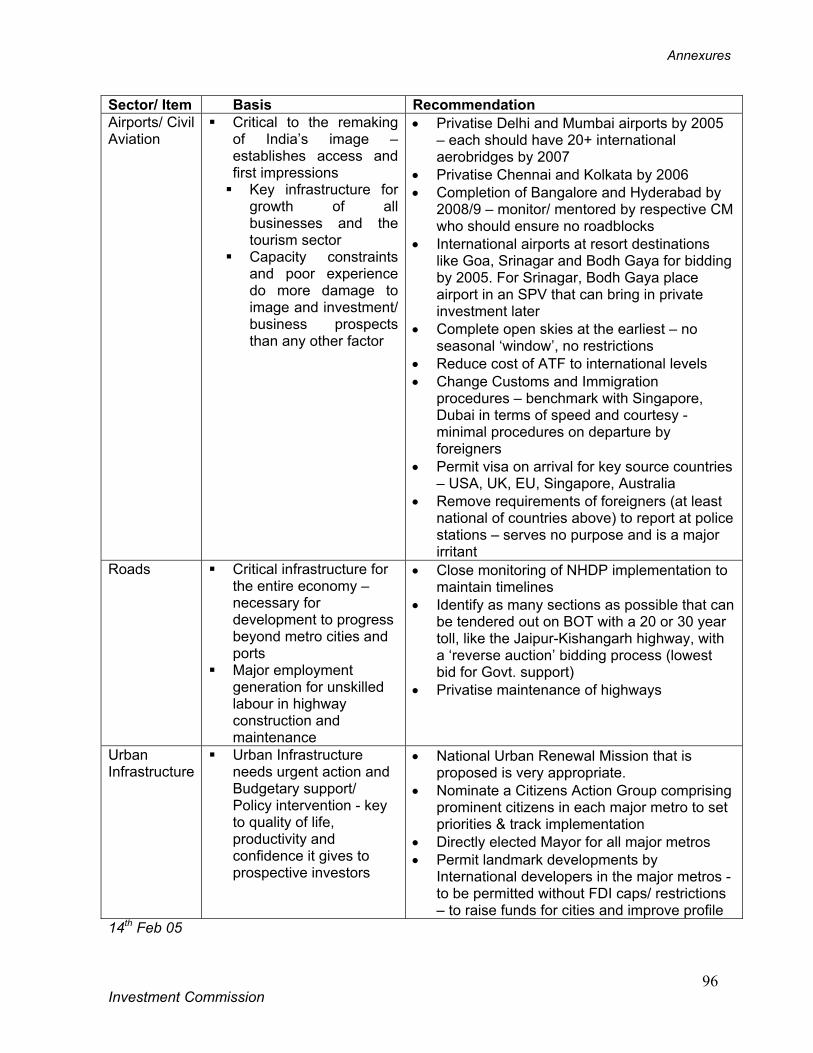
Annexures
Investment Commission
96
Sector/ Item Basis Recommendation Airports/ Civil Aviation
Critical to the remaking of India’s image – establishes access and first impressions Key infrastructure for
growth of all businesses and the tourism sector
Capacity constraints and poor experience do more damage to image and investment/ business prospects than any other factor
• Privatise Delhi and Mumbai airports by 2005 – each should have 20+ international aerobridges by 2007
• Privatise Chennai and Kolkata by 2006 • Completion of Bangalore and Hyderabad by
2008/9 – monitor/ mentored by respective CM who should ensure no roadblocks
• International airports at resort destinations like Goa, Srinagar and Bodh Gaya for bidding by 2005. For Srinagar, Bodh Gaya place airport in an SPV that can bring in private investment later
• Complete open skies at the earliest – no seasonal ‘window’, no restrictions
• Reduce cost of ATF to international levels • Change Customs and Immigration
procedures – benchmark with Singapore, Dubai in terms of speed and courtesy - minimal procedures on departure by foreigners
• Permit visa on arrival for key source countries – USA, UK, EU, Singapore, Australia
• Remove requirements of foreigners (at least national of countries above) to report at police stations – serves no purpose and is a major irritant
Roads Critical infrastructure for the entire economy – necessary for development to progress beyond metro cities and ports
Major employment generation for unskilled labour in highway construction and maintenance
• Close monitoring of NHDP implementation to maintain timelines
• Identify as many sections as possible that can be tendered out on BOT with a 20 or 30 year toll, like the Jaipur-Kishangarh highway, with a ‘reverse auction’ bidding process (lowest bid for Govt. support)
• Privatise maintenance of highways
Urban Infrastructure
Urban Infrastructure needs urgent action and Budgetary support/ Policy intervention - key to quality of life, productivity and confidence it gives to prospective investors
• National Urban Renewal Mission that is proposed is very appropriate.
• Nominate a Citizens Action Group comprising prominent citizens in each major metro to set priorities & track implementation
• Directly elected Mayor for all major metros • Permit landmark developments by
International developers in the major metros - to be permitted without FDI caps/ restrictions – to raise funds for cities and improve profile
14th Feb 05
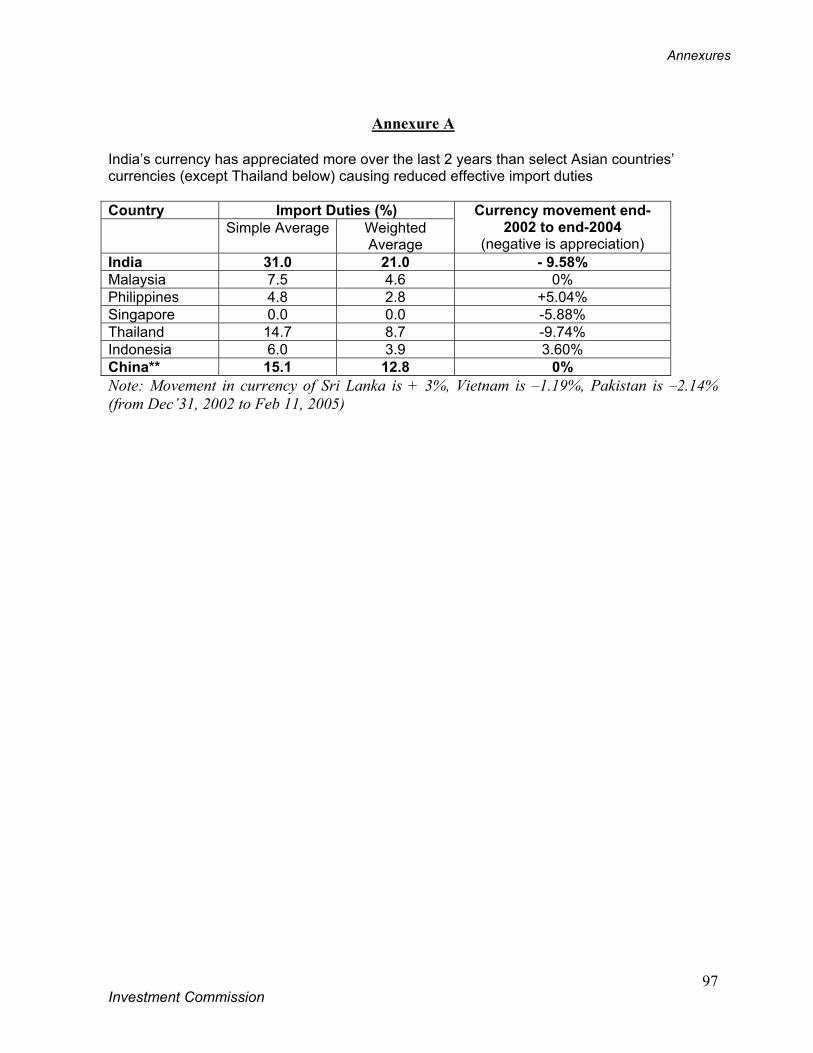
Annexures
Investment Commission
97
Annexure A
India’s currency has appreciated more over the last 2 years than select Asian countries’ currencies (except Thailand below) causing reduced effective import duties Country Import Duties (%) Simple Average Weighted
Average
Currency movement end-2002 to end-2004
(negative is appreciation) India 31.0 21.0 - 9.58% Malaysia 7.5 4.6 0% Philippines 4.8 2.8 +5.04% Singapore 0.0 0.0 -5.88% Thailand 14.7 8.7 -9.74% Indonesia 6.0 3.9 3.60% China** 15.1 12.8 0% Note: Movement in currency of Sri Lanka is + 3%, Vietnam is –1.19%, Pakistan is –2.14% (from Dec’31, 2002 to Feb 11, 2005)

Annexures
Investment Commission
98
Annexure 4
Recommendations and Status Update – May ‘05

Annexures
Investment Commission
99
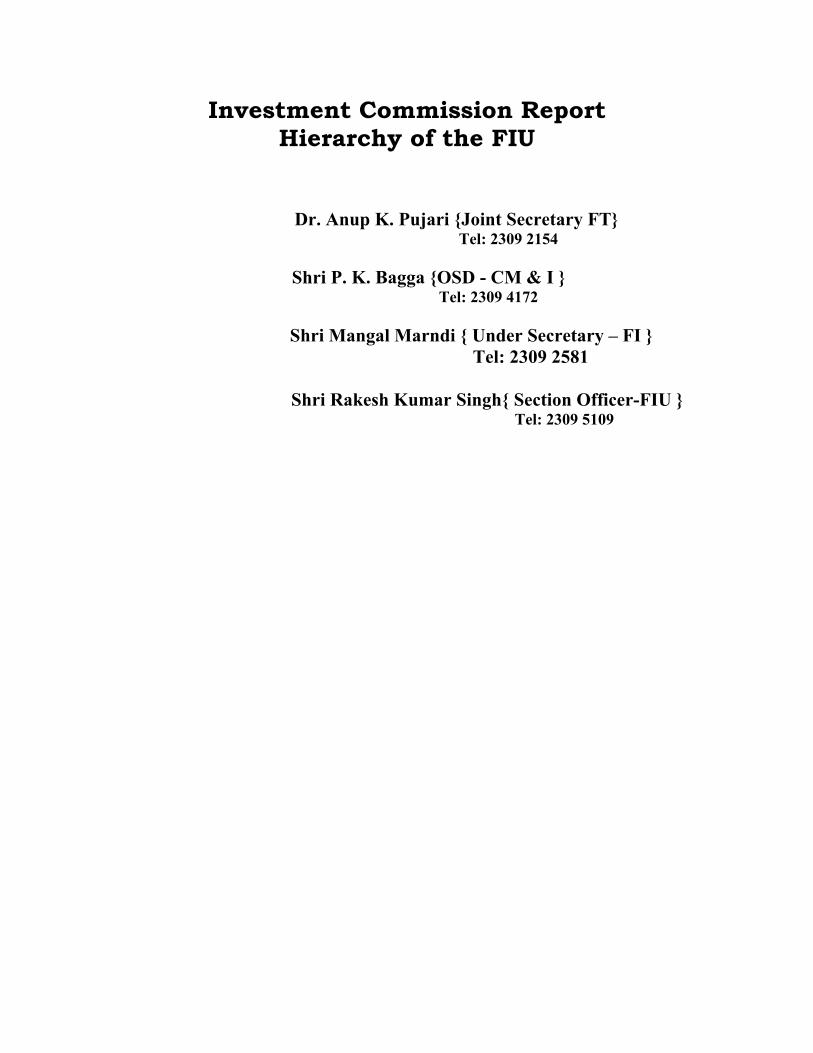
Investment Commission Report Hierarchy of the FIU
Dr. Anup K. Pujari {Joint Secretary FT} Tel: 2309 2154 Shri P. K. Bagga {OSD - CM & I } Tel: 2309 4172
Shri Mangal Marndi { Under Secretary – FI } Tel: 2309 2581
Shri Rakesh Kumar Singh{ Section Officer-FIU } Tel: 2309 5109