investment trends remain favorableegifinancial.com/docs/wf_daily_market_commentaryand...please see...
TRANSCRIPT

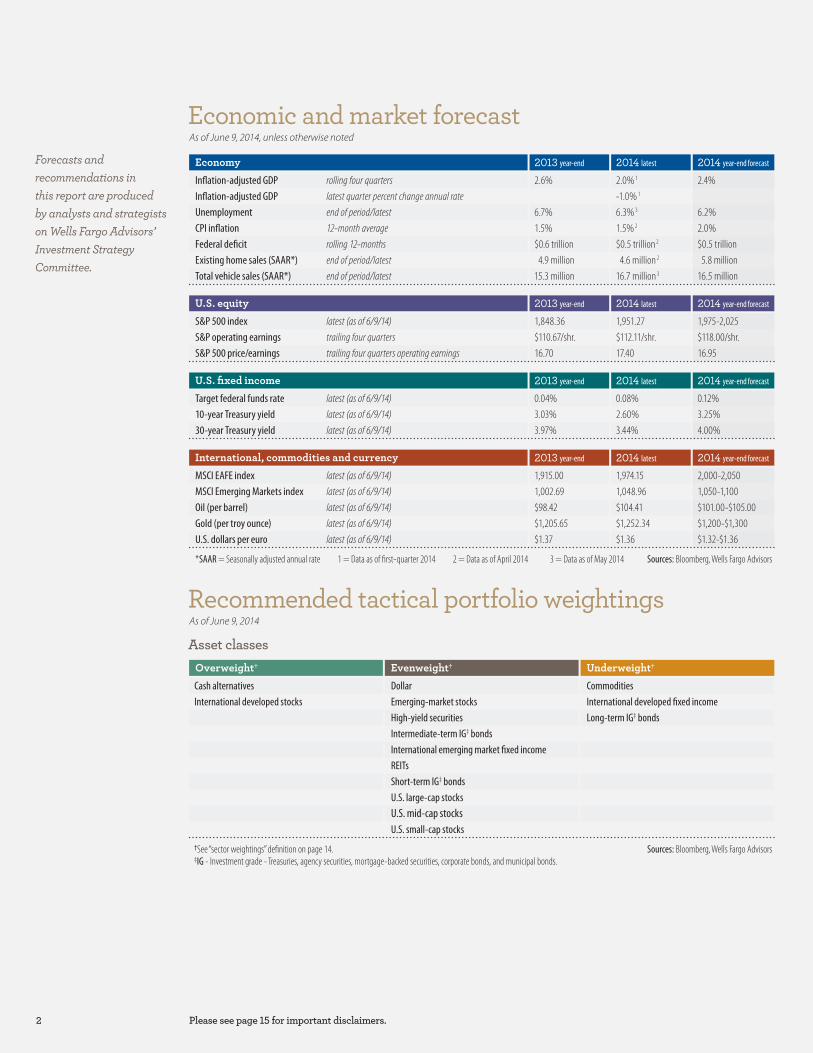
Economic and market forecast
Asset classes
In�ation-adjusted GDP latest quarter percent change annual rate
Unemployment end of period/latest
CPI in�ation 12-month average
Federal de�cit rolling 12-months
Existing home sales (SAAR*) end of period/latest
Total vehicle sales (SAAR*) end of period/latest
In�ation-adjusted GDP rolling four quarters
6.7%1.5%$0.6 trillion
4.9 million15.3 million
2.6%-1.0% 1
6.3% 3
1.5% 2
$0.5 trillion 2
4.6 million 2
16.7 million 3
2.0% 1
S&P operating earnings trailing four quarters
S&P 500 price/earnings trailing four quarters operating earnings
S&P 500 index latest (as of 6/9/14)
16.70
1,848.36
17.40
1,951.27$110.67/shr. $112.11/shr.
U.S. equity
10-year Treasury yield latest (as of 6/9/14)
30-year Treasury yield latest (as of 6/9/14)
Target federal funds rate latest (as of 6/9/14)
3.97%
0.04%
3.44%
0.08%3.03% 2.60%
U.S. fixed income
Gold (per troy ounce) latest (as of 6/9/14)
U.S. dollars per euro latest (as of 6/9/14)
Oil (per barrel) latest (as of 6/9/14)
$1.37
$98.42
$1.36
$104.41$1,205.65 $1,252.34
MSCI Emerging Markets index latest (as of 6/9/14)
MSCI EAFE index latest (as of 6/9/14) 1,915.00 1,974.151,002.69 1,048.96
International, commodities and currency
Sources: Bloomberg, Wells Fargo Advisors*SAAR = Seasonally adjusted annual rate 1 = Data as of �rst-quarter 2014 2 = Data as of April 2014 3 = Data as of May 2014
2013 year-end 2014 latest
2013 year-end 2014 latest 2014 year-end forecast
2013 year-end 2014 latest 2014 year-end forecast
As of June 9, 2014, unless otherwise noted
Recommended tactical portfolio weightings As of June 9, 2014
Economy 2013 year-end 2014 latest 2014 year-end forecast
2014 year-end forecast
Forecasts andrecommendations inthis report are producedby analysts and strategistson Wells Fargo Advisors’Investment StrategyCommittee.
16.95$118.00/shr.1,975-2,025
6.2%2.0%$0.5 trillion
5.8 million16.5 million
2.4%
4.00%3.25%0.12%
$1.32-$1.36$1,200-$1,300$101.00-$105.001,050-1,1002,000-2,050
DollarCash alternativesEmerging-market stocks
Commodities
High-yield securitiesIntermediate-term IG‡ bondsInternational emerging market �xed income
International developed stocks
REITs
U.S. large-cap stocksShort-term IG‡ bonds
Long-term IG‡ bonds
U.S. small-cap stocksU.S. mid-cap stocks
International developed �xed income
Overweight† Evenweight† Underweight†
Sources: Bloomberg, Wells Fargo Advisors‡IG - Investment grade - Treasuries, agency securities, mortgage-backed securities, corporate bonds, and municipal bonds.†See “sector weightings” de�nition on page 14.
2 Please see page 15 for important disclaimers.

2014 Midyear Economic and Market Outlook 3Please see page 15 for important disclaimers.
Key messages from our report
Economy 4 6
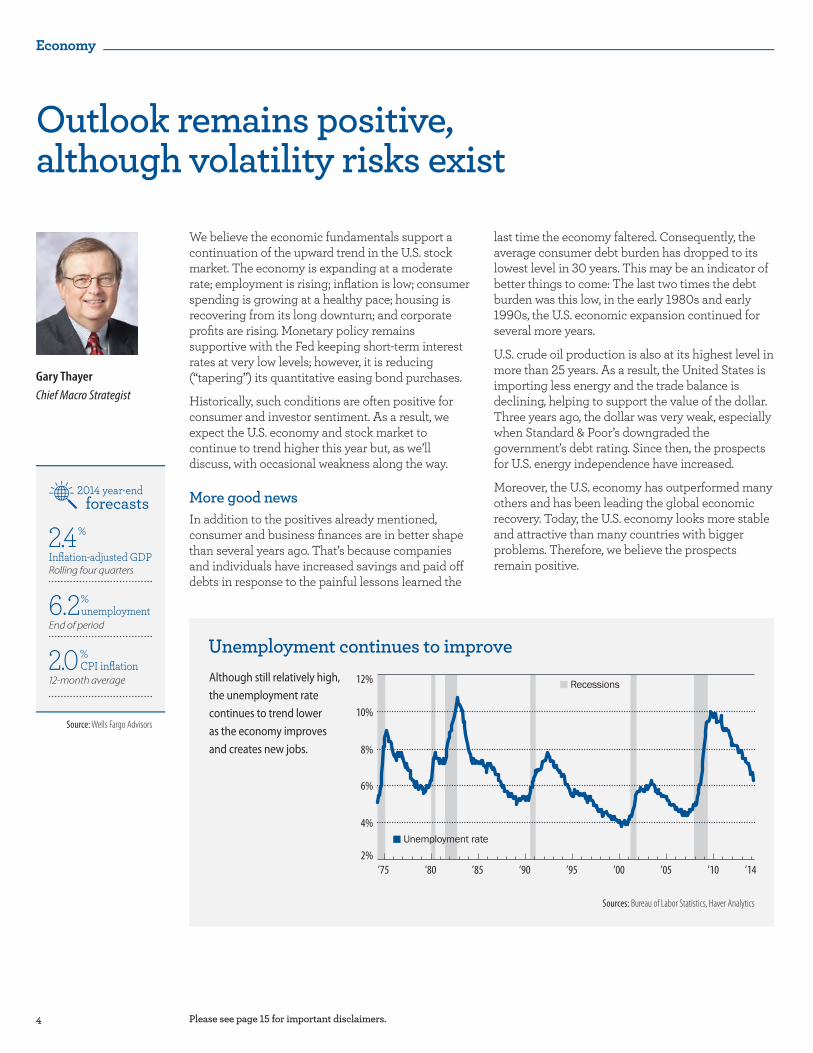
Outlook remains positive, although volatility risks exist
We believe better weather conditions and continuing gross domestic product(GDP) growth should further lift consumer and investor sentiment.
The U.S. economic expansion could continue for several more years as thereis good news when looking at consumer and business �nances, U.S. crude oilproduction, and overall economic performance.
Road ahead may be rocky at times
We expect the U.S. stock market to continue to trend higher in the comingmonths but with occasional weakness and the potential for increased volatility.
We lean toward the more cyclical sectors most likely to generate midcyclerecovery earnings growth.
We recommend that investors use market corrections as opportunities toaccumulate shares of quality companies whose fundamentals are boostedby cyclical growth.
Bonds back in favor
During the second half of 2014, we expect interest rates to move modestlyhigher but anticipate that any increases will be well-contained.
We remain neutral on the high-yield (junk bond) space given our near-termexpectations of relative calm in the credit markets but urge investors toproceed with caution over the next six months.
Our playbook for bond investors is to keep it simple: Own bonds for thepotential stability they o�er a well-allocated portfolio, don’t reach for yield,and make sure your portfolio is diversi�ed.
Despite ups and downs, stay on track
We prefer U.S. equity markets �rst, followed by Europe, Japan, andemerging markets.
We recommend reducing local-currency holdings in developed sovereigndebt markets and taking dollar-denominated holdings in emerging marketsdebt toward strategic target allocations.
In our opinion, investors should maintain commodity allocations belowstrategic targets and use recent gold and silver price gains to lighten positions.
U.S. equity
International
Managing through renewed instability
For the balance of this year, strategies that focus on buying and sellingdomestic stocks should gain from the increased equity market volatilitywe anticipate.
Similarly, event driven and private capital strategies should do well as a resultof strong corporate balance sheets and improved lending conditions.
For the long term, we believe diversifying alternative investment holdingsmay be the best way to bene�t from a variety of strategies that tend to dobest under diverse economic circumstances.
U.S. fixed income
Alternative investmentsTalk to your Financial AdvisorThe “2014 Midyear Economic and Market Outlook” o�ersour perspective on what’s happened so far this year as wellas our forecast for the months ahead.
You may want to discuss these key points with yourFinancial Advisor to determine whether adjustments toyour investments may be needed to help you stay on tracktoward your goals.
8
12
10
4
We believe the economic fundamentals support a continuation of the upward trend in the U.S. stock market. The economy is expanding at a moderate rate; employment is rising; inflation is low; consumer spending is growing at a healthy pace; housing is recovering from its long downturn; and corporate profits are rising. Monetary policy remains supportive with the Fed keeping short-term interest rates at very low levels; however, it is reducing (“tapering”) its quantitative easing bond purchases.
Historically, such conditions are often positive for consumer and investor sentiment. As a result, we expect the U.S. economy and stock market to continue to trend higher this year but, as we’ll discuss, with occasional weakness along the way.
More good newsIn addition to the positives already mentioned, consumer and business finances are in better shape than several years ago. That’s because companies and individuals have increased savings and paid off debts in response to the painful lessons learned the
Outlook remains positive, although volatility risks exist
Mis
ery
inde
x
10%
8%
6%
4%
2%
Sources: Bureau of Labor Statistics, Haver Analytics
Unemployment continues to improveAlthough still relatively high,the unemployment ratecontinues to trend loweras the economy improvesand creates new jobs.
Recessions
’10 ’14’05’00’95’90’85’80’75
12%
Unemployment rate
Economy
Please see page 15 for important disclaimers.
last time the economy faltered. Consequently, the average consumer debt burden has dropped to its lowest level in 30 years. This may be an indicator of better things to come: The last two times the debt burden was this low, in the early 1980s and early 1990s, the U.S. economic expansion continued for several more years.
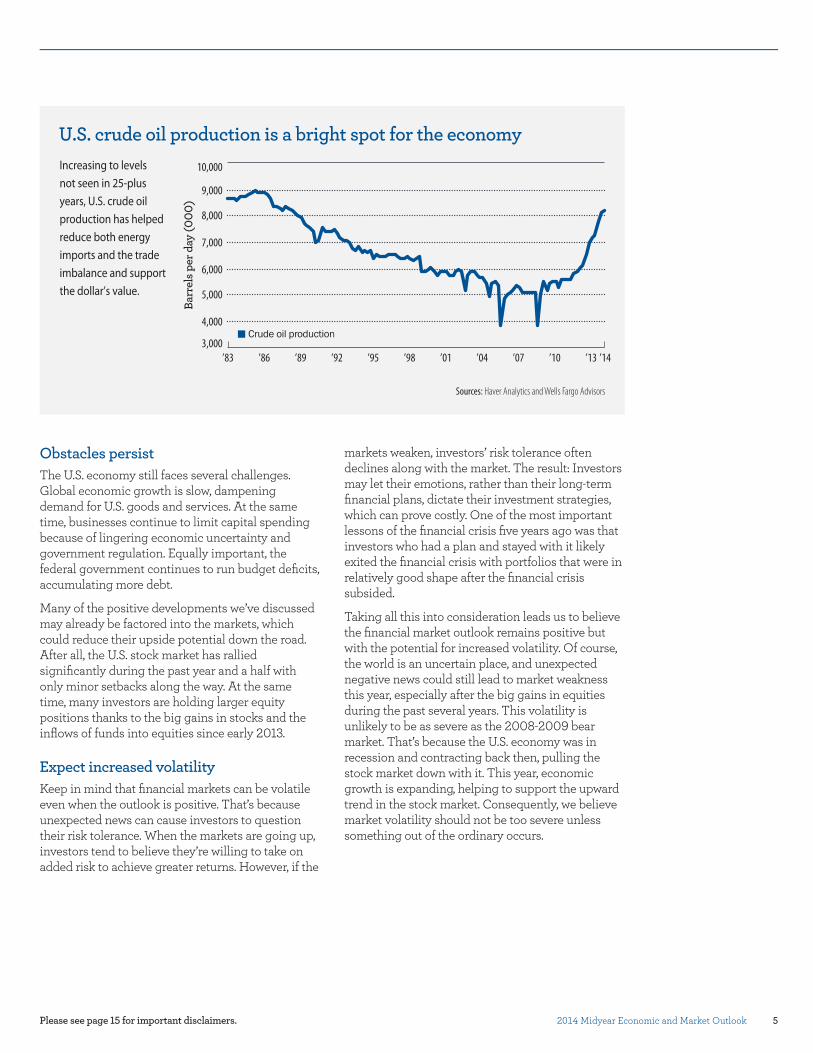
U.S. crude oil production is also at its highest level in more than 25 years. As a result, the United States is importing less energy and the trade balance is declining, helping to support the value of the dollar. Three years ago, the dollar was very weak, especially when Standard & Poor’s downgraded the government’s debt rating. Since then, the prospects for U.S. energy independence have increased.
Moreover, the U.S. economy has outperformed many others and has been leading the global economic recovery. Today, the U.S. economy looks more stable and attractive than many countries with bigger problems. Therefore, we believe the prospects remain positive.
2.4Rolling four quartersInflation-adjusted GDP
forecasts2014 year-end
6.2End of period
unemployment
2.0-month average
CPI inflation
Source: Wells Fargo Advisors
Gary ThayerChief Macro Strategist
2014 Midyear Economic and Market Outlook 5
Obstacles persistThe U.S. economy still faces several challenges. Global economic growth is slow, dampening demand for U.S. goods and services. At the same time, businesses continue to limit capital spending because of lingering economic uncertainty and government regulation. Equally important, the federal government continues to run budget deficits, accumulating more debt.
Many of the positive developments we’ve discussed may already be factored into the markets, which could reduce their upside potential down the road. After all, the U.S. stock market has rallied significantly during the past year and a half with only minor setbacks along the way. At the same time, many investors are holding larger equity positions thanks to the big gains in stocks and the inflows of funds into equities since early 2013.
Expect increased volatilityKeep in mind that financial markets can be volatile even when the outlook is positive. That’s because unexpected news can cause investors to question their risk tolerance. When the markets are going up, investors tend to believe they’re willing to take on added risk to achieve greater returns. However, if the
Please see page 15 for important disclaimers.
markets weaken, investors’ risk tolerance often declines along with the market. The result: Investors may let their emotions, rather than their long-term financial plans, dictate their investment strategies, which can prove costly. One of the most important lessons of the financial crisis five years ago was that investors who had a plan and stayed with it likely exited the financial crisis with portfolios that were in relatively good shape after the financial crisis subsided.
Taking all this into consideration leads us to believe the financial market outlook remains positive but with the potential for increased volatility. Of course, the world is an uncertain place, and unexpected negative news could still lead to market weakness this year, especially after the big gains in equities during the past several years. This volatility is unlikely to be as severe as the 2008-2009 bear market. That’s because the U.S. economy was in recession and contracting back then, pulling the stock market down with it. This year, economic growth is expanding, helping to support the upward trend in the stock market. Consequently, we believe market volatility should not be too severe unless something out of the ordinary occurs.
11 1284 85 87 88 90 91 93 94 96 97 99 00 02 03 05 06 08 09’83 ’86 ’89 ’92 ’95 ’98 ’01 ’04 ’07 ’10 ’13
10,000
9,000
8,000
7,000
6,000
4,000
5,000
3,000
U.S. crude oil production is a bright spot for the economy
Sources: Haver Analytics and Wells Fargo Advisors
Increasing to levelsnot seen in 25-plusyears, U.S. crude oilproduction has helpedreduce both energyimports and the tradeimbalance and supportthe dollar’s value.
’14
Crude oil production
Barr
els p
er d
ay (0
00)

6
Road ahead may be rocky at times
U.S. equities
Stock investors may hear a word during the coming months that hasn’t been uttered much lately: volatility. Although it has increased only moderately this year versus last, we think it’s reasonable for investors to expect increased domestic stock market volatility. Keep in mind that the S&P 500® has not experienced a 10% correction since mid 2012, although the January 2014 correction did result in a 6% pullback.
Market choppiness could spring out of periods of rotation as investors respond to the potential for slower emerging-market growth and less liquidity as a result of the Fed tapering its stimulus program and/or increasing the fed funds rate.
A look backWe believe last year represented the beginning of a second leg for this cyclical bull market. The first quarter of 2013 carried a defensive flavor and the Health Care, Consumer Staples, and Utilities sectors drove performance. The S&P 500 index increased 10% during that quarter as investors warmed back up to equities on the heels of 2012 uncertainties surrounding a contentious presidential election year, late-year budget worries, and lingering concerns over the state of the European economies.
However, as 2013 progressed, investors were comforted by broader growth in many segments of the economy, job expansion, and better economic results from Europe. As confidence trended higher, investors accumulated shares of more cyclically sensitive stocks, and the last nine months of 2013 brought a strong 17.8% increase to the S&P 500 – led by the cyclically sensitive Consumer Discretionary, Industrials, and Information Technology sectors.
Please see page 15 for important disclaimers.
During the opening months of 2014, market rotation dominated the U.S. equity markets. As emerging market fundamentals and stocks softened in January, investors in U.S. stocks began to take profits, primarily in areas that had offered some of the stronger performances in this cycle. Investors took risk off the table in the cyclical space and in specific momentum stocks (where valuations had become more stretched). In their place, investors rotated capital toward some of 2013’s underachievers and into dividend-paying stocks. We suspect, the recent market rotations have also resulted from new questions surrounding the Fed’s tapering program and the timing for increases in the federal funds rate.
As of May 28, 2014, the S&P 500 has increased 3.3% with the relatively more defensive Utilities, Health Care, and Energy sectors offering the best relative performances, much like early 2013. Nine of the 10 primary S&P 500 sectors have moved higher, and one has declined (all 10 moved higher in first quarter 2013).
A lean toward cyclical sectorsMoving forward, we believe better weather conditions and continuing GDP and job growth should further lift consumer and investor sentiment and will drive stocks. Expansion of The Conference Board’s Index of Leading Economic Indicators points to more GDP growth in 2014. A variety of other indicators, including declining initial unemployment claims, an increase in jobs, our expectation for rising orders for nondefense capital goods, and increasing building permits, suggest continuing economic growth and a moderately higher stock market by year-end.
Stuart Freeman, CFA®Chief Equity Strategist
118S&P 500® earnings/share
1,975-2,025S&P 500 index
Source: Wells Fargo Advisors
forecasts2014 year-end
2014 opportunities in U.S. equities
Consumer Discret.Industrials
Consumer Staples Health Care
Info. Tech.Utilities
13.0%12.0% 9.6%9.7% 12.7%13.2%12.1%10.7% Energy 9.8%10.5% 0.0%3.1%20.1%18.8% Financials 16.8%16.0%
Telecom. 2.4%2.5%Materials 3.5%3.5%
Sources: Bloomberg, Wells Fargo Advisors
Overweight* Guidance% of S&P 500 Evenweight* Guidance% of S&P 500 Underweight* Guidance% of S&P 500
As of June 9, 2014
Note: S&P 500 weightings as of May 2014. May not add to 100% due to rounding.*See “sector weightings” de�nition on page 14.
2014 Midyear Economic and Market Outlook 7Please see page 15 for important disclaimers.
We foresee the potential for another up-leg for the housing segment as broader economic growth and lower housing inventory levels offset the impact of modestly higher interest rates. Continuing growth in the housing economy should help support and moderately boost consumer confidence as well. In addition, our statistical comparisons between the current economic and market environments and those within other cycles point to new highs for large-cap domestic stocks this year (but with a more moderate annual return than last year).
We foresee 6% to 7% S&P 500 operating earnings growth and carry a 1,975-2,025 target range for the index for year-end 2014.
We lean toward the more cyclical sectors most likely to generate midcycle recovery earnings growth. On market corrections, we recommend that investors continue to accumulate shares of quality companies whose fundamentals are boosted by cyclical growth. Overall, we prefer domestic equities versus international and are overweighting the Industrial, Information Technology, and Consumer Discretionary sectors of the S&P 500.
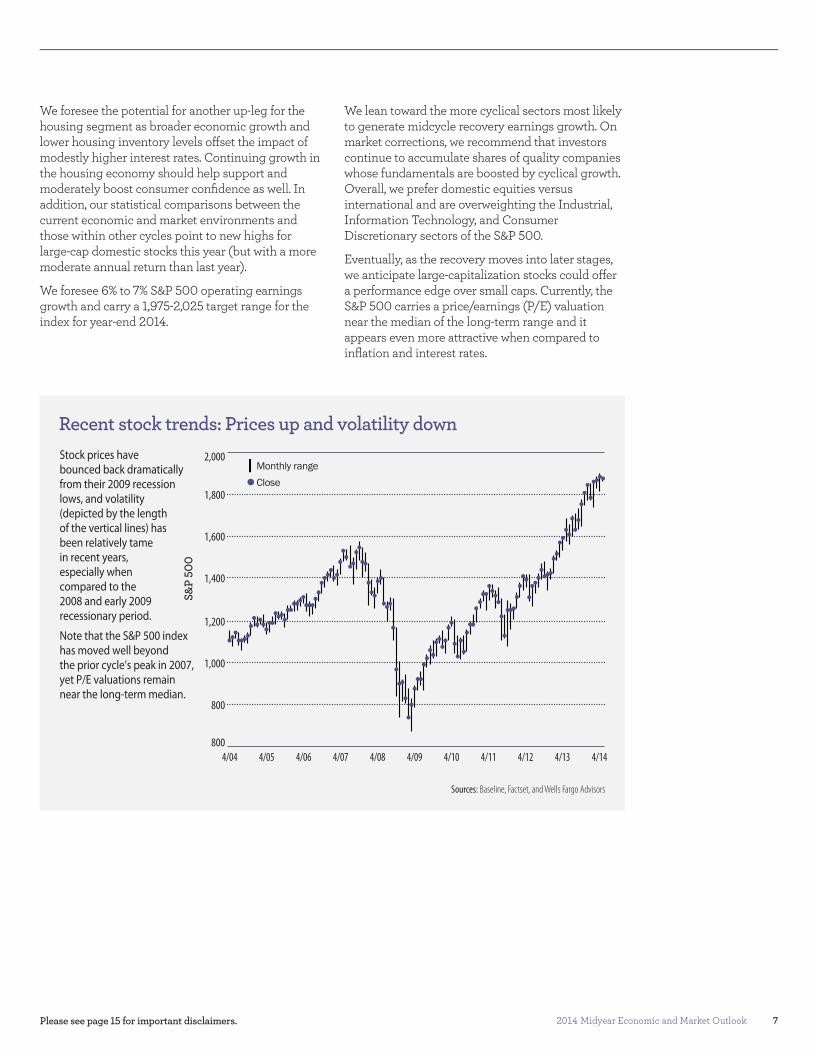
Eventually, as the recovery moves into later stages, we anticipate large-capitalization stocks could offer a performance edge over small caps. Currently, the S&P 500 carries a price/earnings (P/E) valuation near the median of the long-term range and it appears even more attractive when compared to inflation and interest rates.
Note: Chart uses average levels for the Treasury yield and S&P 500 E/P ratios in each year.
’89 ’91 ’93 ’95 ’97 ’99 ’01 ’03 ’05 ’07 ’09 ’11
Recent stock trends: Prices up and volatility down2,000
1,800
1,600
1,400
1,200
1,000
800
8004/04 4/05 4/06 4/07 4/08 4/09 4/10 4/11 4/12 4/13
Sources: Baseline, Factset, and Wells Fargo Advisors
4/14
Stock prices havebounced back dramaticallyfrom their 2009 recessionlows, and volatility(depicted by the lengthof the vertical lines) hasbeen relatively tamein recent years,especially whencompared to the2008 and early 2009recessionary period.
Note that the S&P 500 indexhas moved well beyondthe prior cycle’s peak in 2007,yet P/E valuations remainnear the long-term median.
Monthly rangeClose
S&P
500

8
Fixed income
After souring on fixed income during 2013’s second half, investors are once again moving money into these investments. The reported “great rotation” out of fixed income seems to have been short-lived and not much of a rotation after all. Looking forward to 2014’s second half, we anticipate that investor interest in fixed income will remain strong. The inflows into bonds may reverse in the years ahead, but we believe it will take a more meaningful event than a spike in yields or a year of negative returns to get investors to rotate out en masse.
The domestic bond market tends to have long periods of relative calm followed by periods of significant adjustment. We last saw the bond market recalibrate in mid-2013 as the Fed began to prepare investors for “tapering” – reducing its quantitative easing asset purchases. The Fed appears to be on a predetermined process of decreasing purchases — a process that is fully discounted into yields, in our opinion. We expect the Fed will end new bond purchases during 2014’s fourth quarter.
Even as we expect demand for fixed income assets to remain strong, underlying fundamentals (falling unemployment, economic expansion, and the eventual ending of new Fed asset purchases) suggest that interest rates are likely to increase
Bonds back in favor
gradually over time. During 2014’s second half, we expect interest rates to move modestly higher from current levels but anticipate that any increases will be well-contained. In March, the Fed introduced new policy language to the markets that may inject some uncertainty for investors. However, we anticipate that the Fed will leave the federal funds rate unchanged well into 2015, which should keep longer-term interest rates contained in the near term.
High yield: proceed with cautionThe high yield (junk bonds) sector, which can include bank loans, has been very popular in recent years as a result of its strong recent performance and generally lower durations (sensitivity to interest rate changes). We continue to be concerned that investors are adding significant risks to their portfolios by increasing high-yield allocations above recommended levels. It is likely high-yield investors are currently experiencing the best five-year annualized performance of the current cycle. In fact, current yield levels are near the lowest we have seen in this space. If we experience a credit or liquidity event during the next five years, high-yield investors may experience significant losses.
’88 ’89 ’91 ’92 ’94 ’95 ’97 ’98 ’00 ’01 ’03 ’04 ’06 ’07 ’09 ’10 ’12 ’13’87 ’90 ’93 ’96 ’99 ’02 ’05 ’08 ’11 ’14
25%
20%
15%
10%
5%
0%
Yiel
d vs
. tot
al re
turn
-5%
Trajectory for high yield’s returns is unfavorable
Sources: Bloomberg, Wells Fargo Advisors
High yield’s current yields(gray line) are at a low, andthe annualized �ve-yeartotal return (green line)has turned downward.
Past performance is not an indication of future results.
Initial/current yieldAnnualized five-year total return
Please see page 15 for important disclaimers.
Brian Rehling, CFA®Chief Fixed Income Strategist
0.12target federal
3.2510-year Treasury yield
4.0030-year Treasury yield
Source: Wells Fargo Advisors
funds rate
forecasts2014 year-end
2014 Midyear Economic and Market Outlook 9
We remain neutral on the high-yield space given our near-term expectations of relative calm in the credit markets. However, the risk/return proposition is much less favorable to investors than it has been in the past, and we urge investors to proceed with caution over the next six months. We believe investors should pause before adding significant assets in the more volatile high-yield space, regardless of the low durations inherent in many of these products, and investors who are over-concentrated should consider taking profits at current valuations.
Keep it simpleEven with a clear plan from the Fed in place and market expectations set, there are still moves that could reset investors fixed income expectations:• A change in short-term interest rates (the federal funds rate)
• An unexpected increase in inflation expectations• A significant improvement in the global economic outlook
While any of these events could provide a trigger to move interest rates higher, we do not expect investors will experience these conditions over the next six months.
Given our belief that interest rate moves will be modest, we recently lowered our year-end interest rate targets. Our new target for 10-year Treasury yield at year end is 3.25%, down from 3.50%, while we reduced our 30-year yield target to 4.00% from 4.50%.
A controlled rising-rate environment should allow fixed income investors to generate positive returns, albeit lower than experienced in the past years. We expect a well-diversified domestic investment-grade fixed income investor will generate an average total return (interest income plus price appreciation) of 2% to 4% in the years ahead.
During the second half of 2014, we expect credit (fixed income investments other than U.S. government issues) will continue to outperform, but the value proposition for investors has diminished significantly as the excess yield available in these types of products is significantly less attractive than in the past.
The playbook for bond investors appears relatively straight-forward – keep it simple: Own bonds for the potential stability they offer in a well-allocated portfolio, don’t reach for yield, and make sure your portfolio is diversified.
Please see page 15 for important disclaimers.
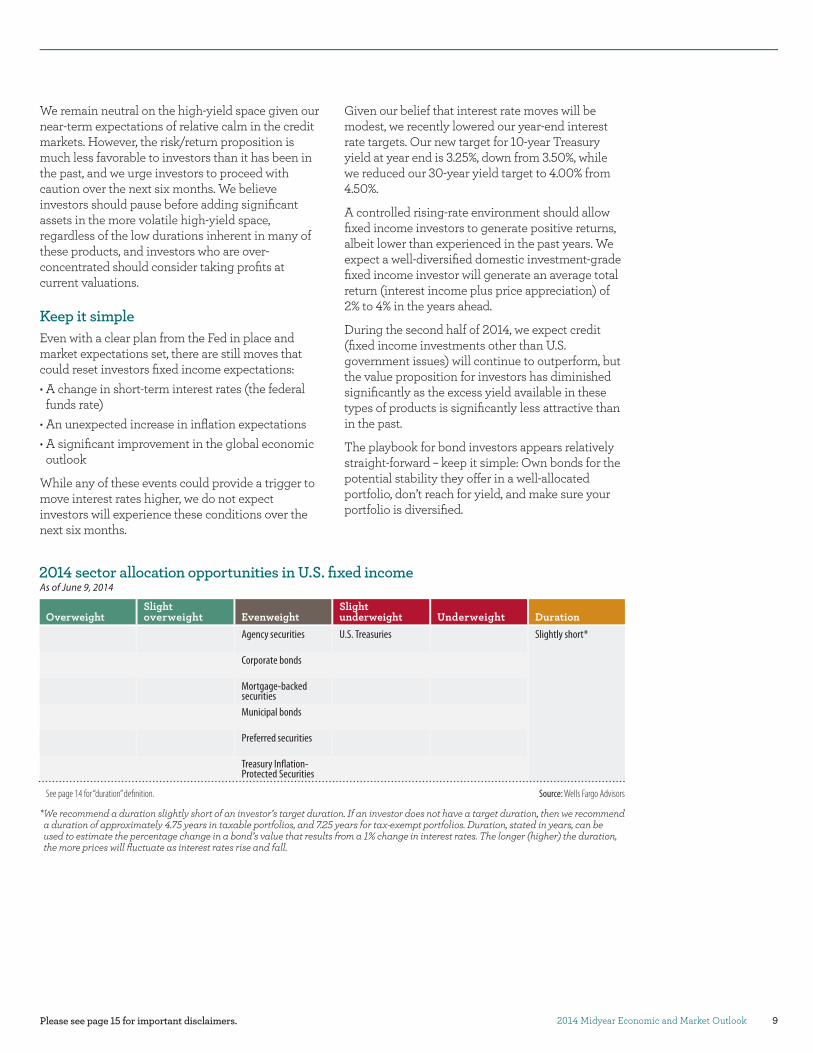
2014 sector allocation opportunities in U.S. fixed income
Agency securities U.S. Treasuries
Mortgage-backedsecuritiesMunicipal bonds
Preferred securities
Treasury In�ation-Protected Securities
Corporate bonds
Source: Wells Fargo Advisors
underweightEvenweight UnderweightOverweight overweightSlight Slight
Duration
As of June 9, 2014
See page 14 for “duration” de�nition.
Slightly short*
* We recommend a duration slightly short of an investor’s target duration. If an investor does not have a target duration, then we recommend a duration of approximately 4.75 years in taxable portfolios, and 7.25 years for tax-exempt portfolios. Duration, stated in years, can be used to estimate the percentage change in a bond’s value that results from a 1% change in interest rates. The longer (higher) the duration, the more prices will fluctuate as interest rates rise and fall.

10
Despite ups and downs, stay on track
International & commodities
International markets saw swings during January and May that were similar to other such periods during the past 18 months. And several factors suggest that volatility risk may continue in the coming months:• Global equity and bond prices have risen significantly since mid-2012 and are vulnerable to consolidation.
• Japan’s economic recovery has encouraged policymakers to rethink plans for additional monetary stimulus, but European monetary policy makers may soon increase stimulus.
• There are signs that problems in emerging economies are more than just the unrelated issues of a fragile few.
However, we believe that despite the likelihood of increased volatility, investors have good reason to hold international investments.
The good should outweigh the badFortunately, positive fundamentals in the United States, Europe, and Japan support long-term uptrends in global markets. Of course, there could be unexpectedly severe disappointments, but improving growth, low inflation, and low interest
rates across the world’s major economies and markets should help protect global markets.
Looking into the rest of 2014, we expect the stronger developed economies could pull emerging markets modestly higher, and we also look for the developed and U.S. markets to outperform. With an eye on these factors and on a better 2015, we are raising our year-end emerging-market equity target range to 1,050-1,100.
Patience may be rewardedLooking beyond the next 12 months, the pressure to reform in emerging economies fits with the decades-long development trend that has benefited investors and may still align well with long-term investment goals.
In the past 40 years, we count three emerging-market cycles. The chart shows strong investor inflows into emerging markets during the early 1980s and 1990s, each corresponding with positive market performance. Those positive flows (and performance) reversed at mid-decade, coinciding with excess debt in these countries that required reforms. Inflows also were strong between 2010 and 2012 but now appear to have stalled.
Average three-month interest rates, annualized
’80 ’82 ’84 ’86 ’88 ’90 ’92 ’94 ’96 ’98 ’00 ’02 ’04 ’06 ’08 ’10 ’12
1.5%
1.0%
0.5%
0%
-0.5%
Net
of g
ross
dom
estic
pro
duct
-1.0%
Investor inflows into emerging markets have stalled
Sources: IMF and Wells Fargo AdvisorsData sample: Annual data, 1980 - 2013
Excess debt in thesecountries, possiblysignaling a need forreforms, may becausing reducedinvestor interest.
Private portfolio flows to emerging markets
Please see page 15 for important disclaimers.
Paul Christopher, CFA®Chief International Strategist
2,000-2,050MSCI EAFE equity index
1,050-1,100MSCI Emerging-market
Source: Wells Fargo Advisors
equity index
101- 105Crude oil per barrel
1,200- 1,300Gold per troy ounce
1.32- 1.36euro exchange rate
forecasts2014 year-end

2014 Midyear Economic and Market Outlook 11
The point for the future is that each cycle brought wide performance swings to emerging economies and markets but with an improved outlook after outflows forced reforms. Today, investors may be witnessing the end of a third cycle, and the reforms that should result may eventually reward investors patient enough to see value in the emerging-markets’ underperformance of the past year.
Recommendations essentially unchangedOur advice is substantially the same as it was at the beginning of the year:
International equities. For 2014, earnings and sentiment ultimately should drive U.S. markets to be the top performers with Europe and Japan next and then emerging markets. Investors who may be concerned about downside risk in emerging markets could slightly reduce their allocation to help manage their risk.
International bonds. The outlook for currencies and political reforms should drive returns on international sovereign debt. Yields have fallen to unattractive levels after a strong sentiment rebound but are vulnerable to political and economic uncertainty. International bond prices are also vulnerable to outflows if, as we expect, U.S. bond yields rebound with the U.S. economy and attract global investors away from international markets.
Our currency view favors the U.S. dollar and discourages U.S. investor holdings of international investments in local currency. Investors should therefore reduce their local-currency holdings in developed markets and take dollar-denominated holdings in emerging market debt toward their strategic allocations.
Commodities. We believe some seasonal and other likely transitory factors early this year only temporarily countered the broader and more negative commodity price trends. As a result, we reiterate our advice that investors maintain less than their target long-term allocations in commodities. In particular, we expect weaker precious metals prices as the U.S. economy improves and yields rise. Rebounds in gold and silver prices early in the year offer investors a chance to reduce positions.
Focus on the long-term planMarch marked the five-year anniversary of the financial crisis, making this an opportune time to remember that numerous international disappointments since 2008 have not derailed positive performance in many global financial and commodity markets. Today, unlike 2008, economic fundamentals are improving in the world’s largest economies and financial markets. Looking ahead, even the potential for negative surprises does not change our favorable international investment outlook for the next 12 months.
Please see page 15 for important disclaimers.
Core*
Satellites*
Equities Sovereign debt Commodities
MSCI EAFE index S&P/Citigroup International TreasuryBond Ex-U.S. index
DBIQ Optimum YieldDiversi�ed Commodity index
Core MSCI Emerging Markets index J.P. Morgan Emerging MarketsBond Index Global
GermanyIrelandNetherlands
SwedenNew Zealand
PolandSouth KoreaTaiwan
Malaysia
Norway Energy
Satellites
None at this time
Emerging markets
Developed marketsCore
Satellites
Source: Wells Fargo Advisors*See page 14 for de�nition.
2014 opportunities in international and commodity investmentsAs of June 9, 2014

12 Please see page 15 for important disclaimers.
The first half of 2014 was especially challenging for alternative strategies as geopolitical turmoil and policy uncertainty moved markets in unpredictable ways. But despite their more muted performance so far this year, we think alternative investments reconfirmed that they can play a valuable role in an asset allocation strategy by helping once again to lower overall portfolio volatility during periods of market distress.
Given that our team’s broader economic and market outlook remains largely similar to how we started the year, we believe conditions remain favorable overall for alternative investments and that the potential for solid return opportunities and diversification benefits remain in play for the year’s second half.
Opportunities in hedged equityIf domestic stocks resume their upward trend in the last half of the year, we would expect certain strategies to benefit, particularly those that focus on companies through stock picking and trading. In addition, increased market volatility can create attractive long-term buying opportunities for such managers as they seek to reinvest cash in attractively priced stocks following market corrections/sell-offs.
With the potential for equity market appreciation, healthy corporate balance sheets, and favorable lending conditions, strategies that rely on corporate activity to drive returns may be poised for further strong performance.
Meanwhile, distressed credit strategies have been a strong performing market segment in recent years. However, consistently low default rates in loans and significant market demand for such investments have combined to drive up prices, leaving the market attractive if you’re looking for yield but, perhaps, less so if price appreciation is your goal.
Lastly, we believe the opportunities in foreign distressed assets, particularly within the European Union, remain abundant. However, investors should not be surprised if taking advantage of these opportunities requires a long investment time horizon and patience along the way.
Private debt may provide attractive yieldsWe continue to view private debt investments favorably as gaps in U.S. and European bank lending to small- and medium-sized businesses, combined with increased demand for more innovative and customized business lending solutions, continue to create opportunities for private funds as lenders of last resort. These opportunities tend to offer attractive yields versus public bond markets with many deals offering potential returns in the form of additional equity ownership rights.
Alternative investments
Managing through renewed instability
Alternatives provide diversification while seeking to generate positive returns
Source: Morningstar Direct
2013 2014201220102009 2011Equities29.99%
Hedge Funds13.40%
U.S. Bonds5.93%
2008U.S. Bonds
5.24%
Hedge Funds-23.25%
Equities-40.71%
Equities11.76%
U.S. Bonds6.54%
Hedge Funds5.19%
U.S. Bonds7.84%
Equities-5.54%
Hedge Funds-8.87%
Equities15.83%
U.S. Bonds4.21%
Hedge Funds3.51%
Equities26.68%
Hedge Funds6.72%
U.S. Bonds-2.02%
U.S. Bonds2.70%
Equities2.30%
Hedge Funds0.38%
■ HFRX Global Hedge Fund index
■ Barclays U.S. Aggregate Bond Total Return index
■ MSCI World index
As of April 30, 2014. Past performance is no guarantee of future results. You cannot invest directly in an index.
Cash alternativesFixed incomeAlternative incomeEquitiesCommodities
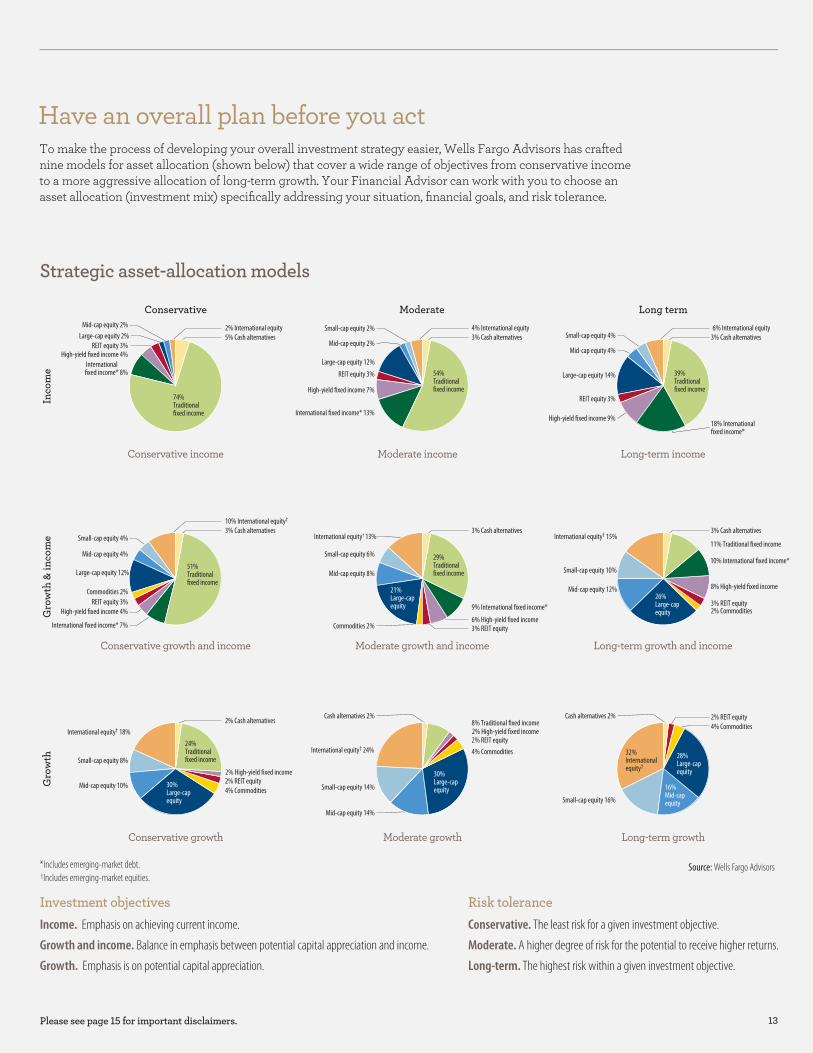
Investment objectivesIncome. Emphasis on achieving current income.
Growth and income. Balance in emphasis between potential capital appreciation and income.
Growth. Emphasis is on potential capital appreciation.
Risk toleranceConservative. The least risk for a given investment objective.
Moderate. A higher degree of risk for the potential to receive higher returns.
Long-term. The highest risk within a given investment objective.
Have an overall plan before you act
Strategic asset-allocation models
Conservative Moderate Long term
Gro
wth
Gro
wth
& in
com
eIn
com
e
Conservative income
Conservative growth and income
Conservative growth
Moderate income Long-term income
Moderate growth and income Long-term growth and income
Moderate growth Long-term growth
To make the process of developing your overall investment strategy easier, Wells Fargo Advisors has craftednine models for asset allocation (shown below) that cover a wide range of objectives from conservative incometo a more aggressive allocation of long-term growth. Your Financial Advisor can work with you to choose anasset allocation (investment mix) specifically addressing your situation, financial goals, and risk tolerance.
18% International
Large-cap equity 14%
REIT equity 3%
Small-cap equity 4%
Mid-cap equity 4%
Small-cap equity 10%
Small-cap equity 16%
Mid-cap equity 12%
39%Traditional
4% Commodities
2% High-yield �xed income
8% High-yield �xed income
2% REIT equity
6% International equity3% Cash alternatives
2% Commodities
3% Cash alternatives
3% REIT equity
4% Commodities2% REIT equity
4% International equity3% Cash alternatives
Large-cap equity 12%
REIT equity 3% International
REIT equity 3%
Small-cap equity 2%
Mid-cap equity 2%
3% Cash alternatives
3% REIT equity
International equity† 13% International equity† 15%
Commodities 2%
Small-cap equity 6%
Mid-cap equity 8%
Mid-cap equity 14%
Small-cap equity 14%
International equity† 24%
54%Traditional
2% International equity5% Cash alternatives
Mid-cap equity 2%Large-cap equity 2%
74%Traditional
Commodities 2% REIT equity 3%
Mid-cap equity 4%
Large-cap equity 12%
Small-cap equity 4%
High-yield �xed income 4%
10% International equity†
3% Cash alternatives
2% Cash alternatives
51%Traditional
21%Large-capequity
29%Traditional
26%Large-capequity
Small-cap equity 8%
Mid-cap equity 10%
International equity† 18%
2% REIT equity2% High-yield �xed income
4% Commodities30%Large-capequity
24%Traditional
Cash alternatives 2% Cash alternatives 2%
30%Large-capequity
28%Large-capequity
16%Mid-capequity
32%Internationalequity†
*Includes emerging-market debt. †Includes emerging-market equities.
Source: Wells Fargo Advisors
13Please see page 15 for important disclaimers.
14
Definitions
Alternative income can include income from international fixed income, high yield, emerging-market debt and real estate investment trusts.Alternative investments are investments outside of the traditional asset classes (stocks, bonds, cash alternatives) and can include investments in private equity, hedge funds, and managed futures.Barclays U.S. Aggregate Bond Index covers the U.S dollar-denominated, investment-grade (rated Baa3 or above by Moody’s), fixed-rate, and taxable areas of the bond market. This is the broadest measure of the taxable U.S. bond market, including most Treasury, agency, corporate, mortgage-backed, asset-backed, and international dollar-denominated issues, all with maturities of one year or more.Commodities are basic goods used in commerce that are generally interchangeable with other commodities of the same type. Commodities are most often used as inputs in the production of other goods or services.Consumer Price Index (CPI) is a measure of the weighted average of prices of a basket of consumer goods and services, such as transportation, food and medical care. The CPI is calculated by taking price changes for each item in the predetermined basket of goods and averaging them; the goods are weighted according to their importance. Changes in CPI are used to assess price changes associated with the cost of living.Core is a broad, well-diversified position in commodities or international investments.Current yield (frequently referred to as yield) is the annual income an investment provides divided by its current market price. For example, a bond selling at par ($1,000) paying $100 annually in interest would have a 10% yield. However, if the bond’s market price fell to $900, its yield would increase to approximately 11%.Cyclical stocks are typically those of companies that sell discretionary items that consumers can afford to buy more of in a booming economy and will cut back on during a recession. In other words, when the economy is doing well, cyclical investments tend to perform well. The opposite, of course, is true when the economy is doing poorly. Defensive investments, on the other hand, tend to be less affected by economic cycle changes.DBIQ Optimum Yield Diversified Commodity index is a measurement of 14 commodities drawn from the energy, precious metals, industrial metals, and agriculture sectors.Duration can be used to estimate the percentage change in a bond’s value that will result from a 1% change in interest rates. For example, a duration of four means that a 1% change in prevailing rates in a one-year period should shift the bond’s price in the opposite direction by 4%. The longer (higher) the duration, the more the bond’s price will fluctuate as interest rates rise and fall.Emerging markets are financial markets in countries with developing economies. These markets are typically immature compared to those of the world’s major financial centers but are becoming increasingly sophisticated and integrated into international markets; they provide potentially higher returns but are intensely volatile.Gross domestic product (GDP) is the total value of the goods and services the economy produces during a year. Increasing GDP indicates growing economic activity. Decreasing GDP suggests the opposite.High yield is noninvestment-grade fixed income securities (rated Ba1 or lower by Moody’s and/or BB+ or lower by S&P). These investments are considered to be speculative and are subject to a higher degree of risk.HFRX Global Hedge Fund Index is designed to be representative of the overall composition of the hedge fund universe. It comprises all eligible hedge fund strategies, including, but not limited to, convertible arbitrage, distressed securities, equity hedge, equity market neutral, event driven, macro, merger arbitrage, and relative value arbitrage.
Intermediate-term fixed income includes instruments that mature in six to 12 years.International investing involves putting money into financial markets in developed economies outside of the United States.J.P. Morgan Emerging Markets Bond Index Global tracks total returns for U.S.-dollar-denominated debt instruments issued by emerging-market sovereign and quasi-sovereign entities.Large-cap stocks have a market cap greater than $10 billion.Liquidity, in regard to the economy, is a reference to the money supply. The greater the liquidity, the larger the money supply.Long-term fixed income includes instruments whose maturities are greater than 12 years.MSCI EAFE (Europe, Australasia and Far East) index compiled by Morgan Stanley Capital International (MSCI) is a value-weighted index of the equity performance of major foreign markets. In effect, it is a non-American world index of more than 1,000 stocks.MSCI Emerging-market index was created by MSCI and designed to measure equity market performance in global emerging markets.MSCI World index is a free float-adjusted market capitalization-weighted index designed to measure the equity market performance of developed markets.Mid-cap stocks have a market cap between $2 billion – $10 billion.Momentum stocks are identified by having experienced strong upward or downward price movement, and in general, investors believe the stocks’ momentum will cause the current trend to continue in the foreseeable future.Quantitative easing is a Fed strategy for increasing the money supply (adding liquidity) to help keep interest rates low and stimulate economic activity. In general, it involves Fed purchases of bonds from banks, providing them with money to lend to businesses and consumers.Real Estate Investment Trusts (REITs) trade on the major exchanges and invest in real estate directly, either through properties or mortgages.Satellites are complementary commodity or international positions held alongside the core (see definition) with the objective of outperforming the core. Keep in mind that allocations to satellites may increase volatility.Sector weightings are guidance stock market strategists use to indicate how they believe investors should allocate their stock portfolios. When a strategist’s guidance is to overweight a sector, he or she believes it will perform well in the future and investors should allocate a larger percentage of their stock portfolios to that sector than its relative representation in the S&P 500 index. For example, if the Energy sector represents 11% of the S&P 500 index and a strategist’s guidance is to overweight that sector, he or she is recommending that investors allocate more than 11% of their stock portfolios to the sector. If a strategist’s guidance is to evenweight a sector, he or she believes investors’ allocation to that sector should be in line with its representation in the S&P 500. If a strategist’s guidance is to underweight a sector, he or she believes investors’ allocation to that sector should be less than its representation in the S&P 500.Short-term fixed income includes instruments that mature in one to six years.Small-cap stocks have a market cap less than $2 billion.S&P/Citigroup International Treasury Bond Ex-U.S. index is designed to reflect the performance of bonds issued by non-U.S. developed-market countries.S&P 500® index consists of 500 industrial, financial, utility and transportation companies with market capitalizations of $4 billion or more.

2014 Midyear Economic and Market Outlook 15
Disclaimers
Some information contained in this report was prepared by or obtained from sources that Wells Fargo Advisors believes to be reliable. Any market prices are only indications of market values and are subject to change.Wells Fargo Advisors may not offer direct investments into the products mentioned in this report.Past performance is not an indication of future results.An index is not managed and is unavailable for direct investment.Products that employ alternative strategies are more complex investment vehicles. They tend to be more volatile than other types of investments and present an increased risk of investment loss. Some of these strategies may expose investors to risks, such as short selling, leverage risk, counterparty risk, liquidity risk, commodity price volatility risk, and/or managed futures roll yield risk. In addition, alternative strategies engage in derivative transactions. The use of derivatives will expose an investment to further risks that it would not be subject to if it invested directly in the securities underlying those derivatives.Investing in foreign securities presents certain risks not associated with domestic investments, such as currency fluctuations, political and economic instability, and different accounting standards. This may result in greater share price volatility. These risks are heightened in emerging markets.Asset allocation does not guarantee a profit or protect against loss in declining markets.Technology and Internet-related stocks, especially of smaller, less-seasoned companies, tend to be more volatile than the overall market.The prices of small- and mid-cap company stocks are generally more volatile than large-company stocks. They often involve higher risks because smaller companies may lack the management expertise, financial resources, product diversification and competitive strengths to endure adverse economic conditions.Investing in fixed income securities involves certain risks, such as market risk if sold prior to maturity and credit risk, especially if investing in high-yield bonds, which have lower ratings and are subject to greater volatility. All fixed income investments may be worth less than original cost upon redemption or maturity.Income from municipal securities is generally free from federal taxes and state taxes for residents of the issuing state. While the interest income is tax-free, capital gains, if any, will be subject to taxes. Income for some investors may be subject to the federal alternative minimum tax (AMT).Bond prices fluctuate inversely to changes in interest rates. Therefore, a general rise in interest rates can result in the decline of the value of your investment.
There are special risks associated with investing in preferred securities. Preferred securities generally offer no voting rights with respect to the issuer. Preferred securities are generally subordinated to bonds or other debt instruments in an issuer’s capital structure, subjecting them to a greater risk of non-payment than more senior securities. In addition, the issue may be callable, which may negatively impact the return of the security. Preferred dividends are not guaranteed and are subject to deferral or elimination.The interest rate for Treasury Inflation-Protected Securities (TIPS), which is set at auction, remains fixed throughout the term of the security. The principal amount of the security is adjusted for inflation, but the inflation-adjusted principal will not be paid until maturity although the adjustment will be subject to income tax in the year it was earned. Wells Fargo Advisors is not a tax advisor. TIPS have special tax consequences, generating phantom income on the “inflation compensation” component of the principal. A holder of TIPS may be required to report this income annually although no income related to “inflation compensation” is received until maturity.There are special risks associated with an investment in real estate, including illiquidity of underlying properties, credit risk, interest rate fluctuations and the impact of varied economic conditions.The yield, average life and the expected maturity of mortgage-backed securities are based on prepayment assumptions that may or may not be met. Changes in prepayments may significantly affect yield, average life and expected maturity.While stocks generally have a greater potential return than government bonds and Treasury securities, they involve a higher degree of risk. Government bonds and Treasury bills, unlike stocks, are guaranteed as to payment of principal and interest by the U.S. government if held to maturity. Although Treasuries are considered free from credit risk, they are subject to other types of risks. These risks include interest rate risk, which may cause the underlying value of the bond to fluctuate inversely to a change in interest rates.Bank loans have speculative characteristics, including the risk of nonpayment of principal and interest. Other risks may include insolvency, collateral impairment, illiquidity and the risk of bankruptcy.Investing in commodities is not suitable for all investors. Exposure to the commodities markets may subject an investment to greater share price volatility than an investment in traditional equity or debt securities. The prices of various commodities may fluctuate based on numerous factors. Products that invest in commodities may employ more complex strategies which may expose investors to additional risks.Investing in gold, silver, or other precious metals involves special risk considerations, such as severe price fluctuations and adverse economic and regulatory developments affecting the sector or industry.There is no assurance that any of the target prices or other forward-looking statements mentioned will be attained. Any market prices are only indications of market values and are subject to change.

0514-05619
9378
9B-v
2
This publication is designed to provide accurate and authoritative information regarding the subject matter covered. It is made available with the understanding that Wells Fargo Advisors is not engaged in rendering legal, accounting or tax-preparation services. If tax or legal advice is required, the services of a competent professional should be sought. Wells Fargo Advisors’ view is that investment decisions should be based on investment merit, not solely on tax considerations. However, the effects of taxes are a critical factor in achieving a desired after-tax return on your investment. The information provided is based on internal and external sources that are considered reliable; however, the accuracy of the information is not guaranteed. Specific questions on taxes as they relate to your situation should be directed to your tax advisor.Wells Fargo Advisors is a broker/dealer affiliate of Wells Fargo & Company; other broker/dealer affiliates of Wells Fargo & Company may have differing opinions than those expressed in this report. Contact your Financial Advisor if you would like copies of additional reports.
Investment and Insurance Products: NOT FDIC Insured NO Bank Guarantee MAY Lose Value
Wells Fargo Advisors is the trade name used by two separate registered broker-dealers: Wells Fargo Advisors, LLC and Wells Fargo Advisors Financial Network, LLC, Members SIPC, non-bank affiliates of Wells Fargo & Company. First Clearing, LLC is a registered broker-dealer and non-bank affiliate of Wells Fargo & Company. © 2014 Wells Fargo Advisors, LLC. All rights reserved.
Stay informedOur strategists will be following all the latest developments in the news to determine their potential impact on the U.S. and global economy, the markets, and political events overseas. Your financial professional can provide research and advice as well as review your current investment strategy and goals and help ensure that you are prepared to act if anything should change.