investments in intangible assets and australia's ... · productivity commission staff working...
TRANSCRIPT
Productivity CommissionStaff Working Paper
Investments in Intangible Assets and Australia’s Productivity Growth
Paula BarnesAndrew McClure
The views expressed in
this paper are those of the
staff involved and do not
reflect those of the
Productivity Commission.
March 2009
© COMMONWEALTH OF AUSTRALIA 2009
ISBN 978-1-74037-274-9
This work is subject to copyright. Apart from any use as permitted under the Copyright Act 1968, the work may be reproduced in whole or in part for study or training purposes, subject to the inclusion of an acknowledgment of the source. Reproduction for commercial use or sale requires prior written permission from the Attorney-General’s Department. Requests and inquiries concerning reproduction and rights should be addressed to the Commonwealth Copyright Administration, Attorney-General’s Department, Robert Garran Offices, National Circuit, Canberra ACT 2600.
This publication is available in hard copy or PDF format from the Productivity Commission website at www.pc.gov.au. If you require part or all of this publication in a different format, please contact Media and Publications (see below).
Publications Inquiries: Media and Publications Productivity Commission Locked Bag 2 Collins Street East Melbourne VIC 8003
Tel: (03) 9653 2244 Fax: (03) 9653 2303 Email: [email protected]
General Inquiries: Tel: (03) 9653 2100 or (02) 6240 3200
An appropriate citation for this paper is:
Barnes, P. and McClure, A. 2009, Investments in Intangible Assets and Australia’s Productivity Growth, Productivity Commission Staff Working Paper, Canberra.
JEL code: O
The Productivity Commission
The Productivity Commission is the Australian Government’s independent research and advisory body on a range of economic, social and environmental issues affecting the welfare of Australians. Its role, expressed most simply, is to help governments make better policies, in the long term interest of the Australian community.
The Commission’s independence is underpinned by an Act of Parliament. Its processes and outputs are open to public scrutiny and are driven by concern for the wellbeing of the community as a whole.
Further information on the Productivity Commission can be obtained from the Commission’s website (www.pc.gov.au) or by contacting Media and Publications on (03) 9653 2244 or email: [email protected]
CONTENTS III
Contents
Preface VII
Abbreviations and explanations VIII
Key points XII
Overview XIII
1 Background 1 1.1 Definition of intangibles 3 1.2 Objectives and scope of the paper 3 1.3 The rest of the paper 4
2 Methodology 5 2.1 Previous studies 5 2.2 Model 10 2.3 Classification of intangibles 13
3 Measurement of investment in intangibles 17 3.1 Nominal expenditure series 19 3.2 How much of expenditure is investment 31 3.3 Deflators 32 3.4 Real investment series 33
4 Services from intangible capital 41 4.1 Intangible capital stocks 41 4.2 Capital services 47
5 Growth accounting results 55 5.1 Growth accounting components 55 5.2 Growth accounting results 62
6 International comparisons 71 6.1 Intangible investment as a share of output 73 6.2 Growth accounting results compared 85 6.3 Summary 97
IV CONTENTS
A Data sources for investment in intangibles 101
B Specification of model 151
C Growth accounting 155
D Sensitivity testing 167
References 183
Boxes 1 Measurement of intangibles XV 2 Standard growth accounting framework XVIII 3 Growth accounting with intangibles treated as capital XIX
Figures 1 Market sector investment XVI 2 Shares of nominal total intangible investment, by asset type XVII 3 Decomposition of average annual labour productivity growth,
1974-75 to 2005-06 XXI 4 Composition of intangible investment XXIV 3.1 Real investment, tangibles and intangibles, market sector, 1974-75 to
2005-06 36 3.2 Total investment shares of gross value added, 1974-75 to 2005-06 36 3.3 Real investment, by asset type, market sector, 1974-75 to 2005-06 39 3.4 Shares of nominal total intangible investment, by asset type 40 4.1 Total intangibles capital stock, market sector, 1974-75 to 2005-06 46 4.2 Composition of total nominal intangible stock, 1974-75 to 2005-06 47 4.3 Rental prices by intangible asset type, 1974-75 to 2005-06 49 4.4 Capital services index, tangibles and intangibles, market sector,
1974-75 to 2005-06 50 4.5 Composition of total intangible capital services, 1974-75 to 2005-06 53 5.1 Market sector gross value added, 1974-75 to 2005-06 59 5.2 Capital services, market sector, 1974-75 to 2005-06 61 5.3 Multifactor productivity, market sector, 1974-75 to 2005-06 67 5.4 Contributions to labour productivity growth over MFP growth
cycles, market sector 68 6.1 Composition of intangible investment, by country 77 6.2 Intangible investment shares of output, by country 82
CONTENTS V
6.3 Contributions of individual intangibles to total intangible capital deepening, by country 89
6.4 Contributions of new and ‘traditional’ intangibles to total intangible capital deepening, by country 90
6.5 Decomposition of labour productivity growth, by country, by definition of capital, mid-1990s to early 2000s 94
C.1 Internal rate of return for the market sector, all intangibles treated as capital 162
D.1 Comparison of endogenous and exogenous rates of return 168 D.2 Capital services, alternative internal rates of return, all intangibles
treated as capital 169 D.3 MFP using alternate rates of return, all intangibles treated as capital 170 D.4 Real investment, alternative estimates for new intangibles, market
sector, 1974-75 to 2005-06 175 D.5 Shares of nominal total intangible investment, by asset type,
alternative estimates for new intangibles, 2005-06 176 D.6 Total intangibles capital stock, alternative estimates for new
intangibles, market sector, 1974-75 to 2005-06 177 D.7 Composition of total intangible capital services, alternative estimates
for new intangibles, 2005-06 178
Tables 1 Intangible investment as a share of adjusted output XXIII 3.1 Summary of data sources and assumptions used to construct
investment of intangibles 18 3.2 Nominal intangible investment, market sector, 2005-06 34 3.3 Growth in real intangible investment, market sector 38 4.1 Depreciation rate assumptions 43 4.2 Value of intangible capital stock, market sector, 2005-06 45 4.3 Growth rate of intangible capital services, market sector 51 5.1 Growth in market sector gross value added 60 5.2 Capital and labour income shares, market sector 62 5.3 Contributions to labour productivity growth, market sector 64 5.4 Contributions to capital deepening, market sector 65 5.5 Productivity growth cycle analysis, market sector 69 6.1 Intangible investment as a share of GDP, by country 74 6.2 Intangible investment as a share of adjusted output, by country 75
VI CONTENTS
6.3 Productivity growth after accounting for all intangibles, by country 87 6.4 Effect of intangibles on productivity growth, by country and
intangible group 92 A.1 Industries included in the market sector 101 A.2 Summary of data sources and assumptions used to construct stocks
of intangibles 103 A.3 Comparison of data sources across countries 137 C.1 Rental price components for intangible assets 159 D.1 Comparison of MFP growth rates using alternative rates of return 171 D.2 International comparisons using endogenous rate of return 172 D.3 Comparison of parameter sensitivity testing results, all intangibles
treated as capital 174 D.4 Comparison of investment and capital size sensitivity testing results,
all intangibles treated as capital 179 D.5 Comparison of MFP and capital services growth rates using lower
bound intangible estimates 181 D.6 Contributions to capital deepening, all intangibles treated as capital,
1974-75 to 2005-06 182
PREFACE VII
Preface
This staff working paper examines investment in intangible assets in Australia and highlights some significant issues relating to the measurement of intangibles and their contribution to productivity.
Helpful comments on the paper were received from Elizabeth Webster (Melbourne Institute of Applied Economic and Social Research), Derick Cullen (Australian Bureau of Statistics) and Myriam van Rooijen-Horsten (Statistics Netherlands). The Australian Bureau of Statistics provided vital assistance through the provision of unpublished data. Paul Roberts and Bertram Antioch of the Australian Bureau of Statistics and Ben Dolman of the Productivity Commission provided helpful advice on data issues and productivity measurement. Tracey Horsfall from the Productivity Commission assisted in the preparation of the paper.
The views expressed in this paper are those of the authors and are not necessarily those of the Productivity Commission.
VIII ABBREVIATIONS AND EXPLANATIONS
Abbreviations and explanations
Abbreviations
ABS Australian Bureau of Statistics ANZSIC Australian and New Zealand Standard Industrial
Classification ASCO Australian Standard Classification of Occupations ASIC Australian Standard Industrial Classification BERD Business expenditure on research and development BEA Bureau of Economic Analysis (US) BLS Bureau of Labor Statistics (US) CCLO Classification and Classified List of Occupations CEASA Commercial Economic Advisory Service of Australia CEO Chief Executive Officer CHS Corrado, Hulten and Sichel COE compensation of employees CPI consumer price index CVM chain volume measure EEBTUM Employee Earnings, Benefits and Trade Union Membership
survey GDP gross domestic product GFCF gross fixed capital formation GMI gross mixed income GOS gross operating surplus GPI Genuine Progress Indicator GVA gross value added ICT information and communication technology IO input-output
ABBREVIATIONS ANDEXPLANATIONS
IX
IPD implicit price deflator IRR internal rate of return IT information technology JAA Jalava, Aulin-Ahmavaara and Alanen JIP Japanese Industry Productivity database LP labour productivity MFP multifactor productivity MH Marrano and Haskel MHW Marrano, Haskel and Wallis NCETS National Centre for Education and Training Statistics NIPA National Income and Product Accounts (US) OECD Organisation for Economic Cooperation and Development ONS Office of National Statistics (UK) PC Productivity Commission PIM perpetual inventory method PKS productive capital stock QALI quality adjusted labour input R&D research and development RBT van Rooijen-Horsten, van den Bergen and Tanriseven SNA System of National Accounts SOG sources of growth STAN Structural Analysis SU supply-use SUIC supply-use industry code SUPC supply-use product code VA value added
Explanations
Billion The convention used for a billion is a thousand million (109).


OVERVIEW
XII INTANGIBLE ASSETS AND AUSTRALIA'S PRODUCTIVITY
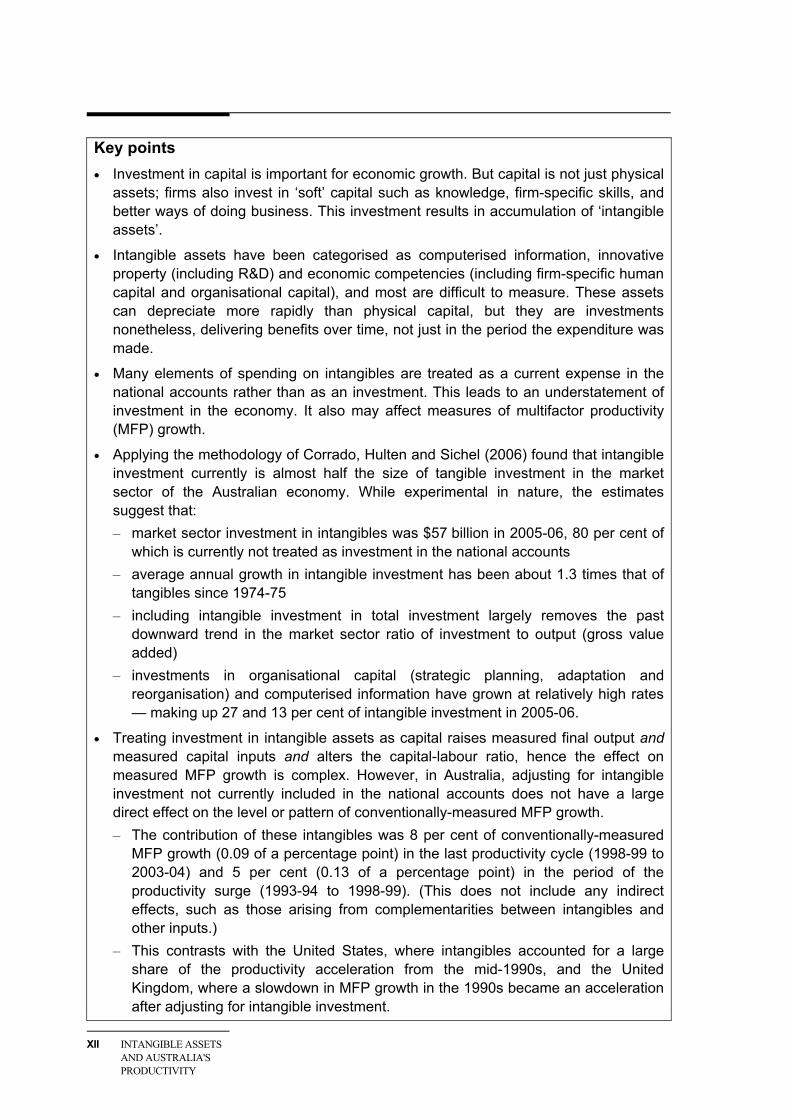
Key points • Investment in capital is important for economic growth. But capital is not just physical
assets; firms also invest in ‘soft’ capital such as knowledge, firm-specific skills, and better ways of doing business. This investment results in accumulation of ‘intangible assets’.
• Intangible assets have been categorised as computerised information, innovative property (including R&D) and economic competencies (including firm-specific human capital and organisational capital), and most are difficult to measure. These assets can depreciate more rapidly than physical capital, but they are investments nonetheless, delivering benefits over time, not just in the period the expenditure was made.
• Many elements of spending on intangibles are treated as a current expense in the national accounts rather than as an investment. This leads to an understatement of investment in the economy. It also may affect measures of multifactor productivity (MFP) growth.
• Applying the methodology of Corrado, Hulten and Sichel (2006) found that intangible investment currently is almost half the size of tangible investment in the market sector of the Australian economy. While experimental in nature, the estimates suggest that: – market sector investment in intangibles was $57 billion in 2005-06, 80 per cent of
which is currently not treated as investment in the national accounts – average annual growth in intangible investment has been about 1.3 times that of
tangibles since 1974-75 – including intangible investment in total investment largely removes the past
downward trend in the market sector ratio of investment to output (gross value added)
– investments in organisational capital (strategic planning, adaptation and reorganisation) and computerised information have grown at relatively high rates — making up 27 and 13 per cent of intangible investment in 2005-06.
• Treating investment in intangible assets as capital raises measured final output and measured capital inputs and alters the capital-labour ratio, hence the effect on measured MFP growth is complex. However, in Australia, adjusting for intangible investment not currently included in the national accounts does not have a large direct effect on the level or pattern of conventionally-measured MFP growth. – The contribution of these intangibles was 8 per cent of conventionally-measured
MFP growth (0.09 of a percentage point) in the last productivity cycle (1998-99 to 2003-04) and 5 per cent (0.13 of a percentage point) in the period of the productivity surge (1993-94 to 1998-99). (This does not include any indirect effects, such as those arising from complementarities between intangibles and other inputs.)
– This contrasts with the United States, where intangibles accounted for a large share of the productivity acceleration from the mid-1990s, and the United Kingdom, where a slowdown in MFP growth in the 1990s became an acceleration after adjusting for intangible investment.
OVERVIEW XIII
Overview
Investment in capital is important for economic growth. But capital is not just physical assets — firms also invest in ‘intangible assets’, such as knowledge, firm-specific skills and better ways of doing business. Some commentators have suggested that structural and technological changes in economies have increased the importance of investment in intangibles as a source of economic growth. It has also been suggested that the observed diversity in productivity improvements (across firms, industries and countries) is linked to investment in intangibles and its complementarities with other assets, such as information and communication technologies (ICTs).
Despite this increase in prominence, intangibles are relatively poorly measured and understood. Focus has been on a small number of intangibles, such as computer software and scientific R&D. And only a few intangibles are measured as investment in national accounts. Excluding investment in intangibles means investment is underreported, and this may distort measures of growth in capital services and consequently productivity.
Measuring intangibles is not easy. However, Corrado, Hulten and Sichel (CHS 2005, 2006) developed an experimental methodology for measuring investment in a wide range of intangibles. They then used this in a growth accounting framework to explicitly identify the contribution of intangibles to conventional productivity measures. Originally applied to US data, it has now been applied to a number of countries with a range of results.
This paper continues this work by applying the approach to Australia. The paper addresses two questions. Has the composition of investment (including intangibles) changed over time? And does excluding intangible investment result in a distorted view of the dynamic changes in economic growth and productivity? The paper applies the CHS methodology to data for the market sector of the Australian economy to estimate the level and growth of investment in a range of intangibles. It also examines the direct contribution to conventionally-measured productivity growth of those intangibles not currently treated as investment.
Given the experimental nature of the methodology, the assumptions required, measurement challenges and data limitations, the estimates should be interpreted as only indicative. With this caveat, the paper finds that Australia has large and
XIV INTANGIBLE ASSETS AND AUSTRALIA'S PRODUCTIVITY
growing levels of investment in intangibles. Notably, the inclusion of intangibles investment largely flattens the declining trend in the ratio of investment to gross value added for the market sector, and is a growing share of total investment. Nevertheless, only a small amount of conventionally-measured multifactor productivity (MFP) growth in recent periods is accounted for by the direct contribution of services from intangible assets. And unlike the results for some other countries, accounting for intangibles does not have a large effect on the pattern of productivity growth in Australia.
Measuring intangibles is not easy
‘Intangible assets’ have been variously defined but the common thread of the definitions is that these assets provide future benefits but do not have a physical embodiment. This lack of ‘visibility’ makes many intangibles difficult to measure. This is part of the reason for the treatment of many elements of spending on intangibles as current expenses, rather than investments, in conventional measures of output and productivity.
There are two main ways in which researchers have tried to quantify intangibles —financial market valuation (the difference between market values of firms and the value of tangible assets of firms) and direct expenditure-based measures of individual types of intangibles. CHS take the latter approach, defining and quantifying three main categories of intangibles (made up of a variety of specific intangibles).
• Computerised information is the knowledge embedded in computer programs and databases.
• Innovative property includes the relatively familiar scientific R&D (reflecting scientific knowledge embedded in patents, licences and general know-how) but is much broader — including non-scientific R&D or creative property (innovative and artistic content in commercial copyrights, licences and designs).
• Economic competencies include brand equity (for example, investment to retain or gain market share and investment in brand names), firm-specific human capital (employee skill building) and organisational capital (investments in strategic planning, adaptation and reorganisation).
The research used the CHS categorisation, to collate a range of data to create a set of experimental estimates for intangibles in Australia (box 1). For some intangibles, such as firm-specific human capital, it has been very difficult to construct reliable measures over time. It has also been necessary to make a number of assumptions based on limited available information. There is much scope for improvement and
OVERVIEW XV
refinement of the measures. However, these estimates provide a starting point and the first attempt (as far as can be ascertained) to apply the CHS methodology to measure the range of intangibles for Australia.
Box 1 Measurement of intangibles CHS (2006) identified 3 main groups of intangibles, covering 13 individual intangibles. The measures and data sources used for the Australian estimates are listed below. The percentages of expenditure assumed to be investment are based on CHS (2006) — the extent to which some of these assumptions are somewhat arbitrary, given limited available evidence, is discussed in chapter 3 and appendix A.
Type of intangible Investment measure and main data source Computerised information Computer software; Computer databases
Investment from ABS national accounts
Innovative property Scientific R&D; Social sciences R&D (Business R&D)
Expenditure on R&D from ABS business R&D survey
Mineral exploration Investment from ABS national accounts
Copyright and licence costs (Artistic originals)
Investment from ABS national accounts
Other product development, design and research
New product development in financial industry
20 per cent of all intermediate purchases by Finance industry — from ABS supply-use tables
New architectural and engineering designs
50 per cent of sales of architectural and consulting engineering services — from ABS industry surveys
Economic competencies Brand equity
Advertising 60 per cent of advertising expenditure — from advertising industry survey
Market research 60 per cent of sales of market research services (doubled to account for own-account research) — from ABS industry survey
Firm-specific human capital Direct costs and wage costs of employee time in training — from ABS training surveys
Organisational capital
Purchased 80 per cent of sales of management consulting services — from ABS industry survey
Own account 20 per cent of salaries of Managers & administrators — from ABS Labour Force Survey
XVI INTANGIBLE ASSETS AND AUSTRALIA'S PRODUCTIVITY
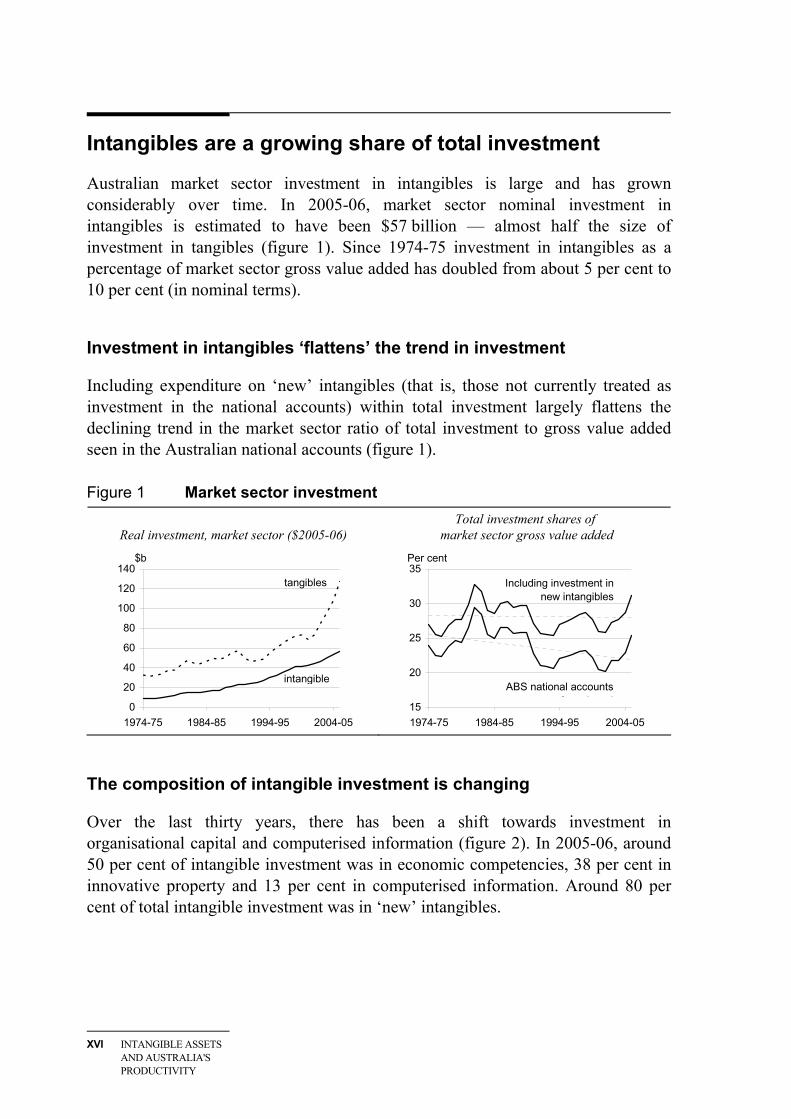
Intangibles are a growing share of total investment
Australian market sector investment in intangibles is large and has grown considerably over time. In 2005-06, market sector nominal investment in intangibles is estimated to have been $57 billion — almost half the size of investment in tangibles (figure 1). Since 1974-75 investment in intangibles as a percentage of market sector gross value added has doubled from about 5 per cent to 10 per cent (in nominal terms).
Investment in intangibles ‘flattens’ the trend in investment
Including expenditure on ‘new’ intangibles (that is, those not currently treated as investment in the national accounts) within total investment largely flattens the declining trend in the market sector ratio of total investment to gross value added seen in the Australian national accounts (figure 1).
Figure 1 Market sector investment
Real investment, market sector ($2005-06) Total investment shares of
market sector gross value added
0
20
40
60
80
100
120
140
1974-75 1984-85 1994-95 2004-05
$b
intangible
tangibles
15
20
25
30
35
1974-75 1984-85 1994-95 2004-05
Per cent
Including investment in new intangibles
ABS national accounts i t t
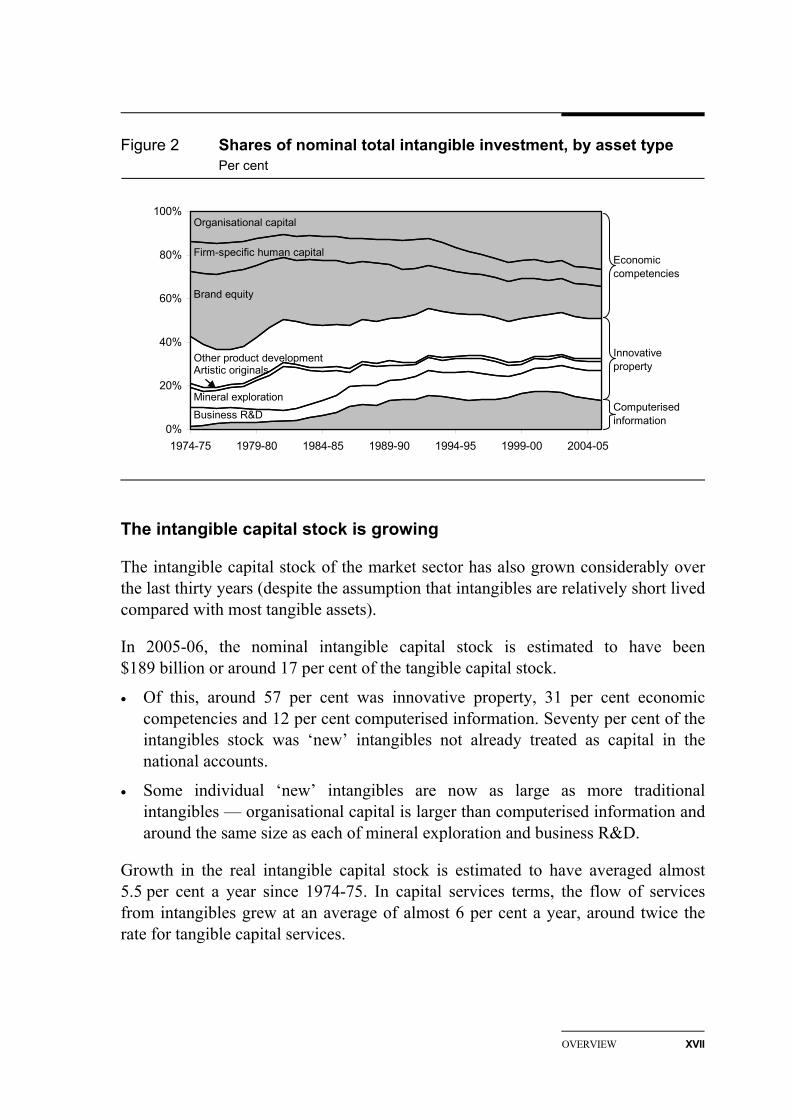
The composition of intangible investment is changing
Over the last thirty years, there has been a shift towards investment in organisational capital and computerised information (figure 2). In 2005-06, around 50 per cent of intangible investment was in economic competencies, 38 per cent in innovative property and 13 per cent in computerised information. Around 80 per cent of total intangible investment was in ‘new’ intangibles.
OVERVIEW XVII
Figure 2 Shares of nominal total intangible investment, by asset type Per cent
0%
20%
40%
60%
80%
100%
1974-75 1979-80 1984-85 1989-90 1994-95 1999-00 2004-05
Computerised information
Economic competencies
Innovative property
Organisational capital
Firm-specific human capital
Brand equity
Business R&D
Other product development
Mineral exploration
Artistic originals
The intangible capital stock is growing
The intangible capital stock of the market sector has also grown considerably over the last thirty years (despite the assumption that intangibles are relatively short lived compared with most tangible assets).
In 2005-06, the nominal intangible capital stock is estimated to have been $189 billion or around 17 per cent of the tangible capital stock.
• Of this, around 57 per cent was innovative property, 31 per cent economic competencies and 12 per cent computerised information. Seventy per cent of the intangibles stock was ‘new’ intangibles not already treated as capital in the national accounts.
• Some individual ‘new’ intangibles are now as large as more traditional intangibles — organisational capital is larger than computerised information and around the same size as each of mineral exploration and business R&D.
Growth in the real intangible capital stock is estimated to have averaged almost 5.5 per cent a year since 1974-75. In capital services terms, the flow of services from intangibles grew at an average of almost 6 per cent a year, around twice the rate for tangible capital services.
XVIII INTANGIBLE ASSETS AND AUSTRALIA'S PRODUCTIVITY
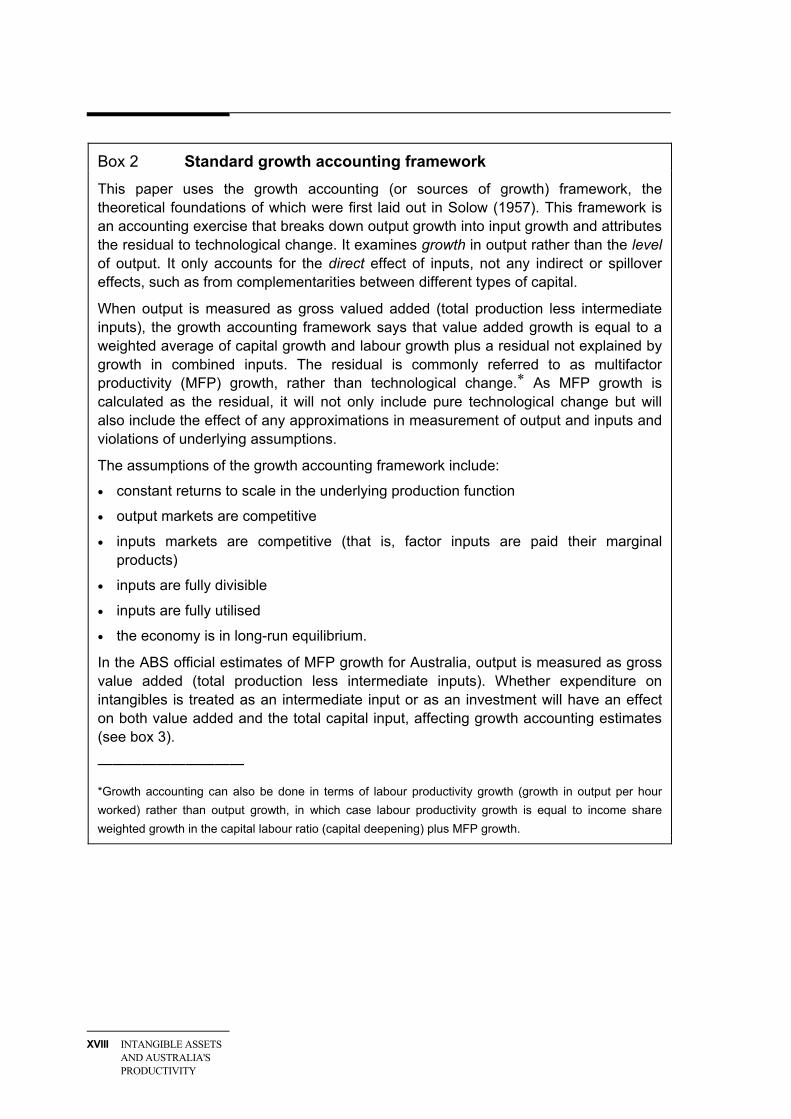
Box 2 Standard growth accounting framework This paper uses the growth accounting (or sources of growth) framework, the theoretical foundations of which were first laid out in Solow (1957). This framework is an accounting exercise that breaks down output growth into input growth and attributes the residual to technological change. It examines growth in output rather than the level of output. It only accounts for the direct effect of inputs, not any indirect or spillover effects, such as from complementarities between different types of capital.
When output is measured as gross valued added (total production less intermediate inputs), the growth accounting framework says that value added growth is equal to a weighted average of capital growth and labour growth plus a residual not explained by growth in combined inputs. The residual is commonly referred to as multifactor productivity (MFP) growth, rather than technological change.* As MFP growth is calculated as the residual, it will not only include pure technological change but will also include the effect of any approximations in measurement of output and inputs and violations of underlying assumptions.
The assumptions of the growth accounting framework include:
• constant returns to scale in the underlying production function
• output markets are competitive
• inputs markets are competitive (that is, factor inputs are paid their marginal products)
• inputs are fully divisible
• inputs are fully utilised
• the economy is in long-run equilibrium.
In the ABS official estimates of MFP growth for Australia, output is measured as gross value added (total production less intermediate inputs). Whether expenditure on intangibles is treated as an intermediate input or as an investment will have an effect on both value added and the total capital input, affecting growth accounting estimates (see box 3).
——————————
*Growth accounting can also be done in terms of labour productivity growth (growth in output per hour worked) rather than output growth, in which case labour productivity growth is equal to income share weighted growth in the capital labour ratio (capital deepening) plus MFP growth.
OVERVIEW XIX
Accounting for intangibles as investment affects the sources of measured growth
Ignoring intangible assets as a source of capital services can result in bias in the estimates of MFP growth. For example, a slowdown in MFP growth in the 1990s in the United Kingdom became an acceleration after adjusting for intangible investment (Marrano, Haskel and Wallis 2007). For the United States, an important part of the productivity acceleration since the mid-1990s has been attributed to intangible assets (CHS 2006). The second half of this paper uses growth accounting to estimate the effect of treating intangible assets as capital on Australian MFP measures.
Growth accounting shows the direct contribution of inputs to output growth
Growth accounting is used to show what proportion of output growth is attributable to increases in labour and capital inputs, with the residual growth explained by other factors (such as technological progress). It is this residual that is considered a measure of MFP. Conventional growth accounting (box 2) treats expenditure on intangibles as current expenses, rather than as investments. This can result in biased measures of MFP (box 3).
Box 3 Growth accounting with intangibles treated as capital
Treating intangibles as capital within the growth accounting framework can have a number of effects on both the output and input sides of the accounting exercise, with a consequent effect on measured MFP growth as the residual that depends on the relative changes in output and input growth.
Measured output — treating expenditure on intangibles as an investment, instead of an intermediate input, increases the level of measured output (gross value added) by the amount of intangible investment. But the change in growth in measured total output depends on growth in investment in intangibles relative to growth in other outputs. For total output growth to be higher, growth in investment in intangibles must be higher than growth in other outputs.
Measured capital inputs — intangibles investment increases the level of the capital stock and the services from that capital stock. This is the direct effect and does not measure any indirect or spillover effects from that investment. But whether growth in total capital services is higher (lower) depends on whether intangible capital services is growing faster (slower) than tangible capital services.
(continued on next page)
XX INTANGIBLE ASSETS AND AUSTRALIA'S PRODUCTIVITY
Box 3 (continued)
Capital and labour shares of total inputs — the increase in measured capital increases the capital share and decreases the labour share of total inputs, although the return to labour and volume of labour do not change. Combined input growth (the weighted average of capital growth and labour growth) will rise (fall) if capital growth is higher (lower) than labour growth.
Measured MFP growth — the effect on measured MFP growth can be positive or negative depending on the relative size of the effects on output and input growth, that is, the difference caused by intangible investment (part of output not previously measured) and by intangible capital inputs (the services of the stock of capital not previously measured). This effect on MFP growth depends not just on the relative growth rates of outputs and capital inputs, but also the combined input growth rate which changes as the capital and labour shares of total inputs change.
The effect on productivity growth for Australia is small
Intangible assets directly account for a small but notable amount of conventionally-measured MFP growth for the Australian market sector. (This does not account for any indirect spillovers captured in MFP growth from, for example, complementarities between ICTs and particular types of intangible capital.)
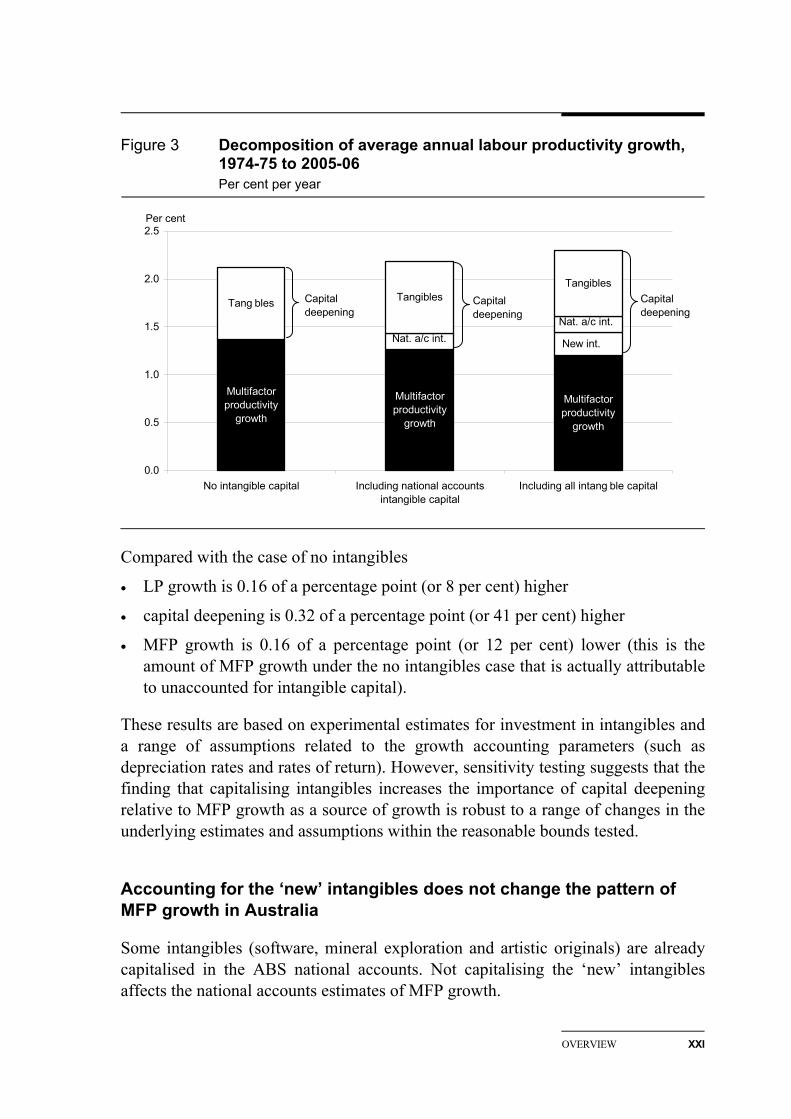
Growth accounting estimates for the Australian market sector are presented for three definitions of capital — including all intangibles, only the national accounts intangibles and no intangibles.1 Labour productivity (LP) growth (growth in gross value added per hour worked in the market sector) is decomposed into the contributions of capital deepening and MFP growth (figure 3).
The effect of treating intangibles as capital is to raise measured labour productivity growth and to shift the relative importance of the sources of growth — towards capital deepening and away from MFP growth (the residual). When all intangibles are capitalised, on average they contribute 37 per cent of total capital deepening and 17 per cent of LP growth between 1974-75 and 2005-06.
1 The estimates in this paper for the ‘national accounts’ case are slightly different from the ABS
official estimates due to differences in methodology necessitated by limited intangibles data. The national accounts case was re-estimated for comparability with the other estimates in this paper.
OVERVIEW XXI
Figure 3 Decomposition of average annual labour productivity growth, 1974-75 to 2005-06 Per cent per year
Multifactor productivity
growth
Multifactor productivity
growth
Multifactor productivity
growth
New int.
TangiblesTangibles Tang bles
0.0
0.5
1.0
1.5
2.0
2.5
No intangible capital Including national accountsintangible capital
Including all intang ble capital
Capital deepening
Capital deepening
Capital deepening
Nat. a/c int.Nat. a/c int.
Per cent
Compared with the case of no intangibles
• LP growth is 0.16 of a percentage point (or 8 per cent) higher
• capital deepening is 0.32 of a percentage point (or 41 per cent) higher
• MFP growth is 0.16 of a percentage point (or 12 per cent) lower (this is the amount of MFP growth under the no intangibles case that is actually attributable to unaccounted for intangible capital).
These results are based on experimental estimates for investment in intangibles and a range of assumptions related to the growth accounting parameters (such as depreciation rates and rates of return). However, sensitivity testing suggests that the finding that capitalising intangibles increases the importance of capital deepening relative to MFP growth as a source of growth is robust to a range of changes in the underlying estimates and assumptions within the reasonable bounds tested.
Accounting for the ‘new’ intangibles does not change the pattern of MFP growth in Australia
Some intangibles (software, mineral exploration and artistic originals) are already capitalised in the ABS national accounts. Not capitalising the ‘new’ intangibles affects the national accounts estimates of MFP growth.
XXII INTANGIBLE ASSETS AND AUSTRALIA'S PRODUCTIVITY
• On average, 0.06 of a percentage point or 5 per cent of conventionally-measured annual average MFP growth is attributable to the new intangibles between 1974-75 and 2005-06.
• However, looking at the MFP peak-to-peak periods (which control for influences of the business cycle), the amount attributable to new intangibles ranges from -1 per cent to 8 per cent of conventionally-measured MFP growth. In the most recent cycle, 1998-99 to 2003-04, it is 8 per cent (0.09 of a percentage point).
National accounts intangibles have a larger effect on MFP growth than the new intangibles. While the new intangibles have a larger effect than national accounts intangibles on capital deepening and LP growth, these are largely offsetting so the effect on MFP growth is limited.
Overall, capitalising the new intangibles does not change the length of the MFP growth cycles or the periods in which acceleration/deceleration occurs (although the extent of the change is affected). And only a small proportion of Australia’s MFP growth is directly attributable to intangibles.
International comparisons
Comparing measures across countries always raises issues of the extent to which the comparisons are legitimate. Even using measures based on the same methodology, as is the case in this paper, many differences remain because of variations in underlying data and data limitations. The extent to which differences between the estimates in this paper and those in the other country studies represent real differences rather than measurement differences is not known. Any real differences between countries should also be interpreted carefully. Country-specific circumstances will affect their appropriate level and type of intangible investment — the country with the highest ratio of intangibles to output should not be regarded as a benchmark. And the growth accounting approach does not provide information about the causal links between intangible investment and productivity growth.
Australian rates of investment in intangibles are mid-range
Although it is not possible to draw strong conclusions from these international comparisons, there are a number of notable features about the estimates. Experimental estimates based on the CHS methodology suggest that Australia has a ratio of intangible investment to output that is around mid-range of the estimates for other countries (table 1). Australia has a lower ratio than Finland, the United States, the United Kingdom, France, Japan and Germany but a higher ratio than Canada, the Netherlands, Italy and Spain.
OVERVIEW XXIII
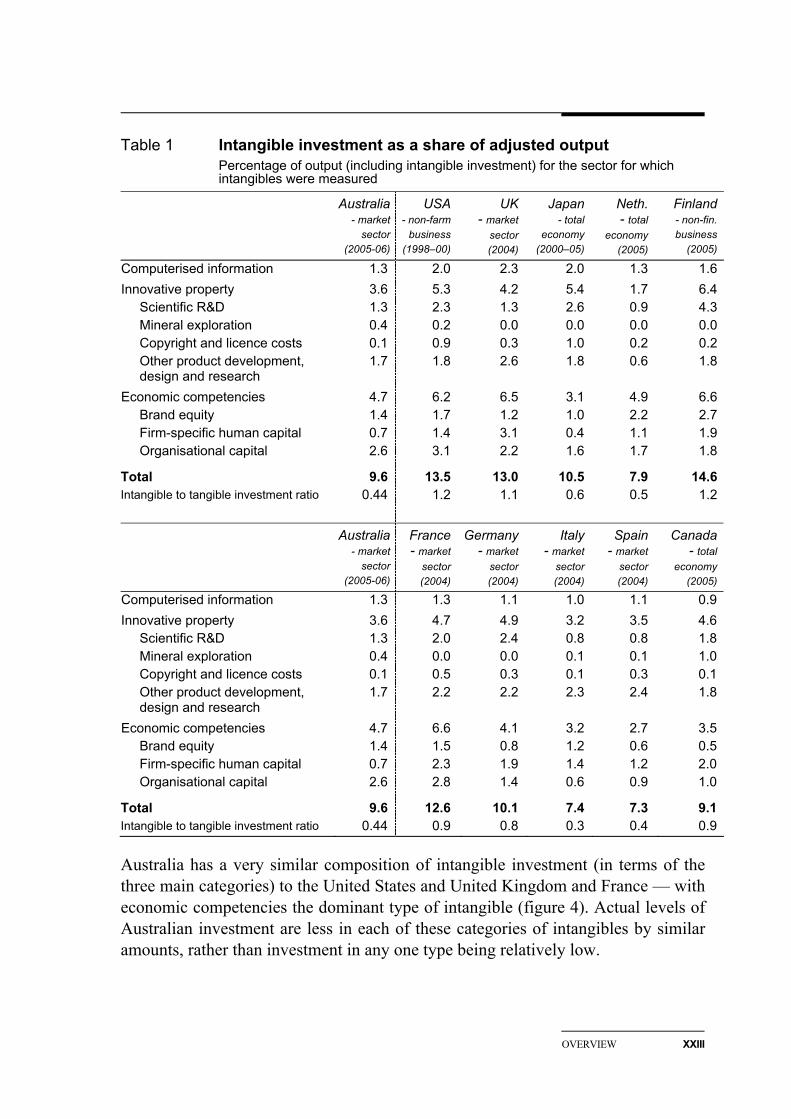
Table 1 Intangible investment as a share of adjusted output Percentage of output (including intangible investment) for the sector for which intangibles were measured
Australia - market
sector (2005-06)
USA - non-farm
business (1998–00)
UK- market
sector(2004)
Japan - total
economy (2000–05)
Neth. - total
economy (2005)
Finland- non-fin. business
(2005)
Computerised information 1.3 2.0 2.3 2.0 1.3 1.6Innovative property 3.6 5.3 4.2 5.4 1.7 6.4
Scientific R&D 1.3 2.3 1.3 2.6 0.9 4.3Mineral exploration 0.4 0.2 0.0 0.0 0.0 0.0Copyright and licence costs 0.1 0.9 0.3 1.0 0.2 0.2Other product development, design and research
1.7 1.8 2.6 1.8 0.6 1.8
Economic competencies 4.7 6.2 6.5 3.1 4.9 6.6Brand equity 1.4 1.7 1.2 1.0 2.2 2.7Firm-specific human capital 0.7 1.4 3.1 0.4 1.1 1.9Organisational capital 2.6 3.1 2.2 1.6 1.7 1.8
Total 9.6 13.5 13.0 10.5 7.9 14.6Intangible to tangible investment ratio 0.44 1.2 1.1 0.6 0.5 1.2
Australia - market
sector (2005-06)
France- market
sector(2004)
Germany- market
sector(2004)
Italy - market
sector (2004)
Spain - market
sector (2004)
Canada- total
economy(2005)
Computerised information 1.3 1.3 1.1 1.0 1.1 0.9Innovative property 3.6 4.7 4.9 3.2 3.5 4.6
Scientific R&D 1.3 2.0 2.4 0.8 0.8 1.8Mineral exploration 0.4 0.0 0.0 0.1 0.1 1.0Copyright and licence costs 0.1 0.5 0.3 0.1 0.3 0.1Other product development, design and research
1.7 2.2 2.2 2.3 2.4 1.8
Economic competencies 4.7 6.6 4.1 3.2 2.7 3.5Brand equity 1.4 1.5 0.8 1.2 0.6 0.5Firm-specific human capital 0.7 2.3 1.9 1.4 1.2 2.0Organisational capital 2.6 2.8 1.4 0.6 0.9 1.0
Total 9.6 12.6 10.1 7.4 7.3 9.1Intangible to tangible investment ratio 0.44 0.9 0.8 0.3 0.4 0.9
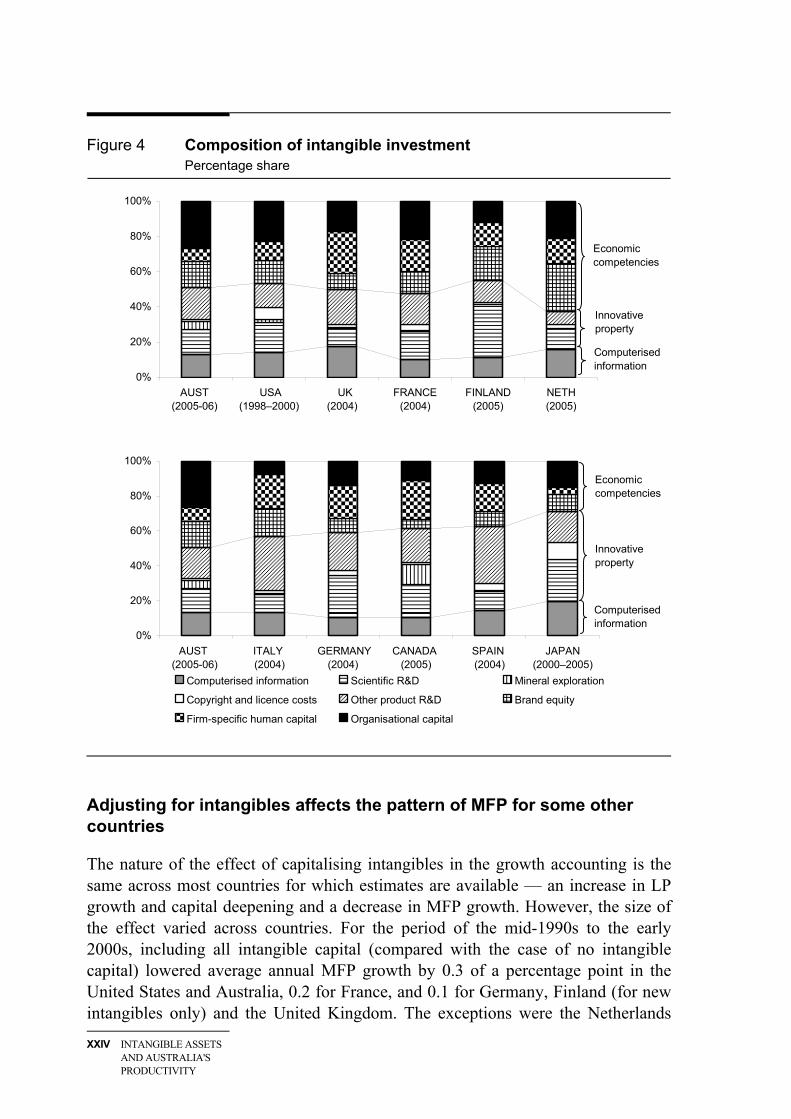
Australia has a very similar composition of intangible investment (in terms of the three main categories) to the United States and United Kingdom and France — with economic competencies the dominant type of intangible (figure 4). Actual levels of Australian investment are less in each of these categories of intangibles by similar amounts, rather than investment in any one type being relatively low.
XXIV INTANGIBLE ASSETS AND AUSTRALIA'S PRODUCTIVITY
Figure 4 Composition of intangible investment Percentage share
0%
20%
40%
60%
80%
100%
AUST (2005-06)
USA (1998–2000)
UK (2004)
FRANCE (2004)
FINLAND (2005)
NETH (2005)
Economic competencies
Computerised information
Innovative property
0%
20%
40%
60%
80%
100%
AUST (2005-06)
ITALY (2004)
GERMANY (2004)
CANADA (2005)
SPAIN (2004)
JAPAN (2000–2005)
Computerised information Scientific R&D Mineral exploration
Copyright and licence costs Other product R&D Brand equity
Firm-specific human capital Organisational capital
Economic competencies
Innovative property
Computerised information
Adjusting for intangibles affects the pattern of MFP for some other countries
The nature of the effect of capitalising intangibles in the growth accounting is the same across most countries for which estimates are available — an increase in LP growth and capital deepening and a decrease in MFP growth. However, the size of the effect varied across countries. For the period of the mid-1990s to the early 2000s, including all intangible capital (compared with the case of no intangible capital) lowered average annual MFP growth by 0.3 of a percentage point in the United States and Australia, 0.2 for France, and 0.1 for Germany, Finland (for new intangibles only) and the United Kingdom. The exceptions were the Netherlands

OVERVIEW XXV
and Italy, for which there was no change in MFP growth, and Japan and Spain, for which MFP growth rose after capitalising intangibles.
Treating intangibles as capital does not have a large effect on the pattern of growth over productivity cycles for Australia. This contrasts with the United Kingdom, for which a deceleration in MFP growth between the early and late 1990s cycles became an acceleration after capitalising intangibles (Marrano, Haskel and Wallis 2007). For the Netherlands, the reverse was found — an acceleration in average MFP growth between 1996–2000 and 2001–2005 became a deceleration after capitalising intangibles (van Rooijen-Horsten et al. 2008).
While this paper does not explore or provide any measures of the indirect effects, it does add to the scope for international comparisons of the size of intangibles with potential complementarities. Fukao et al. (2008b) note that differences in the accumulation of intangible assets that play a complementary role to ICT capital might explain differences in productivity growth — and the results for Japan, particularly in terms of lower organisational capital, provide some support to this as a potential explanation. It is also the case that Australia (like the United States) has higher levels of organisational capital and higher levels of productivity growth than Japan.
Further research
Estimates in this paper are exploratory and, as is acknowledged by the authors of the other country studies, much work could be done to improve them. There are also alternative methodologies for the measurement of intangibles that could be explored. The development of improved measures (and data collections to support them), in conjunction with national statistics agencies, would be required before such intangibles could be considered for formal identification into the national accounts or even inclusion in a separate dataset focused on growth accounting.
However, beyond these direct measurement issues there is a range of other possible areas for further research.
• Organisational capital. The experimental estimates suggest that investment in organisational capital in Australia is now larger than business R&D, which the ABS intends to capitalise in the Australian national accounts. There are currently no plans to capitalise organisational capital — and this would be difficult since it is relatively poorly measured. However, the size of the estimates indicate that the measurement and effects of organisational capital (including complementarities with ICTs) warrant further investigation.
XXVI INTANGIBLE ASSETS AND AUSTRALIA'S PRODUCTIVITY
• Industry level estimates. Intangibles are likely to be relatively more important in some industries than others. For example, a relatively high rate of intangible investment was found in the financial services industry in the Netherlands (van Rooijen-Horsten et al. 2008). For Japan, the services sector had a lower rate of intangible investment relative to the manufacturing sector (Fukao et al. 2008b). Subject to data limitations, estimates for selected Australian industries or sectors would enable a closer examination of the links between intangibles and growth.
• Econometric analysis of intangibles. As the number of country studies using the CHS methodology increases it may be possible to undertake some econometric analysis of intangibles by pooling the data. This may enable the indirect spillovers from intangible assets to be examined.
BACKGROUND 1
1 Background
The rise of the ‘knowledge economy’ has brought productivity gains. But the extent of diversity in performance improvement across firms, industries and some countries has increased attention on the role of investments in certain intangible assets — such as computerised information (for example, databases), innovative property (for example, patents and designs) and economic competencies (for example, ‘organisational capital’). Most of the focus on intangibles has been on computer software and R&D. But the other intangibles also warrant investigation — for example, it has been suggested that organisational capital facilitates adaptation to change and has complementarities with ICT capital.
Lev (2001) suggests that intangibles, while not new1, have come to prominence because of intensified competition, due to globalisation of trade and deregulation in key economic sectors, and ICTs. These factors have changed the structure of firms and elevated the role of intangibles. However, despite this elevated role, intangibles are not well understood.
• Lev (2001, p. v) suggests that, despite their importance, intangibles are poorly measured, if at all, and their implications for public policy are not understood.
• Corrado, Hulten and Sichel (2005, p. 37) suggest that the conventional framework and current data used in growth analysis are “not telling us all we need to know about the role of knowledge capital in economic growth.”
• Nakamura (1999, p. 13) traces the exclusion of intangibles from the capital stock in the national accounts to long-standing statistical conventions that assets had to be material and states that “… we need to recognize the increasing importance of intangible investment for our economy. Otherwise, statistical conventions can cause us to misread the fundamental forces propelling economic activity.”
It has been argued that there are several areas of potential distortion of resource allocation and policy that arise from the fact that intangibles are only incompletely revealed in available statistical data and company accounting and reporting. There
1 There is also a considerable history of research into intangibles — see Webster (1999) for an
overview of the earlier roots of this literature.
2 INTANGIBLE ASSETS AND AUSTRALIA'S PRODUCTIVITY
are four main issues (see Mortenson 2000, Vickery 2000 and Lev 2001 for further details):
• capital markets, partly due to regulation, emphasise tangible rather than intangible capital, with an effect on access to and cost of capital
• mandatory expensing of intangibles leads to asymmetric information available to managers and shareholders and potentially distorts market transactions
• within companies, insufficient information about intangibles may distort management decisions and the formulation of business strategies
• within public policy, insufficient information about intangibles may distort particular policies (for example, industry policy, taxation, R&D and intellectual property protection).
There is an important measurement issue — treating expenditure on intangibles as a current expense, rather than as an investment, has an impact on the magnitude of measured value added and hence also on productivity measured. More fundamentally, intangible assets can be seen as a necessary pre-condition for optimising productivity gains. Specifically, investment in intangibles, such as new organisational structures, is needed in order to tap fully the productivity potential that information and communications technology presents.
Conventionally-measured GDP treats much of intangible expenditure as an intermediate input rather than an investment. This means that expenditure on intangibles is not included as investment in GDP and the flow of services from intangible capital is not included as an input. This will affect the measurement of multifactor productivity (MFP) and can affect the pattern of growth.
The rationale for treating intangibles as capital, put forward by Corrado, Hulten and Sichel (2006), is that any use of resources that reduces current consumption in order to increase it in the future qualifies as an investment. While computer software is now treated as capital in the national accounts of many countries, many other intangibles, including R&D, are currently not.
Recent studies have investigated the puzzle as to why knowledge activities are not as ‘visible’ in the economic statistics as expected. These studies have attributed:
• an important part of the US productivity acceleration since the mid-1990s to growth in intangible assets (Corrado, Hulten and Sichel 2006)
• a lack of productivity uplift in the United Kingdom to mismeasurement (a period of seemingly-low growth was actually a period of more rapid build-up of intangible assets) (Marrano, Haskel and Wallis 2007)
BACKGROUND 3
• a lack of productivity uplift in Japan to the lack of investment in intangibles (Fukao et al. 2007).
1.1 Definition of intangibles
Intangible capital — as well as being known by different names, such as knowledge assets and intellectual capital — is variously defined:
• a nonphysical claim to future benefits Assets are claims to future benefits, such as the rents generated by commercial property, interest payments derived from a bond, and cash flows from a production facility. An intangible asset is a claim to future benefits that does not have a physical or financial (a stock or a bond) embodiment. (Lev 2001, p. 5)
• private expenditure on assets that are not tangible but are necessary to the creation and sale of new or improved products and processes (Nakamura 2001)
• the ‘glue’ that creates value from the usual factor inputs (Cummins 2005)
• all assets that are neither natural or produced — a very broad measure that includes raw labour, human capital, social capital and institutional infrastructure, such as the judicial system (World Bank 2006).
The focus of this paper is narrower than that used by the World Bank, concentrating on intangibles invested in by businesses. Intangibles have been categorised (and quantified) by Corrado, Hulten and Sichel (2006) as:
• computerised information (software and computerised databases)
• innovative property (scientific and non-scientific R&D and design)
• economic competencies (brand equity, firm-specific human capital and organisational capital).
This paper uses this categorisation of intangibles.
1.2 Objectives and scope of the paper
The overall objective of this study is to gain a better understanding of the nature, role and importance of intangible assets in Australia’s productivity performance.
More specifically the objectives are to:
• develop quantitative measures of intangible assets and provide time series estimates of intangible asset investment and stocks
4 INTANGIBLE ASSETS AND AUSTRALIA'S PRODUCTIVITY
• assess the contribution to conventionally-measured MFP growth in Australia
• provide an international perspective on the types and magnitudes of intangible assets in Australia compared with other countries.
Measuring intangibles contributes to:
• a better understanding of the importance of intangibles for Australian productivity growth
• a better understanding of the international differences in the mix of drivers of productivity growth (for example, does Australia have lower R&D but higher organisational capital than other countries?)
• a better understanding of the potential for interactions between intangible and other capital (for example, complementarities between ICT and organisational capital).
This study is a continuation of the Commission’s stream of research that has ‘parcelled out’ elements of MFP growth and also builds on previous Commission research on some aspects of intangible assets, such as R&D.
1.3 The rest of the paper
The remainder of this paper is organised as follows.
• Chapter 2 outlines the methodology for identifying the contribution of intangibles in the measurement of MFP — covering previous studies and the current treatment of intangibles in the Australian national accounts. Appendix B provides details of the model specification.
• Chapter 3 outlines the way in which investment in each of the intangibles has been measured. Appendix A provides details of the data sources and method of construction of these estimates.
• Chapter 4 describes the construction of the capital stocks for each of the intangibles. Appendix A provides details of the assumptions used in their construction.
• Chapter 5 reports the results of explicitly identifying the contribution of intangibles in growth accounting in the Australian context. Related appendixes provide details of the construction of the capital services indexes for intangibles and the steps taken to adjust the growth accounting framework to treat intangibles as capital (appendix C) and the sensitivity testing of results (appendix D).
• Chapter 6 compares the Australian results with those from other country studies.
METHODOLOGY 5
2 Methodology
This chapter outlines the methodology used to estimate the effect on multifactor productivity (MFP) of capitalising intangibles. A brief summary of related studies is provided, followed by the model and the classification of intangibles used in this paper.
2.1 Previous studies
There is an extensive literature on some elements of intangible investment/capital (for example, R&D capital), while other elements (for example, organisational capital) have received less attention.1 This section provides a few examples of recent approaches to measuring intangibles in the economics literature.
Sichel (2008) identifies three broad approaches to measuring intangible capital in general — financial market valuation; other performance measures; and direct expenditure data.
The first approach, financial market valuation, infers the value of intangible capital as the difference between the market value of firms and the value of tangible assets.
• Brynjolfsson, Hitt and Yang used this approach in a number of papers examining the link between intangible investments and investment in computers in the United States (Brynjolfsson and Yang 1999, Brynjolfsson, Hitt and Yang 2000 and 2002). These papers used firm-level data and found that each dollar of installed computer capital in a firm was associated with between five and ten dollars of market value. They interpreted this difference as revealing the existence of a large stock of intangible assets that are complementary with computer investment. They also identified particular organisational practices at the firm level that represent at least part of these intangible assets (related to the types of decision making authority, use of self-managing teams and the breadth of job responsibilities).
• Webster (2000) used a similar approach with Australian data, assuming that any residual market value of the firm (stock market value plus liabilities) not explained by the balance sheet value of tangible assets must be due to intangible
1 A review of this literature is beyond the scope of this paper.
6 INTANGIBLE ASSETS AND AUSTRALIA'S PRODUCTIVITY
assets. The results implied that the ratio of intangible to all enterprise capital rose by 1.25 per cent a year over the 50 years to 1998.
• World Bank (2006) measured intangible capital at the country rather than firm level. The value of intangible capital was derived as the residual after deducting natural capital and produced capital from total wealth (measured as the net present value of future sustainable consumption). For Australia this measure was US$288 686 of intangible capital per person or around US$5600 billion in total in 2000.
The second approach uses other performance measures, such as productivity or earnings, to estimate the value of intangible capital.
• McGrattan and Prescott (2005) inferred the value of intangible capital from corporate profits, the returns to tangible assets, and the assumption of equal after-tax returns to tangible and intangible assets. They estimated the value of intangible capital at 31 to 76 per cent of US GDP.
• Cummins (2005) defined intangible capital in terms of adjustment costs and estimated these costs econometrically from US firm-level panel data. His estimates were based on creating a proxy for the intrinsic value of the firm from discounted value of expected profits from analysts’ forecasts (which he suggested reflect the analysts’ valuation of intangibles) and estimating the return on each type of capital (tangible and intangible). He found no appreciable intangibles associated with R&D and advertising but sizable intangibles (organisational capital) created by IT.
• Webster (2000) measured growth in the rate of intangible investment using the proportion of the labour force in jobs that produce intangible capital. For Australia, growth in the ratio of intangible investment to all production was estimated to be around 2.8 per cent per year for the 25 years to 1996.
• Lev and Radhakrishnan (2005) developed a firm-specific measure of organisational capital, modelling the effect on sales of organisational capital (proxied by reported ‘sales, general and administrative expenses’, as this includes expenditures that generate organisational capital). They estimated the marginal productivity of organisational capital to be between 0.4 and 0.6, and mean organisational capital of 4 per cent of average sales of their sample of US firms.
It has been suggested that the first two approaches may be subject to considerable measurement error — for example, stock market values may reflect a mismeasurement to the extent that asset prices depart from their intrinsic values and analysts’ measures of earnings can be subject to mistakes and biases (Cummins 2005).
METHODOLOGY 7
The third approach uses expenditure data to develop more direct measures of intangible capital. This approach is not without measurement error and data limitations — including whether the list of measures of intangibles is comprehensive and able to capture changes in the nature of intangibles over time.
• Nakamura (1999, 2001) was the first to employ this approach. He measured gross investment in intangible assets using a range of measures including R&D expenditure, software, advertising and marketing expenditure, and wages and salaries of managers and creative professionals. He estimated that in 2000 US investment in intangibles was US$1 trillion (roughly equal to that in non-residential tangible assets), with an intangible capital stock of at least US$5 trillion.
• Corrado, Hulten and Sichel (CHS) (2005) expanded Nakamura’s work to develop expenditure-based measures of a larger range of intangibles for the United States (see section 2.3). They estimated investment in intangibles averaged US$1.1 trillion between 1998 and 2000 (1.2 times tangible capital investment) or 12 per cent of GDP.
• CHS (2006) built on this work to develop a methodology for explicitly identifying the contribution of intangibles in the national accounts and growth accounting. They estimated that previously unmeasured intangible capital contributed 0.24 of a percentage point (18 per cent) to conventionally-measured MFP growth in the United States between the mid-1990s and early 2000s. The CHS methodology has been applied in a number of other country studies — with estimates of the contribution of previously unmeasured intangible capital to MFP growth of 14 per cent (United Kingdom in Marrano, Haskel and Wallis 2007), 3 per cent (Finland in Jalava, Aulin-Ahmavaara and Alanen 2007) and 0 per cent (the Netherlands in van Rooijen-Horsten et al. 2008), over a similar period. Other country studies estimated only the contribution of all intangibles to MFP growth — -19 per cent in Japan (Fukao et al. 2008b), 19 per cent in France, 18 per cent in Germany, 9 per cent in Spain and 0 per cent in Italy (Hao, Manole and van Ark 2008).2
• Hulten and Hao (2008) applied a methodology similar to CHS to the financial data of a group of US R&D intensive companies to construct estimates of R&D and organisational capital. They found that this explained a significant portion of the difference between market value and book value.
2 Belhocine (2008) estimated intangible investment for Canada but did not estimate the effect on
MFP growth. The findings of all these studies are discussed in more detail, and compared with Australian estimates derived in this paper, in chapter 6.
8 INTANGIBLE ASSETS AND AUSTRALIA'S PRODUCTIVITY
Schreyer (2007, p. 79) notes that the CHS approach appears more practical for regular measurement of intangibles.
The Corrado-Hulten-Sichel approach does not require explicit econometric techniques and would appear more practical from the perspective of monitoring intangibles as part of a periodic measurement program carried out by a statistical office.
This quote highlights one of the reasons for the considerable ongoing debate about appropriate measures of intangibles in the broader literature — the desirability of a particular measure depends on the perspective taken and the use to which the measure is to be put. The literature on intangibles is from economic, accounting, legal and management perspectives (Bosworth and Webster 2006 provides a useful discussion of intangibles from each of these perspectives). One particular issue of debate is whether the measurement should be expenditure-based or value-based. The characteristics of a measure to be included in the accounts of an individual firm for accounting purposes may be different to those used for internal business management purposes (for example, past objective expenditures may be preferred for accounting purposes rather than estimates of future profits that may be useful for management purposes). An examination and assessment of this debate is beyond the scope of this paper and has been well canvassed elsewhere (see, for example, Lev 2001, Hunter, Webster and Wyatt 2005 and Bosworth and Webster 2006).
It is the CHS (expenditure-based) methodology that has been applied in this paper because it focuses on the examination of the relationship between intangibles and MFP growth and data for international comparisons are available. The CHS approach embeds intangibles in the standard growth accounting framework used to examine productivity growth, and it has already been applied to several OECD countries. This paper is an (exploratory) step in examining intangibles in Australia in an international context, using a method for which there are readily available international estimates on a comparable basis. (No previous applications of this methodology to Australian data have been identified). The remainder of this chapter focuses on the CHS methodology.
Justification for capitalisation of intangibles
The adjusted growth accounting in the expenditure-based approach to intangible measurement is based on capitalising intangibles.3 CHS (2006) suggest that the justification for capitalising intangibles from the standpoint of consumption is that any use of resources that reduces current consumption in order to increase it in the
3 ‘Capitalising’ refers to the treatment of expenditure as investment and the accumulation of a
capital stock according to the perpetual inventory method.
METHODOLOGY 9
future qualifies as an investment. And symmetry of all types of capital should therefore require that intangibles are treated in the same way as tangibles.4
However, from the production side, the principle of symmetrical treatment has been used as an argument against the capitalisation of intangibles. CHS (2006, pp. 10–4) list the characteristics that have been identified as disqualifying intangibles from being treated as capital and go on to counter these arguments. In brief, the characteristics and counter arguments are as follows.5
• Lack of verifiability of the quantity of intangibles not purchased through market transactions.
– However, this does not automatically make intangibles intermediate inputs. Some tangibles lack verifiability (for example, internal construction projects) and some intangibles do not (for example, purchased management consulting services). CHS (2006) suggest that the economic character of the good not the ease of measurement should determine the classification of the good.
• Lack of visibility (or intangibility) after their acquisition, which complicates efforts to track past vintages. The lack of a physical embodiment means that in terms of national income methodology this creates difficulty in measuring depreciation rates and obtaining stocks.
– Again, CHS (2006) suggest this measurement concern is not a valid conceptual reason for not capitalising intangibles.
• Non-rivalness (for example, knowledge being able to be employed by many users simultaneously without decreasing the quantity available to any single user) and lack of appropriability of returns from some intangibles (such as intellectual property).
– CHS (2006, p. 13) argue that the capitalisation issue pivots on whether the provision of the intangible increases future output and consumption, not whether it is partly non-appropriable or non-rival. Therefore these two characteristics do not invalidate the need to capitalise intangibles that have these characteristics (and not all do).
4 The justification for capitalising intangibles is further explored in Webster and Jensen (2006).
Also, van Rooijen-Horsten et al. (2008, pp. 5–9) provides a useful discussion of the extent to which different intangibles satisfy the definition of capital from the perspective of the 1993 System of National Accounts (which sets out the international statistical standards for the measurement of the market economy). These criteria include: having an economic and legal owner; providing possible economic benefits from being held or used; and being used repeatedly or continuously in production processes for more than one year.
5 These characteristics are also of concern to accountants. For a detailed discussion of the recognition and definition rules for intangibles, from an accounting perspective, see Wyatt (2006).
10 INTANGIBLE ASSETS AND AUSTRALIA'S PRODUCTIVITY
2.2 Model
CHS (2006) set out the effect on national account measures of treating intangibles expenditure as investment rather than as an intermediate input (see appendix B for a fuller derivation). Their model, outlined below, is based on three goods — a consumption good with real output volume in period t of Ct with price
tCP ; a tangible investment good It with price
tIP ; and an intangible good Nt with price tNP .
Intangibles treated as intermediate inputs
When intangibles are regarded as being intermediate inputs, labour L and tangible capital K are allocated to the production of all three goods, and N is an input to C and I. The production function and flow account for each of the three sectors is then
Intangible sector t t t t t t tt N N N N t L N K NN = F (L , K , t) P N P L + P K≡ (2.1)
Tangible sector t t t t t t t t t tt I I I I I t L I K I N II = F (L , K , N , t) P I P L + P K + P N≡ (2.2)
Consumption sector t t t t t t t t t tt C C C C C t L C K C N CC = F (L , K , N , t) P C P L + P K + P N≡ (2.3)
where tangible capital accumulates according to the perpetual inventory model t t k t-1K I + (1- )K≡ δ with depreciation rate δk. The production functions in each
equation are linked to the accounting identities by the assumption that each input is paid the value of its marginal product. For intangibles, the left-hand side of equation (2.1) says that the output of intangibles is produced by labour and tangible capital in that sector. The right-hand side says that the value of the intangibles produced is identically equal to the returns to labour and tangible capital used in that sector (assuming factors are paid their marginal products).
The assumption in this model that intangibles t tt I CN (= N N )+ are an intermediate
input means that, as both an output and an intermediate input to the production of the other products, intangibles net out in the aggregate.6 Intangibles therefore do not appear separately in the total output ( tQ′ ) identity
t t t t tQ t C t I t L t K tP Q P C + P I P L + P K′ ′ ≡ ≡ (2.4)
where N I CL L + L + L , ≡ and N I CK K + K + K≡
6 CHS (2006) adopts the convention that intermediates used by the industry that produced them are
netted out of final output. NN is therefore omitted from the production function of the intangible sector.
METHODOLOGY 11
Intangibles treated as capital
If intangibles are treated as capital, a different model applies. The intangible capital stock accumulates according to t t R t-1R N + (1- )R≡ δ , in the same way as tangible capital. The production function and flow account for each of the three sectors become
Intangible sector t t t t t t t t t tt N N N N N t L N K N R NN = F (L , K , R , t) P N P L + P K + P R≡ (2.5)
Tangible sector t t t t t t t t t tt I I I I I t L I K I R II = F (L , K , R , t) P I P L + P K + P R≡ (2.6)
Consumption sector t t t t t t t t t tt C C C C C t L C K C R CC = F (L , K , R , t) P C P L + P K + P R≡ (2.7)
where tRP is the rental price associated with the services of the intangible stock.7
Intangibles now appear on the left-hand side, in the production functions, as a cumulative stock (Rt) not as an intermediate input (Nt) as above. On the right-hand side payments to that stock (
tR tP R ) appear rather than payment for the entire intermediate input (
tN tP N ).
Again, the production functions in each equation are linked to the accounting identities by the assumption of marginal productivity pricing. The total output ( tQ ) identity is expanded to include the value of output of the intangibles on the production side8 and the payments to the stock of intangibles on the income side:
t t t t t t tQ t C t I t N t L t K t R tP Q P C + P I + P N P L + P K + P R≡ ≡ (2.8)
where N ≡ NN + NI + NC and R ≡ RN + RI + RC
Comparing MFP growth under the two approaches
To see the implications for MFP growth, the following growth accounting equations can be derived from the production functions above (see appendix B).
7 The rental price of tangible capital (
tKP ) will also change when intangibles are capitalised because of the change in the equalising rate of return. However, the same notation ‘
tKP ’ is maintained in both cases for simplicity (see appendix B).
8 This is the case whether intangibles are purchased intermediate inputs or own account production. When intangibles are produced on own account, some of the currently measured primary inputs of that industry are being used to create the additional intangible output. The expenditure-based approach values this additional output using the primary input costs (see chapter 3).
12 INTANGIBLE ASSETS AND AUSTRALIA'S PRODUCTIVITY
As an intermediate input, intangibles expenditure is netted out and does not appear
in the MFP growth equation ( x•
denotes the growth rate of x )
L KMFP = Q - s L - s K• • • •
′ ′ ′ ′ (2.9)
where L L L Ks [P L]/[P L + P K]′ ≡ and K K L Ks [P K]/[P L + P K]′ ≡
As capital, intangibles appear as an input in the MFP equation, which becomes
L K RMFP = Q - s L - s K - s R• • • • •
(2.10)
where L L L K Rs [P L]/[P L + P K + P R]≡ , K K L K Rs [P K]/[P L + P K + P R]≡ and R R L K Rs [P R]/[P L + P K + P R]≡ .
Equation (2.10) differs from (2.9) in a number of ways.
• The level of aggregate output increases because it includes the value of output of the intangible goods. But whether output growth rises depends on whether the growth rate of real intangible investment is higher or lower than the growth rate of other output.
• The payment to an additional factor of production, the stock of intangibles, is also included.
• All the factor income shares are different because both output and the total payments to capital differ. Output has increased because of the inclusion of intangible output. And there is a corresponding increase in total factor payments. Income payments to the additional factor, intangible capital stock, increase total payments to capital. The labour income share therefore falls (the level of labour income is unchanged).
• The effect on MFP growth is ambiguous — it may rise or fall depending on the change in output growth relative to the change in input growth. For example, MFP growth will fall if the inclusion of intangibles raises the output growth rate by less than it raises the growth in inputs.
Implementation of the model
The methodology for explicitly identifying the contribution of intangible assets in growth accounting is discussed in detail in the following chapters, together with the results. Implementation requires a number of steps, many of which involve difficult measurement issues.
• Estimate investment in each intangible asset (see chapter 3)
METHODOLOGY 13
– find relevant data sources for expenditure on each intangible – compile a time series of nominal expenditure – determine the share of expenditure that is to be treated as investment – select appropriate deflator and deflate to get a real investment series.
• Build a real capital stock for intangible assets (see chapter 4) – determine the appropriate rate of depreciation for each intangible asset – use the perpetual inventory method to construct a real capital stock from the
real investment series and assumed depreciation rates.
• Adjust output and income to include intangibles as per equation (2.8) (see chapter 5) – recalculate output (measured as market sector gross value added for
Australia) to include intangibles output – adjust the operating surplus for market sector gross value added by adding
intangibles investment.
• Construct a volume index of capital services measures of all capital inputs (tangible and intangible) using capital stocks and rental prices (see chapters 4 and 5) – determine the appropriate rental price parameters for each intangible asset – rental prices for each asset (tangible and intangible) are derived from the
adjusted operating surplus by solving for an equalising rate of return across all assets.
• Undertake growth accounting as per equation (2.10) (see chapter 5) – using the data for intangibles estimated as outlined above, together with the
published and unpublished Australian Bureau of Statistics (ABS) national accounts data used in standard growth accounting.
2.3 Classification of intangibles
As noted in chapter 1, CHS (2006) classify intangibles into three main categories — computerised information, innovative property and economic competencies. This classification is followed in this paper.
The three main categories of intangibles are made up of a variety of specific intangibles (as defined in CHS 2006).
• Computerised information is the knowledge embedded in computer programs and databases.
14 INTANGIBLE ASSETS AND AUSTRALIA'S PRODUCTIVITY
• Innovative property includes the relatively familiar scientific R&D (reflecting scientific knowledge embedded in patents, licences and general know-how) but is much broader — including non-scientific R&D or creative property (innovative and artistic content in commercial copyrights, licences and designs).
• Economic competencies include brand equity (for example, investment to retain or gain market share and investment in brand names), firm-specific human capital (employee skill building) and organisational capital (investments in strategic planning, adaptation and reorganisation).
Of these intangibles, organisational capital is perhaps the least well known. It is variously defined as:
• the body of knowledge in a firm enabling it to combine conventional factors of production in the production process (for example, business processes built around computer systems) (Brynjolfsson and Yang 1999)
• business processes, management structures and organisational systems specifically designed to maximise the value of output given available physical and human capital (quality management systems, supply chain management solutions and innovation processes for product development) (De and Dutta 2007)
• the organisational architecture and the systems for monitoring activity and communicating within the firm (Webster and Jensen 2006)
• the inherent values, relationships and practices of an organisation which contribute to performance (internal and external networks based on partnership and trust) (Healy 2005).
The individual types of intangible assets are discussed further in chapter 3 and appendix A.
Current treatment of intangible assets in Australian National Accounts
Intangibles are not easily measured and work has mainly focused on elements such as human capital and R&D. However, the identification of intangible assets in official national accounts, under the UN System of National Accounts (SNA), has been even more limited.9
9 The treatment of intangibles is, of course, only one of a number of national accounting issues
under consideration. However, a discussion of these broader issues is beyond the scope of this paper.
METHODOLOGY 15
• The decision to capitalise software and databases, mineral exploration and entertainment, literary or artistic originals was taken under SNA93 and has been implemented in many countries.10
• The decision to capitalise R&D was taken in 2007. According to Pilat (2007) there are no current plans for brand equity, firm-specific human capital and organisational capital to be capitalised in the SNA.11
The ABS Australian System of National Accounts12 includes the following intangibles in investment and capital stock series.
• computer software (purchase of software, and software developed in-house if expenditure is large, and large expenditures on the purchase, development or extension of databases)
• entertainment, literary or artistic originals (the originals of films, sound recordings, manuscripts, tapes etc on which drama performances, radio and television programming, musical performances, sporting events, literary and artistic output etc., are recorded or embodied)
• mineral and petroleum exploration (capitalised value of expenditures on exploration for petroleum, natural gas and mineral deposits).
The measurement of these ‘national accounts’ intangibles and the ‘new’ intangibles (the other intangibles in the CHS classification) is discussed in chapter 3.
10 Although this has been done in different ways, particularly for software, which affects
international comparability (Aspden 2007). 11 The OECD plans to release a handbook on measuring intellectual property to provide guidance
on how to introduce various intangible fixed assets into national accounts (Pilat 2007). 12 See ABS (2000, chapter 15) for details. Spectrum licences appear as experimental estimates in
the national balance sheet but not the gross fixed capital formation or capital stock estimates (ABS 2000, para. 15.4).

MEASUREMENT OF INVESTMENT IN INTANGIBLES
17
3 Measurement of investment in intangibles
This chapter outlines the data sources and development of Australian estimates of investment in the range of intangibles described in chapter 2. The estimates are for the market sector of the Australian economy, the sector of the economy for which Australian multifactor productivity (MFP) estimates are available.1
As outlined in chapter 2, a number of steps and measurement challenges are involved in estimating investment in each intangible:
• find relevant data sources for expenditure on each intangible
• compile a time series of nominal expenditure
• determine the share of expenditure that is to be treated as investment
• select appropriate deflator and deflate to get a real investment series.
These steps, and the difficulties encountered in implementing them, are discussed in the following sections and the estimated real investment series presented. (A more detailed description of the method, data limitations and the comparability with other studies is provided in appendix A. The sensitivity of the real investment estimates to some of the assumptions is discussed in appendix D.)
Table 3.1 summarises the data sources and assumptions used to construct the real investment estimates for each of the intangibles. In most cases, the measures follow Corrado, Hulten and Sichel (CHS 2005) in order to facilitate international comparisons, with some improvements as incorporated in Marrano, Haskel and Wallis (MHW 2007). The exceptions are where Australian Bureau of Statistics (ABS) measures are available — computer software, artistic originals and mineral exploration.
1 See table A.1 for a list of the twelve industry Australian and New Zealand Standard Industrial
Classification (ANZSIC) divisions that make up the market sector. The industries excluded are Property & business services, Government administration & defence, Education, Health & community services, and Personal & other services. These industries are excluded because of the difficulties of measuring outputs in some service industries. The sector of the economy for which intangibles and MFP have been estimated varies across countries — this is discussed in chapter 6.
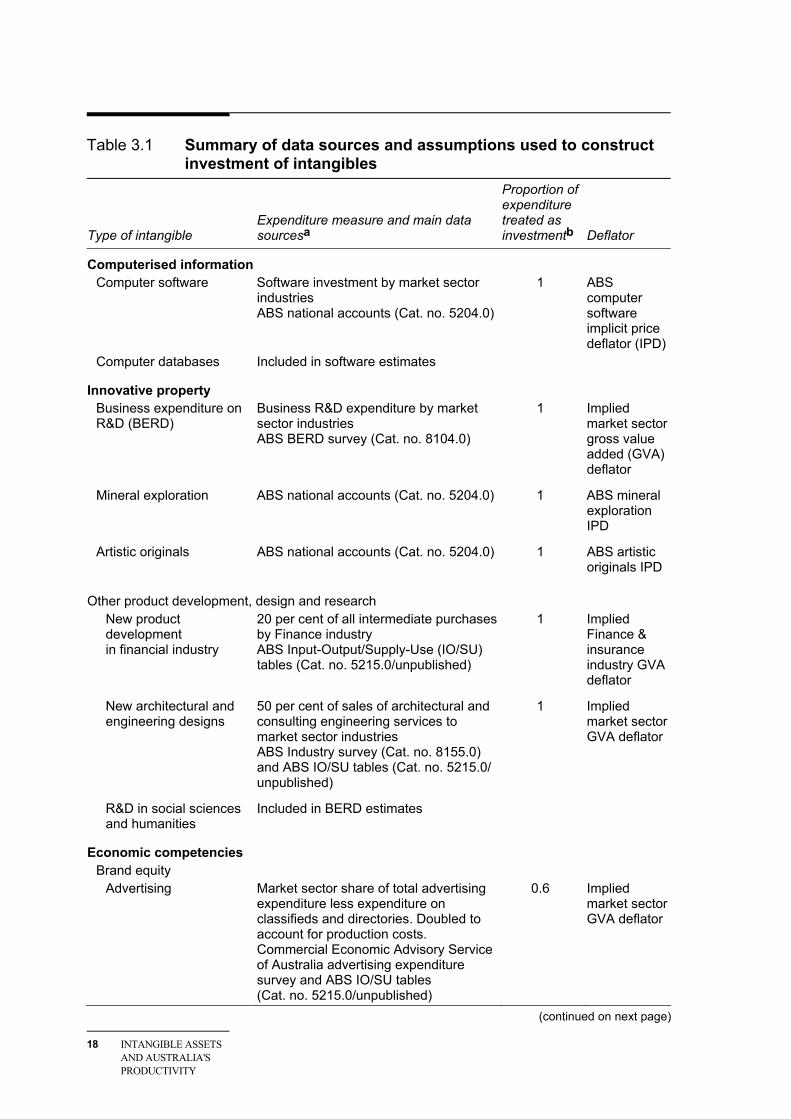
18 INTANGIBLE ASSETS AND AUSTRALIA'S PRODUCTIVITY
Table 3.1 Summary of data sources and assumptions used to construct investment of intangibles
Type of intangible
Expenditure measure and main data sourcesa
Proportion of expenditure treated as investmentb
Deflator
Computerised information Computer software Software investment by market sector
industries ABS national accounts (Cat. no. 5204.0)
1 ABS computer software implicit price deflator (IPD)
Computer databases Included in software estimates
Innovative property Business expenditure on R&D (BERD)
Business R&D expenditure by market sector industries ABS BERD survey (Cat. no. 8104.0)
1 Implied market sector gross value added (GVA) deflator
Mineral exploration ABS national accounts (Cat. no. 5204.0) 1 ABS mineral exploration IPD
Artistic originals ABS national accounts (Cat. no. 5204.0) 1 ABS artistic originals IPD
Other product development, design and research New product development in financial industry
20 per cent of all intermediate purchases by Finance industry ABS Input-Output/Supply-Use (IO/SU) tables (Cat. no. 5215.0/unpublished)
1 Implied Finance & insurance industry GVA deflator
New architectural and engineering designs
50 per cent of sales of architectural and consulting engineering services to market sector industries ABS Industry survey (Cat. no. 8155.0) and ABS IO/SU tables (Cat. no. 5215.0/ unpublished)
1 Implied market sector GVA deflator
R&D in social sciences and humanities
Included in BERD estimates
Economic competencies Brand equity
Advertising Market sector share of total advertising expenditure less expenditure on classifieds and directories. Doubled to account for production costs. Commercial Economic Advisory Service of Australia advertising expenditure survey and ABS IO/SU tables (Cat. no. 5215.0/unpublished)
0.6 Implied market sector GVA deflator
(continued on next page)
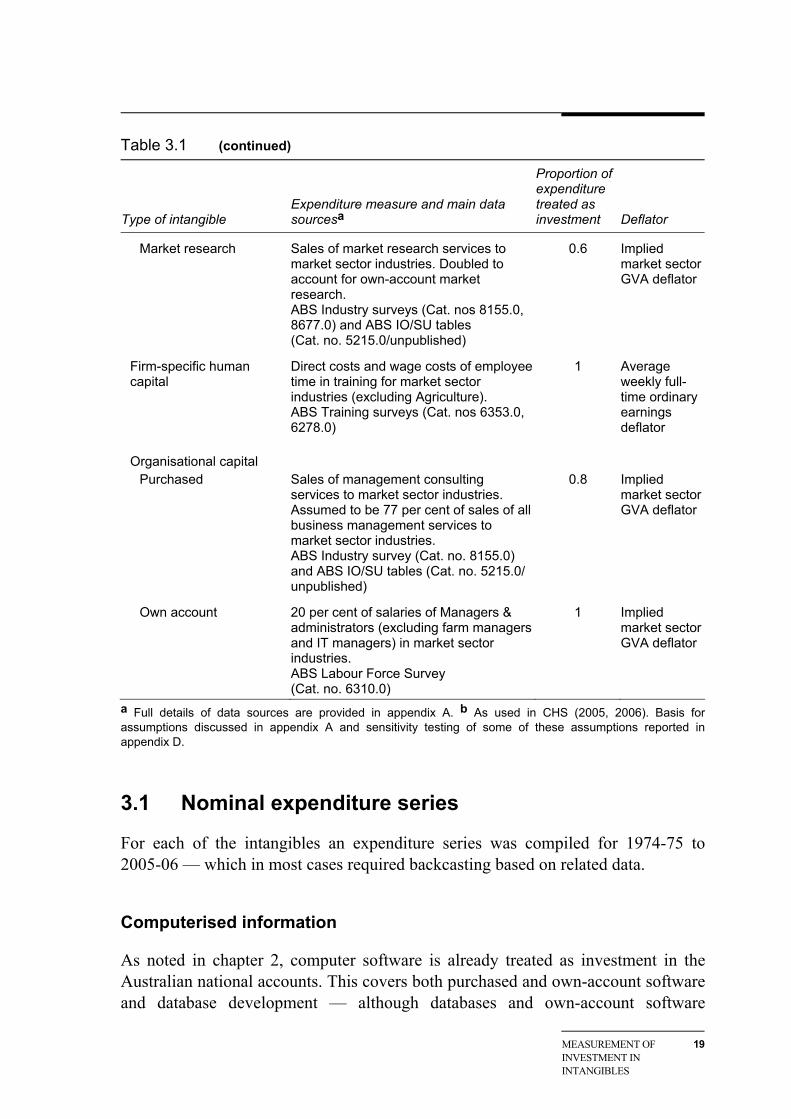
MEASUREMENT OF INVESTMENT IN INTANGIBLES
19
Table 3.1 (continued)
Type of intangible
Expenditure measure and main data sourcesa
Proportion of expenditure treated as investment
Deflator
Market research Sales of market research services to market sector industries. Doubled to account for own-account market research. ABS Industry surveys (Cat. nos 8155.0, 8677.0) and ABS IO/SU tables (Cat. no. 5215.0/unpublished)
0.6 Implied market sector GVA deflator
Firm-specific human capital
Direct costs and wage costs of employee time in training for market sector industries (excluding Agriculture). ABS Training surveys (Cat. nos 6353.0, 6278.0)
1 Average weekly full-time ordinary earnings deflator
Organisational capital Purchased Sales of management consulting
services to market sector industries. Assumed to be 77 per cent of sales of all business management services to market sector industries. ABS Industry survey (Cat. no. 8155.0) and ABS IO/SU tables (Cat. no. 5215.0/ unpublished)
0.8 Implied market sector GVA deflator
Own account 20 per cent of salaries of Managers & administrators (excluding farm managers and IT managers) in market sector industries. ABS Labour Force Survey (Cat. no. 6310.0)
1 Implied market sector GVA deflator
a Full details of data sources are provided in appendix A. b As used in CHS (2005, 2006). Basis for assumptions discussed in appendix A and sensitivity testing of some of these assumptions reported in appendix D.
3.1 Nominal expenditure series
For each of the intangibles an expenditure series was compiled for 1974-75 to 2005-06 — which in most cases required backcasting based on related data.
Computerised information
As noted in chapter 2, computer software is already treated as investment in the Australian national accounts. This covers both purchased and own-account software and database development — although databases and own-account software
20 INTANGIBLE ASSETS AND AUSTRALIA'S PRODUCTIVITY
development are only included if the expenditure is ‘large’ (ABS 2000, p. 452). The ABS estimates for this intangible asset are used in this paper — time series for gross fixed capital formation and capital stock are available for the full period 1974-75 to 2005-06.
This is broadly similar to the combination of the measures of computer software and computerised databases used in CHS (2005), although the ABS measure may understate this intangible through the exclusion of some database and own-account software development (see appendix A).
Innovative property
CHS include six types of innovative property — scientific R&D, mineral exploration, copyright and licence costs, new product development costs in the financial industry, new architectural and engineering designs, and R&D in social sciences and humanities. Differences in the collection and capitalisation of some of these expenditures by the ABS means there are some differences in the categorisation of these intangibles in this paper.
Business expenditure on R&D
Australian business expenditure on R&D (BERD) is available from ABS Research and Experimental Development, Businesses (Cat. no. 8104.0). A consistent series for the market sector (excluding Agriculture, forestry & fishing2) was compiled for 1968-69 to 2002-03 by Shanks and Zheng (2006). For this paper it was updated and extended to 2005-06 using revised and updated data from the ABS Cat. no. 8104.0.3
R&D activity is defined by the ABS as Creative work undertaken on a systematic basis, in order to increase the stock of knowledge, including knowledge of man, culture and society, and the use of this stock of knowledge to devise new applications. (ABS Cat. no. 8104.0, 2005-06, p. 30)
Unlike the US survey of industrial R&D, the ABS survey of BERD includes R&D in fields classed as social sciences and humanities (identified as a separate category of intangible in CHS 2005). A separate consistent time series for this subset of R&D was not readily available for Australia. Therefore, in this paper, the intangible
2 The ABS did not directly survey farms and other businesses in this industry until 2005-06.
Agriculture has been excluded from the 2005-06 data to maintain comparability over time. 3 The series used is total expenditure on R&D, not just current expenditure. This means that there
is some double counting of capital expenditure, as was also the case in the UK study. However, capital expenditure was only 6 per cent of total Australian BERD in 2005-06.
MEASUREMENT OF INVESTMENT IN INTANGIBLES
21
category ‘business expenditure on R&D’ includes ‘R&D in social sciences and humanities’ as well as scientific R&D undertaken by market sector industries.
It should also be noted that the ABS BERD data include some R&D related to financial services and architectural/engineering services. It appears that the scope of these types of R&D as discussed in CHS (2005) is broader than those activities that may be covered by the BERD survey (although few details are given in CHS 2005). For comparability, the CHS method was used to estimate these separate types of R&D and the ABS-based BERD estimates were reduced to avoid double counting, where possible.4 The extent of any remaining duplication is discussed below.
Mineral exploration
Mineral exploration (the use of existing exploration techniques) is already capitalised in the Australian national accounts. The ABS estimates for this intangible asset are used in this paper — time series for gross fixed capital formation and capital stock are available for the full period 1974-75 to 2005-06.
This measure does not include mining R&D (the development of new exploration techniques and associated research) and therefore differs from that used in CHS (2005). In this paper, mining R&D is included in BERD because a separate consistent time series for mining R&D was not readily available.
Artistic originals
Artistic originals are already capitalised in the Australian national accounts. The ABS defines entertainment, literary or artistic originals as:
… originals of films, sound recordings, manuscripts, tapes, models, etc., on which drama performances, radio and television programming, musical performances, sporting events, literary and artistic output, etc., are recorded or embodied. (ABS 2000, p. 454)
This appears to be similar coverage to copyright and licence costs in CHS (2005). The ABS estimates are based on the present value of expected future income flows generated from the originals. The ABS uses a range of valuation techniques including the market transactions approach (for example, payment of advances to composers and authors) and the production cost approach (for example, the production costs of recorded music).5
4 An adjustment was made for financial services R&D but no adjustment was possible for
architectural and engineering designs (see appendix A for details). 5 See ABS (2000, p. 38) for further details.
22 INTANGIBLE ASSETS AND AUSTRALIA'S PRODUCTIVITY
The ABS estimates for this intangible asset are used in this paper — time series for gross fixed capital formation and capital stock are available for the full period 1974-75 to 2005-06.
Other product development, design and research
CHS include ‘non-scientific’ R&D in the areas of new product development in the financial industry, new architectural and engineering designs and social sciences and humanities in this category of intangibles. As already discussed, R&D in social sciences is included in BERD in this paper.
New product development in the financial industry
CHS use a crude proxy for spending on new product development by the financial services industry of 20 per cent of total intermediate purchases by that industry.
The financial services industries of interest in the Australian context are a subset of ANZSIC Division K Finance & insurance — that is, Finance (ANZSIC 73) and a share of Services to finance and insurance (ANZSIC 75).
For this paper, a series for 20 per cent of total intermediate purchases6 by the financial services industries has been constructed from ABS data from input-output (IO) and supply-use (SU) tables. The share of Services to finance, investment and insurance is based on the output share of Finance in the combined output of Finance & insurance. This series covers the full period 1974-75 to 2005-06 — IO/SU data were not available for every year and missing years were interpolated/extrapolated (see appendix A for details).
This approach is taken for comparability with overseas studies, but the alternative of using only financial R&D expenditure as collected in the ABS BERD survey is examined as part of sensitivity testing (see appendix D).
6 No attempt has been made to specifically deduct purchases of intermediate inputs counted
elsewhere in intangibles (particularly computer software). In line with CHS (2005), the percentage of intermediate purchases assumed to be product development (20 per cent) is conservative to account for this overlap.
MEASUREMENT OF INVESTMENT IN INTANGIBLES
23
New architectural and engineering designs
CHS estimate this intangible as half of the revenue of the architectural and engineering industries.
A time series for 50 per cent of the revenue of architectural and engineering industries was constructed for this paper using a number of data sources. The relevant industries for new designs are ANZSIC 7821 Architectural services and ANZSIC 7823 Consulting engineering. Data on revenue for ANZSIC industry classes are available from Australian Industry (ABS Cat. no. 8155.0) for the period 1998-99 to 2004-05.7
To backcast the aggregate series of architectural and engineering services to 1974-75, the growth rates for a related group of services from the product details of the ABS Australian National Accounts: Input-Output Tables (Cat. no. 5215.0) and unpublished SU tables were used — Architectural services, surveying and consulting engineering and Architectural services, surveying, consulting engineering and quantity surveying, respectively.
The resulting series for sales income for architectural and engineering design services was for the total economy. It was necessary to scale it down to the share relevant to the market sector. This was done using the market sector intermediate usage share of Australian production of Architectural, surveying, consulting engineering and quantity surveying services from the SU tables from 1994-95 to 2002-03. This share was backcast to 1974-75 (and forecast to 2005-06) using growth in the market sector share of gross value added.
On the issue of possible double counting with ABS BERD estimates, engineering and architectural R&D are amongst the fields covered by the ABS BERD survey. There are few details given in CHS (2005) as to the nature of the new architectural and engineering designs that make up this intangible asset in their study. However, it appears clear that the activities the authors have in mind fall outside what would ‘normally’ be considered architectural and engineering R&D — an example may be new designs using existing technology and methods — since their data source for ‘scientific R&D’ already includes engineering R&D in its scope.8 It is therefore assumed there is no issue of double counting between a CHS-type measure for Australia and activities covered above under the ABS BERD survey.
Some architectural and engineering services expenditure is already capitalised by the ABS — appearing as part of the tangible capital stock. However, these data are 7 The 2005-06 estimate was made assuming that growth rate for sales was the same as in 2004-05. 8 A similar conclusion was drawn in the UK study (see MH 2006, p. 4 for further discussion).
24 INTANGIBLE ASSETS AND AUSTRALIA'S PRODUCTIVITY
not available so it is not possible to compare this with the CHS-type estimate for Australia or make any adjustment for double counting (see appendix A for further discussion). The alternative of assuming that all relevant expenditure is already capitalised (that is, no additional architectural/engineering services expenditure is treated as investment) is examined as part of sensitivity testing (see appendix D).
Economic competencies
Economic competencies are defined by CHS (2005, p. 28) as the value of brand names and other knowledge-embedded firm-specific human and structural resources.
Brand equity
Spending on brand development is proxied by spending on advertising and market research. CHS suggest this includes the costs of launching new products, developing customer lists and maintaining brand equity and note that
Although advertising and market research are generally aimed at building a firm’s market share at the expense of its competitors, such spending is necessary for developing new brands and maintaining the value of existing brands. (2005, p. 28)
Various rationales have been put forward for capitalising advertising and marketing expenditure — it may result in a positive image of the firm in the market and help to secure future orders (De and Dutta 2007); and it may establish a reputation for quality or educate consumers about the existence of new goods (Nakamura 1999, p. 6). A reputation for reliability may persuade shoppers to try a new item for the first time.
Advertising
CHS estimate this intangible using expenditure data published by a US advertising association.
Australian advertising expenditure for 1975 to 2006 is available from an annual survey of the industry conducted by Commercial Economic Advisory Service of Australia (CEASA 2003, 2006, 2007). This is a similar type of data source to that used in CHS (2005), except that it includes only media costs for time and space and excludes production costs. Based on data for the United States and United Kingdom about the proportion of production costs in total advertising costs (see appendix A), the CEASA series has been doubled to account for production costs.
MEASUREMENT OF INVESTMENT IN INTANGIBLES
25
These estimates for the total Australian economy have been scaled down to market sector estimates using market sector intermediate usage as a share of Australian production of advertising services from the ABS SU tables for 1994-95 to 2003-04. This share was backcast to 1974-75 (and forecast to 2005-06) using growth in the market sector share of gross value added.
Market research
CHS estimate this intangible as twice the revenue of the market and consumer research industry. Industry revenue is doubled to allow for firm’s own account spending on market research.
A time series of twice the revenue9 of the market research industry was constructed for this paper using a number of data sources. The relevant industry is ANZSIC 7853 Market research services. Data on revenue for ANZSIC industry classes are available from Australian Industry (ABS Cat. no. 8155.0) for 1998-99 to 2004-05.10 An irregular survey, Selected Business Services, 1992-93 (ABS Cat. no. 8677.0) provided similar data for 1992-93. The estimates for the missing years were interpolated by simple averages.
This series of market research services was backcast from 1992-93 to 1974-75 using the growth in Market and business consultancy services from the product details of the ABS IO tables (Cat. no. 5215.0).
The resulting series was for the total economy. It was necessary to scale it down to the share relevant to market sector intermediate usage using data on the closest available group of services (Other business services) from SU tables for 1994-95 to 2003-04. This share was backcast to 1974-75 (and forecast to 2005-06) using growth in the market sector share of gross value added.
Firm-specific human capital
CHS (2005, p. 29) suggest that spending on firm-specific human capital can be measured by the costs of employer-provided workforce training. Spending on workforce training consists of two types of expenses:
• direct firm expenses (outlays on inhouse and external training courses)
• wage and salary costs of employee time spent in informal and formal training.
9 The CHS approach was followed for comparability purposes and in the absence of readily
available alternative estimates of inhouse market research. 10 The 2005-06 estimate was made assuming that the growth rate for sales was the same as in
2004-05.
26 INTANGIBLE ASSETS AND AUSTRALIA'S PRODUCTIVITY
There are two aspects of the scope of the measure of firm-specific human capital used in this paper that should be noted.
• All employer-provided structured training is included.
– There is a question as to how much of this training is firm-specific and not transferable.11 Richardson (2004, p. 29) notes that it is standard to argue that in a competitive labour market there will be no benefit to firms from providing general training so firms will only provide firm-specific training.12 On that basis it could be assumed that all employer-provided training is firm specific. However, in practice most training is neither wholly general nor firm specific. It has not been possible to examine this issue in detail in this paper or adjust the measure of firm-specific human capital.
• This is not a measure of total human capital.
– It does not include education and unstructured on-the-job training. However, to some extent these broader elements of human capital are incorporated into the growth accounting exercise in chapters 5 and 6 through use of the ABS experimental quality-adjusted labour input series.13
– Related to this is an issue of double counting. Fukao et al. (2008a) note If workers gain non-firm-specific skills from [employer provided] off-the-job training, such accumulation of human capital will be reflected in their wage rates. Since in standard growth accounting wage increases by age are already taken into account as improvements in labor quality, there is a risk of double counting [in capitalising off-the-job training costs incurred by employers]
Again, it has not been possible to make any adjustment for this potential double counting.
It has been acknowledged by a number of researchers in this area that employer-provided training in Australia is poorly measured (see, for example, Cully 2005 and Richardson 2004), particularly prior to 1990 (Smith 1999). No single data source provides a time series of Australian employer-provided training expenditure. To construct a series, several different sources were used, together with a number of
11 ABS Cat. no. 6278.0 (2005, p. 48) defines skills gained through the completion of a training
course as transferable if they could be used in a similar job with another employer. It estimated that 90 per cent of reported work-related training courses completed by employees were considered by the employees as providing skills that were transferable. However, it was also the case that employees considered that 93 per cent of this training had not helped them gain a pay rise or promotion.
12 For a discussion of the economics of general versus firm-specific training see Borland (1990). 13 For ABS estimates of the human capital stock based on education and work experience see
Wei (2008).
MEASUREMENT OF INVESTMENT IN INTANGIBLES
27
assumptions. The resulting series is therefore only broadly indicative and trends in it should be interpreted with caution.
The ABS Employer Training Expenditure, Australia (Cat. no. 6353.0), an employer survey, measured both direct costs and wage and salary costs for the total economy (excluding agriculture) for 1989, 1990, 1993 and 1996. The ABS also estimated this measure for 2001-02 based on data from Employer Training Expenditure and Practices (Cat. no. 6362.0) and Education and Training Experience (Cat. no. 6278.0) (NCETS 2004). Specifically the measure includes
The sum of employers’ expenditure for employees gross wages and salaries for time receiving and providing structured training, fees paid to consultants and institutions and other expenditure on structured training. (ABS Cat. no. 6353.0, 1996, p. 46)
where structured training is defined as all training activities which have a predetermined plan and format designed to develop employment-related skills and competencies. It consists of periods of instruction, or a combination of instruction and monitored practical work. (ABS Cat. no. 6353.0, 1996, p. 45)
For 1993-94 and 1996-97 the expenditure data were available by industry, enabling the construction of a market sector (excluding Agriculture) estimate. For 1989-90 and 1990-91, the market sector estimate was derived by using growth in expenditure for the whole economy. For 2001-02 the market sector estimate was derived by using total economy growth in expenditure between 1996-97 and 2001-02, adjusted for the fall in market sector share of total hours of training from ABS Education and Training Experience, Australia (Cat. no. 6278.0).
To backcast the expenditure series to 1974-75 it was necessary to use growth in a related series. No ideal series was available. However, it was possible to construct an approximate series for total training hours for the market sector (excluding Agriculture).14 This was combined with an approximate series for real expenditure per training hour15 to derive total training expenditure for the market sector.
14 This was based on data for training hours per employee from ABS Cat. nos 6353.0 and 6278.0
and the number of employees from the Labour Force Survey (see appendix A). A constant number of training hours per employee was assumed from 1974-75 to 1989-90. This is a very crude assumption. However, this assumption is made for transparency in the absence of sufficient data to fit a trendline. (During the period for which there are data available there are breaks in series created by the introduction of the Training Guarantee in 1990-91, its suspension in 1994-95 and abolition in 1996-97.)
15 Expenditure per training hour was available for 1989-90, 1990-91, 1993-94, 1996-97 from ABS Cat. no. 6353.0 and derived for 2001-02 from NCETS (2004) and ABS Cat. no. 6278.0. These data were deflated by growth in average weekly earnings to obtain a real cost series. In the absence of any specific information on changes in real costs, real cost per hour was interpolated
28 INTANGIBLE ASSETS AND AUSTRALIA'S PRODUCTIVITY
No adjustment was made to account for training in the agriculture industry, which would lead to an understatement of expenditure by the market sector on firm-specific human capital. However, in general, the firm-specific human capital series should be viewed as being affected by a number of measurement errors that could lead to understatement or overstatement of the true level. (For example, the use of constant training hours per employee at either end of the series may have biased the estimates). Additional data and/or more sophisticated estimation techniques would be required to make more definitive statements about the size and direction of change in firm-specific human capital investment. This exercise was beyond the scope of this paper.
Organisational capital
This intangible, along with firm-specific human capital, is particularly difficult to estimate. However, CHS note that the importance of organisational capital requires its treatment as an investment for consistency with other assets. They also cite micro data evidence that firm level differences in organisational practices are strongly related to productivity (CHS 2006, pp. 18–9).
Marrano and Haskel (MH 2006, p. 11) liken the measurement problem of establishing a volume of organisational capital from observed expenditure to that of establishing the volume of R&D knowledge capital from observed expenditure on R&D. An additional problem is that expenditure on organisational capital can be unobserved.
CHS (2005, p. 29) suggest that investment in organisational capital is made up of two components
• purchased — such as management consultant fees
• own account — measured in terms of the value of executive time spent on improving the effectiveness of business organisations (that is, time spent on developing business models and corporate cultures).
CHS note that there is some overlap between these measures of organisational capital and some other intangibles
Consulting expenditure and the estimated value of executive time conceptually overlap by a small amount (the value of executive time in the management consulting industry). In addition, some portion of management time arguably overlaps with R&D, so that, for some industries, the line between industry-specific process innovation and organizational change more generally may not be easily drawn. But, whatever uncertainty the amount induces in our estimates, it is dwarfed by the use of an arbitrary
between the actual data points and an exponential trend was fitted to estimate growth before 1989-90 and from 2001-02 (see appendix A).
MEASUREMENT OF INVESTMENT IN INTANGIBLES
29
fraction for the amount of executive time devoted to organizational change and development. (2005, pp. 29–30)
MH (2006, p. 12) also suggest some overlap with IT consulting and software investment. They also note that some expenditure on management consultants is to deal with short term problems (for example, closing down businesses and discharging employees).
Purchased
CHS estimate this intangible from the revenue of the management consulting industry. Data for the revenue of the Australian management consulting industry is very limited. A time series was constructed for this paper from the few available data sources for the closest relevant industry, ANZSIC 7855 Business management services. This is broader than just management consultancy — for example, it includes public relations consultancies (which are excluded from the UK and US studies). Therefore only 77 per cent of this industry revenue was included, as a crude adjustment for some of this difference in scope.16
Data on revenue for ANZSIC industry classes are available from Australian Industry (ABS Cat. no. 8155.0) for 1998-99 to 2004-05.17 The series for business management services was backcast from 1998-99 to 1974-75 using the growth in Market and business consultancy services from the product details of the ABS IO tables (Cat. no. 5215.0).
The resulting series for sales income for business management services was for the total economy. It was necessary to scale it down to the share relevant to market sector intermediate usage using data on the closest available group of services (Other business services) from SU tables from 1994-95 to 2003-04. This share was backcast to 1974-75 (and forecast to 2005-06) using growth in the market sector share of gross value added.
16 There is very limited information about the size of the public relations segment of this industry
in 1992-93 and it is assumed that the public relation share is constant over the full time series. It has not been possible to adjust for other differences in scope, such as the inclusion in Australian estimates of environmental consultancies, and this may lead to an overstatement of organisational capital compared with the studies of other countries (see appendix A for further details). This is examined as part of sensitivity testing in appendix D.
17 The 2005-06 estimate was made assuming that the growth rate for sales was the same as in 2004-05.
30 INTANGIBLE ASSETS AND AUSTRALIA'S PRODUCTIVITY
Own account
CHS estimate the own-account component of organisational capital as 20 per cent of the value of executive time using BLS data on employment and wages in executive occupations. MH (2006, p. 13) use a similar approach but excludes ICT managers (to avoid double counting with capitalised software) and the self-employed (who they indicate do not build organisational capital in the same way as in other industries). The definition of managers appears to be relatively broad (not just, for example, CEOs).
The own account portion of organisational capital for Australia was estimated from average earnings of managers and the number of managers in the market sector. The specific occupation group used is Managers & administrators18 excluding, where possible, both IT managers and Farmers & farm managers. The exclusion of IT managers is based on the reasoning used by MH (2006) — avoiding double counting with IT capital. Farmers & farm managers are excluded because this subgroup is considerably different from other managers and would not be expected to build organisational capital in the same way. The self-employed (owner-managers of unincorporated enterprises) are also excluded, as in MH (2006), because the relevant ABS survey did not cover this group.
Data on average weekly earnings and number of Managers & administrators were available from the Employee Earnings, Benefits and Trade Union Membership (EEBTUM) survey (ABS Cat. no. 6310.0). The average earnings are calculated excluding those employees who did not draw a wage or salary, that is, people working in their own incorporated enterprises.
Annual unpublished data on earnings and employee numbers from the EEBTUM survey are available for Managers & administrators, excluding IT managers and farmers, in the market sector from August 1997 to August 2006. The number of employees obtained includes persons who receive a wage or salary or persons who operate their own incorporated enterprises. Using this number of employees to obtain the wages bill implicitly assumes the value for own account organisational capital investment for owner-managers is equal to the average earnings of Managers & administrators drawing a wage or salary.
Prior to 1997 data are only available from the annual publication of the EEBTUM survey. This included the number of Managers & administrators for the total economy back to 1986 and average weekly earnings back to 1988. Prior to this, data
18 Australian Standard Classification of Occupations, Second edition, 1997 (ABS Cat. no. 1222.0)
has been used or the closest available occupation from earlier occupational classifications (see appendix A).
MEASUREMENT OF INVESTMENT IN INTANGIBLES
31
for full-time Managers & administrators in the total economy were available back to August 1975. Growth in average weekly earnings for these groups of Managers & administrators were used to backcast the market sector series from 1997 to 1975. For employee numbers the series for Managers & administrators excluding IT managers and farmers was backcast from 1997 to 1975 using growth in a market sector series constructed from Labour Force Survey data for employed Managers and administrators by industry.
The total wages bill was calculated as the number of employees multiplied by average weekly earnings multiplied by 52 weeks. As noted above, this number of employees excludes owner-managers of unincorporated enterprises. This may lead to an underestimate of own-account organisational capital if this group does invest in this intangible in the same way as other Managers & administrators.
Twenty per cent of this wages bill was counted as expenditure on own account organisational capital. CHS (2005, p. 30) note that the assumption that managers spend 20 per cent of their time investing in organisational development is arbitrary. However, for the purposes of comparability, and in the absence of alternative estimates of time spent, the same percentage is used in this paper.
3.2 How much of expenditure is investment
Column 3 of table 3.1 shows the proportion of current expenditure that is assumed to be investment, in line with CHS (2005). This approach is followed for international comparability and in the absence of estimates of the proportion of expenditure that should be treated as investment.19 For most intangibles 100 per cent of the expenditure estimate is included. There are two exceptions — brand equity and purchased organisational capital.
Brand equity CHS (2005) exclude certain categories of advertising that are not considered to be reputation building and then assume 60 per cent of the remaining advertising expenditure and 60 per cent of market research expenditure is investment. This approach is followed in this paper.
There are two issues — does this expenditure build an asset and how long lived is it?
19 Sensitivity testing of the growth accounting results to investment size is reported in appendix D.
32 INTANGIBLE ASSETS AND AUSTRALIA'S PRODUCTIVITY
• As already noted, the extent to which expenditure on advertising is building an asset rather than being consumed is a difficult question, which is not examined in detail in this paper. However, some types of ads are excluded altogether from other studies because they are not considered to be asset building at all.
– The US study includes only national ads — the ‘local’ ads are considered to be promoting sales at specific stores rather than being aimed at selling specific products (CHS 2005, p. 33).
– The UK study excludes classified ads — small personal ads by individuals or recruiting advertisements for vacancies to be filled in a relatively short time period (MH 2006, p. 8).
– It was possible to exclude ‘Classifieds and directories’ from the Australian advertising expenditure series — a similar adjustment to the UK study.
• Advertising or market research expenditures with a service life of less than one year are excluded as they are an expense not an investment.
– CHS (2005, p. 32) note that, while the literature finds that the effects of advertising are generally short-lived, more than half has a service life of at least one year. From this they assume that 60 per cent of advertising and market research expenditures should be counted as investment.
Purchased organisational capital CHS assume 80 per cent of spending on management consulting services relate to building organisational capital. The remainder is assumed to be related to be day-to-day advising on, for example, short-term personnel problems, which is assumed not to build organisational capital. This approach is followed in this paper, given the very limited available data about the Australian management consulting industry.
3.3 Deflators
Column 4 of table 3.1 shows the deflators used to convert nominal values for investment in intangibles into their real counterparts. As noted by CHS (2005, p. 36), this conversion is difficult because intangibles are often owner constructed or difficult to measure services with no available or reliable price deflator. In CHS (2006), the authors settle on the use of a pure output deflator (non-farm business output) as a proxy for the price of intangibles, while noting that this proxy is a ‘placeholder’ until further research develops deflators for specific intangibles.20
20 For a discussion of the relative merits of an output versus a wage deflator for this purpose see
CHS (2006, pp. 14–5).
MEASUREMENT OF INVESTMENT IN INTANGIBLES
33
The equivalent deflator in the Australian context is the implied market sector gross value added (GVA) deflator, derived from the Australian national accounts.21 This deflator is used for all categories of intangible except for:
• computer software, mineral exploration and artistic originals — ABS real gross fixed capital formation series are available for these intangible assets (based on asset-specific implicit price deflators)22
• financial product development — an implied Finance & insurance GVA deflator (derived from the Australian national accounts) was used. As discussed by MHW (2007, p. 15), the most relevant output deflator is the one for the output that presumably embodies the knowledge that the R&D is generating
• firm-specific human capital — in order to compile this series a wage deflator (derived from average weekly ordinary time earnings for full-time adults) was used to estimate real cost per hour of training. As this intangible mainly comprises wage costs the resulting estimates of firm-specific human capital in real terms were used as the real investment series.
3.4 Real investment series
Current intangible investment
Applying the measurement assumptions discussed above, it is estimated that market sector investment in intangibles was $57 billion in 2005-06 (table 3.2). This was almost half the size of market sector investment in tangibles and nearly 10 per cent of adjusted market sector gross value added (including the investment in the intangibles).23 Around 80 per cent of this investment was in the newer intangibles (that is, those not already treated as investment in the national accounts).
21 Australian MFP is measured for the market sector rather than the non-farm business sector used
in the United States. The implied market sector GVA deflator is derived from the current price and chain volume series in the Australian national accounts.
22 See ABS (Australian System of National Accounts, Cat. no. 5204.0) for further details. MHW (2007) similarly use the software deflator from the UK Office of National Statistics.
23 This is equivalent to about 6 per cent of conventionally-measured GDP (for the total economy not just the market sector), which includes software, mineral exploration and artistic originals but not the new intangibles.
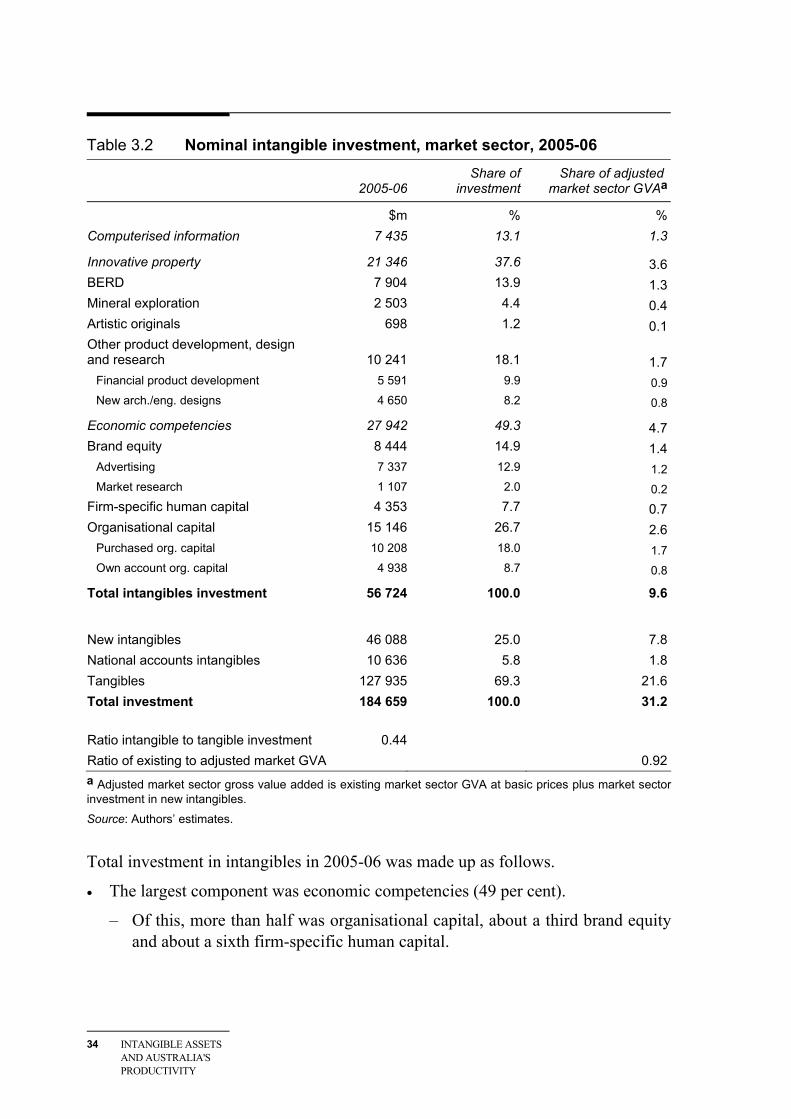
34 INTANGIBLE ASSETS AND AUSTRALIA'S PRODUCTIVITY
Table 3.2 Nominal intangible investment, market sector, 2005-06 2005-06
Share of investment
Share of adjusted market sector GVAa
$m % %Computerised information 7 435 13.1 1.3
Innovative property 21 346 37.6 3.6BERD 7 904 13.9 1.3Mineral exploration 2 503 4.4 0.4Artistic originals 698 1.2 0.1Other product development, design and research 10 241 18.1 1.7
Financial product development 5 591 9.9 0.9New arch./eng. designs 4 650 8.2 0.8
Economic competencies 27 942 49.3 4.7Brand equity 8 444 14.9 1.4
Advertising 7 337 12.9 1.2Market research 1 107 2.0 0.2
Firm-specific human capital 4 353 7.7 0.7Organisational capital 15 146 26.7 2.6
Purchased org. capital 10 208 18.0 1.7Own account org. capital 4 938 8.7 0.8
Total intangibles investment 56 724 100.0 9.6
New intangibles 46 088 25.0 7.8National accounts intangibles 10 636 5.8 1.8Tangibles 127 935 69.3 21.6Total investment 184 659 100.0 31.2 Ratio intangible to tangible investment 0.44Ratio of existing to adjusted market GVA 0.92a Adjusted market sector gross value added is existing market sector GVA at basic prices plus market sector investment in new intangibles.
Source: Authors’ estimates.
Total investment in intangibles in 2005-06 was made up as follows.
• The largest component was economic competencies (49 per cent).
– Of this, more than half was organisational capital, about a third brand equity and about a sixth firm-specific human capital.
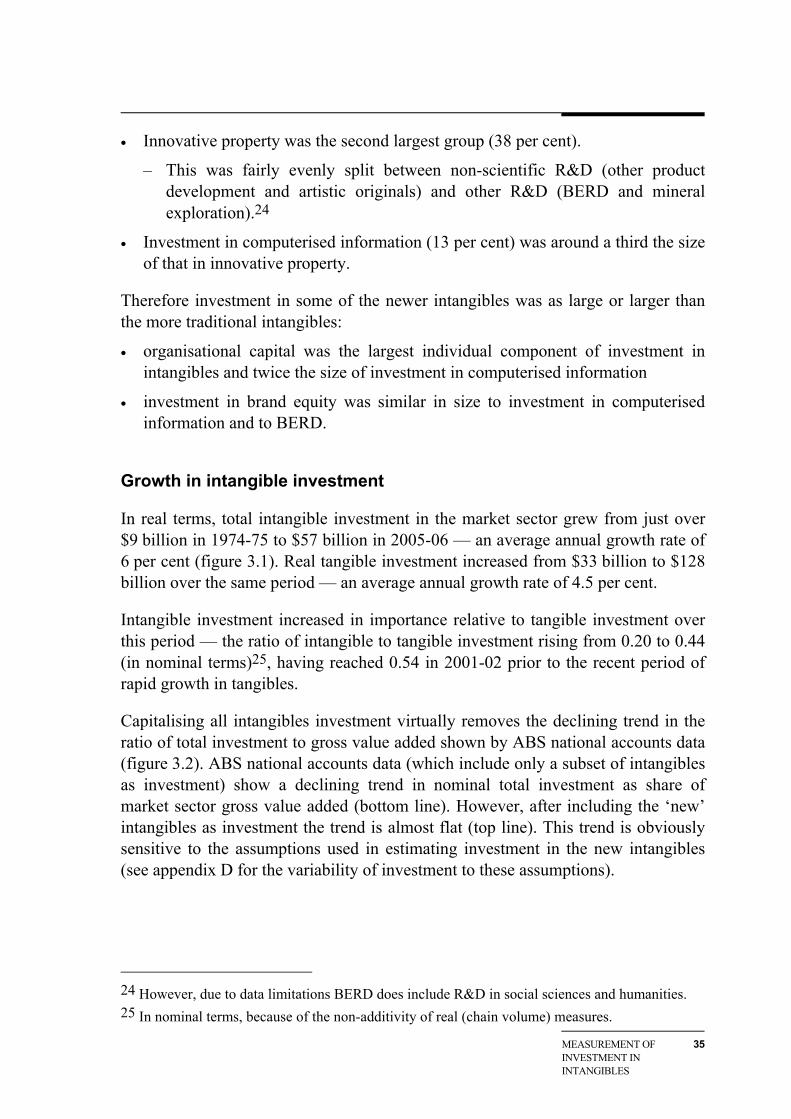
MEASUREMENT OF INVESTMENT IN INTANGIBLES
35
• Innovative property was the second largest group (38 per cent).
– This was fairly evenly split between non-scientific R&D (other product development and artistic originals) and other R&D (BERD and mineral exploration).24
• Investment in computerised information (13 per cent) was around a third the size of that in innovative property.
Therefore investment in some of the newer intangibles was as large or larger than the more traditional intangibles:
• organisational capital was the largest individual component of investment in intangibles and twice the size of investment in computerised information
• investment in brand equity was similar in size to investment in computerised information and to BERD.
Growth in intangible investment
In real terms, total intangible investment in the market sector grew from just over $9 billion in 1974-75 to $57 billion in 2005-06 — an average annual growth rate of 6 per cent (figure 3.1). Real tangible investment increased from $33 billion to $128 billion over the same period — an average annual growth rate of 4.5 per cent.
Intangible investment increased in importance relative to tangible investment over this period — the ratio of intangible to tangible investment rising from 0.20 to 0.44 (in nominal terms)25, having reached 0.54 in 2001-02 prior to the recent period of rapid growth in tangibles.
Capitalising all intangibles investment virtually removes the declining trend in the ratio of total investment to gross value added shown by ABS national accounts data (figure 3.2). ABS national accounts data (which include only a subset of intangibles as investment) show a declining trend in nominal total investment as share of market sector gross value added (bottom line). However, after including the ‘new’ intangibles as investment the trend is almost flat (top line). This trend is obviously sensitive to the assumptions used in estimating investment in the new intangibles (see appendix D for the variability of investment to these assumptions).
24 However, due to data limitations BERD does include R&D in social sciences and humanities. 25 In nominal terms, because of the non-additivity of real (chain volume) measures.
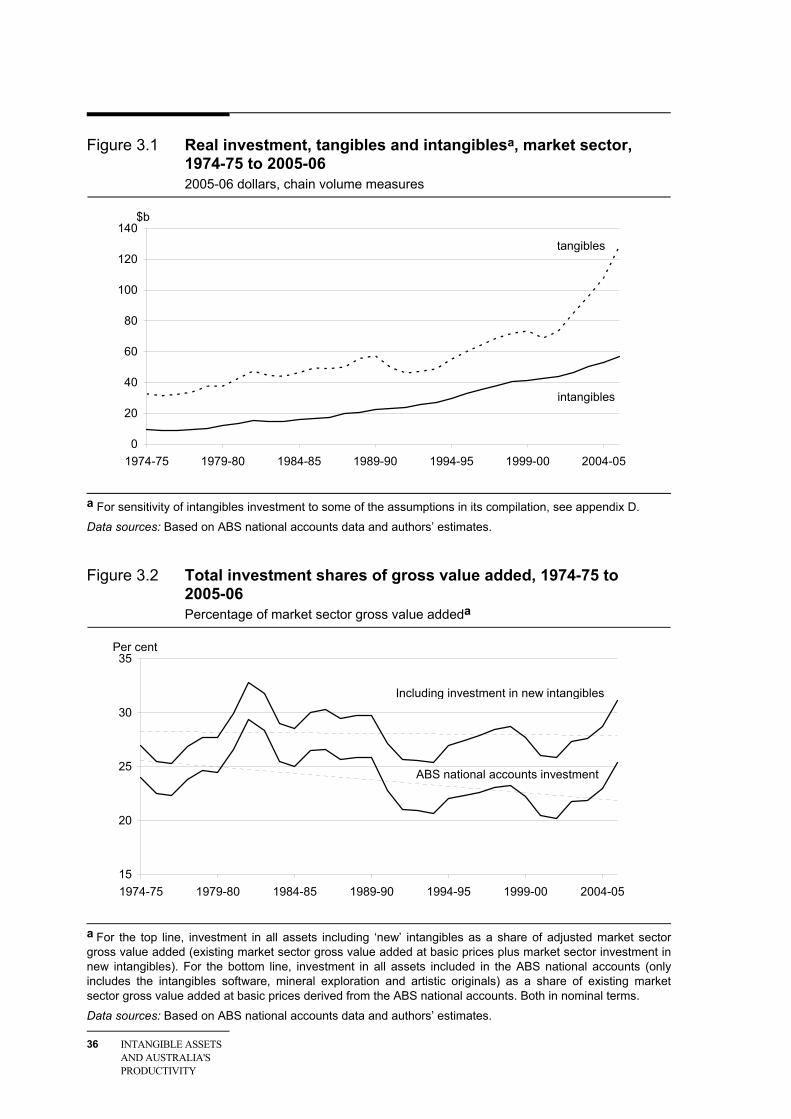
36 INTANGIBLE ASSETS AND AUSTRALIA'S PRODUCTIVITY
Figure 3.1 Real investment, tangibles and intangiblesa, market sector, 1974-75 to 2005-06 2005-06 dollars, chain volume measures
0
20
40
60
80
100
120
140
1974-75 1979-80 1984-85 1989-90 1994-95 1999-00 2004-05
$b
intangibles
tangibles
a For sensitivity of intangibles investment to some of the assumptions in its compilation, see appendix D.
Data sources: Based on ABS national accounts data and authors’ estimates.
Figure 3.2 Total investment shares of gross value added, 1974-75 to 2005-06 Percentage of market sector gross value addeda
15
20
25
30
35
1974-75 1979-80 1984-85 1989-90 1994-95 1999-00 2004-05
Per cent
Including investment in new intangibles
ABS national accounts investment
a For the top line, investment in all assets including ‘new’ intangibles as a share of adjusted market sector gross value added (existing market sector gross value added at basic prices plus market sector investment in new intangibles). For the bottom line, investment in all assets included in the ABS national accounts (only includes the intangibles software, mineral exploration and artistic originals) as a share of existing market sector gross value added at basic prices derived from the ABS national accounts. Both in nominal terms.
Data sources: Based on ABS national accounts data and authors’ estimates.
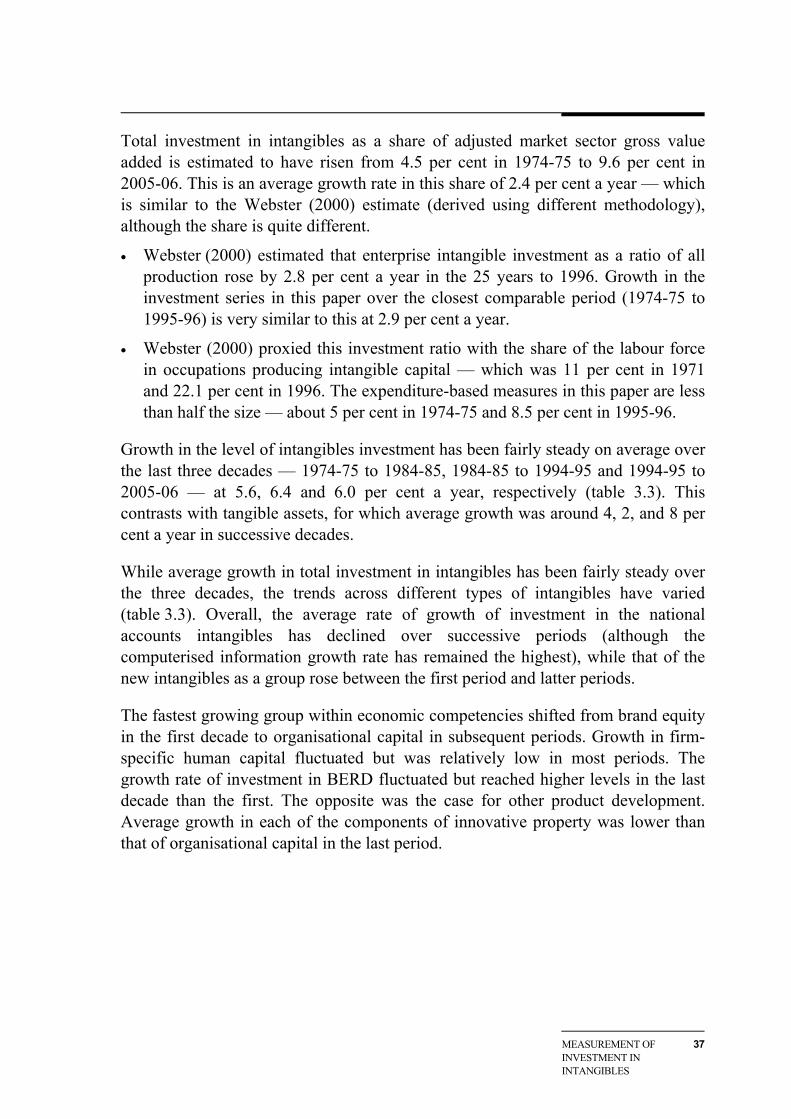
MEASUREMENT OF INVESTMENT IN INTANGIBLES
37
Total investment in intangibles as a share of adjusted market sector gross value added is estimated to have risen from 4.5 per cent in 1974-75 to 9.6 per cent in 2005-06. This is an average growth rate in this share of 2.4 per cent a year — which is similar to the Webster (2000) estimate (derived using different methodology), although the share is quite different.
• Webster (2000) estimated that enterprise intangible investment as a ratio of all production rose by 2.8 per cent a year in the 25 years to 1996. Growth in the investment series in this paper over the closest comparable period (1974-75 to 1995-96) is very similar to this at 2.9 per cent a year.
• Webster (2000) proxied this investment ratio with the share of the labour force in occupations producing intangible capital — which was 11 per cent in 1971 and 22.1 per cent in 1996. The expenditure-based measures in this paper are less than half the size — about 5 per cent in 1974-75 and 8.5 per cent in 1995-96.
Growth in the level of intangibles investment has been fairly steady on average over the last three decades — 1974-75 to 1984-85, 1984-85 to 1994-95 and 1994-95 to 2005-06 — at 5.6, 6.4 and 6.0 per cent a year, respectively (table 3.3). This contrasts with tangible assets, for which average growth was around 4, 2, and 8 per cent a year in successive decades.
While average growth in total investment in intangibles has been fairly steady over the three decades, the trends across different types of intangibles have varied (table 3.3). Overall, the average rate of growth of investment in the national accounts intangibles has declined over successive periods (although the computerised information growth rate has remained the highest), while that of the new intangibles as a group rose between the first period and latter periods.
The fastest growing group within economic competencies shifted from brand equity in the first decade to organisational capital in subsequent periods. Growth in firm-specific human capital fluctuated but was relatively low in most periods. The growth rate of investment in BERD fluctuated but reached higher levels in the last decade than the first. The opposite was the case for other product development. Average growth in each of the components of innovative property was lower than that of organisational capital in the last period.
38 INTANGIBLE ASSETS AND AUSTRALIA'S PRODUCTIVITY
Table 3.3 Growth in real intangible investmenta, market sector
1974-75– 1984-85
1984-85 – 1994-95
1994-95 – 2005-06
1974-75 – 2005-06
% per year % per year % per year % per yearComputerised information 28.3 21.4 11.6 20.0
Innovative property 5.4 4.9 4.3 4.9 BERD 2.0 12.3 7.1 7.1 Mineral exploration 9.0 -1.2 1.2 2.8 Artistic originals 11.1 -3.1 6.4 4.7 Other product development, design and research 4.3 5.4 3.3 4.3
Financial product development 4.6 3.9 0.8 3.0 New arch./eng. designs 3.5 8.6 7.4 6.5
Economic competencies 4.4 4.4 5.5 4.8 Brand equity 5.6 1.5 2.9 3.3
Advertising 5.4 1.1 2.1 2.8 Market research 15.8 12.5 11.3 13.1
Firm-specific human capital 2.8 4.5 0.0 2.3 Organisational capital 3.4 9.9 10.2 7.9
Purchased org. capital 15.8 19.3 13.4 16.1 Own account org. capital 1.6 5.1 5.9 4.3
Total intangibles investment 5.6 6.4 6.0 6.0 New intangibles 4.2 5.5 5.3 5.0 National accounts intangibles 12.8 9.9 8.8 10.4 Tangibles 3.6 1.7 8.0 4.5 Total investment 4.0 2.9 7.3 4.8 Average nominal ratio 1974-75
– 1984-85 1985-86
– 1994-95 1995-96
– 2005-06 1974-85
– 2005-06 Ratio intangible to tangible investment 0.23 0.34 0.48 0.35 Ratio of existing to adjusted market GVA 0.96 0.94 0.93 0.94 a Growth rates are based on chain volume measures (CVMs) — ABS CVMs have been used for mineral exploration and artistic originals; an aggregate market sector CVM has been calculated for computerised information using ABS industry data; and CVMs have been calculated for all subtotals and totals.
Source: Authors’ estimates.
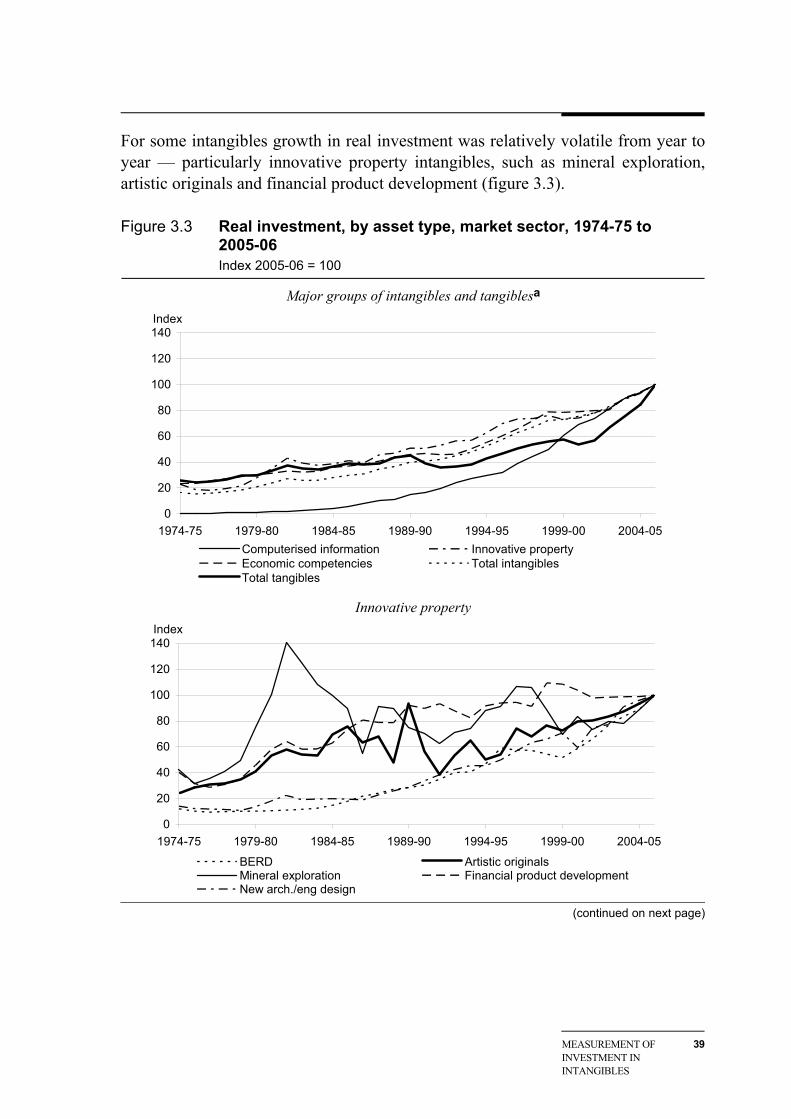
MEASUREMENT OF INVESTMENT IN INTANGIBLES
39
For some intangibles growth in real investment was relatively volatile from year to year — particularly innovative property intangibles, such as mineral exploration, artistic originals and financial product development (figure 3.3).
Figure 3.3 Real investment, by asset type, market sector, 1974-75 to 2005-06 Index 2005-06 = 100
Major groups of intangibles and tangiblesa
0
20
40
60
80
100
120
140
1974-75 1979-80 1984-85 1989-90 1994-95 1999-00 2004-05Computerised information Innovative propertyEconomic competencies Total intangiblesTotal tangibles
Index
Innovative property
0
20
40
60
80
100
120
140
1974-75 1979-80 1984-85 1989-90 1994-95 1999-00 2004-05
BERD Artistic originalsMineral exploration Financial product developmentNew arch./eng design
Index
(continued on next page)
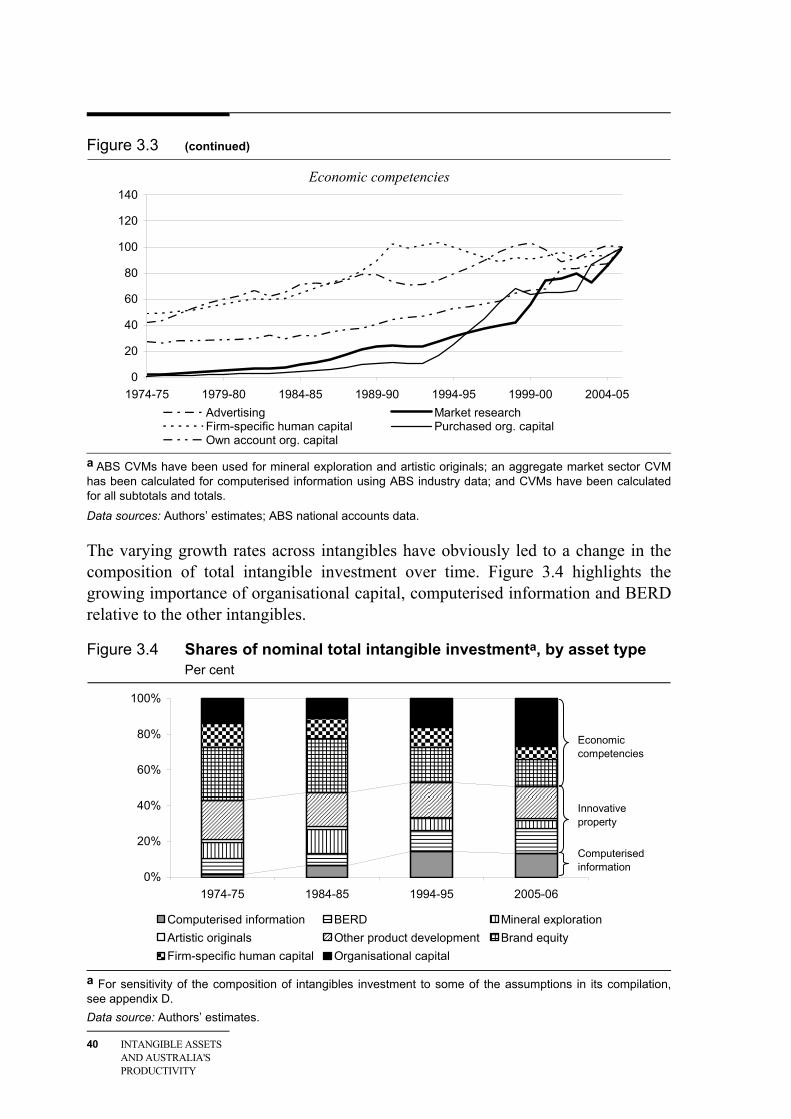
40 INTANGIBLE ASSETS AND AUSTRALIA'S PRODUCTIVITY
Figure 3.3 (continued)
Economic competencies
0
20
40
60
80
100
120
140
1974-75 1979-80 1984-85 1989-90 1994-95 1999-00 2004-05Advertising Market researchFirm-specific human capital Purchased org. capitalOwn account org. capital
a ABS CVMs have been used for mineral exploration and artistic originals; an aggregate market sector CVM has been calculated for computerised information using ABS industry data; and CVMs have been calculated for all subtotals and totals.
Data sources: Authors’ estimates; ABS national accounts data.
The varying growth rates across intangibles have obviously led to a change in the composition of total intangible investment over time. Figure 3.4 highlights the growing importance of organisational capital, computerised information and BERD relative to the other intangibles.
Figure 3.4 Shares of nominal total intangible investmenta, by asset type Per cent
0%
20%
40%
60%
80%
100%
1974-75 1984-85 1994-95 2005-06
Computerised information BERD Mineral explorationArtistic originals Other product development Brand equityFirm-specific human capital Organisational capital
Computerised information
Economic competencies
Innovative property
a For sensitivity of the composition of intangibles investment to some of the assumptions in its compilation, see appendix D. Data source: Authors’ estimates.
SERVICES FROM INTANGIBLE CAPITAL
41
4 Services from intangible capital
For the purposes of examining the contribution of intangibles to productivity growth, it is the capital services flowing from the stocks that is the most relevant measure. Capital services are estimated by combining data on the size of the capital stocks and the rental prices of that capital.
As outlined in chapter 2, the estimation of capital services from intangibles involves a number of steps and measurement challenges:
• build a real capital stock for intangible assets
– determine the appropriate rate of depreciation for each intangible asset
– use the perpetual inventory method to construct a real capital stock from the real investment series and assumed depreciation rates
• construct a volume index of capital services of all capital inputs (tangible and intangible) using capital stocks and rental prices
– determine the appropriate rental price parameters for each intangible asset
– rental prices for each asset (tangible and intangible) are derived from the adjusted operating surplus by solving for an equalising rate of return across all assets.
This chapter presents the estimates of both the stocks and services measures of intangible capital, together with an outline of the methodology used to derive them and the measurement challenges involved. (The methodology is described in more detail in appendix C. The sensitivity of the capital estimates to some of the underlying assumptions is discussed in appendix D.)
4.1 Intangible capital stocks
Perpetual inventory method
The Australian Bureau of Statistics (ABS) estimates the stock of software, mineral exploration and artistic originals and these national accounts data are used in this paper. The measurement framework used to derive estimates of the stock of each
42 INTANGIBLE ASSETS AND AUSTRALIA'S PRODUCTIVITY
the ‘new’ intangible is the perpetual inventory method (PIM).1 PIM can be represented by
Rt+1 = (1-δ)Rt + Nt
where δ is the geometric constant depreciation rate of the asset2, tR is the intangible stock and tN is the flow of investment (expenditure in constant prices) at time t.3
Assuming that preceding the initial observation (the first available data point), there was a long period of real investment growth at a constant rate of g, the initial stock of intangible capital in period t = 0 (Ro) can be calculated using
Ro = No /(g + δ)
where No is the investment in the intangible (in constant prices) during the first year for which data are available; and g is approximated by the average annual logarithmic growth of investment in the intangible (in constant prices) over the full period for which data on the intangible are available.
This application of the PIM differs from that used in the United States, United Kingdom and Japanese studies in the assumptions related to the initial stock. Corrado, Hulten and Sichel (CHS 2006) assumed an initial stock of zero in a specific year for each asset (for example, 1928 for advertising). Marrano, Haskel and Wallis (MHW 2007) assumed an initial stock of zero for all intangible assets in 1970. Fukao et al. (2008b) constructed their initial stocks as they had investment data back to 1973 and began their stock estimates in 1980. The method used in this paper, as described above, does not set an initial stock equal to zero but can be used to calculated the initial stock in any year (1974-75 in this case) for which investment flow data are available. It does assume a constant rate of investment growth for the period prior to the first data point for investment. However, this does not make a large difference to the initial stock estimates because of the high depreciation rates.
1 The ABS also uses the perpetual inventory method to estimate the stocks for the national
accounts intangibles. However, the ABS method is more complex than the method used in this paper (see ABS 2000, chapter 16).
2 In the capital measurement literature, this form of PIM corresponds to the geometric age-efficiency profile for the productive capital stock. This differs from the hyperbolic function used by the ABS for tangibles and the national accounts intangibles, where the decline in efficiency of the asset increases as the asset ages (ABS 2000, para. 16.19–16.21).
3 CHS (2006, p. 23) note that the use of this identity assumes that investment becomes productive as soon as it is put in place. This assumption, which avoids the complication of different gestation lags for different assets, is in line with much of the growth accounting literature.
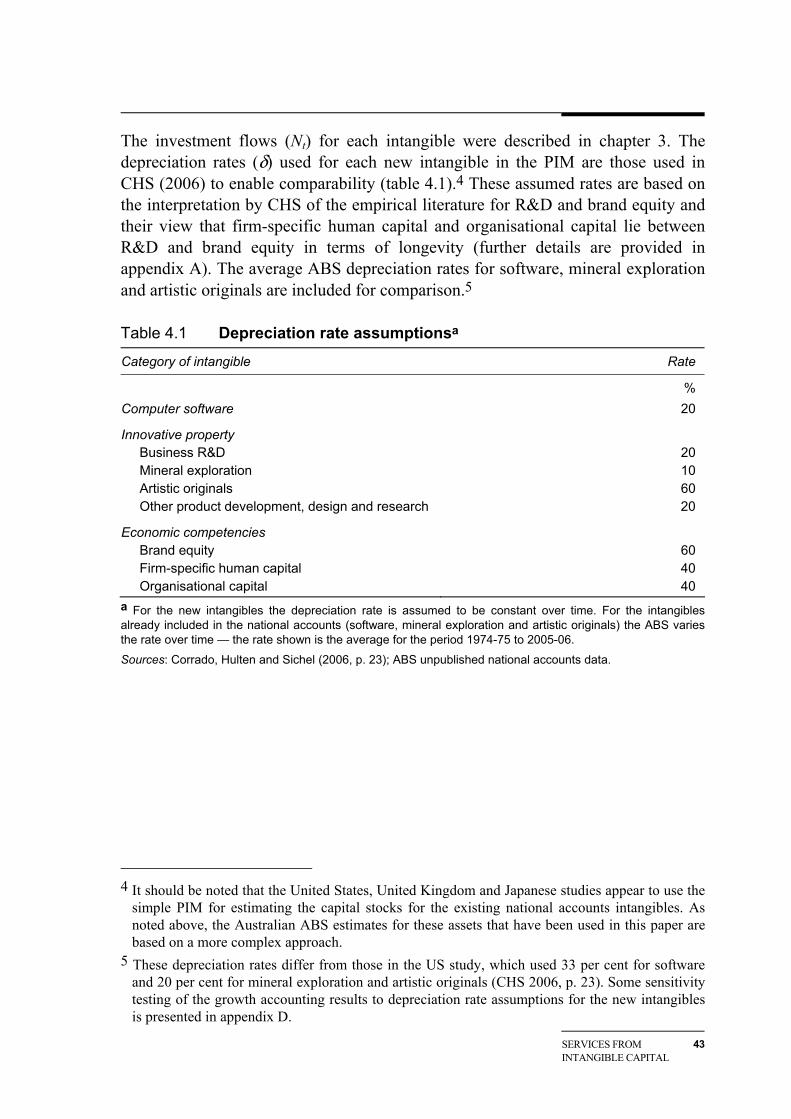
SERVICES FROM INTANGIBLE CAPITAL
43
The investment flows (Nt) for each intangible were described in chapter 3. The depreciation rates (δ) used for each new intangible in the PIM are those used in CHS (2006) to enable comparability (table 4.1).4 These assumed rates are based on the interpretation by CHS of the empirical literature for R&D and brand equity and their view that firm-specific human capital and organisational capital lie between R&D and brand equity in terms of longevity (further details are provided in appendix A). The average ABS depreciation rates for software, mineral exploration and artistic originals are included for comparison.5
Table 4.1 Depreciation rate assumptionsa
Category of intangible Rate
% Computer software 20
Innovative property Business R&D 20 Mineral exploration 10 Artistic originals 60 Other product development, design and research 20
Economic competencies Brand equity 60 Firm-specific human capital 40 Organisational capital 40
a For the new intangibles the depreciation rate is assumed to be constant over time. For the intangibles already included in the national accounts (software, mineral exploration and artistic originals) the ABS varies the rate over time — the rate shown is the average for the period 1974-75 to 2005-06.
Sources: Corrado, Hulten and Sichel (2006, p. 23); ABS unpublished national accounts data.
4 It should be noted that the United States, United Kingdom and Japanese studies appear to use the
simple PIM for estimating the capital stocks for the existing national accounts intangibles. As noted above, the Australian ABS estimates for these assets that have been used in this paper are based on a more complex approach.
5 These depreciation rates differ from those in the US study, which used 33 per cent for software and 20 per cent for mineral exploration and artistic originals (CHS 2006, p. 23). Some sensitivity testing of the growth accounting results to depreciation rate assumptions for the new intangibles is presented in appendix D.
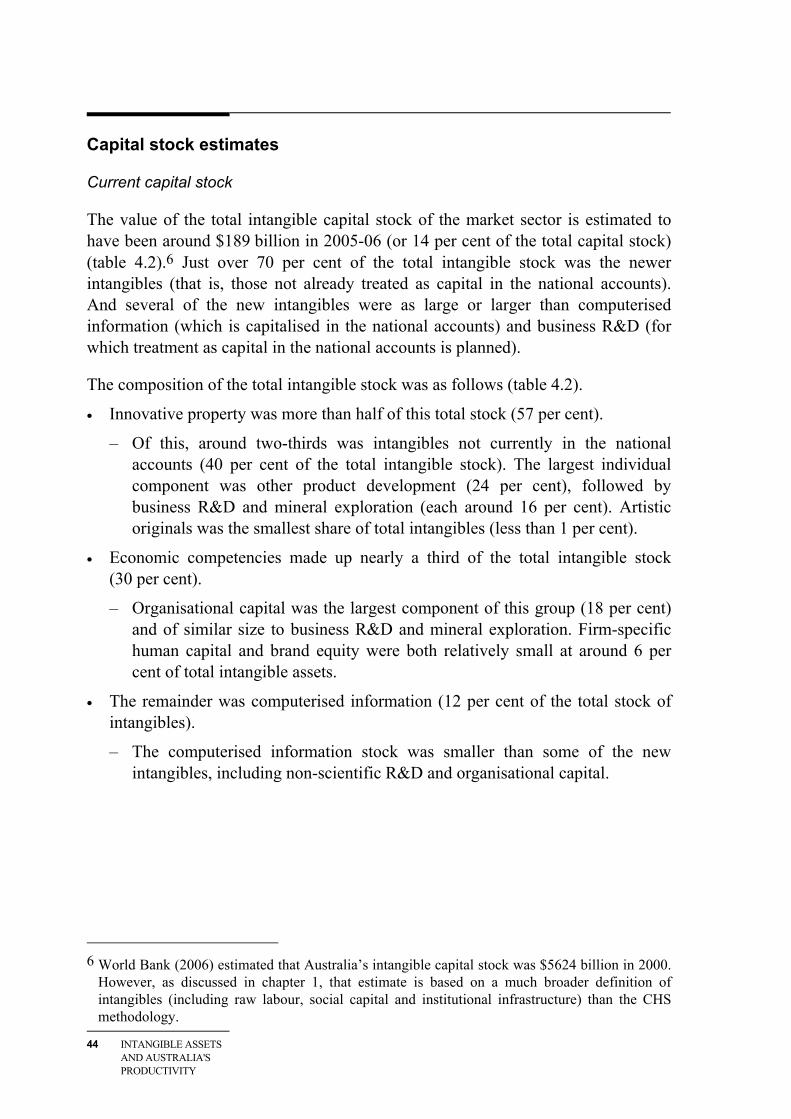
44 INTANGIBLE ASSETS AND AUSTRALIA'S PRODUCTIVITY
Capital stock estimates
Current capital stock
The value of the total intangible capital stock of the market sector is estimated to have been around $189 billion in 2005-06 (or 14 per cent of the total capital stock) (table 4.2).6 Just over 70 per cent of the total intangible stock was the newer intangibles (that is, those not already treated as capital in the national accounts). And several of the new intangibles were as large or larger than computerised information (which is capitalised in the national accounts) and business R&D (for which treatment as capital in the national accounts is planned).
The composition of the total intangible stock was as follows (table 4.2).
• Innovative property was more than half of this total stock (57 per cent).
– Of this, around two-thirds was intangibles not currently in the national accounts (40 per cent of the total intangible stock). The largest individual component was other product development (24 per cent), followed by business R&D and mineral exploration (each around 16 per cent). Artistic originals was the smallest share of total intangibles (less than 1 per cent).
• Economic competencies made up nearly a third of the total intangible stock (30 per cent).
– Organisational capital was the largest component of this group (18 per cent) and of similar size to business R&D and mineral exploration. Firm-specific human capital and brand equity were both relatively small at around 6 per cent of total intangible assets.
• The remainder was computerised information (12 per cent of the total stock of intangibles).
– The computerised information stock was smaller than some of the new intangibles, including non-scientific R&D and organisational capital.
6 World Bank (2006) estimated that Australia’s intangible capital stock was $5624 billion in 2000.
However, as discussed in chapter 1, that estimate is based on a much broader definition of intangibles (including raw labour, social capital and institutional infrastructure) than the CHS methodology.
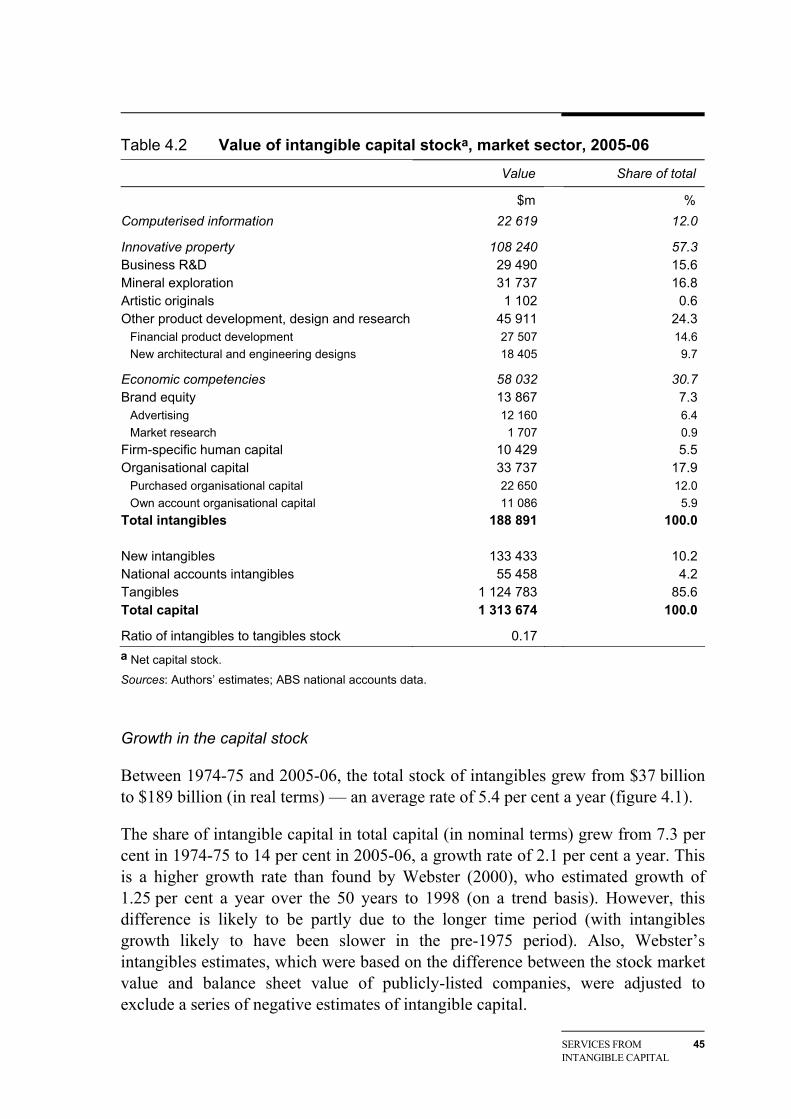
SERVICES FROM INTANGIBLE CAPITAL
45
Table 4.2 Value of intangible capital stocka, market sector, 2005-06
Value Share of total
$m % Computerised information 22 619 12.0
Innovative property 108 240 57.3 Business R&D 29 490 15.6 Mineral exploration 31 737 16.8 Artistic originals 1 102 0.6 Other product development, design and research 45 911 24.3
Financial product development 27 507 14.6 New architectural and engineering designs 18 405 9.7
Economic competencies 58 032 30.7 Brand equity 13 867 7.3
Advertising 12 160 6.4 Market research 1 707 0.9
Firm-specific human capital 10 429 5.5 Organisational capital 33 737 17.9
Purchased organisational capital 22 650 12.0 Own account organisational capital 11 086 5.9
Total intangibles 188 891 100.0 New intangibles 133 433 10.2 National accounts intangibles 55 458 4.2 Tangibles 1 124 783 85.6 Total capital 1 313 674 100.0
Ratio of intangibles to tangibles stock 0.17 a Net capital stock.
Sources: Authors’ estimates; ABS national accounts data.
Growth in the capital stock
Between 1974-75 and 2005-06, the total stock of intangibles grew from $37 billion to $189 billion (in real terms) — an average rate of 5.4 per cent a year (figure 4.1).
The share of intangible capital in total capital (in nominal terms) grew from 7.3 per cent in 1974-75 to 14 per cent in 2005-06, a growth rate of 2.1 per cent a year. This is a higher growth rate than found by Webster (2000), who estimated growth of 1.25 per cent a year over the 50 years to 1998 (on a trend basis). However, this difference is likely to be partly due to the longer time period (with intangibles growth likely to have been slower in the pre-1975 period). Also, Webster’s intangibles estimates, which were based on the difference between the stock market value and balance sheet value of publicly-listed companies, were adjusted to exclude a series of negative estimates of intangible capital.
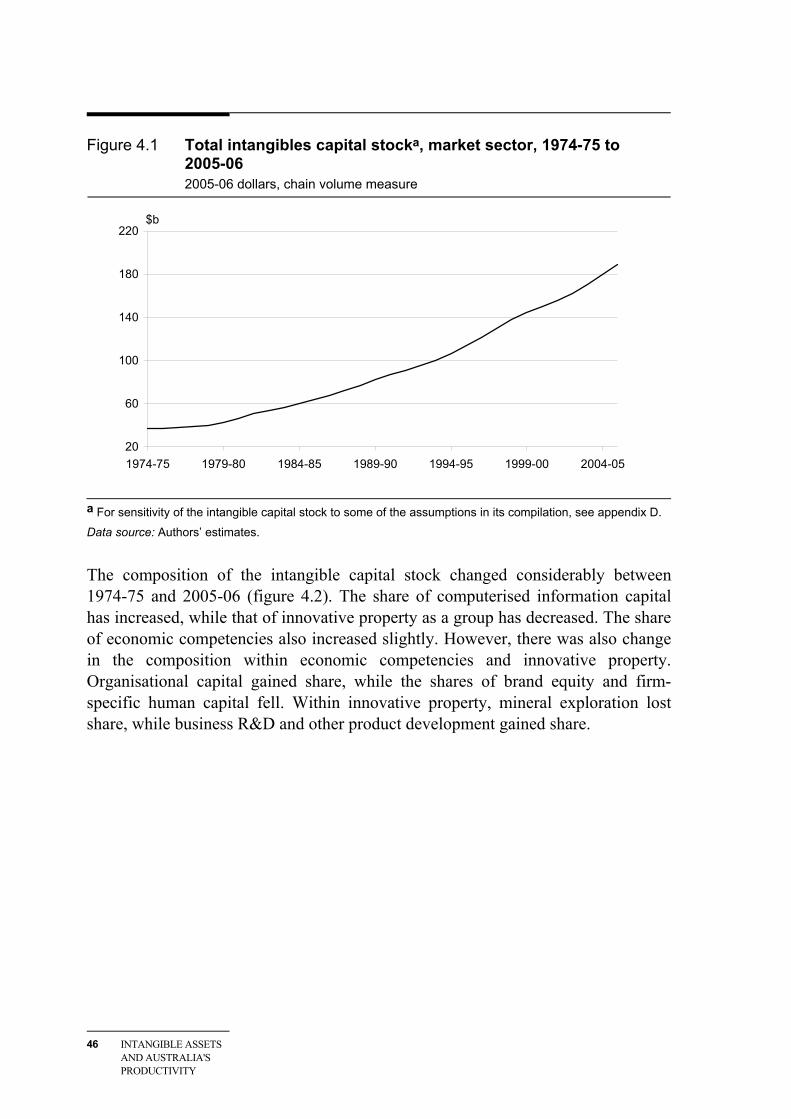
46 INTANGIBLE ASSETS AND AUSTRALIA'S PRODUCTIVITY
Figure 4.1 Total intangibles capital stocka, market sector, 1974-75 to 2005-06 2005-06 dollars, chain volume measure
20
60
100
140
180
220
1974-75 1979-80 1984-85 1989-90 1994-95 1999-00 2004-05
$b
a For sensitivity of the intangible capital stock to some of the assumptions in its compilation, see appendix D.
Data source: Authors’ estimates.
The composition of the intangible capital stock changed considerably between 1974-75 and 2005-06 (figure 4.2). The share of computerised information capital has increased, while that of innovative property as a group has decreased. The share of economic competencies also increased slightly. However, there was also change in the composition within economic competencies and innovative property. Organisational capital gained share, while the shares of brand equity and firm-specific human capital fell. Within innovative property, mineral exploration lost share, while business R&D and other product development gained share.
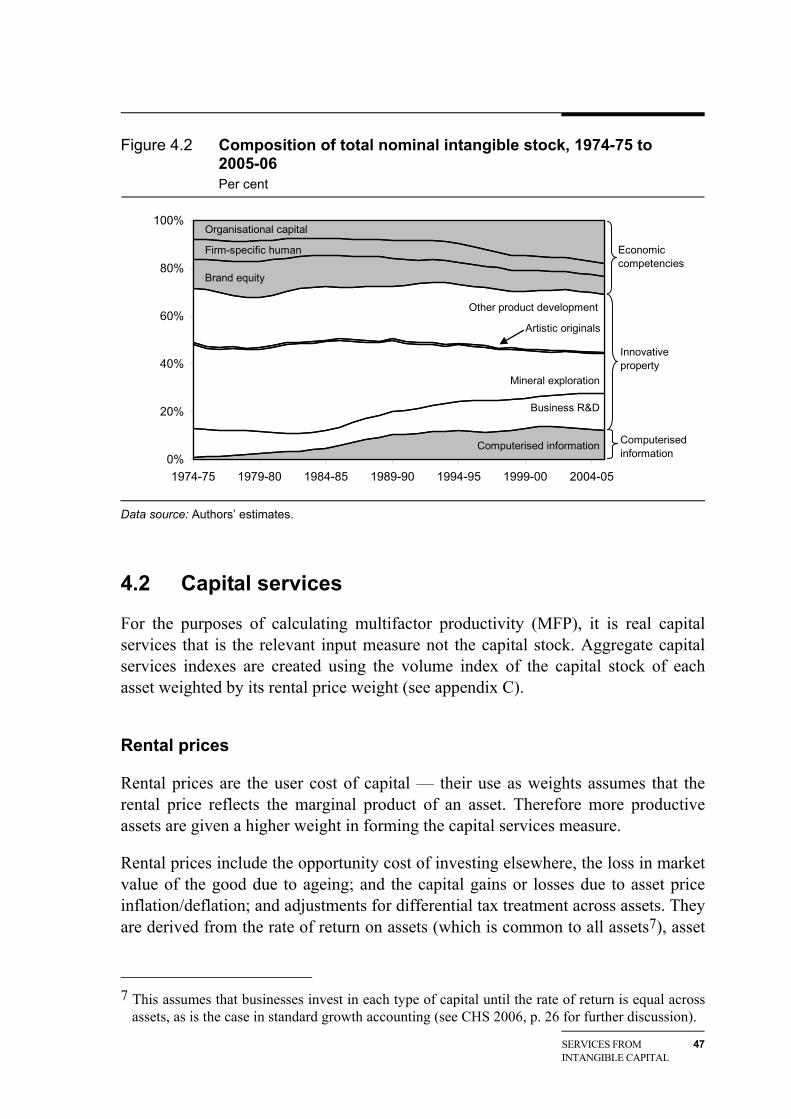
SERVICES FROM INTANGIBLE CAPITAL
47
Figure 4.2 Composition of total nominal intangible stock, 1974-75 to 2005-06 Per cent
0%
20%
40%
60%
80%
100%
1974-75 1979-80 1984-85 1989-90 1994-95 1999-00 2004-05
Artistic originals
Organisational capital
Firm-specific human
Brand equity
Other product development
Mineral exploration
Computerised information
Business R&D
Economic competencies
Innovative property
Computerised information
Data source: Authors’ estimates.
4.2 Capital services
For the purposes of calculating multifactor productivity (MFP), it is real capital services that is the relevant input measure not the capital stock. Aggregate capital services indexes are created using the volume index of the capital stock of each asset weighted by its rental price weight (see appendix C).
Rental prices
Rental prices are the user cost of capital — their use as weights assumes that the rental price reflects the marginal product of an asset. Therefore more productive assets are given a higher weight in forming the capital services measure.
Rental prices include the opportunity cost of investing elsewhere, the loss in market value of the good due to ageing; and the capital gains or losses due to asset price inflation/deflation; and adjustments for differential tax treatment across assets. They are derived from the rate of return on assets (which is common to all assets7), asset
7 This assumes that businesses invest in each type of capital until the rate of return is equal across
assets, as is the case in standard growth accounting (see CHS 2006, p. 26 for further discussion).
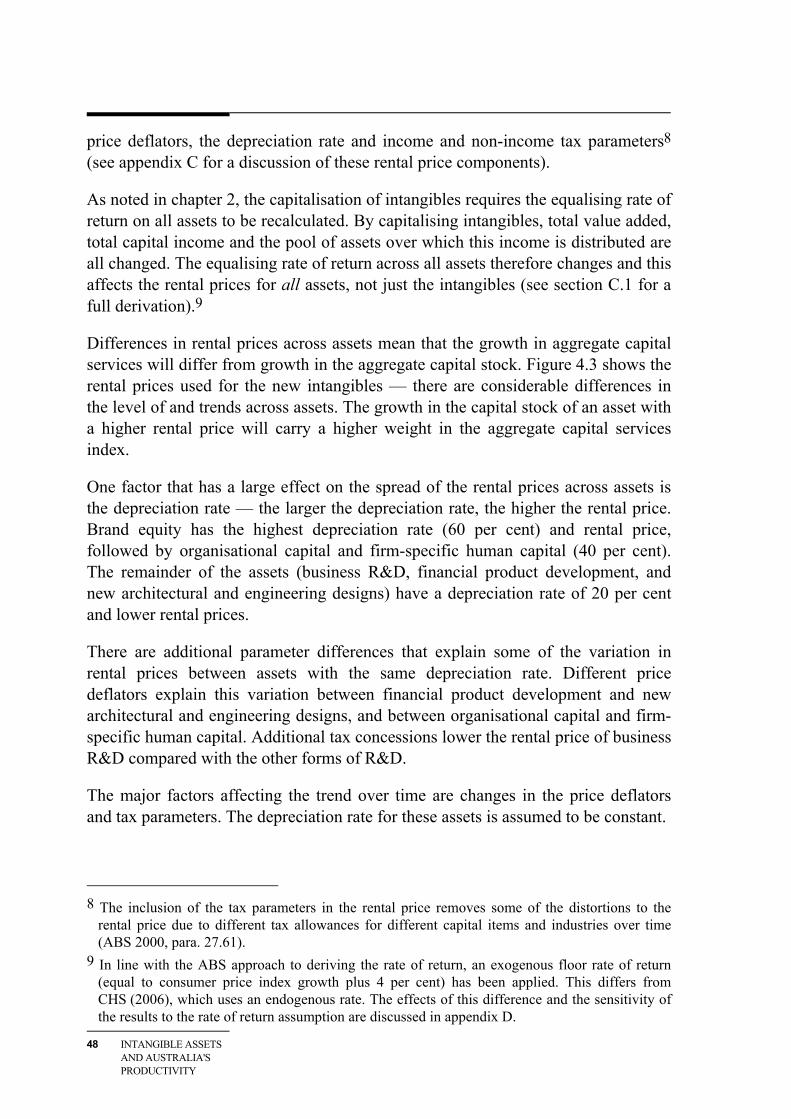
48 INTANGIBLE ASSETS AND AUSTRALIA'S PRODUCTIVITY
price deflators, the depreciation rate and income and non-income tax parameters8 (see appendix C for a discussion of these rental price components).
As noted in chapter 2, the capitalisation of intangibles requires the equalising rate of return on all assets to be recalculated. By capitalising intangibles, total value added, total capital income and the pool of assets over which this income is distributed are all changed. The equalising rate of return across all assets therefore changes and this affects the rental prices for all assets, not just the intangibles (see section C.1 for a full derivation).9
Differences in rental prices across assets mean that the growth in aggregate capital services will differ from growth in the aggregate capital stock. Figure 4.3 shows the rental prices used for the new intangibles — there are considerable differences in the level of and trends across assets. The growth in the capital stock of an asset with a higher rental price will carry a higher weight in the aggregate capital services index.
One factor that has a large effect on the spread of the rental prices across assets is the depreciation rate — the larger the depreciation rate, the higher the rental price. Brand equity has the highest depreciation rate (60 per cent) and rental price, followed by organisational capital and firm-specific human capital (40 per cent). The remainder of the assets (business R&D, financial product development, and new architectural and engineering designs) have a depreciation rate of 20 per cent and lower rental prices.
There are additional parameter differences that explain some of the variation in rental prices between assets with the same depreciation rate. Different price deflators explain this variation between financial product development and new architectural and engineering designs, and between organisational capital and firm-specific human capital. Additional tax concessions lower the rental price of business R&D compared with the other forms of R&D.
The major factors affecting the trend over time are changes in the price deflators and tax parameters. The depreciation rate for these assets is assumed to be constant.
8 The inclusion of the tax parameters in the rental price removes some of the distortions to the
rental price due to different tax allowances for different capital items and industries over time (ABS 2000, para. 27.61).
9 In line with the ABS approach to deriving the rate of return, an exogenous floor rate of return (equal to consumer price index growth plus 4 per cent) has been applied. This differs from CHS (2006), which uses an endogenous rate. The effects of this difference and the sensitivity of the results to the rate of return assumption are discussed in appendix D.
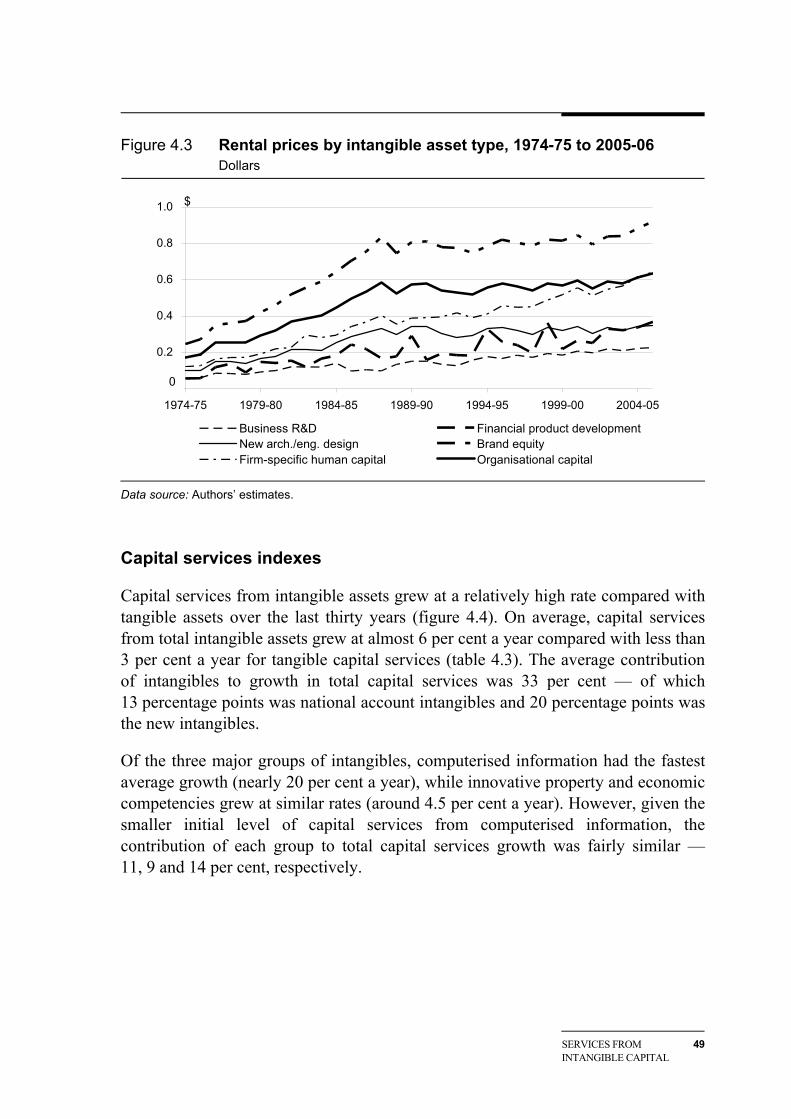
SERVICES FROM INTANGIBLE CAPITAL
49
Figure 4.3 Rental prices by intangible asset type, 1974-75 to 2005-06 Dollars
0.2
0.4
0.6
0.8
1.0
1974-75 1979-80 1984-85 1989-90 1994-95 1999-00 2004-05
Business R&D Financial product developmentNew arch./eng. design Brand equityFirm-specific human capital Organisational capital
0
$
Data source: Authors’ estimates.
Capital services indexes
Capital services from intangible assets grew at a relatively high rate compared with tangible assets over the last thirty years (figure 4.4). On average, capital services from total intangible assets grew at almost 6 per cent a year compared with less than 3 per cent a year for tangible capital services (table 4.3). The average contribution of intangibles to growth in total capital services was 33 per cent — of which 13 percentage points was national account intangibles and 20 percentage points was the new intangibles.
Of the three major groups of intangibles, computerised information had the fastest average growth (nearly 20 per cent a year), while innovative property and economic competencies grew at similar rates (around 4.5 per cent a year). However, given the smaller initial level of capital services from computerised information, the contribution of each group to total capital services growth was fairly similar — 11, 9 and 14 per cent, respectively.
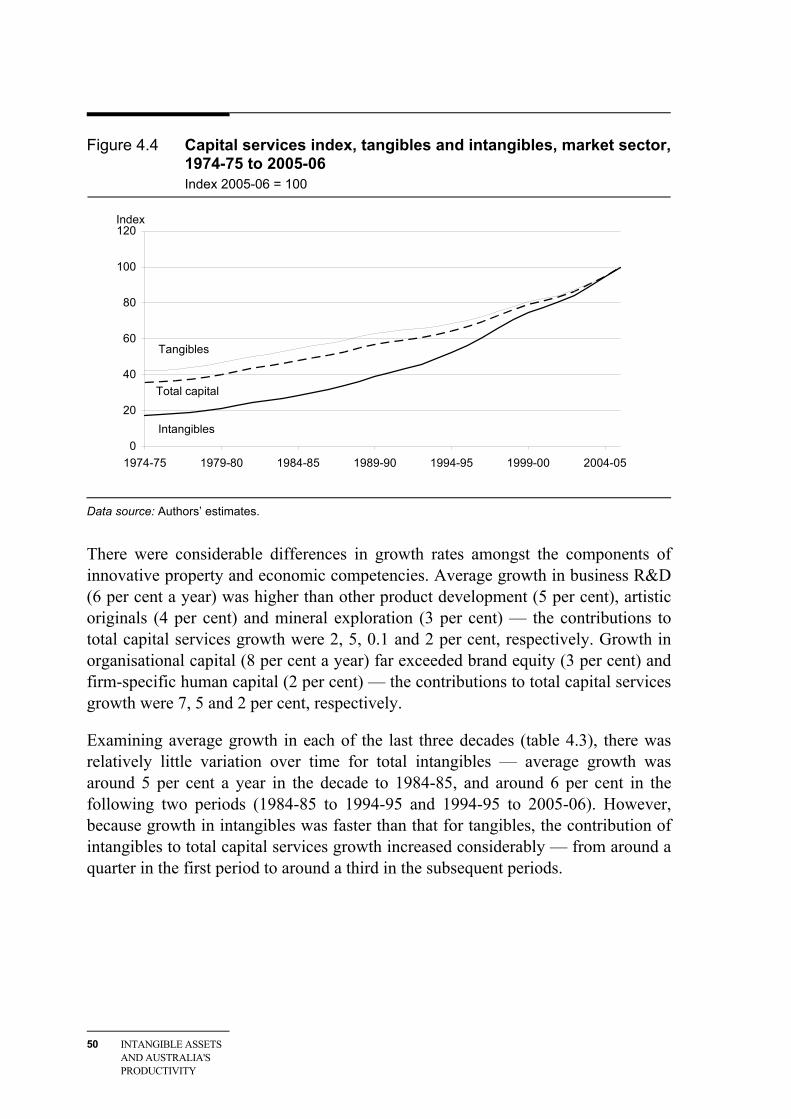
50 INTANGIBLE ASSETS AND AUSTRALIA'S PRODUCTIVITY
Figure 4.4 Capital services index, tangibles and intangibles, market sector, 1974-75 to 2005-06 Index 2005-06 = 100
0
20
40
60
80
100
120
1974-75 1979-80 1984-85 1989-90 1994-95 1999-00 2004-05
Index
Tangibles
Intangibles
Total capital
Data source: Authors’ estimates.
There were considerable differences in growth rates amongst the components of innovative property and economic competencies. Average growth in business R&D (6 per cent a year) was higher than other product development (5 per cent), artistic originals (4 per cent) and mineral exploration (3 per cent) — the contributions to total capital services growth were 2, 5, 0.1 and 2 per cent, respectively. Growth in organisational capital (8 per cent a year) far exceeded brand equity (3 per cent) and firm-specific human capital (2 per cent) — the contributions to total capital services growth were 7, 5 and 2 per cent, respectively.
Examining average growth in each of the last three decades (table 4.3), there was relatively little variation over time for total intangibles — average growth was around 5 per cent a year in the decade to 1984-85, and around 6 per cent in the following two periods (1984-85 to 1994-95 and 1994-95 to 2005-06). However, because growth in intangibles was faster than that for tangibles, the contribution of intangibles to total capital services growth increased considerably — from around a quarter in the first period to around a third in the subsequent periods.
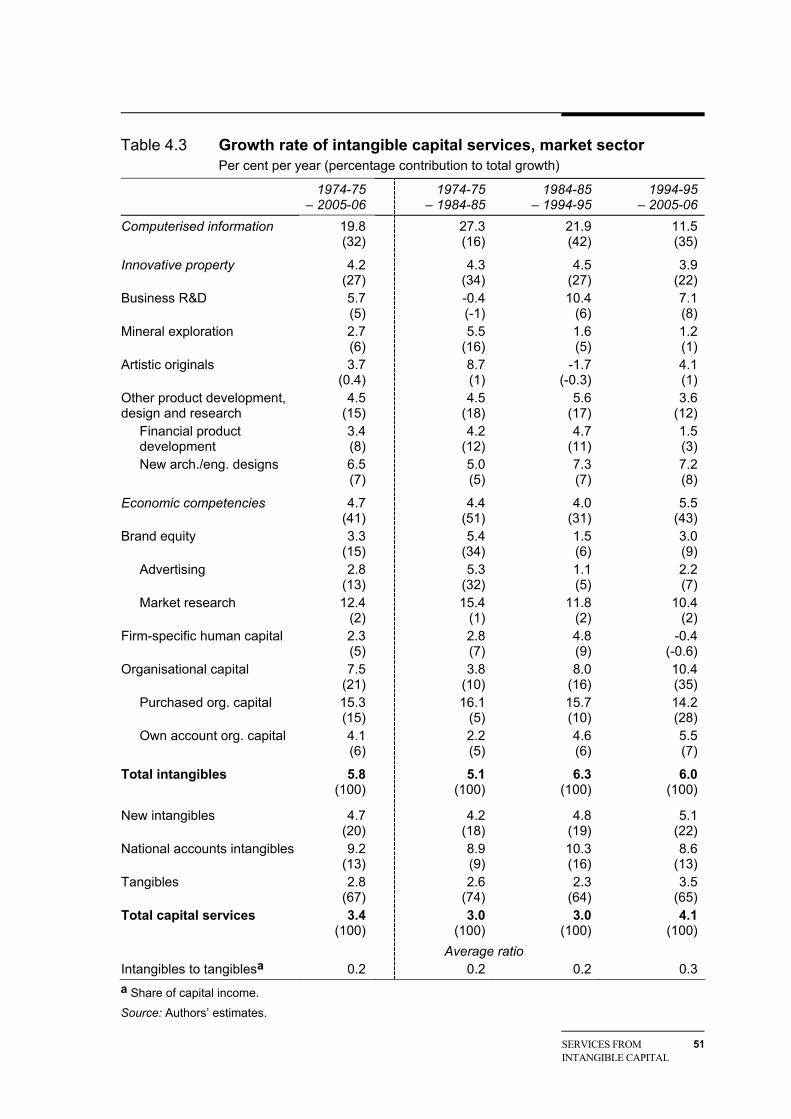
SERVICES FROM INTANGIBLE CAPITAL
51
Table 4.3 Growth rate of intangible capital services, market sector Per cent per year (percentage contribution to total growth)
1974-75 – 2005-06
1974-75 – 1984-85
1984-85 – 1994-95
1994-95 – 2005-06
Computerised information 19.8(32)
27.3(16)
21.9 (42)
11.5(35)
Innovative property 4.2(27)
4.3(34)
4.5 (27)
3.9(22)
Business R&D 5.7(5)
-0.4(-1)
10.4 (6)
7.1(8)
Mineral exploration 2.7(6)
5.5(16)
1.6 (5)
1.2(1)
Artistic originals 3.7(0.4)
8.7(1)
-1.7 (-0.3)
4.1(1)
Other product development, design and research
4.5(15)
4.5(18)
5.6 (17)
3.6(12)
Financial product development
3.4(8)
4.2(12)
4.7 (11)
1.5(3)
New arch./eng. designs 6.5(7)
5.0(5)
7.3 (7)
7.2(8)
Economic competencies 4.7(41)
4.4(51)
4.0 (31)
5.5(43)
Brand equity 3.3(15)
5.4(34)
1.5 (6)
3.0(9)
Advertising 2.8(13)
5.3(32)
1.1 (5)
2.2(7)
Market research 12.4(2)
15.4(1)
11.8 (2)
10.4(2)
Firm-specific human capital 2.3(5)
2.8(7)
4.8 (9)
-0.4(-0.6)
Organisational capital 7.5(21)
3.8(10)
8.0 (16)
10.4(35)
Purchased org. capital 15.3(15)
16.1(5)
15.7 (10)
14.2(28)
Own account org. capital 4.1(6)
2.2(5)
4.6 (6)
5.5(7)
Total intangibles 5.8(100)
5.1(100)
6.3 (100)
6.0(100)
New intangibles 4.7(20)
4.2(18)
4.8 (19)
5.1(22)
National accounts intangibles 9.2(13)
8.9(9)
10.3 (16)
8.6(13)
Tangibles 2.8(67)
2.6(74)
2.3 (64)
3.5(65)
Total capital services 3.4(100)
3.0(100)
3.0 (100)
4.1(100)
Average ratio Intangibles to tangiblesa 0.2 0.2 0.2 0.3 a Share of capital income.
Source: Authors’ estimates.
52 INTANGIBLE ASSETS AND AUSTRALIA'S PRODUCTIVITY
The fairly constant average growth rate for total intangibles masks different patterns of growth in individual intangibles over time.
• Computerised information had the fastest growth rate in each period (except for purchased organisational capital in the third period) and, although the rate declined in each successive period, the contribution to total capital services growth increased (from 4 to 15 per cent between the first two periods before declining to 12 per cent in the third period).
• The growth in innovative property accelerated in the second period before dropping back to a rate lower than in the first period (the contribution to total capital services growth similarly rose from 9 to 9.5 per cent before dropping back to 8 per cent).
– Business R&D was a large contributor to this acceleration in the second period. Other product development was the largest contributor to the decline in the third period.
• Economic competencies growth fell between the first and second periods before rising to its highest rate in the third period (the contribution to total capital services growth was 14, 11 and 15 per cent, respectively).
– Growth in organisational capital increased in successive periods (its contribution rising from 3 to 6 and then 12 per cent of total capital services growth) but in the second period this was offset by a large decline in growth in brand equity (its contribution dropping from 9 to 2 per cent).
Figure 4.5 highlights the changing composition of the service flow from intangible capital. Services from computerised information have clearly increased in importance over time. While economic competencies as a group has accounted for a falling share of total capital services, the contribution of organisational capital has grown strongly. High growth in purchased organisational capital is behind this trend. There was a smaller shift in the composition of innovative property capital services to non-scientific R&D from other R&D (business R&D and mineral exploration). This was largely because of relatively slow growth in mineral exploration investment combined with relatively low and stable rental prices.
Comparing figures 4.5 and 4.2 highlights the effect of using a capital services measure rather than a capital stock measure — for a given size capital stock, those assets with shorter asset lives (that is, higher depreciation rates) have a higher capital services flow in a given period than those with longer asset lives. For example, for economic competencies the share of capital services is higher than the share of the capital stock, while the opposite is the case for innovative property.
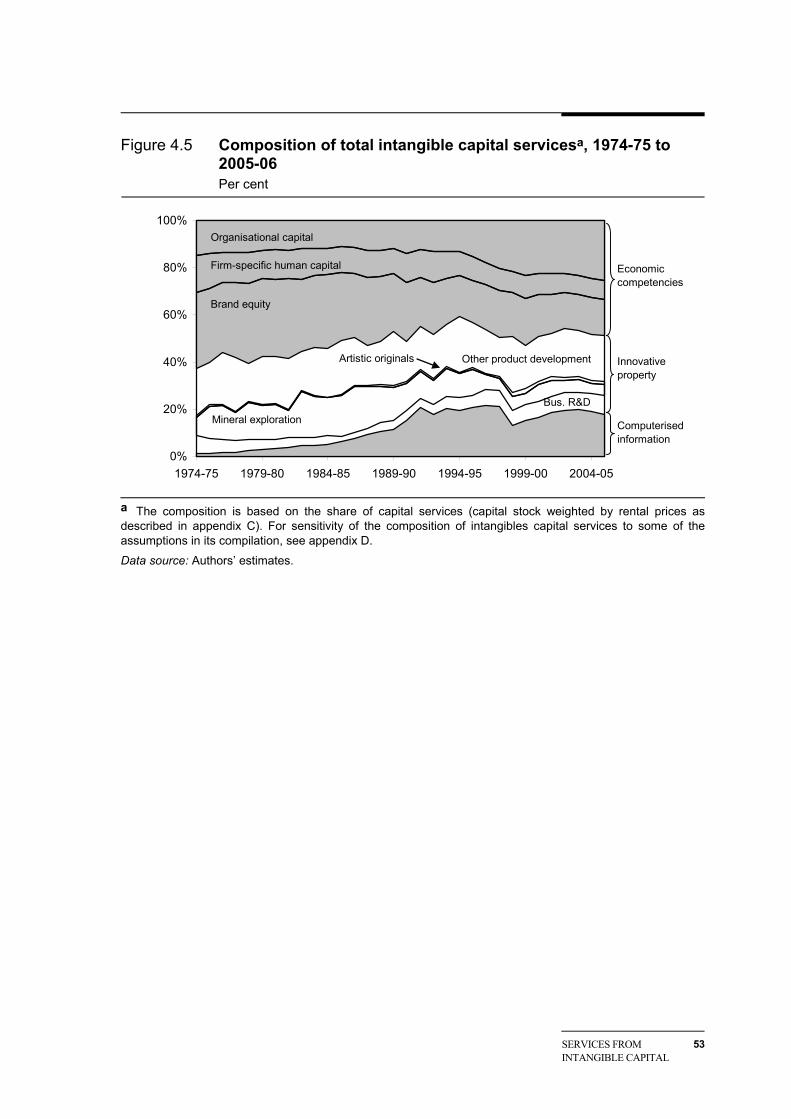
SERVICES FROM INTANGIBLE CAPITAL
53
Figure 4.5 Composition of total intangible capital servicesa, 1974-75 to 2005-06 Per cent
0%
20%
40%
60%
80%
100%
1974-75 1979-80 1984-85 1989-90 1994-95 1999-00 2004-05
Computerised information
Bus. R&D
Organisational capital
Firm-specific human capital
Mineral exploration
Artistic originals Other product development
Brand equity
Economic competencies
Innovative property
a The composition is based on the share of capital services (capital stock weighted by rental prices as described in appendix C). For sensitivity of the composition of intangibles capital services to some of the assumptions in its compilation, see appendix D.
Data source: Authors’ estimates.

GROWTH ACCOUNTING RESULTS
55
5 Growth accounting results
This chapter presents the results of growth accounting including intangible assets. Three different definitions of capital have been used to analyse the impact of intangibles on measured productivity growth in the market sector:
• all intangible and tangible assets
• all Australian Bureau of Statistics (ABS) national accounts assets (which includes all tangible assets and a subset of the intangible assets1)
• tangible assets only.
A comparison of the results for the three definitions of capital provides a picture of the impact of intangibles on measured productivity growth and the extent to which the national accounts are affected by not capitalising some intangible assets.
The data for national accounts tangible and intangible assets are sourced from ABS national accounts data.2 The other intangible investment and intangible capital services have been estimated as described in chapters 3 and 4.
5.1 Growth accounting components
The general aim of growth accounting is to understand the drivers of output growth in the economy. It is used to show how much output growth is attributable to increases in measured input — usually labour and capital inputs. The residual growth not explained by changes in these inputs is due to other factors, and is called multifactor productivity (MFP) growth.
Most of the growth accounting results presented in this chapter are for labour productivity growth, that is, growth in the level of output per unit of labour input. This controls for any output growth attributable to changes in the work force, such as higher population growth, changes in the unemployment rate or changes in the
1The ABS definition of capital includes only three intangible assets: software, mineral exploration
and artistic originals (ABS 2000, paras 16.47 - 16.56). 2 All published and unpublished national accounts data used in the growth accounting in this paper
are from the dataset underlying ABS Australian System of National Accounts, 2006-07 (Cat. no. 5204.0).
56 INTANGIBLE ASSETS AND AUSTRALIA'S PRODUCTIVITY
participation rate. Labour productivity growth can be decomposed into capital deepening, which is the capital income share weighted growth in capital inputs relative to labour, and MFP growth.
The first question is what portion of LP growth normally attributed to MFP growth is actually due to an increase in capital deepening in unaccounted intangible assets. The second question is how much are growth measures affected by not including intangible investments as outputs.
As discussed in chapter 2 and appendix B, in the case where no intangibles are treated as capital, growth in output can be expressed as
L KQ MFP s L s K• • • •′ ′ ′ ′= + + (5.1)
where Q′ is output excluding investment in all intangible assets; L and K are labour and capital inputs; Ls′ and Ks′ are labour and capital income shares before the
inclusion of intangibles; and MFP•
′ is residual MFP growth.
Re-expressing this in per unit of labour terms gives labour productivity growth (see appendix B)
QLP KD MFPL
•• • •′⎛ ⎞′ ′ ′= = +⎜ ⎟
⎝ ⎠ (5.2)
where capital deepening KD•
′ is KKsL
•⎛ ⎞′ ⎜ ⎟⎝ ⎠
(5.3)
Capital deepening is the growth of capital inputs relative to labour. It is derived by multiplying the rate of change of the capital/labour ratio by the average capital income share.
Treating intangibles as capital changes output growth, total capital input growth, the capital and labour income shares and MFP growth.
Output growth becomes
L K RQ MFP s L s K s R• • • • •
= + + + (5.4)
where Q Q N′= + , that is, output including intangible investment ( N ), and R is the intangible capital stock.
GROWTH ACCOUNTING RESULTS
57
And therefore in labour productivity terms
QLP KD MFPL
•• • •⎛ ⎞= = +⎜ ⎟
⎝ ⎠ (5.5)
where MFP•
is MFP growth adjusted for capitalising intangibles and capital
deepening KD•
is combined tangible and intangible capital deepening.
On the output side, the size of the effect on labour productivity growth from capitalising intangibles will depend on the size of intangibles investment relative to total output and the growth rate of intangibles relative to other output.
QLPL
•• ⎛ ⎞= =⎜ ⎟
⎝ ⎠ N
Q • N
L
•⎛ ⎞⎜ ⎟⎝ ⎠
′ • QL
•′⎛ ⎞
⎜ ⎟⎝ ⎠
(5.6)
If growth in intangible investment is higher (lower) than growth in other output, then total output growth, and therefore labour productivity growth, will increase (decrease) with the inclusion of intangibles.3 The magnitude of this effect will depend on the size of intangibles investment as a share of total output.
On the input side, treating intangibles as capital affects capital deepening and MFP growth as the residual.
Total capital deepening including intangible capital becomes
K RK RKD s sL L
• •• ⎛ ⎞ ⎛ ⎞= +⎜ ⎟ ⎜ ⎟
⎝ ⎠ ⎝ ⎠ (5.7)
where KD•
is the tangible capital income share weighted growth in tangible capital relative to labour plus the intangible capital income share weighted growth in intangibles relative to labour.
3 Growth in labour inputs will not change with the treatment of intangibles as capital, so labour
productivity growth will only change if output growth is affected.
Other output as a share of total output
Growth in other output relative to labour
Intangible investment as a share of total output
Growth in intangible investment relative to labour
58 INTANGIBLE ASSETS AND AUSTRALIA'S PRODUCTIVITY
The income shares Rs and Ks are
K K K R Ls P K /(P K P R P L)≡ + + and (5.8)
R R K R Ls P R /(P K P R P L)≡ + + ( iP is the price of input i ) (5.9)
With the inclusion of intangible capital, the total capital income share increases ( K R Ks s s′+ > ).
The effect of including intangible capital on the rate of capital deepening depends on both the increase in the total capital income share and the growth in intangible capital inputs relative to the growth in tangible assets.
MFP growth as the residual is derived as
MFP = LP KD• • •
− (5.10)
The treatment of intangibles as capital affects both inputs and output, so the direction of the effect on MFP growth depends on the relative size of the output and input effects. If the inclusion of intangible capital increases the rate of capital deepening by more (less) than it increases the rate of labour productivity growth, MFP growth will fall (rise).
Impact of intangibles on growth accounting components
This section shows the relative changes to the components of the production function due to capitalising intangibles. As explained above, capitalising intangible assets will affect several components of the production function and each of these will affect the productivity results. The components are examined in turn for the period 1974-75 to 2005-06 (and three sub-periods covering decades ending 1984-85, 1994-95 and 2005-06.)
Output
Market sector gross value added (GVA) is the output measure used for the growth accounting. Figure 5.1 compares market sector GVA for each of the three definitions of capital — including investment in all intangible assets, including national accounts intangibles and excluding all intangibles. As reported in chapter 3 (table 3.2), investment in the new intangible assets is larger than investment in the national accounts intangible assets (software, mineral exploration and artistic originals). Therefore the new intangible assets represent a much larger proportion of total GVA (including all intangible investment) than the national accounts intangibles. And intangibles in total have grown as a percentage of GVA.
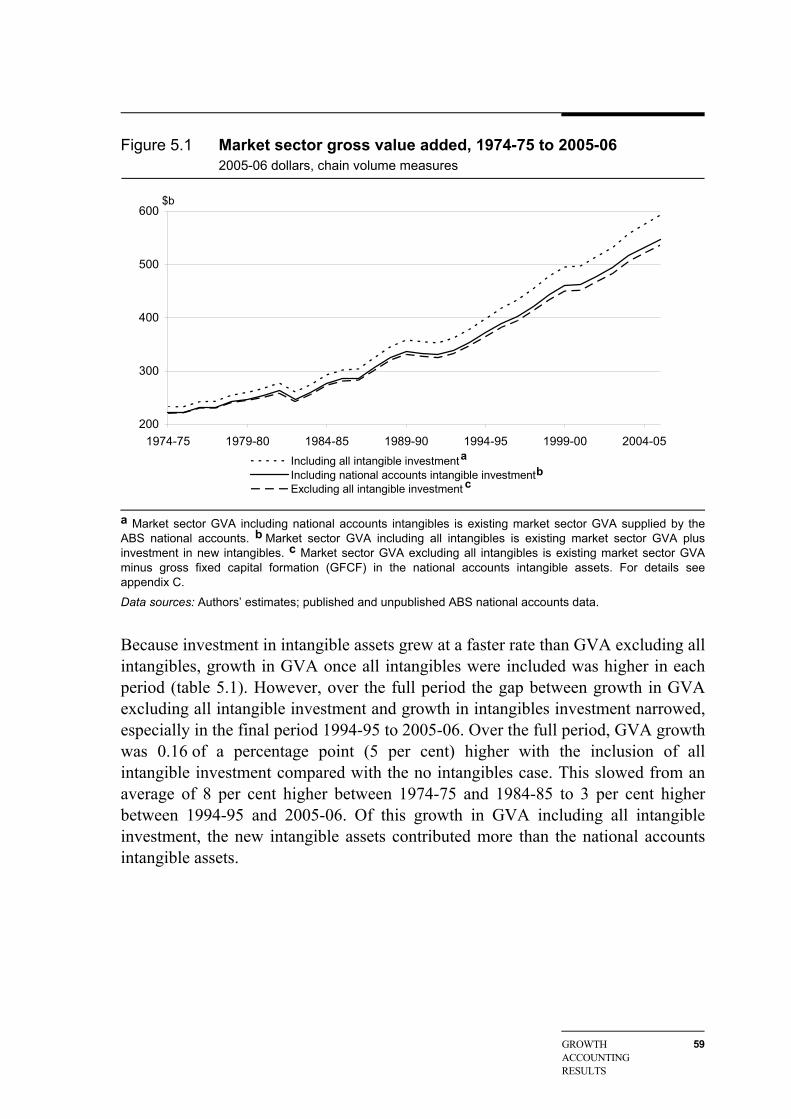
GROWTH ACCOUNTING RESULTS
59
Figure 5.1 Market sector gross value added, 1974-75 to 2005-06 2005-06 dollars, chain volume measures
200
300
400
500
600
1974-75 1979-80 1984-85 1989-90 1994-95 1999-00 2004-05Including all intangible investmentIncluding national accounts intangible investmentExcluding all intangible investment
a b
c
$b
a Market sector GVA including national accounts intangibles is existing market sector GVA supplied by the ABS national accounts. b Market sector GVA including all intangibles is existing market sector GVA plus investment in new intangibles. c Market sector GVA excluding all intangibles is existing market sector GVA minus gross fixed capital formation (GFCF) in the national accounts intangible assets. For details see appendix C.
Data sources: Authors’ estimates; published and unpublished ABS national accounts data.
Because investment in intangible assets grew at a faster rate than GVA excluding all intangibles, growth in GVA once all intangibles were included was higher in each period (table 5.1). However, over the full period the gap between growth in GVA excluding all intangible investment and growth in intangibles investment narrowed, especially in the final period 1994-95 to 2005-06. Over the full period, GVA growth was 0.16 of a percentage point (5 per cent) higher with the inclusion of all intangible investment compared with the no intangibles case. This slowed from an average of 8 per cent higher between 1974-75 and 1984-85 to 3 per cent higher between 1994-95 and 2005-06. Of this growth in GVA including all intangible investment, the new intangible assets contributed more than the national accounts intangible assets.
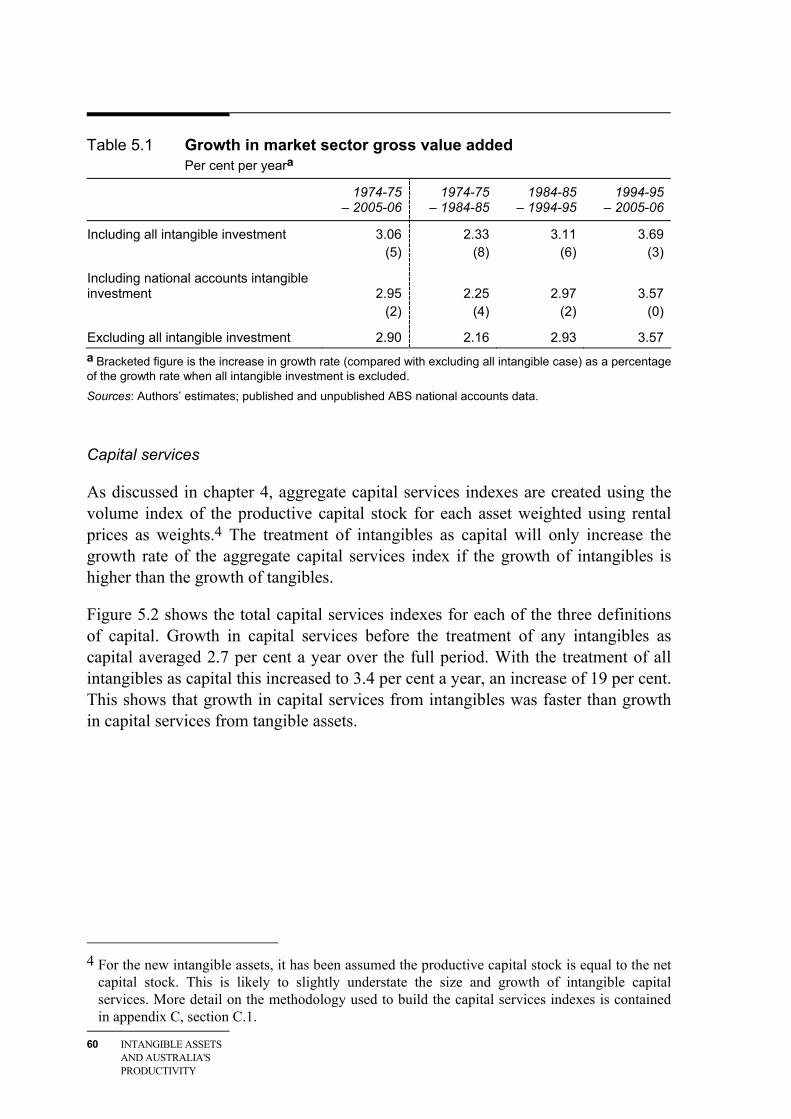
60 INTANGIBLE ASSETS AND AUSTRALIA'S PRODUCTIVITY
Table 5.1 Growth in market sector gross value added Per cent per yeara
1974-75 – 2005-06
1974-75 – 1984-85
1984-85 – 1994-95
1994-95 – 2005-06
Including all intangible investment 3.06 2.33 3.11 3.69 (5) (8) (6) (3)
Including national accounts intangible investment 2.95 2.25 2.97 3.57 (2) (4) (2) (0)
Excluding all intangible investment 2.90 2.16 2.93 3.57 a Bracketed figure is the increase in growth rate (compared with excluding all intangible case) as a percentage of the growth rate when all intangible investment is excluded.
Sources: Authors’ estimates; published and unpublished ABS national accounts data.
Capital services
As discussed in chapter 4, aggregate capital services indexes are created using the volume index of the productive capital stock for each asset weighted using rental prices as weights.4 The treatment of intangibles as capital will only increase the growth rate of the aggregate capital services index if the growth of intangibles is higher than the growth of tangibles.
Figure 5.2 shows the total capital services indexes for each of the three definitions of capital. Growth in capital services before the treatment of any intangibles as capital averaged 2.7 per cent a year over the full period. With the treatment of all intangibles as capital this increased to 3.4 per cent a year, an increase of 19 per cent. This shows that growth in capital services from intangibles was faster than growth in capital services from tangible assets.
4 For the new intangible assets, it has been assumed the productive capital stock is equal to the net
capital stock. This is likely to slightly understate the size and growth of intangible capital services. More detail on the methodology used to build the capital services indexes is contained in appendix C, section C.1.
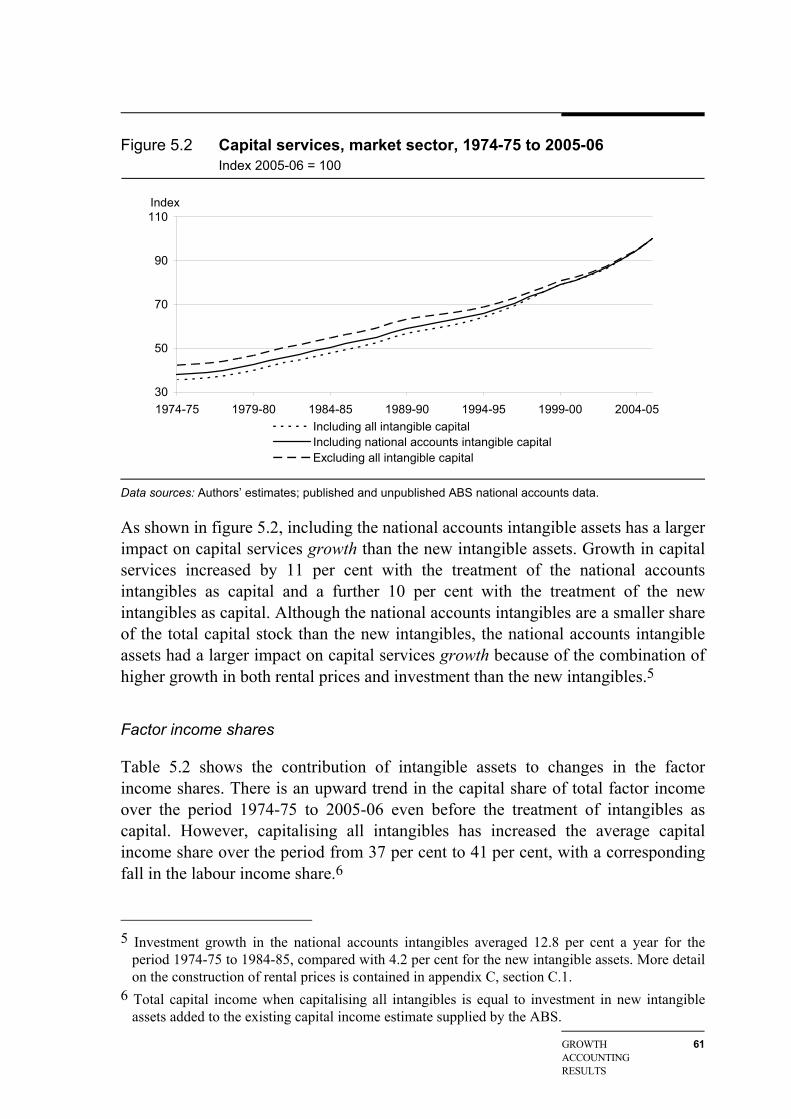
GROWTH ACCOUNTING RESULTS
61
Figure 5.2 Capital services, market sector, 1974-75 to 2005-06 Index 2005-06 = 100
30
50
70
90
110
1974-75 1979-80 1984-85 1989-90 1994-95 1999-00 2004-05Including all intangible capitalIncluding national accounts intangible capitalExcluding all intangible capital
Index
Data sources: Authors’ estimates; published and unpublished ABS national accounts data.
As shown in figure 5.2, including the national accounts intangible assets has a larger impact on capital services growth than the new intangible assets. Growth in capital services increased by 11 per cent with the treatment of the national accounts intangibles as capital and a further 10 per cent with the treatment of the new intangibles as capital. Although the national accounts intangibles are a smaller share of the total capital stock than the new intangibles, the national accounts intangible assets had a larger impact on capital services growth because of the combination of higher growth in both rental prices and investment than the new intangibles.5
Factor income shares
Table 5.2 shows the contribution of intangible assets to changes in the factor income shares. There is an upward trend in the capital share of total factor income over the period 1974-75 to 2005-06 even before the treatment of intangibles as capital. However, capitalising all intangibles has increased the average capital income share over the period from 37 per cent to 41 per cent, with a corresponding fall in the labour income share.6
5 Investment growth in the national accounts intangibles averaged 12.8 per cent a year for the
period 1974-75 to 1984-85, compared with 4.2 per cent for the new intangible assets. More detail on the construction of rental prices is contained in appendix C, section C.1.
6 Total capital income when capitalising all intangibles is equal to investment in new intangible assets added to the existing capital income estimate supplied by the ABS.
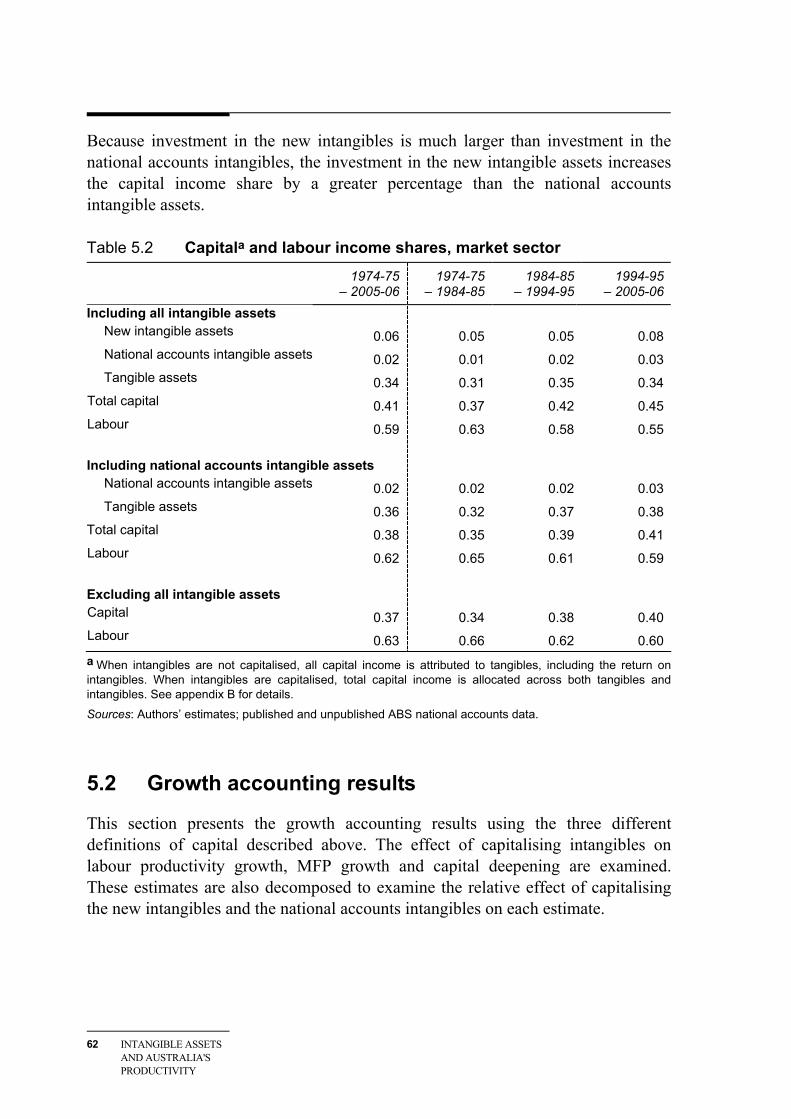
62 INTANGIBLE ASSETS AND AUSTRALIA'S PRODUCTIVITY
Because investment in the new intangibles is much larger than investment in the national accounts intangibles, the investment in the new intangible assets increases the capital income share by a greater percentage than the national accounts intangible assets.
Table 5.2 Capitala and labour income shares, market sector 1974-75
– 2005-06 1974-75
– 1984-85 1984-85
– 1994-95 1994-95
– 2005-06 Including all intangible assets
New intangible assets 0.06 0.05 0.05 0.08 National accounts intangible assets 0.02 0.01 0.02 0.03 Tangible assets 0.34 0.31 0.35 0.34
Total capital 0.41 0.37 0.42 0.45 Labour 0.59 0.63 0.58 0.55
Including national accounts intangible assets National accounts intangible assets 0.02 0.02 0.02 0.03 Tangible assets 0.36 0.32 0.37 0.38
Total capital 0.38 0.35 0.39 0.41 Labour 0.62 0.65 0.61 0.59
Excluding all intangible assets Capital 0.37 0.34 0.38 0.40 Labour 0.63 0.66 0.62 0.60 a When intangibles are not capitalised, all capital income is attributed to tangibles, including the return on intangibles. When intangibles are capitalised, total capital income is allocated across both tangibles and intangibles. See appendix B for details.
Sources: Authors’ estimates; published and unpublished ABS national accounts data.
5.2 Growth accounting results
This section presents the growth accounting results using the three different definitions of capital described above. The effect of capitalising intangibles on labour productivity growth, MFP growth and capital deepening are examined. These estimates are also decomposed to examine the relative effect of capitalising the new intangibles and the national accounts intangibles on each estimate.
GROWTH ACCOUNTING RESULTS
63
Contribution of intangibles to labour productivity growth Table 5.3 shows the relative contributions of MFP growth and capital deepening to overall labour productivity growth (as specified in equation 5.5). Labour productivity for the case where all intangibles are treated as capital grew at a rate of 2.28 per cent a year between 1974-75 and 2005-06, compared with 2.12 per cent a year for the case where no intangibles are treated as capital — an increase of 0.16 of a percentage point, or around 8 per cent.
The relative contributions of capital deepening and MFP growth to labour productivity growth shifted after all intangibles were treated as capital, with the rate of capital deepening increasing while the contribution of MFP growth decreased.
Capital deepening after the inclusion of all intangible capital increased from 0.76 per cent a year to 1.08 per cent a year, or a 42 per cent increase (table 5.3). The contribution of MFP growth decreased from 1.36 per cent a year to 1.20 per cent, or a 12 per cent fall. The fall in the rate of MFP growth indicates that some labour productivity growth that was attributed to MFP growth before the capitalisation of intangibles was actually driven by capital deepening due to intangibles. This capital deepening was attributable largely to an increase in the capital income share from the inclusion of intangibles investment. An increase in the growth rate of the capital services index due to intangibles had a smaller, though still positive, effect on capital deepening.
Although on average over the full period MFP growth was lower and capital deepening higher after capitalising intangibles, the relative contributions of MFP growth and capital deepening to labour productivity growth shifted considerably across decades. For the first period, 1974-75 to 1984-85, MFP growth was virtually unchanged with the treatment of the national accounts intangibles as capital — including investment in these intangibles increased labour productivity growth by about the same amount as the increase in capital deepening.
Growth in labour productivity was at its lowest between 1984-85 and 1994-95, with most of the fall attributable to a decline in the rate of capital deepening, although MFP growth was also lower during this period. However, growth in investment in intangibles was still strong, so the inclusion of intangible capital almost doubled the rate of capital deepening when compared with the case where no intangible capital was included.
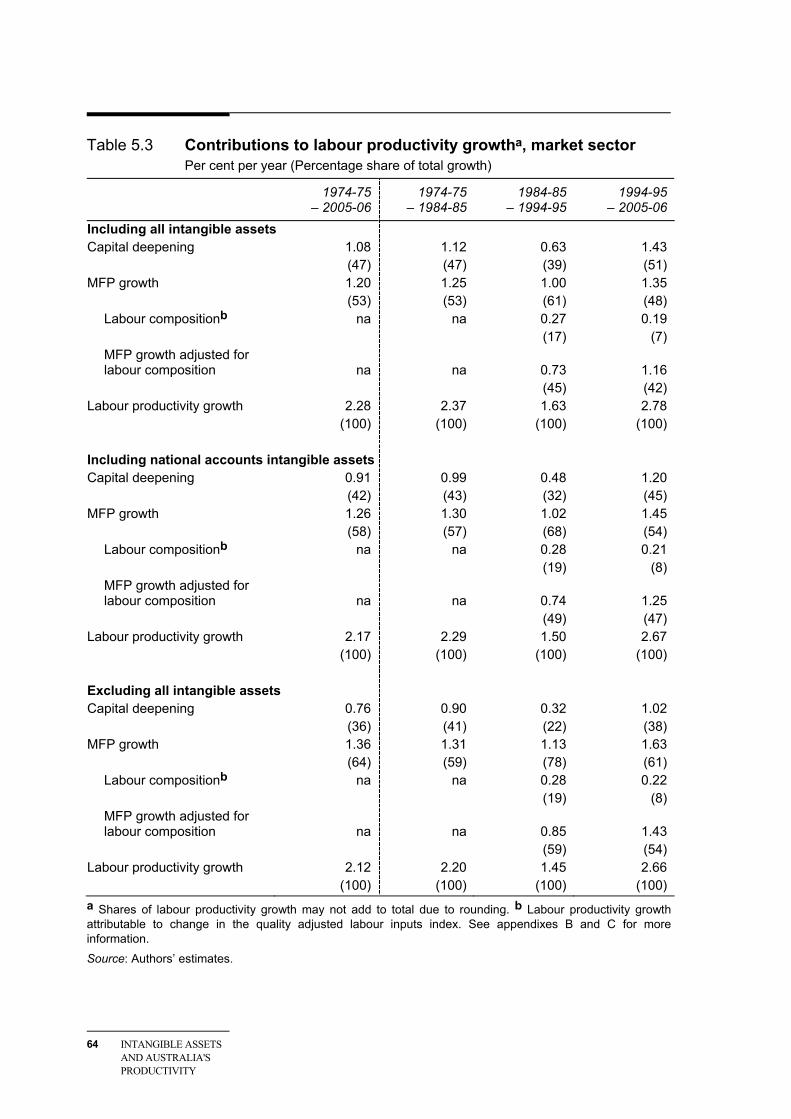
64 INTANGIBLE ASSETS AND AUSTRALIA'S PRODUCTIVITY
Table 5.3 Contributions to labour productivity growtha, market sector Per cent per year (Percentage share of total growth)
1974-75 – 2005-06
1974-75 – 1984-85
1984-85 – 1994-95
1994-95 – 2005-06
Including all intangible assets Capital deepening 1.08 1.12 0.63 1.43 (47) (47) (39) (51) MFP growth 1.20 1.25 1.00 1.35
(53) (53) (61) (48) Labour compositionb na na 0.27 0.19 (17) (7) MFP growth adjusted for labour composition na na 0.73 1.16
(45) (42) Labour productivity growth 2.28 2.37 1.63 2.78 (100) (100) (100) (100) Including national accounts intangible assets Capital deepening 0.91 0.99 0.48 1.20 (42) (43) (32) (45) MFP growth 1.26 1.30 1.02 1.45
(58) (57) (68) (54) Labour compositionb na na 0.28 0.21 (19) (8) MFP growth adjusted for labour composition na na 0.74 1.25 (49) (47)
Labour productivity growth 2.17 2.29 1.50 2.67 (100) (100) (100) (100)
Excluding all intangible assets Capital deepening 0.76 0.90 0.32 1.02 (36) (41) (22) (38) MFP growth 1.36 1.31 1.13 1.63 (64) (59) (78) (61)
Labour compositionb na na 0.28 0.22 (19) (8) MFP growth adjusted for labour composition na na 0.85 1.43
(59) (54) Labour productivity growth 2.12 2.20 1.45 2.66 (100) (100) (100) (100) a Shares of labour productivity growth may not add to total due to rounding. b Labour productivity growth attributable to change in the quality adjusted labour inputs index. See appendixes B and C for more information.
Source: Authors’ estimates.
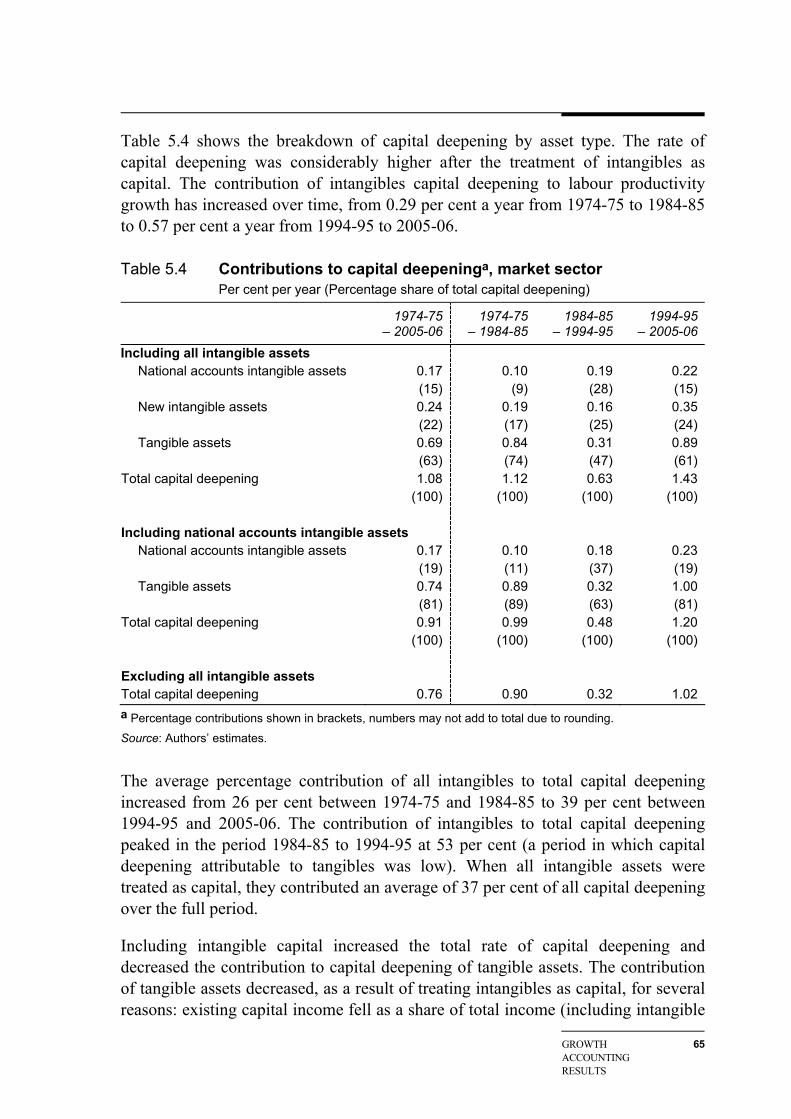
GROWTH ACCOUNTING RESULTS
65
Table 5.4 shows the breakdown of capital deepening by asset type. The rate of capital deepening was considerably higher after the treatment of intangibles as capital. The contribution of intangibles capital deepening to labour productivity growth has increased over time, from 0.29 per cent a year from 1974-75 to 1984-85 to 0.57 per cent a year from 1994-95 to 2005-06.
Table 5.4 Contributions to capital deepeninga, market sector Per cent per year (Percentage share of total capital deepening)
1974-75 – 2005-06
1974-75 – 1984-85
1984-85 – 1994-95
1994-95 – 2005-06
Including all intangible assets National accounts intangible assets 0.17 0.10 0.19 0.22 (15) (9) (28) (15) New intangible assets 0.24 0.19 0.16 0.35 (22) (17) (25) (24) Tangible assets 0.69 0.84 0.31 0.89
(63) (74) (47) (61) Total capital deepening 1.08 1.12 0.63 1.43 (100) (100) (100) (100) Including national accounts intangible assets
National accounts intangible assets 0.17 0.10 0.18 0.23 (19) (11) (37) (19) Tangible assets 0.74 0.89 0.32 1.00
(81) (89) (63) (81) Total capital deepening 0.91 0.99 0.48 1.20 (100) (100) (100) (100) Excluding all intangible assets Total capital deepening 0.76 0.90 0.32 1.02 a Percentage contributions shown in brackets, numbers may not add to total due to rounding.
Source: Authors’ estimates.
The average percentage contribution of all intangibles to total capital deepening increased from 26 per cent between 1974-75 and 1984-85 to 39 per cent between 1994-95 and 2005-06. The contribution of intangibles to total capital deepening peaked in the period 1984-85 to 1994-95 at 53 per cent (a period in which capital deepening attributable to tangibles was low). When all intangible assets were treated as capital, they contributed an average of 37 per cent of all capital deepening over the full period.
Including intangible capital increased the total rate of capital deepening and decreased the contribution to capital deepening of tangible assets. The contribution of tangible assets decreased, as a result of treating intangibles as capital, for several reasons: existing capital income fell as a share of total income (including intangible
66 INTANGIBLE ASSETS AND AUSTRALIA'S PRODUCTIVITY
investment); a portion of existing capital income (previously attributed to tangibles) was redistributed to intangibles as a result of the reweighting of capital income shares for each asset7; and the rental prices for tangibles also changed.8
The justification for the redistribution of a portion of existing capital income from tangibles to intangibles is that some capital income that is currently attributed to tangible assets is actually a return on unmeasured intangible capital.
Comparing the impact of the new and existing intangibles
The new intangible assets and the national accounts intangible assets had different effects on the rate of capital deepening and MFP growth.
Growth in total investment in the national accounts intangible assets is higher than growth in investment in the new intangible assets. However, the level of investment in the new intangibles is much higher than that of the national accounts intangibles. The new intangibles have a greater effect on adjusted GVA growth because they represent a higher share of total investment, even though growth in investment in the new intangibles is lower than that of the national accounts intangibles.
Capitalising the new intangibles also has a bigger impact on the rate of capital deepening than that of the national accounts intangibles. Most of this difference is caused by the new intangibles increasing the rate of capital deepening through a larger increase in the capital income share.9
The rate of MFP growth is determined by the ratio of capital deepening to growth in labour productivity. The new intangible assets had a similar impact on the rate of capital deepening and labour productivity growth, meaning the impact on MFP growth was limited. However, including the national accounts intangibles as capital increased the rate of capital deepening by more than it increased the rate of labour productivity growth, leading to a larger relative impact on MFP growth.
7 Capital income is split between assets based on the rental price weight of each asset. The
treatment of intangibles as capital reduced the rental price weight of the tangible assets. Therefore tangible assets had a lower share of total capital income attributed to them.
8 There are several components of the rental price equation, including the equalising rate of return across all assets, that will change for national accounts tangible assets after capitalising intangibles. More detail on these changes are included in appendix C.
9 The rate of capital deepening can also be increased by an increase in the growth of the aggregate capital services, but this change is usually smaller than that caused by the increased capital income share.
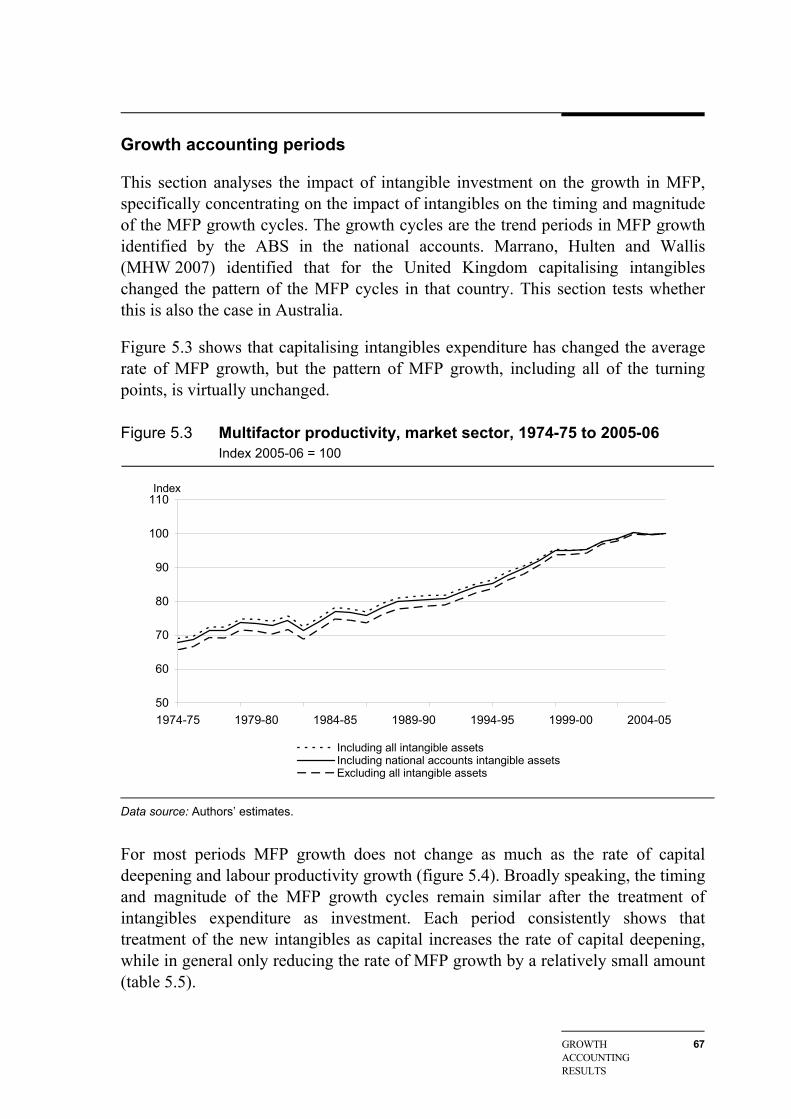
GROWTH ACCOUNTING RESULTS
67
Growth accounting periods
This section analyses the impact of intangible investment on the growth in MFP, specifically concentrating on the impact of intangibles on the timing and magnitude of the MFP growth cycles. The growth cycles are the trend periods in MFP growth identified by the ABS in the national accounts. Marrano, Hulten and Wallis (MHW 2007) identified that for the United Kingdom capitalising intangibles changed the pattern of the MFP cycles in that country. This section tests whether this is also the case in Australia.
Figure 5.3 shows that capitalising intangibles expenditure has changed the average rate of MFP growth, but the pattern of MFP growth, including all of the turning points, is virtually unchanged.
Figure 5.3 Multifactor productivity, market sector, 1974-75 to 2005-06 Index 2005-06 = 100
50
60
70
80
90
100
110
1974-75 1979-80 1984-85 1989-90 1994-95 1999-00 2004-05
Including all intangible assetsIncluding national accounts intangible assetsExcluding all intangible assets
Index
Data source: Authors’ estimates.
For most periods MFP growth does not change as much as the rate of capital deepening and labour productivity growth (figure 5.4). Broadly speaking, the timing and magnitude of the MFP growth cycles remain similar after the treatment of intangibles expenditure as investment. Each period consistently shows that treatment of the new intangibles as capital increases the rate of capital deepening, while in general only reducing the rate of MFP growth by a relatively small amount (table 5.5).
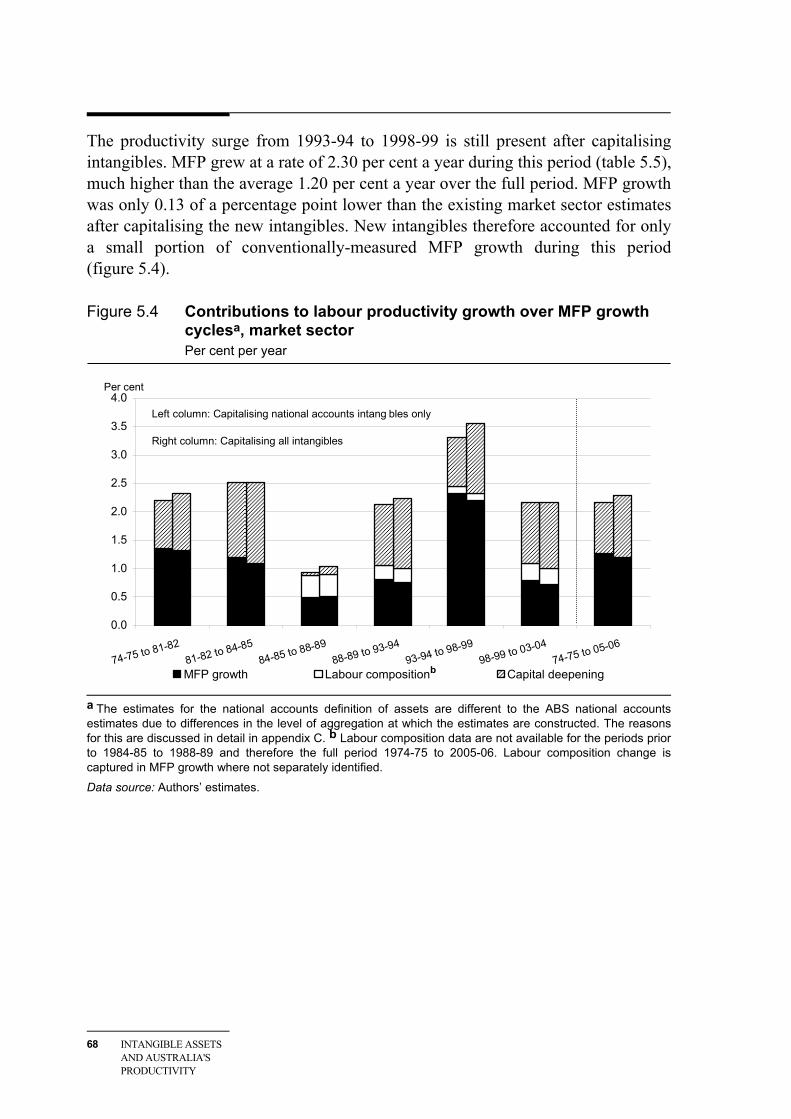
68 INTANGIBLE ASSETS AND AUSTRALIA'S PRODUCTIVITY
The productivity surge from 1993-94 to 1998-99 is still present after capitalising intangibles. MFP grew at a rate of 2.30 per cent a year during this period (table 5.5), much higher than the average 1.20 per cent a year over the full period. MFP growth was only 0.13 of a percentage point lower than the existing market sector estimates after capitalising the new intangibles. New intangibles therefore accounted for only a small portion of conventionally-measured MFP growth during this period (figure 5.4).
Figure 5.4 Contributions to labour productivity growth over MFP growth cyclesa, market sector Per cent per year
0.0
0.5
1.0
1.5
2.0
2.5
3.0
3.5
4.0
74-75 to 81-8281-82 to 84-85
84-85 to 88-8988-89 to 93-94
93-94 to 98-9998-99 to 03-04
74-75 to 05-06
MFP growth Labour composition Capital deepening
Left column: Capitalising national accounts intang bles only
Right column: Capitalising all intangibles
Per cent
b
a The estimates for the national accounts definition of assets are different to the ABS national accounts estimates due to differences in the level of aggregation at which the estimates are constructed. The reasons for this are discussed in detail in appendix C. b Labour composition data are not available for the periods prior to 1984-85 to 1988-89 and therefore the full period 1974-75 to 2005-06. Labour composition change is captured in MFP growth where not separately identified.
Data source: Authors’ estimates.
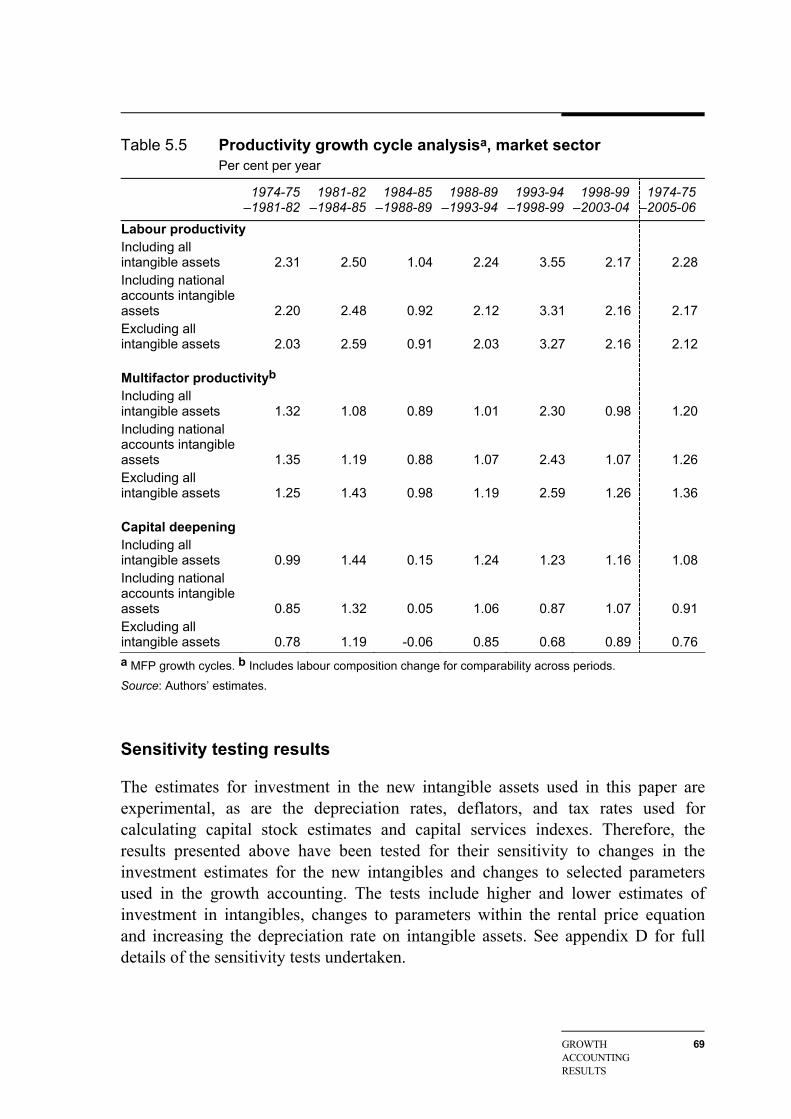
GROWTH ACCOUNTING RESULTS
69
Table 5.5 Productivity growth cycle analysisa, market sector Per cent per year
1974-75 –1981-82
1981-82–1984-85
1984-85–1988-89
1988-89–1993-94
1993-94 –1998-99
1998-99 –2003-04
1974-75–2005-06
Labour productivity Including all intangible assets 2.31 2.50 1.04 2.24 3.55 2.17 2.28 Including national accounts intangible assets 2.20 2.48 0.92 2.12 3.31 2.16 2.17 Excluding all intangible assets 2.03 2.59 0.91 2.03 3.27 2.16 2.12
Multifactor productivityb Including all intangible assets 1.32 1.08 0.89 1.01 2.30 0.98 1.20 Including national accounts intangible assets 1.35 1.19 0.88 1.07 2.43 1.07 1.26 Excluding all intangible assets 1.25 1.43 0.98 1.19 2.59 1.26 1.36
Capital deepening Including all intangible assets 0.99 1.44 0.15 1.24 1.23 1.16 1.08 Including national accounts intangible assets 0.85 1.32 0.05 1.06 0.87 1.07 0.91 Excluding all intangible assets 0.78 1.19 -0.06 0.85 0.68 0.89 0.76 a MFP growth cycles. b Includes labour composition change for comparability across periods.
Source: Authors’ estimates.
Sensitivity testing results
The estimates for investment in the new intangible assets used in this paper are experimental, as are the depreciation rates, deflators, and tax rates used for calculating capital stock estimates and capital services indexes. Therefore, the results presented above have been tested for their sensitivity to changes in the investment estimates for the new intangibles and changes to selected parameters used in the growth accounting. The tests include higher and lower estimates of investment in intangibles, changes to parameters within the rental price equation and increasing the depreciation rate on intangible assets. See appendix D for full details of the sensitivity tests undertaken.
70 INTANGIBLE ASSETS AND AUSTRALIA'S PRODUCTIVITY
The tests show that the main results of the growth accounting are robust to most of the changes trialled. This is consistent with the results of similar sensitivity tests undertaken by MHW (2007) and Fukao et al. (2008b). The only test to produce a large change in the estimates was the use of a purely endogenous rate of return rather than using the ABS methodology (which has been used for comparability with ABS results).10 The change in results was consistent across each of the three capital definitions. Therefore the effect is not important when measuring the relative impact of capitalising different groups of intangible assets. However, because some overseas studies use endogenous rates of return, the international comparability is affected by the use of the exogenous floor rate of return. The use of the endogenous rate returns a change in Australian growth accounting results as a result of capitalising all intangibles that is closer to that estimated for the United States by Corrado, Hulten and Sichel (CHS 2006).
10 The ABS methodology uses an endogenous rate of return unless the endogenous rate falls below
the level of consumer price index (CPI) growth plus 4 per cent. If the rate falls below this level, CPI growth plus 4 per cent is used as the rate of return. In practice the rate of return, which was constrained to be the same across all assets, rarely fell below this mark and can therefore be considered to be an exogenous rate of return for most years. This differs from the CHS (2006) methodology, which used a purely endogenous rate of return.
INTERNATIONAL COMPARISONS
71
6 International comparisons
This chapter examines the estimates of Australian intangibles in an international context. As noted in earlier chapters, the Corrado, Hulten and Sichel (CHS) methodology has also been used to measure intangible investment and its effect on productivity for the United States, the United Kingdom, Japan, Finland, the Netherlands, France, Germany, Italy and Spain, and intangible investment only for Canada.1
Estimates based on the same methodology provide a reasonable basis for making international comparisons. However, there are a few points to note about the comparisons in this chapter.
• National statistical systems differ from country to country and this affects comparability of the underlying data. (Differences in data sources are discussed in appendix A.)
• Although the basic methodology for measuring intangibles is quite similar, data limitations have led to some differences in its application across countries. (These are noted in the comparisons below.)
• The implementation of the growth accounting differs across countries. For example, the US and UK results use capital services indexes based on endogenous rates of return, while the results for the Netherlands are based on an exogenous rate of return. Results for Australia have been estimated using an endogenous rate of return with a exogenous floor rate of return (which in practice leads to an exogenous rate in the majority of years) and sensitivity tested using a purely endogenous rate.
• The proportion of the total economy for which intangibles is measured is different in each country — the market sector for Australia (62 per cent of the total economy); the market economy for France (65 per cent), Germany (70 per cent), Italy (72 per cent) and Spain (75 per cent); the non-financial business
1 The United States in CHS (2005, 2006), the United Kingdom in Marrano and Haskel (MH 2006)
and Marrano, Haskel and Wallis (MHW 2007), Japan in Fukao et al. (2007) and Fukao et al. (2008b), Finland in Jalava, Aulin-Ahmavaara and Alanen (JAA 2007), the Netherlands in van Rooijen-Horsten, van den Bergen and Tanriseven (RBT 2008) and van Rooijen-Horsten et al. (2008), France, Germany, Italy and Spain in Hao, Manole and van Ark (2008) and Canada in Belhocine (2008).
72 INTANGIBLE ASSETS AND AUSTRALIA'S PRODUCTIVITY
sector for Finland (72 per cent); the non-farm business sector for the United States (77 per cent); the market sector for the United Kingdom (89 per cent); and the whole economy for the Netherlands2, Canada and Japan (100 per cent).3 Data availability is one reason for this. The other reason is that the focus of the studies is on identifying the contribution of intangibles in measured MFP, and MFP is measured for different sectors of the economy in each country.
• The estimates do not cover the same time period for each country. This limits the comparability and the ability to examine differences between sub-periods.
• The periods for which data are available do not necessarily coincide with the peak-to-peak growth periods4 that provide the most accurate view of growth.
There are also a number of other points to note about the interpretation of the international comparisons in this chapter.
• In addition to the differences in application of the methodology across countries, the limitations of the underlying methodology also mean that the relativities between countries are only indicative. (For example, the proportions of intangible expenditure that are treated as investment are assumed because of limited information and are uniform across countries.)
• Country-specific circumstances will affect the appropriate level and type of intangible investment for a particular country — the country with the highest ratio of intangibles to output should not be regarded as a benchmark. As with any other investment, it is allocative efficiency that counts for maximising its benefits for productivity and living standards. More is not necessarily better.
• The growth accounting approach does not provide information about the causal links between intangible investment and productivity growth.
2 In some cases, data are available for the commercial sector as well as the total economy for the
Netherlands. However, the estimates reported in van Rooijen-Horsten et al. (2008) for the commercial sector are less disaggregated by intangible type than those for the total economy. Therefore section 6.1 focuses on the total economy results, while the growth accounting results in section 6.2 are for the commercial sector.
3 Australian market sector share of gross value added (GVA) at basic prices in 2005-06 (ABS Cat. no. 5204.0); US non-farm business GVA as a share GDP in 1998–2000 (BEA 2008); UK market sector share of GVA at basic prices in 2004 (ONS 2006); Finnish non-financial business sector share of GVA at basic prices in 2005 (Statistics Finland 2008); and France, Germany, Italy and Spain market economy share of value added at basic prices in 2004 (EU KLEMS 2008). These shares are only indicative as they are measured on varying bases and use recent national accounts data — due to revisions this data may differ from that which underlies the intangibles estimates in the individual country studies.
4 Calculating productivity trends from ‘peak to peak’ is one way of overcoming the spurious influences of business cycles in estimates of productivity growth. Business cycles will affect the utilisation of existing capital stocks but because of insufficient information, productivity estimates are based on the assumption of constant utilisation of capital.
INTERNATIONAL COMPARISONS
73
6.1 Intangible investment as a share of output
To compare the importance of intangible investment across countries, it is necessary to scale this investment to a common measure, for example, output. Intangible investment as a percentage of GDP was reported in each of the country studies and has therefore been estimated for Australia (table 6.1). Based on this measure, Australia has a relatively low proportion of intangible investment to output — about half that of the United States and Japan, 56 per cent of the United Kingdom, 60 per cent of Canada, 65 per cent of Finland, 70 per cent of the Netherlands5, 71 per cent of France and 83 per cent of Germany. Australia has a higher proportion than Spain and Italy (by 13 per cent).
This provides one perspective on the relativities between countries. However, it is distorted to some extent because, as noted above, the proportion of the total economy for which investment has been measured differs across countries. An alternative perspective is to consider intangible investment as a percentage of output of the sector for which the investment is estimated — that is, intangible investment as a percentage of the output it is used to produce. From this perspective, Australia’s relative position rises.
Table 6.2 shows intangible investment as a share of the adjusted output (including investment in intangibles) of the sector for which intangibles are measured6 — the market sector for Australia, the United Kingdom, France, Germany, Italy and Spain, non-farm business sector for the United States, the non-financial business sector for Finland, and the total economy for Japan, the Netherlands and Canada. The intangible investment share for Australia increases to 66 per cent of that for Finland, 71 per cent of the United States, 74 per cent of the United Kingdom, 76 per cent of France, 91 per cent of Japan, and 95 per cent of Germany. Australia also has a higher share than Canada (by 5 per cent), the Netherlands (by 22 per cent)7, Italy (by 30 per cent) and Spain (by 32 per cent).
5 This percentage rises to 82 per cent if the results for the commercial sector of the Netherlands are
used for comparison. 6 Estimates have been derived using a number of sources with some variation in measures
remaining (see notes to table 6.2) and may therefore be only indicative. 7 This percentage falls to 3 per cent higher if the result for the commercial sector of the
Netherlands is used for comparison.
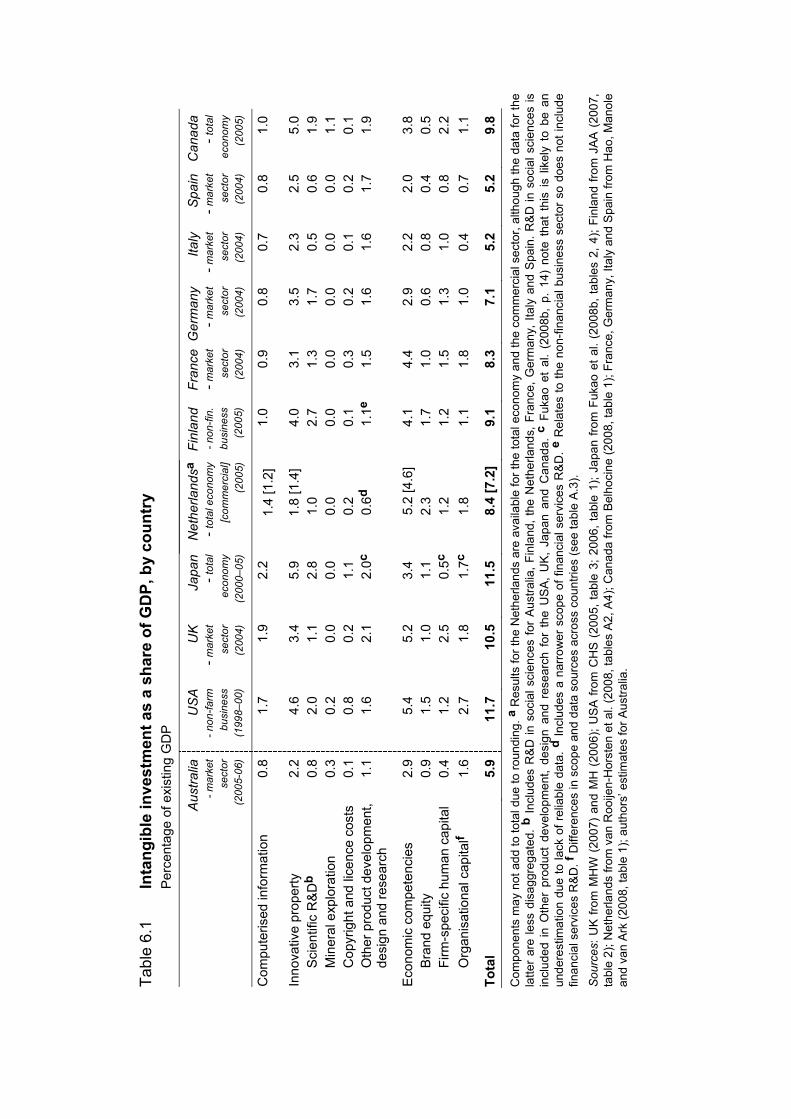
Tabl
e 6.
1 In
tang
ible
inve
stm
ent a
s a
shar
e of
GD
P, b
y co
untr
y
Per
cent
age
of e
xist
ing
GD
P
Aus
tralia
- m
arke
t se
ctor
(2
005-
06)
US
A -
non-
farm
bu
sine
ss
(199
8–00
)
UK
- mar
ket
sect
or(2
004)
Japa
n- t
otal
ec
onom
y (2
000–
05)
Net
herla
ndsa
- tot
al e
cono
my
[com
mer
cial
](2
005)
Finl
and
- non
-fin.
bu
sine
ss
(200
5)
Fran
ce- m
arke
t se
ctor
(200
4)
Ger
man
y- m
arke
t se
ctor
(200
4)
Italy
- mar
ket
sect
or(2
004)
Spa
in- m
arke
t se
ctor
(200
4)
Can
ada
- tot
al
econ
omy
(200
5)
Com
pute
rised
info
rmat
ion
0.
8 1.
7 1.
9 2.
2 1.
4 [1
.2]
1.0
0.9
0.8
0.7
0.8
1.0
Inno
vativ
e pr
oper
ty
2.
2 4.
6 3.
4 5.
9 1.
8 [1
.4]
4.0
3.1
3.5
2.3
2.5
5.0
Sci
entif
ic R
&Db
0.8
2.0
1.1
2.8
1.0
2.7
1.3
1.7
0.5
0.6
1.9
Min
eral
exp
lora
tion
0.3
0.2
0.0
0.0
0.0
0.0
0.0
0.0
0.0
0.0
1.1
Cop
yrig
ht a
nd li
cenc
e co
sts
0.1
0.8
0.2
1.1
0.2
0.1
0.3
0.2
0.1
0.2
0.1
Oth
er p
rodu
ct d
evel
opm
ent,
desi
gn a
nd re
sear
ch
1.1
1.6
2.1
2.0c
0.6d
1.
1e1.
5 1.
6 1.
6 1.
7 1.
9
Eco
nom
ic c
ompe
tenc
ies
2.
9 5.
4 5.
2 3.
4 5.
2 [4
.6]
4.1
4.4
2.9
2.2
2.0
3.8
Bra
nd e
quity
0.
9 1.
5 1.
0 1.
1 2.
3 1.
7 1.
0 0.
6 0.
8 0.
4 0.
5 Fi
rm-s
peci
fic h
uman
cap
ital
0.4
1.2
2.5
0.5c
1.2
1.2
1.5
1.3
1.0
0.8
2.2
Org
anis
atio
nal c
apita
lf 1.
6 2.
7 1.
8 1.
7c1.
8 1.
1 1.
8 1.
0 0.
4 0.
7 1.
1
Tota
l
5.9
11.7
10
.5
11.5
8.
4 [7
.2]
9.1
8.3
7.1
5.2
5.2
9.8
Com
pone
nts
may
not
add
to to
tal d
ue to
roun
ding
. a R
esul
ts fo
r the
Net
herla
nds
are
avai
labl
e fo
r the
tota
l eco
nom
y an
d th
e co
mm
erci
al s
ecto
r, al
thou
gh th
e da
ta fo
r the
la
tter
are
less
dis
aggr
egat
ed. b
Incl
udes
R&
D in
soc
ial s
cien
ces
for
Aus
tralia
, Fin
land
, the
Net
herla
nds,
Fra
nce,
Ger
man
y, It
aly
and
Spa
in. R
&D
in s
ocia
l sci
ence
s is
in
clud
ed i
n O
ther
pro
duct
dev
elop
men
t, de
sign
and
res
earc
h fo
r th
e U
SA
, U
K,
Japa
n an
d C
anad
a. c
Fuk
ao e
t al
. (2
008b
, p.
14)
not
e th
at t
his
is l
ikel
y to
be
an
unde
rest
imat
ion
due
to la
ck o
f rel
iabl
e da
ta. d
Incl
udes
a n
arro
wer
sco
pe o
f fin
anci
al s
ervi
ces
R&
D. e
Rel
ates
to th
e no
n-fin
anci
al b
usin
ess
sect
or s
o do
es n
ot in
clud
e fin
anci
al s
ervi
ces
R&
D. f
Diff
eren
ces
in s
cope
and
dat
a so
urce
s ac
ross
cou
ntrie
s (s
ee ta
ble
A.3
).
Sou
rces
: UK
from
MH
W (
2007
) an
d M
H (
2006
); U
SA
from
CH
S (
2005
, tab
le 3
; 200
6, ta
ble
1); J
apan
from
Fuk
ao e
t al.
(200
8b, t
able
s 2,
4);
Finl
and
from
JAA
(20
07,
tabl
e 2)
; Net
herla
nds
from
van
Roo
ijen-
Hor
sten
et a
l. (2
008,
tabl
es A
2, A
4); C
anad
a fro
m B
elho
cine
(200
8, ta
ble
1); F
ranc
e, G
erm
any,
Ital
y an
d S
pain
from
Hao
, Man
ole
and
van
Ark
(200
8, ta
ble
1); a
utho
rs’ e
stim
ates
for A
ustra
lia.
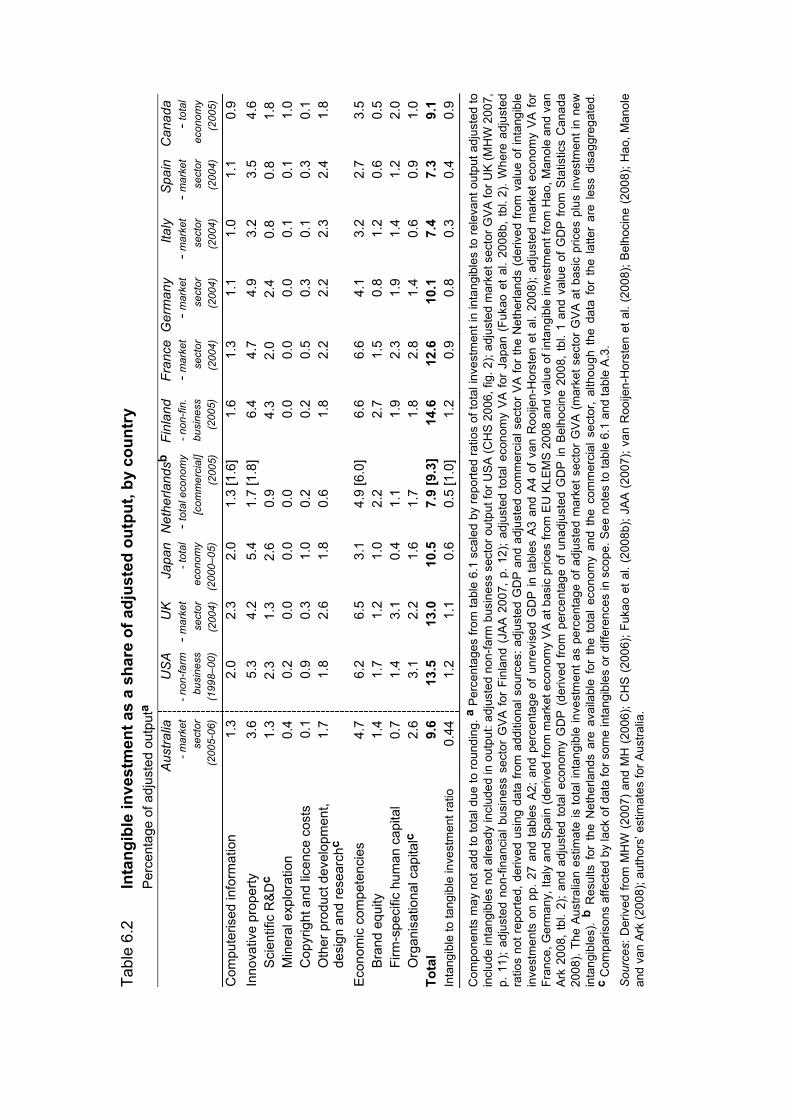
Tabl
e 6.
2 In
tang
ible
inve
stm
ent a
s a
shar
e of
adj
uste
d ou
tput
, by
coun
try
P
erce
ntag
e of
adj
uste
d ou
tput
a
Aus
tralia
- m
arke
t se
ctor
(2
005-
06)
US
A -
non-
farm
bu
sine
ss
(199
8–00
)
UK
- mar
ket
sect
or(2
004)
Japa
n- t
otal
ec
onom
y (2
000–
05)
Net
herla
ndsb
- tot
al e
cono
my
[com
mer
cial
](2
005)
Finl
and
- non
-fin.
bu
sine
ss
(200
5)
Fran
ce- m
arke
t se
ctor
(200
4)
Ger
man
y- m
arke
t se
ctor
(200
4)
Italy
- mar
ket
sect
or(2
004)
Spa
in- m
arke
t se
ctor
(200
4)
Can
ada
- tot
al
econ
omy
(200
5)
Com
pute
rised
info
rmat
ion
1.3
2.0
2.3
2.0
1.3
[1.6
] 1.
6 1.
3 1.
1 1.
0 1.
1 0.
9 In
nova
tive
prop
erty
3.
6 5.
3 4.
2 5.
4 1.
7 [1
.8]
6.4
4.7
4.9
3.2
3.5
4.6
Sci
entif
ic R
&Dc
1.3
2.3
1.3
2.6
0.9
4.3
2.0
2.4
0.8
0.8
1.8
Min
eral
exp
lora
tion
0.4
0.2
0.0
0.0
0.0
0.0
0.0
0.0
0.1
0.1
1.0
Cop
yrig
ht a
nd li
cenc
e co
sts
0.1
0.9
0.3
1.0
0.2
0.2
0.5
0.3
0.1
0.3
0.1
Oth
er p
rodu
ct d
evel
opm
ent,
de
sign
and
rese
arch
c 1.
7 1.
8 2.
6 1.
8 0.
6 1.
8 2.
2 2.
2 2.
3 2.
4 1.
8
Eco
nom
ic c
ompe
tenc
ies
4.7
6.2
6.5
3.1
4.9
[6.0
] 6.
6 6.
6 4.
1 3.
2 2.
7 3.
5 B
rand
equ
ity
1.4
1.7
1.2
1.0
2.2
2.7
1.5
0.8
1.2
0.6
0.5
Firm
-spe
cific
hum
an c
apita
l 0.
7 1.
4 3.
1 0.
4 1.
1 1.
9 2.
3 1.
9 1.
4 1.
2 2.
0 O
rgan
isat
iona
l cap
italc
2.
6 3.
1 2.
2 1.
6 1.
7 1.
8 2.
8 1.
4 0.
6 0.
9 1.
0 To
tal
9.6
13.5
13
.0
10.5
7.
9 [9
.3]
14.6
12
.6
10.1
7.
4 7.
3 9.
1 In
tang
ible
to ta
ngib
le in
vest
men
t rat
io
0.44
1.
2 1.
1 0.
6 0.
5 [1
.0]
1.2
0.9
0.8
0.3
0.4
0.9
Com
pone
nts
may
not
add
to to
tal d
ue to
roun
ding
. a P
erce
ntag
es fr
om ta
ble
6.1
scal
ed b
y re
porte
d ra
tios
of to
tal i
nves
tmen
t in
inta
ngib
les
to re
leva
nt o
utpu
t adj
uste
d to
in
clud
e in
tang
ible
s no
t alre
ady
incl
uded
in o
utpu
t: ad
just
ed n
on-fa
rm b
usin
ess
sect
or o
utpu
t for
US
A (C
HS
200
6, fi
g. 2
); ad
just
ed m
arke
t sec
tor G
VA
for U
K (M
HW
200
7,
p. 1
1); a
djus
ted
non-
finan
cial
bus
ines
s se
ctor
GV
A fo
r Fi
nlan
d (J
AA
200
7, p
. 12)
; adj
uste
d to
tal e
cono
my
VA
for
Jap
an (
Fuka
o et
al.
2008
b, tb
l. 2)
. Whe
re a
djus
ted
ratio
s no
t rep
orte
d, d
eriv
ed u
sing
dat
a fro
m a
dditi
onal
sou
rces
: adj
uste
d G
DP
and
adju
sted
com
mer
cial
sec
tor V
A fo
r the
Net
herla
nds
(der
ived
from
val
ue o
f int
angi
ble
inve
stm
ents
on
pp. 2
7 an
d ta
bles
A2;
and
per
cent
age
of u
nrev
ised
GD
P in
tab
les
A3 a
nd A
4 of
van
Roo
ijen-
Hor
sten
et
al. 2
008)
; adj
uste
d m
arke
t eco
nom
y VA
for
Fran
ce, G
erm
any,
Ital
y an
d S
pain
(der
ived
from
mar
ket e
cono
my
VA
at b
asic
pric
es fr
om E
U K
LEM
S 2
008
and
valu
e of
inta
ngib
le in
vest
men
t fro
m H
ao, M
anol
e an
d va
n A
rk 2
008,
tbl.
2); a
nd a
djus
ted
tota
l eco
nom
y G
DP
(de
rived
from
per
cent
age
of u
nadj
uste
d G
DP
in B
elho
cine
200
8, tb
l. 1
and
valu
e of
GD
P fr
om S
tatis
tics
Can
ada
2008
). Th
e A
ustra
lian
estim
ate
is to
tal i
ntan
gibl
e in
vest
men
t as
perc
enta
ge o
f adj
uste
d m
arke
t sec
tor
GV
A (
mar
ket s
ecto
r G
VA
at b
asic
pric
es p
lus
inve
stm
ent i
n ne
w
inta
ngib
les)
. b
Res
ults
for
the
Net
herla
nds
are
avai
labl
e fo
r th
e to
tal e
cono
my
and
the
com
mer
cial
sec
tor,
alth
ough
the
dat
a fo
r th
e la
tter
are
less
dis
aggr
egat
ed.
c C
ompa
rison
s af
fect
ed b
y la
ck o
f dat
a fo
r som
e in
tang
ible
s or
diff
eren
ces
in s
cope
. See
not
es to
tabl
e 6.
1 an
d ta
ble
A.3
.
Sou
rces
: Der
ived
from
MH
W (2
007)
and
MH
(200
6); C
HS
(20
06);
Fuka
o et
al.
(200
8b);
JAA
(200
7); v
an R
ooije
n-H
orst
en e
t al.
(200
8); B
elho
cine
(200
8); H
ao, M
anol
e an
d va
n A
rk (2
008)
; aut
hors
’ est
imat
es fo
r Aus
tralia
.
76 INTANGIBLE ASSETS AND AUSTRALIA'S PRODUCTIVITY
The ratio of intangible investment to tangible investment is around one for the United States, the United Kingdom, Canada, Finland, France and Germany but is around 0.5 for Japan, the Netherlands8, Italy, Spain and Australia. Fukao et al. (2008b) note that while this ratio is low for Japan, intangible investment as a share of GDP in Japan is not that far behind the United States. The lower ratio is attributed to considerably higher tangible investment in Japan, which has been explained as a consequence of their financial system.
In Japan, financial institutions such as banks play a major role in the provision of corporate funds and they typically require tangible assets as collateral to provide financing. As a result, Japanese firms have preferred to accumulate tangible assets which can be used as collateral. In addition, small firms have been hampered in their growth because they often possess insufficient tangible assets to increase borrowing. These mechanisms as a result of Japan’s financial system are likely to be important reasons why the ratio of intangible to tangible investment is low in Japan. (p. 7)
Australia’s lower ratio reflects both a lower rate of intangible investment and a relatively high rate of tangible investment to output (26 per cent). For example, the rate of tangible investment was lower in Japan and Italy (22 per cent); Netherlands and Finland (20 per cent); United States and Germany (18 per cent); and United Kingdom (17 per cent).9
There are remaining distortions in the international comparability of these estimates related to industry coverage and measurement issues for specific intangibles (see appendix A for details). The studies do not measure intangibles for the same group of industries in each case. If the rates of investment in intangibles differ across industries, the average rate will be affected by the differences in industry coverage across countries. And differences in the scope of the measures for individual intangibles, particularly computerised information, R&D in social sciences, other product development and purchased organisational capital, may partly explain differences between the rates of intangible investment in Australia compared with other countries. It has not been possible to determine the extent of any relative underestimation or overestimation.10
8 This is for the total Netherlands economy — for the commercial sector the ratio rises to one. 9 Gross fixed capital formation excluding software for the total economy as a share of total value
added (at basic prices) (EU KLEMS 2008) for the years in table 6.2. Equivalent data for Canada and Spain are not available from the EU KLEMS database.
10 The estimates for some of the other countries do not include the same coverage of intangibles (see notes to table 6.1 and appendix A). Sensitivity testing of the Australian results to the size of investment in particular intangibles is reported in appendix D.
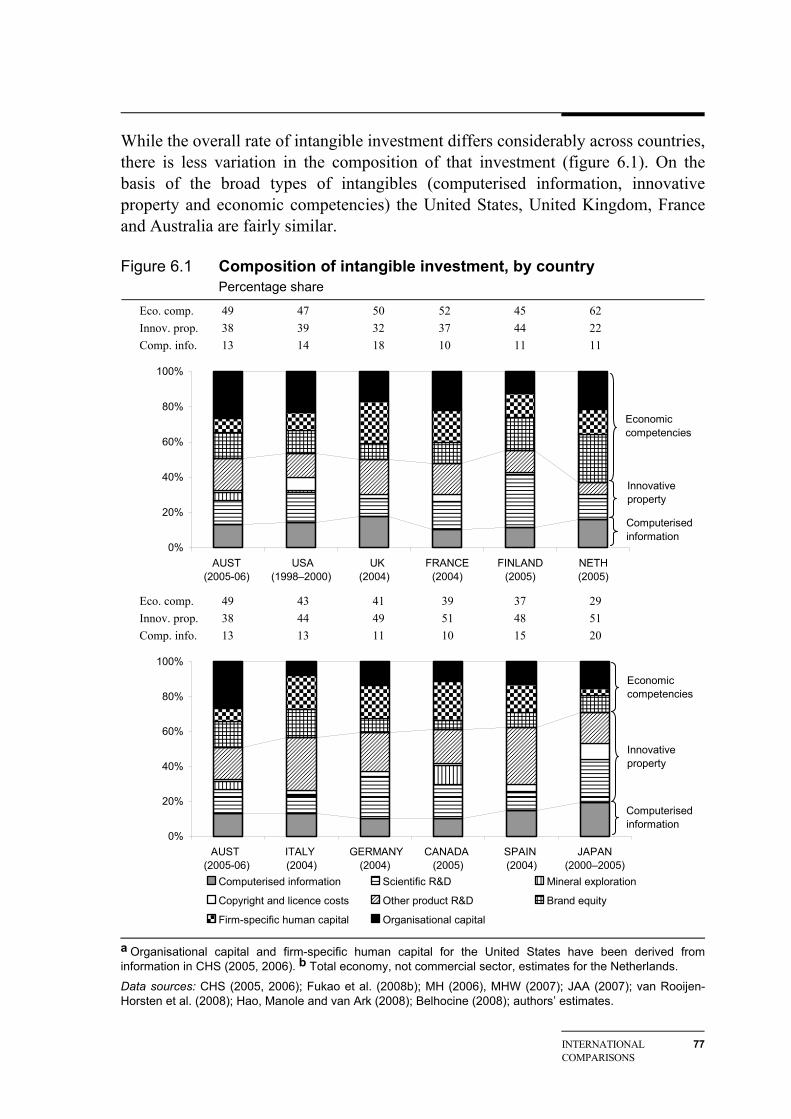
INTERNATIONAL COMPARISONS
77
While the overall rate of intangible investment differs considerably across countries, there is less variation in the composition of that investment (figure 6.1). On the basis of the broad types of intangibles (computerised information, innovative property and economic competencies) the United States, United Kingdom, France and Australia are fairly similar.
Figure 6.1 Composition of intangible investment, by country Percentage share
Eco. comp. 49 47 50 52 45 62 Innov. prop. 38 39 32 37 44 22 Comp. info. 13 14 18 10 11 11
0%
20%
40%
60%
80%
100%
AUST (2005-06)
USA (1998–2000)
UK (2004)
FRANCE (2004)
FINLAND (2005)
NETH (2005)
Economic competencies
Computerised information
Innovative property
Eco. comp. 49 43 41 39 37 29 Innov. prop. 38 44 49 51 48 51 Comp. info. 13 13 11 10 15 20
0%
20%
40%
60%
80%
100%
AUST (2005-06)
ITALY (2004)
GERMANY (2004)
CANADA (2005)
SPAIN (2004)
JAPAN (2000–2005)
Computerised information Scientific R&D Mineral exploration
Copyright and licence costs Other product R&D Brand equity
Firm-specific human capital Organisational capital
Economic competencies
Innovative property
Computerised information
a Organisational capital and firm-specific human capital for the United States have been derived from information in CHS (2005, 2006). b Total economy, not commercial sector, estimates for the Netherlands.
Data sources: CHS (2005, 2006); Fukao et al. (2008b); MH (2006), MHW (2007); JAA (2007); van Rooijen-Horsten et al. (2008); Hao, Manole and van Ark (2008); Belhocine (2008); authors’ estimates.
78 INTANGIBLE ASSETS AND AUSTRALIA'S PRODUCTIVITY
• Australia has a very similar composition of intangible investment to the United States in terms of the three main categories of intangibles.
– Australia’s lower rate of investment in intangibles relative to the United States reflects a lower rate in each of the main groups of intangibles, rather than a concentration of investment in any one of these groups.
• The United Kingdom is also fairly similar but with a lower proportion in innovative property than the United States.
– The UK’s lower rate of investment in total intangibles relative to the United States is virtually all attributable to a lower rate of investment in innovative property.
• By comparison, the other countries have quite different compositions of investment to Australia.
– For most of these countries, investment is more heavily concentrated in innovative property and less concentrated in economic competencies than Australia. The exception is the Netherlands for which the opposite is the case — with the highest share in economic competencies and the lowest share in innovative property.
At a more disaggregated level of intangibles there is more variation in composition.
• Within innovative property, there is considerable variation in the investment shares of most individual intangibles.
– The scientific R&D investment share ranges from 10 per cent (United Kingdom and Italy) to 30 per cent (Finland) — Australia is mid-range (15 per cent), along with the United States and France.11
– Mineral exploration is negligible for most countries — for Australia the share is 4 per cent, putting it between the United States (2 per cent) and Canada (11 per cent).
– Copyright costs are around 2-3 per cent for most countries — the exceptions are Japan (9 per cent) and the United States (7 per cent).
– The other product development share ranges from 7 per cent (Netherlands) to 33 per cent (Spain) — Australia is mid-range (18 per cent), along with most of the other countries.
11 This comparison is affected by scientific R&D also including R&D in social sciences, except in
the case of the United States, United Kingdom, Japan and Canada (where it is included in other product development). This measure of scientific R&D for each country also takes no account of any spillovers from R&D done in other countries.
INTERNATIONAL COMPARISONS
79
• It is a similarly varied picture for economic competencies. – The brand equity share of total intangible investment ranges from 5 per cent
(Canada) to 28 per cent (Netherlands) — Australia lies mid-range at 15 per cent.
– For firm-specific human capital the range is 4 per cent (Japan) to 24 per cent (United Kingdom). For Australia it is 8 per cent, with the United States at around 10 per cent. Fukao et al. (2008b) suggest that Japan’s particularly low share is partly due to the CHS method not including on-the-job training, which is often utilised in Japan.12
– Australia has the highest organisational capital share (27 per cent), while the United States, the Netherlands and France have shares around 20 per cent. The United Kingdom13, Japan and Germany have a share of around 15 per cent, just ahead of Canada, Finland and Spain (around 12 per cent). Italy has the lowest share (8 per cent). However, there is considerable variation across countries in the data sources used to measure organisational capital.
Some of the differences in composition between Australia and the other countries are to be expected or are already documented.
• Differences in industrial composition will lead to different types of intangible investment. – For example, the mining industry is a larger share of GDP in Australia than in
most of the other countries.14 Therefore Australia might be expected to have a higher share of its intangible investment in mineral exploration.
• Differences in business expenditure on R&D (BERD) between countries are already documented (see, for example, PC 2007), with Finland, Japan, the United States, Germany, France and Canada having a higher rate of investment in BERD than Australia and the United Kingdom.15
12 Fukao et al. (2008b, p. 11) cite a 2007 survey estimating that Japanese workers spend about 9.9
per cent of their time on on-the-job training. 13 MH (2006, p. 13) note this is consistent with the UK’s poorer investment (compared with the
United States) in organisational capital suggested by micro-comparisons of management and findings of higher firm-specific training based on other datasets.
14 Mining value added averaged 1 per cent of US GDP over the period 1998 to 2000 (BEA 2008). The comparable figure for Australia for 2005-06 was 7 per cent (and around 4 per cent in 1998-2000). In 2005, the equivalent measure was 2.3 per cent in the UK, 3 per cent in the Netherlands, 0.3 per cent in Finland and 0.1 per cent in Japan (EU KLEMS 2008). In Canada, mining was 5 per cent of GDP at basic prices in 2005 (Statistics Canada 2007).
15 In 2002, BERD intensity (business expenditure on R&D as a percentage of total value added) was 0.8 per cent in Italy and Spain, 1.2 per cent in Australia, 1.5 per cent in the Netherlands and 1.8 per cent in the United Kingdom compared with 3.6 per cent in Finland, 3.0 per cent in Japan, 2.6 per cent in the United States and Germany, 2.2 per cent in France and 1.6 per cent in Canada
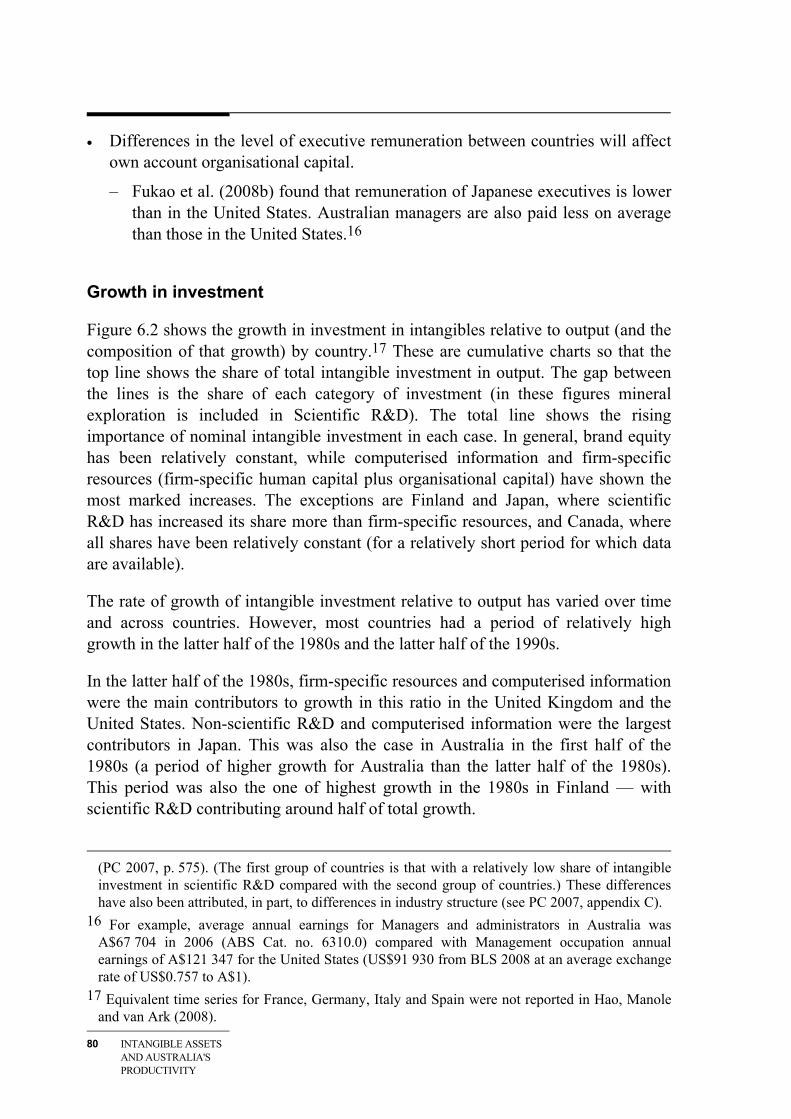
80 INTANGIBLE ASSETS AND AUSTRALIA'S PRODUCTIVITY
• Differences in the level of executive remuneration between countries will affect own account organisational capital.
– Fukao et al. (2008b) found that remuneration of Japanese executives is lower than in the United States. Australian managers are also paid less on average than those in the United States.16
Growth in investment
Figure 6.2 shows the growth in investment in intangibles relative to output (and the composition of that growth) by country.17 These are cumulative charts so that the top line shows the share of total intangible investment in output. The gap between the lines is the share of each category of investment (in these figures mineral exploration is included in Scientific R&D). The total line shows the rising importance of nominal intangible investment in each case. In general, brand equity has been relatively constant, while computerised information and firm-specific resources (firm-specific human capital plus organisational capital) have shown the most marked increases. The exceptions are Finland and Japan, where scientific R&D has increased its share more than firm-specific resources, and Canada, where all shares have been relatively constant (for a relatively short period for which data are available).
The rate of growth of intangible investment relative to output has varied over time and across countries. However, most countries had a period of relatively high growth in the latter half of the 1980s and the latter half of the 1990s.
In the latter half of the 1980s, firm-specific resources and computerised information were the main contributors to growth in this ratio in the United Kingdom and the United States. Non-scientific R&D and computerised information were the largest contributors in Japan. This was also the case in Australia in the first half of the 1980s (a period of higher growth for Australia than the latter half of the 1980s). This period was also the one of highest growth in the 1980s in Finland — with scientific R&D contributing around half of total growth.
(PC 2007, p. 575). (The first group of countries is that with a relatively low share of intangible investment in scientific R&D compared with the second group of countries.) These differences have also been attributed, in part, to differences in industry structure (see PC 2007, appendix C).
16 For example, average annual earnings for Managers and administrators in Australia was A$67 704 in 2006 (ABS Cat. no. 6310.0) compared with Management occupation annual earnings of A$121 347 for the United States (US$91 930 from BLS 2008 at an average exchange rate of US$0.757 to A$1).
17 Equivalent time series for France, Germany, Italy and Spain were not reported in Hao, Manole and van Ark (2008).
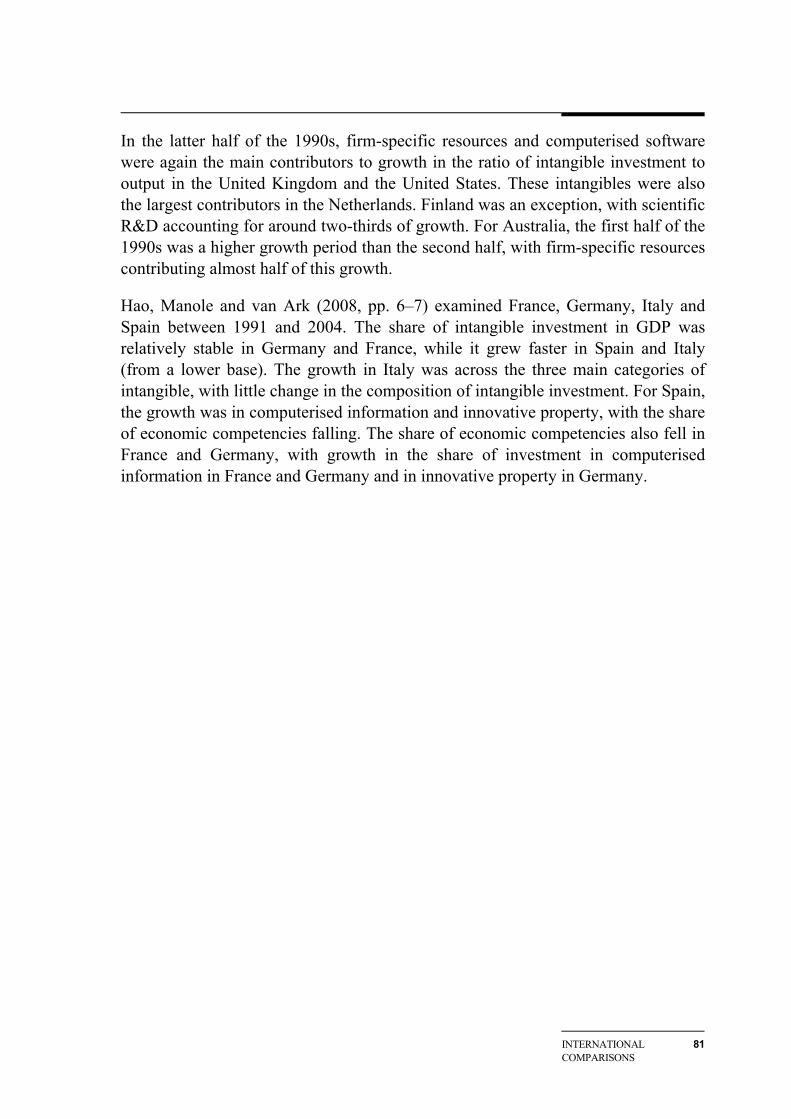
INTERNATIONAL COMPARISONS
81
In the latter half of the 1990s, firm-specific resources and computerised software were again the main contributors to growth in the ratio of intangible investment to output in the United Kingdom and the United States. These intangibles were also the largest contributors in the Netherlands. Finland was an exception, with scientific R&D accounting for around two-thirds of growth. For Australia, the first half of the 1990s was a higher growth period than the second half, with firm-specific resources contributing almost half of this growth.
Hao, Manole and van Ark (2008, pp. 6–7) examined France, Germany, Italy and Spain between 1991 and 2004. The share of intangible investment in GDP was relatively stable in Germany and France, while it grew faster in Spain and Italy (from a lower base). The growth in Italy was across the three main categories of intangible, with little change in the composition of intangible investment. For Spain, the growth was in computerised information and innovative property, with the share of economic competencies falling. The share of economic competencies also fell in France and Germany, with growth in the share of investment in computerised information in France and Germany and in innovative property in Germany.
82 INTANGIBLE ASSETS AND AUSTRALIA'S PRODUCTIVITY
Figure 6.2 Intangible investment shares of outputa, by country Per cent
Australian investment in intangibles as a share of adjusted market sector gross value added
0
2
4
6
8
10
1974-75 1979-80 1984-85 1989-90 1994-95 1999-00 2004-05
Computerised info.
Non-scientific R&D
Scientific R&D
Firm-specific resources
Brand equity
Per cent
United Kingdom investment in intangibles as a share of adjusted market sector gross value added
(continued on next page)
Firm-specific resources
Scientific R&D
Non-scientific R&D
Comp. info.
Brand equity
INTERNATIONAL COMPARISONS
83
Figure 6.2 (continued)
United States investment in intangibles as a share of adjusted non-farm output
Finnish investment in intangibles as a share of adjusted business gross value added
(continued on next page)
Scientific R&D
Comp. info.
Non-sci. R&D
Firm-sp. human cap. Brand equity
Org. capital
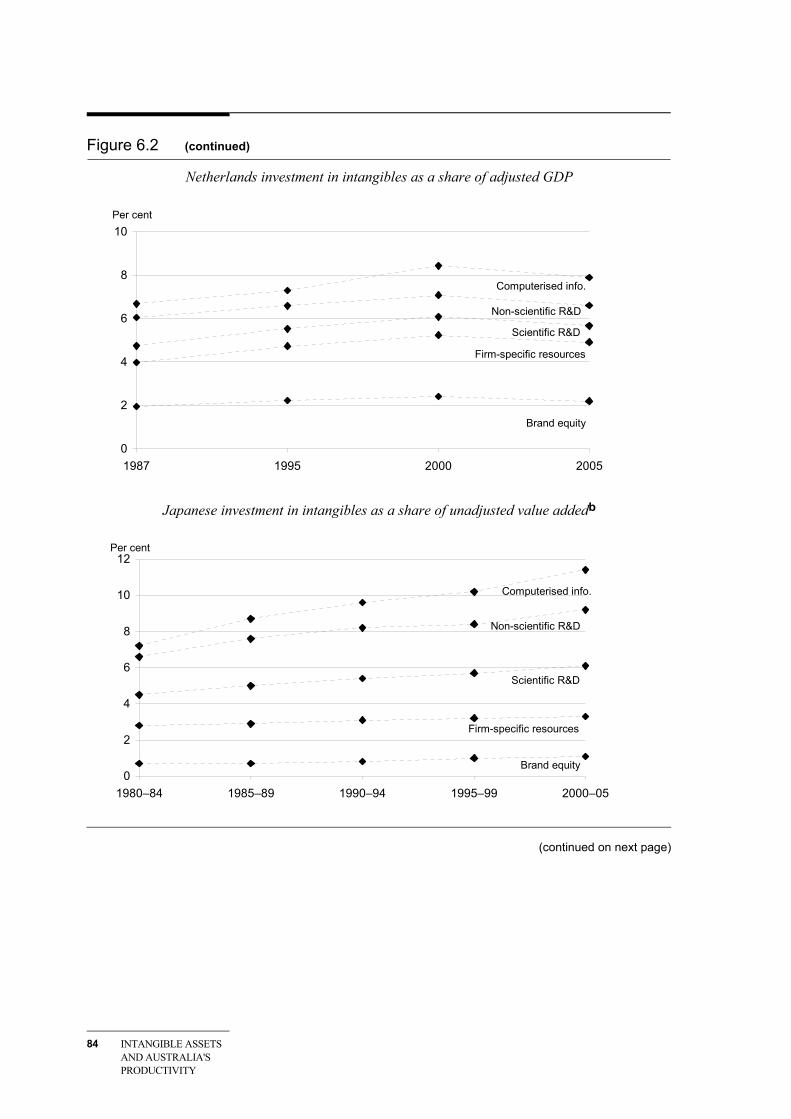
84 INTANGIBLE ASSETS AND AUSTRALIA'S PRODUCTIVITY
Figure 6.2 (continued)
Netherlands investment in intangibles as a share of adjusted GDP
0
2
4
6
8
10
1987 1995 2000 2005
Computerised info.
Non-scientific R&D
Scientific R&D
Firm-specific resources
Brand equity
Per cent
Japanese investment in intangibles as a share of unadjusted value addedb
0
2
4
6
8
10
12
1980–84 1985–89 1990–94 1995–99 2000–05
Computerised info.
Non-scientific R&D
Scientific R&D
Firm-specific resources
Brand equity
Per cent
(continued on next page)
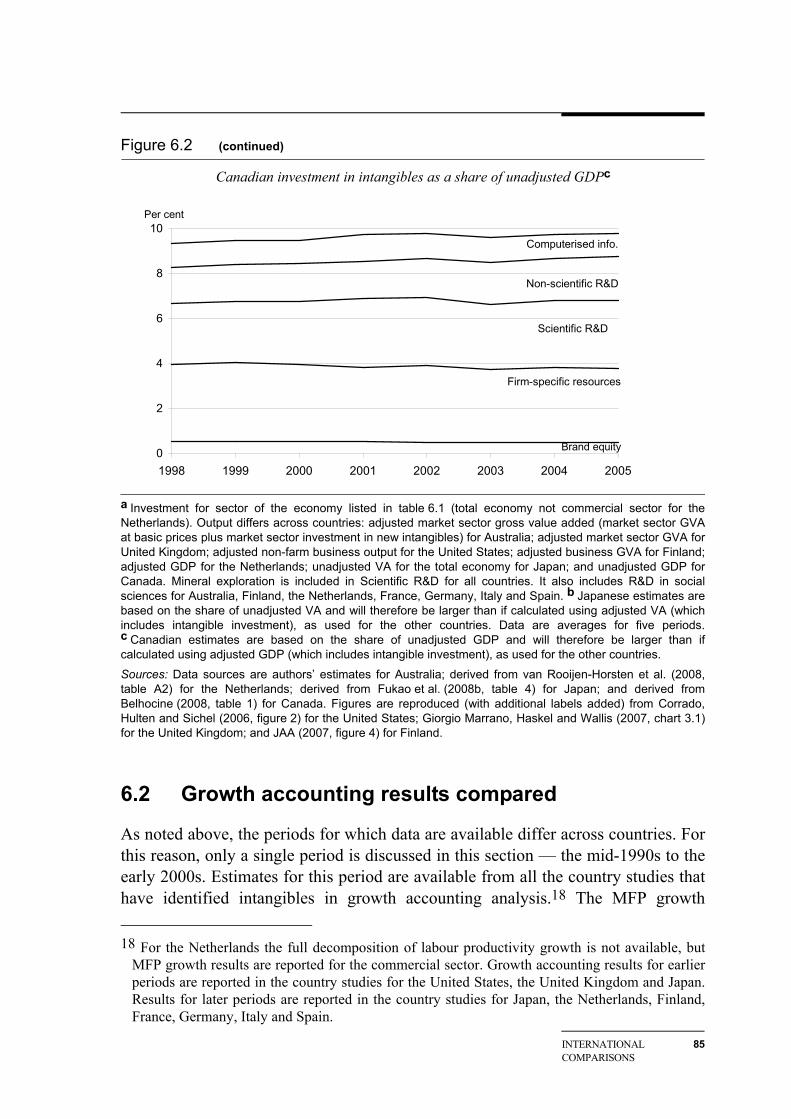
INTERNATIONAL COMPARISONS
85
Figure 6.2 (continued)
Canadian investment in intangibles as a share of unadjusted GDPc
0
2
4
6
8
10
1998 1999 2000 2001 2002 2003 2004 2005
Brand equity
Firm-specific resources
Scientific R&D
Non-scientific R&D
Computerised info.
Per cent
a Investment for sector of the economy listed in table 6.1 (total economy not commercial sector for the Netherlands). Output differs across countries: adjusted market sector gross value added (market sector GVA at basic prices plus market sector investment in new intangibles) for Australia; adjusted market sector GVA for United Kingdom; adjusted non-farm business output for the United States; adjusted business GVA for Finland; adjusted GDP for the Netherlands; unadjusted VA for the total economy for Japan; and unadjusted GDP for Canada. Mineral exploration is included in Scientific R&D for all countries. It also includes R&D in social sciences for Australia, Finland, the Netherlands, France, Germany, Italy and Spain. b Japanese estimates are based on the share of unadjusted VA and will therefore be larger than if calculated using adjusted VA (which includes intangible investment), as used for the other countries. Data are averages for five periods. c Canadian estimates are based on the share of unadjusted GDP and will therefore be larger than if calculated using adjusted GDP (which includes intangible investment), as used for the other countries. Sources: Data sources are authors’ estimates for Australia; derived from van Rooijen-Horsten et al. (2008, table A2) for the Netherlands; derived from Fukao et al. (2008b, table 4) for Japan; and derived from Belhocine (2008, table 1) for Canada. Figures are reproduced (with additional labels added) from Corrado, Hulten and Sichel (2006, figure 2) for the United States; Giorgio Marrano, Haskel and Wallis (2007, chart 3.1) for the United Kingdom; and JAA (2007, figure 4) for Finland.
6.2 Growth accounting results compared
As noted above, the periods for which data are available differ across countries. For this reason, only a single period is discussed in this section — the mid-1990s to the early 2000s. Estimates for this period are available from all the country studies that have identified intangibles in growth accounting analysis.18 The MFP growth 18 For the Netherlands the full decomposition of labour productivity growth is not available, but
MFP growth results are reported for the commercial sector. Growth accounting results for earlier periods are reported in the country studies for the United States, the United Kingdom and Japan. Results for later periods are reported in the country studies for Japan, the Netherlands, Finland, France, Germany, Italy and Spain.
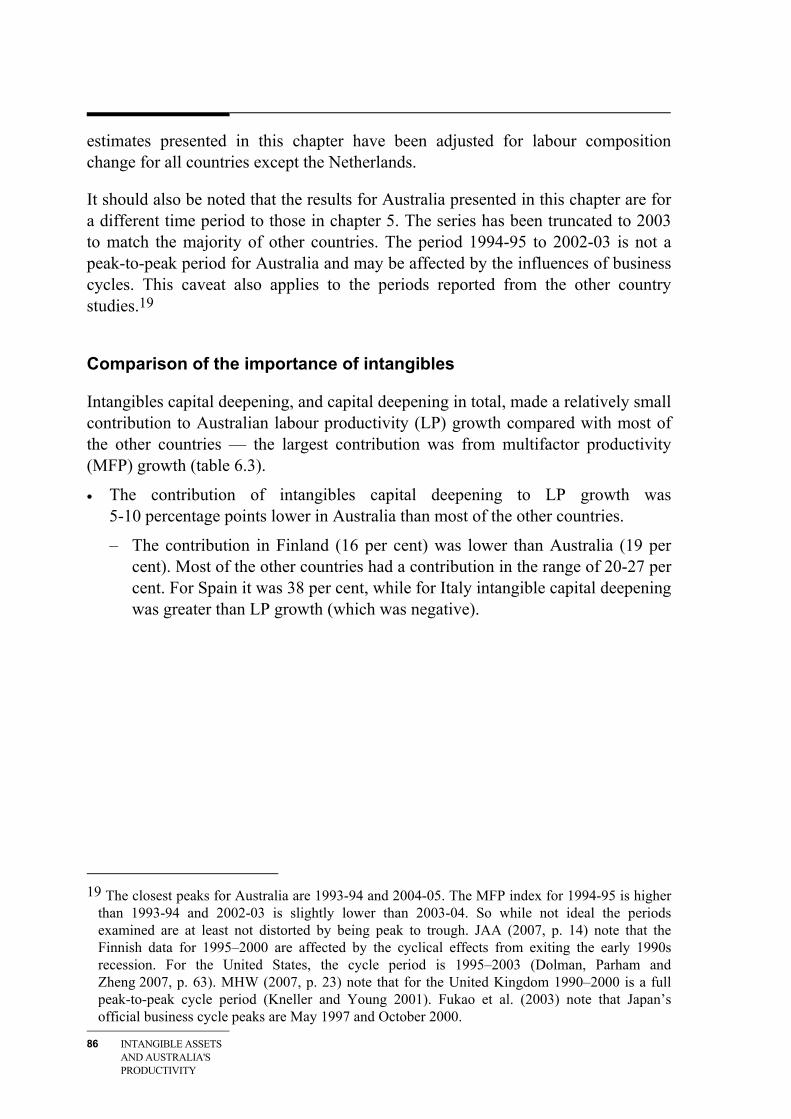
86 INTANGIBLE ASSETS AND AUSTRALIA'S PRODUCTIVITY
estimates presented in this chapter have been adjusted for labour composition change for all countries except the Netherlands.
It should also be noted that the results for Australia presented in this chapter are for a different time period to those in chapter 5. The series has been truncated to 2003 to match the majority of other countries. The period 1994-95 to 2002-03 is not a peak-to-peak period for Australia and may be affected by the influences of business cycles. This caveat also applies to the periods reported from the other country studies.19
Comparison of the importance of intangibles
Intangibles capital deepening, and capital deepening in total, made a relatively small contribution to Australian labour productivity (LP) growth compared with most of the other countries — the largest contribution was from multifactor productivity (MFP) growth (table 6.3).
• The contribution of intangibles capital deepening to LP growth was 5-10 percentage points lower in Australia than most of the other countries.
– The contribution in Finland (16 per cent) was lower than Australia (19 per cent). Most of the other countries had a contribution in the range of 20-27 per cent. For Spain it was 38 per cent, while for Italy intangible capital deepening was greater than LP growth (which was negative).
19 The closest peaks for Australia are 1993-94 and 2004-05. The MFP index for 1994-95 is higher
than 1993-94 and 2002-03 is slightly lower than 2003-04. So while not ideal the periods examined are at least not distorted by being peak to trough. JAA (2007, p. 14) note that the Finnish data for 1995–2000 are affected by the cyclical effects from exiting the early 1990s recession. For the United States, the cycle period is 1995–2003 (Dolman, Parham and Zheng 2007, p. 63). MHW (2007, p. 23) note that for the United Kingdom 1990–2000 is a full peak-to-peak cycle period (Kneller and Young 2001). Fukao et al. (2003) note that Japan’s official business cycle peaks are May 1997 and October 2000.
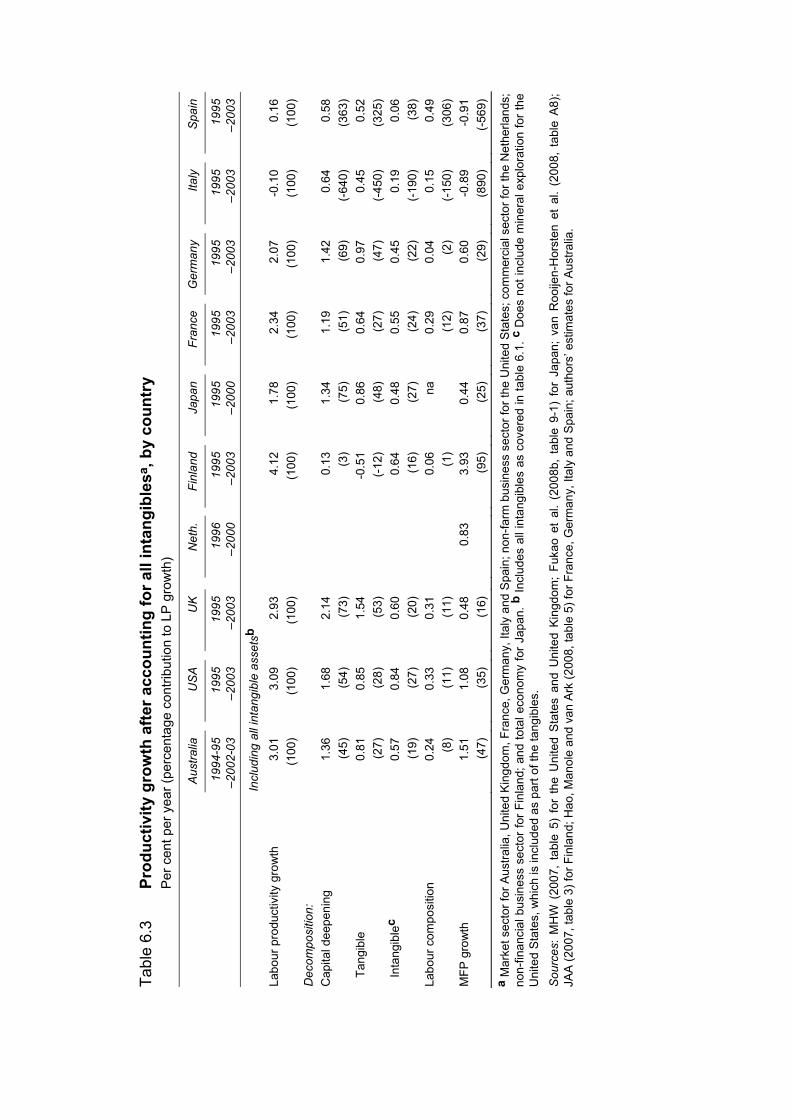
Tabl
e 6.
3 Pr
oduc
tivity
gro
wth
afte
r acc
ount
ing
for a
ll in
tang
ible
sa, b
y co
untr
y
Per
cen
t per
yea
r (pe
rcen
tage
con
tribu
tion
to L
P g
row
th)
A
ustra
lia
U
SA
UK
Net
h.
Fi
nlan
d
Japa
n
Fran
ce
G
erm
any
Ita
ly
S
pain
19
94-9
5–2
002-
03
19
95–2
003
19
95–2
003
19
96–2
000
19
95–2
003
19
95–2
000
19
95–2
003
19
95–2
003
19
95–2
003
19
95
–200
3
Inc
ludi
ng a
ll in
tang
ible
ass
etsb
Labo
ur p
rodu
ctiv
ity g
row
th
3.01
3.09
2.93
4.12
1.78
2.34
2.07
-0.1
0
0.16
(100
)
(100
)
(100
)
(100
)
(100
)
(100
)
(100
)
(100
)
(100
) D
ecom
posi
tion:
Cap
ital d
eepe
ning
1.
36
1.
68
2.
14
0.
13
1.
34
1.
19
1.
42
0.
64
0.
58
(4
5)
(5
4)
(7
3)
(3
)
(75)
(51)
(69)
(-640
)
(363
) Ta
ngib
le
0.81
0.85
1.54
-0.5
1
0.86
0.64
0.97
0.45
0.52
(27)
(28)
(53)
(-12)
(48)
(27)
(47)
(-450
)
(325
) In
tang
ible
c 0.
57
0.
84
0.
60
0.
64
0.
48
0.
55
0.
45
0.
19
0.
06
(1
9)
(2
7)
(2
0)
(1
6)
(2
7)
(2
4)
(2
2)
(-1
90)
(3
8)
Labo
ur c
ompo
sitio
n 0.
24
0.
33
0.
31
0.
06
na
0.29
0.04
0.15
0.49
(8)
(1
1)
(1
1)
(1
)
(12)
(2)
(-1
50)
(3
06)
MFP
gro
wth
1.
51
1.
08
0.
48
0.
83
3.
93
0.
44
0.
87
0.
60
-0
.89
-0
.91
(4
7)
(3
5)
(1
6)
(9
5)
(2
5)
(3
7)
(2
9)
(8
90)
(-5
69)
a M
arke
t sec
tor f
or A
ustra
lia, U
nite
d K
ingd
om, F
ranc
e, G
erm
any,
Ital
y an
d S
pain
; non
-farm
bus
ines
s se
ctor
for t
he U
nite
d S
tate
s; c
omm
erci
al s
ecto
r for
the
Net
herla
nds;
no
n-fin
anci
al b
usin
ess
sect
or fo
r Fin
land
; and
tota
l eco
nom
y fo
r Jap
an. b
Incl
udes
all
inta
ngib
les
as c
over
ed in
tabl
e 6.
1. c
Doe
s no
t inc
lude
min
eral
exp
lora
tion
for t
he
Uni
ted
Sta
tes,
whi
ch is
incl
uded
as
part
of th
e ta
ngib
les.
Sou
rces
: M
HW
(20
07,
tabl
e 5)
for
the
Uni
ted
Sta
tes
and
Uni
ted
Kin
gdom
; Fu
kao
et a
l. (2
008b
, ta
ble
9-1)
for
Jap
an;
van
Roo
ijen-
Hor
sten
et
al.
(200
8, t
able
A8)
; JA
A (2
007,
tabl
e 3)
for F
inla
nd; H
ao, M
anol
e an
d va
n A
rk (2
008,
tabl
e 5)
for F
ranc
e, G
erm
any,
Ital
y an
d S
pain
; aut
hors
’ est
imat
es fo
r Aus
tralia
.
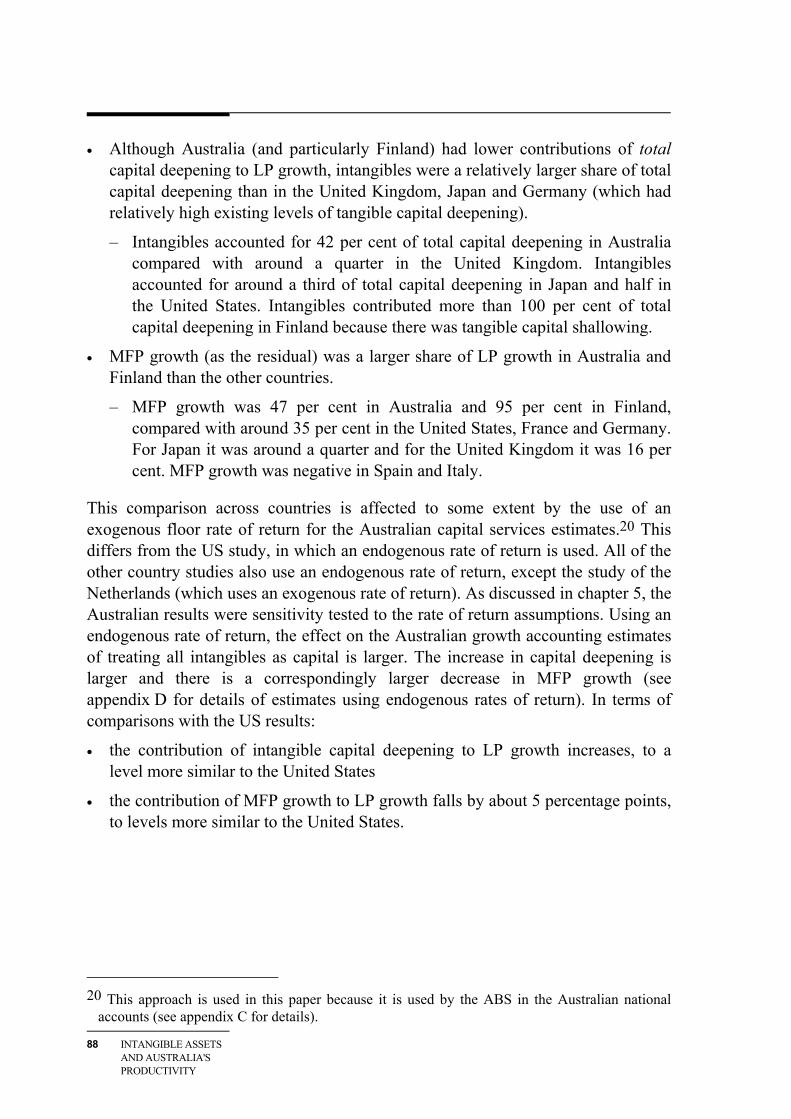
88 INTANGIBLE ASSETS AND AUSTRALIA'S PRODUCTIVITY
• Although Australia (and particularly Finland) had lower contributions of total capital deepening to LP growth, intangibles were a relatively larger share of total capital deepening than in the United Kingdom, Japan and Germany (which had relatively high existing levels of tangible capital deepening).
– Intangibles accounted for 42 per cent of total capital deepening in Australia compared with around a quarter in the United Kingdom. Intangibles accounted for around a third of total capital deepening in Japan and half in the United States. Intangibles contributed more than 100 per cent of total capital deepening in Finland because there was tangible capital shallowing.
• MFP growth (as the residual) was a larger share of LP growth in Australia and Finland than the other countries.
– MFP growth was 47 per cent in Australia and 95 per cent in Finland, compared with around 35 per cent in the United States, France and Germany. For Japan it was around a quarter and for the United Kingdom it was 16 per cent. MFP growth was negative in Spain and Italy.
This comparison across countries is affected to some extent by the use of an exogenous floor rate of return for the Australian capital services estimates.20 This differs from the US study, in which an endogenous rate of return is used. All of the other country studies also use an endogenous rate of return, except the study of the Netherlands (which uses an exogenous rate of return). As discussed in chapter 5, the Australian results were sensitivity tested to the rate of return assumptions. Using an endogenous rate of return, the effect on the Australian growth accounting estimates of treating all intangibles as capital is larger. The increase in capital deepening is larger and there is a correspondingly larger decrease in MFP growth (see appendix D for details of estimates using endogenous rates of return). In terms of comparisons with the US results:
• the contribution of intangible capital deepening to LP growth increases, to a level more similar to the United States
• the contribution of MFP growth to LP growth falls by about 5 percentage points, to levels more similar to the United States.
20 This approach is used in this paper because it is used by the ABS in the Australian national
accounts (see appendix C for details).
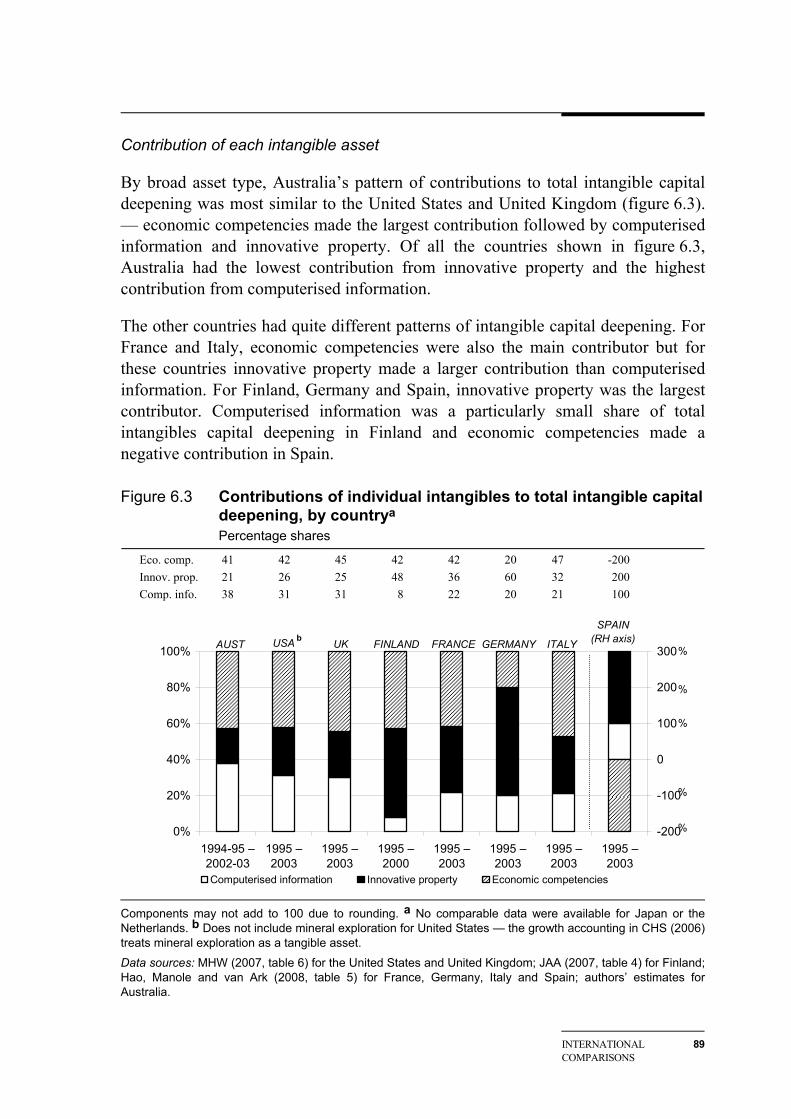
INTERNATIONAL COMPARISONS
89
Contribution of each intangible asset
By broad asset type, Australia’s pattern of contributions to total intangible capital deepening was most similar to the United States and United Kingdom (figure 6.3). — economic competencies made the largest contribution followed by computerised information and innovative property. Of all the countries shown in figure 6.3, Australia had the lowest contribution from innovative property and the highest contribution from computerised information.
The other countries had quite different patterns of intangible capital deepening. For France and Italy, economic competencies were also the main contributor but for these countries innovative property made a larger contribution than computerised information. For Finland, Germany and Spain, innovative property was the largest contributor. Computerised information was a particularly small share of total intangibles capital deepening in Finland and economic competencies made a negative contribution in Spain.
Figure 6.3 Contributions of individual intangibles to total intangible capital deepening, by countrya Percentage shares
Eco. comp. 41 42 45 42 42 20 47 -200 Innov. prop. 21 26 25 48 36 60 32 200 Comp. info. 38 31 31 8 22 20 21 100
0%
20%
40%
60%
80%
100%
1994-95 –2002-03
1995 –2003
1995 –2003
1995 –2000
1995 –2003
1995 –2003
1995 –2003
1995 –2003
-200
-100
0
100
200
300
Computerised information Innovative property Economic competencies
AUST ITALYGERMANYFRANCEFINLANDUK USA bSPAIN
(RH axis)%
%
%
%
%
Components may not add to 100 due to rounding. a No comparable data were available for Japan or the Netherlands. b Does not include mineral exploration for United States — the growth accounting in CHS (2006) treats mineral exploration as a tangible asset. Data sources: MHW (2007, table 6) for the United States and United Kingdom; JAA (2007, table 4) for Finland; Hao, Manole and van Ark (2008, table 5) for France, Germany, Italy and Spain; authors’ estimates for Australia.
90 INTANGIBLE ASSETS AND AUSTRALIA'S PRODUCTIVITY
Figure 6.4 illustrates the significance in total capital deepening of the ‘new’ intangibles compared with the ‘traditional’ intangibles.21 CHS (2006, p. 31) noted that growth accountants in the United States should not lose sight of the new intangibles that are just as large as the ‘traditional’ intangibles — computerised information (which is already capitalised) and scientific R&D (which is on the agenda to be capitalised). This point also applies to the United Kingdom, Australia and, to some extent, Finland.
Figure 6.4 Contributions of new and ‘traditional’ intangibles to total intangible capital deepening, by country Percentage shares
New 55 59 68 46 ‘Traditional’ 46 41 32 54
0%
20%
40%
60%
80%
100%
1994-95 – 2002-03 1995 – 2003 1995 – 2003 1995 – 2000
Computerised info. Scientific R&D Non-scientific R&D
Brand equity Firm-specific resources
Australia United States United Kingdom Finland a
new
traditional
cb
Components may not add to 100 due to rounding. a Scientific R&D includes mineral exploration for the United Kingdom, Australia and Finland (it also includes R&D in social sciences for Australia and Finland, which is included in non-scientific R&D for the United Kingdom and the United States). It does not include mineral exploration for United States — the growth accounting in CHS (2006) treats mineral exploration as a tangible asset. b Non-scientific R&D includes other product development and copyright and licence costs. c Firm-specific resources includes firm-specific human capital and organisational capital.
Data sources: MHW (2007, table 6) for the United States and United Kingdom; JAA (2007, table 4) for Finland; authors’ estimates for Australia.
21 Disaggregated data for France, Germany, Italy and Spain were not reported in Hao, Manole and
van Ark (2008).
INTERNATIONAL COMPARISONS
91
Firm-specific resources made a similar contribution to computerised information (slightly less in Australia and slightly more in the United States, Finland and United Kingdom). Non-scientific R&D contributed more than scientific R&D, except in Finland. The contribution of scientific R&D was 94 per cent of that for total R&D in Finland, compared with 7 per cent in the United Kingdom and 35 to 40 per cent in the United States and Australia.22
Comparison of the effect of adding intangibles
As discussed in chapter 5, capitalising rather than expensing intangibles expenditure results in a change to measured MFP growth. MFP growth can rise or fall, depending on the relative growth rates of current intangible investment on the output side and services from accumulated intangible capital on the input side.
Table 6.4 and figure 6.5 show growth accounting estimates for the three definitions of capital — including no intangibles, national accounts intangibles and all intangibles. For most countries examined in this chapter, the direction of effect of including intangible capital was the same — labour productivity growth rose by less than capital deepening, resulting in a fall in MFP growth (which is derived as the residual).23 Input growth from including intangibles capital services generally outweighed the increase in output growth from including intangible investment. Intangibles therefore raised the importance of capital deepening and lowered the importance of MFP growth as sources of growth.
22 MHW (2007, p. 21) note that this accords with discussion that in the United Kingdom ‘design’
is strong but scientific R&D lags behind the United States. 23 The exceptions are the Netherlands (for which MFP growth was unchanged after capitalising the
new intangibles), Japan (for which MFP growth rose after capitalising all intangibles) and Spain (for which MFP growth was unchanged after capitalising all intangibles).

Tabl
e 6.
4 Ef
fect
of i
ntan
gibl
es o
n pr
oduc
tivity
gro
wth
, by
coun
try
and
inta
ngib
le g
roup
a P
er c
ent p
er y
ear (
perc
enta
ge c
ontri
butio
n to
LP
gro
wth
)
Aus
tralia
US
A
U
K
N
eth.
Finl
and
Ja
pan
Fr
ance
Ger
man
y
Italy
Spa
in
19
94-9
5–2
002-
03
19
95–2
003
19
95–2
003
19
96–2
000
19
95–2
000
19
95–2
000
19
95–2
003
19
95–2
003
19
95–2
003
19
95
–200
3 E
xclu
ding
mos
t int
angi
ble
asse
tsb
Labo
ur p
rodu
ctiv
ity g
row
th
2.90
2.78
2.59
1.50
2.17
1.93
-0.2
4
0.10
(100
)
(100
)
(100
)
(100
)
(100
)
(100
)
(100
)
(100
) D
ecom
posi
tion
C
apita
l dee
peni
ng
0.92
0.98
1.64
1.13
0.78
1.14
0.49
0.58
(32)
(35)
(63)
(75)
(36)
(59)
(-20
4)
(5
80)
Labo
ur c
ompo
sitio
n 0.
27
0.
38
0.
36
na
0.32
0.05
0.16
0.52
(9)
(1
4)
(1
4)
(1
5)
(3
)
(-67
)
(520
) M
FP g
row
th
1.71
1.42
0.58
0.37
1.08
0.73
-0.8
9
-1.0
0
(59)
(51)
(22)
(25)
(50)
(38)
(371
)
(-10
00)
Inc
ludi
ng n
atio
nal a
ccou
nts
inta
ngib
le a
sset
sc
Labo
ur p
rodu
ctiv
ity g
row
th
2.94
2.95
2.73
3.64
(100
)
(100
)
(100
)
(100
)
D
ecom
posi
tion
C
apita
l dee
peni
ng
1.12
1.26
1.82
-0.4
8
(38)
(43)
(67)
(-13
)
Ta
ngib
le
0.90
-0.5
3
(31)
(-14
)
In
tang
ible
0.
23
0.05
e
(8)
(1
)
La
bour
com
posi
tion
0.26
0.37
0.35
0.07
(9)
(1
3)
(1
3)
(2
)
M
FP g
row
th
1.56
1.32
0.56
0.83
4.05
(53)
(45)
(21)
(111
)
(c
ontin
ued
on n
ext p
age)
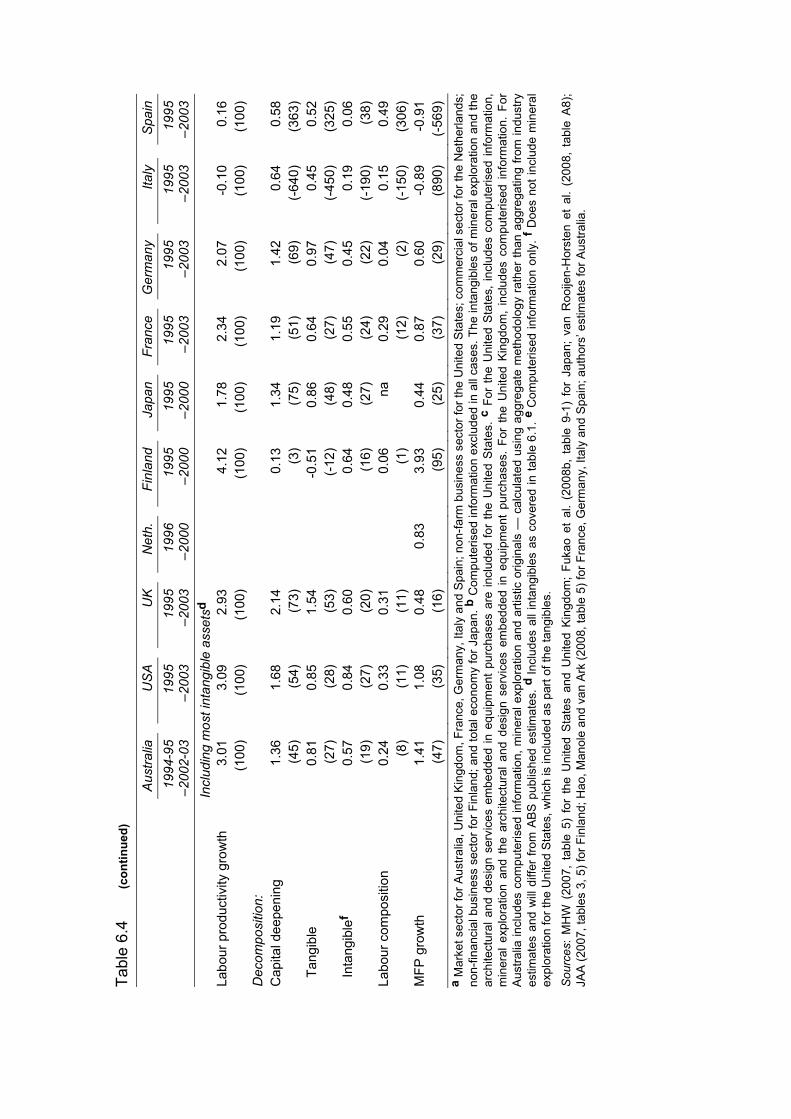
Tabl
e 6.
4 (c
ontin
ued)
A
ustra
lia
U
SA
UK
Net
h.
Fi
nlan
d
Japa
n
Fran
ce
G
erm
any
Ita
ly
S
pain
19
94-9
5–2
002-
03
19
95–2
003
19
95–2
003
19
96–2
000
19
95–2
000
19
95–2
000
19
95–2
003
19
95–2
003
19
95–2
003
19
95
–200
3 I
nclu
ding
mos
t int
angi
ble
asse
tsd
Labo
ur p
rodu
ctiv
ity g
row
th
3.01
3.09
2.93
4.12
1.78
2.34
2.07
-0.1
0
0.16
(100
)
(100
)
(100
)
(100
)
(100
)
(100
)
(100
)
(100
)
(100
) D
ecom
posi
tion:
Cap
ital d
eepe
ning
1.
36
1.
68
2.
14
0.
13
1.
34
1.
19
1.
42
0.
64
0.
58
(4
5)
(5
4)
(7
3)
(3
)
(75)
(51)
(69)
(-64
0)
(3
63)
Tang
ible
0.
81
0.
85
1.
54
-0
.51
0.
86
0.
64
0.
97
0.
45
0.
52
(2
7)
(2
8)
(5
3)
(-
12)
(4
8)
(2
7)
(4
7)
(-
450)
(325
) In
tang
ible
f 0.
57
0.
84
0.
60
0.
64
0.
48
0.
55
0.
45
0.
19
0.
06
(1
9)
(2
7)
(2
0)
(1
6)
(2
7)
(2
4)
(2
2)
(-
190)
(38)
La
bour
com
posi
tion
0.24
0.33
0.31
0.06
na
0.
29
0.
04
0.
15
0.
49
(8
)
(11)
(11)
(1)
(1
2)
(2
)
(-15
0)
(3
06)
MFP
gro
wth
1.
41
1.
08
0.
48
0.
83
3.
93
0.
44
0.
87
0.
60
-0
.89
-0
.91
(4
7)
(3
5)
(1
6)
(9
5)
(2
5)
(3
7)
(2
9)
(8
90)
(-
569)
a
Mar
ket s
ecto
r for
Aus
tralia
, Uni
ted
Kin
gdom
, Fra
nce,
Ger
man
y, It
aly
and
Spa
in; n
on-fa
rm b
usin
ess
sect
or fo
r the
Uni
ted
Sta
tes;
com
mer
cial
sec
tor f
or th
e N
ethe
rland
s;
non-
finan
cial
bus
ines
s se
ctor
for F
inla
nd; a
nd to
tal e
cono
my
for J
apan
. b C
ompu
teris
ed in
form
atio
n ex
clud
ed in
all
case
s. T
he in
tang
ible
s of
min
eral
exp
lora
tion
and
the
arch
itect
ural
and
des
ign
serv
ices
em
bedd
ed in
equ
ipm
ent
purc
hase
s ar
e in
clud
ed fo
r th
e U
nite
d S
tate
s. c
For
the
Uni
ted
Sta
tes,
incl
udes
com
pute
rised
info
rmat
ion,
m
iner
al e
xplo
ratio
n an
d th
e ar
chite
ctur
al a
nd d
esig
n se
rvic
es e
mbe
dded
in e
quip
men
t pu
rcha
ses.
For
the
Uni
ted
Kin
gdom
, in
clud
es c
ompu
teris
ed in
form
atio
n. F
or
Aus
tralia
incl
udes
com
pute
rised
info
rmat
ion,
min
eral
exp
lora
tion
and
artis
tic o
rigin
als
— c
alcu
late
d us
ing
aggr
egat
e m
etho
dolo
gy r
athe
r tha
n ag
greg
atin
g fro
m in
dust
ry
estim
ates
and
will
diff
er fr
om A
BS
pub
lishe
d es
timat
es. d
Incl
udes
all
inta
ngib
les
as c
over
ed in
tabl
e 6.
1. e
Com
pute
rised
info
rmat
ion
only
. f D
oes
not i
nclu
de m
iner
al
expl
orat
ion
for t
he U
nite
d S
tate
s, w
hich
is in
clud
ed a
s pa
rt of
the
tang
ible
s.
Sou
rces
: M
HW
(20
07,
tabl
e 5)
for
the
Uni
ted
Sta
tes
and
Uni
ted
Kin
gdom
; Fu
kao
et a
l. (2
008b
, ta
ble
9-1)
for
Jap
an;
van
Roo
ijen-
Hor
sten
et
al.
(200
8, t
able
A8)
; JA
A (2
007,
tabl
es 3
, 5) f
or F
inla
nd; H
ao, M
anol
e an
d va
n A
rk (2
008,
tabl
e 5)
for F
ranc
e, G
erm
any,
Ital
y an
d S
pain
; aut
hors
’ est
imat
es fo
r Aus
tralia
.
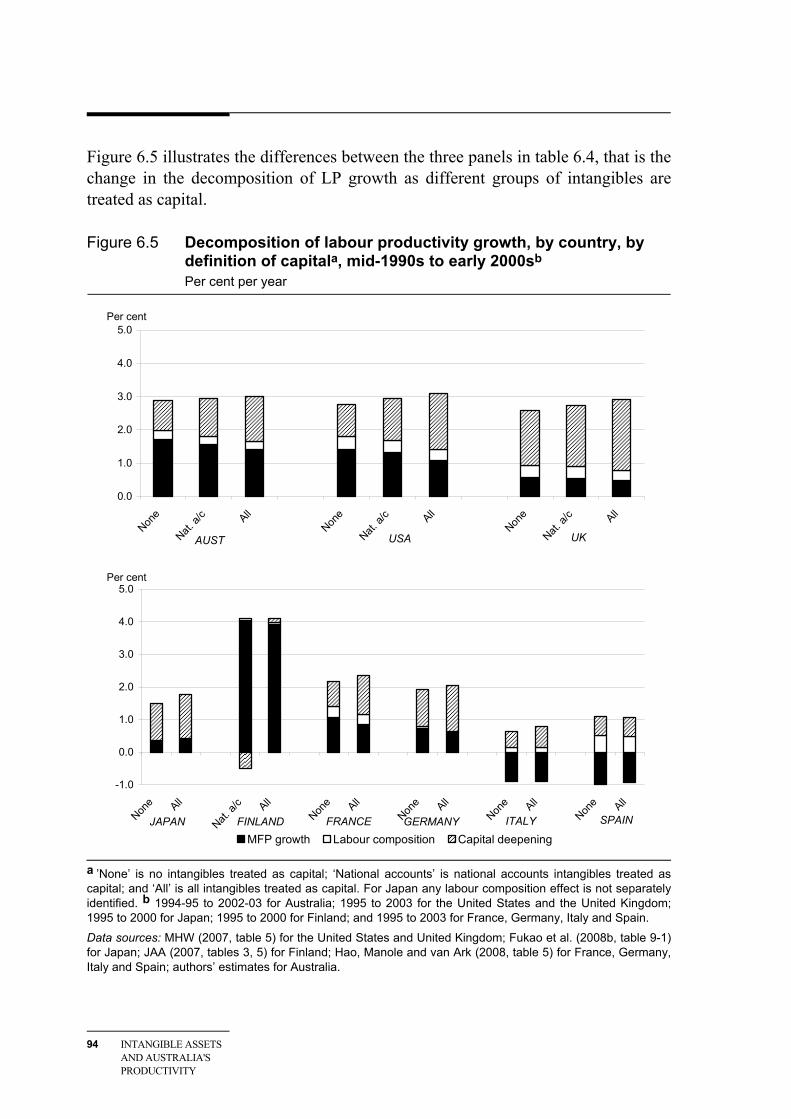
94 INTANGIBLE ASSETS AND AUSTRALIA'S PRODUCTIVITY
Figure 6.5 illustrates the differences between the three panels in table 6.4, that is the change in the decomposition of LP growth as different groups of intangibles are treated as capital.
Figure 6.5 Decomposition of labour productivity growth, by country, by definition of capitala, mid-1990s to early 2000sb Per cent per year
0.0
1.0
2.0
3.0
4.0
5.0
None
Nat. a/
c All
None
Nat. a/
c All
None
Nat. a/
c All
AUST USA UK
Per cent
-1.0
0.0
1.0
2.0
3.0
4.0
5.0
None All
Nat. a/
c All
None All
None All
None All
None All
MFP growth Labour composition Capital deepeningJAPAN FINLAND SPAINITALYGERMANYFRANCE
Per cent
a ’None’ is no intangibles treated as capital; ‘National accounts’ is national accounts intangibles treated as capital; and ‘All’ is all intangibles treated as capital. For Japan any labour composition effect is not separately identified. b 1994-95 to 2002-03 for Australia; 1995 to 2003 for the United States and the United Kingdom; 1995 to 2000 for Japan; 1995 to 2000 for Finland; and 1995 to 2003 for France, Germany, Italy and Spain.
Data sources: MHW (2007, table 5) for the United States and United Kingdom; Fukao et al. (2008b, table 9-1) for Japan; JAA (2007, tables 3, 5) for Finland; Hao, Manole and van Ark (2008, table 5) for France, Germany, Italy and Spain; authors’ estimates for Australia.
INTERNATIONAL COMPARISONS
95
Examining the effect of capitalising all intangibles (compared with the no intangibles case):
• labour productivity growth was higher in all countries
– but in percentage terms, LP growth increased by less in Australia because of the relatively smaller contribution of intangible investment to output growth and/or a higher LP growth in the no intangibles case than the other countries
• the contribution of capital deepening to LP growth was higher in all countries (except Spain where there was no change)
– the contribution of capital deepening to LP growth rose more (in percentage terms) in the United States, France and Australia than the United Kingdom and Japan (which already had high rates of capital deepening)24
• in most countries, the increase in capital deepening was greater than the increase in LP growth, so the contribution of MFP growth (as the residual) fell
– the contribution of MFP growth to LP growth fell less (in percentage terms) in Australia (18 per cent) than the United States (24 per cent) and France (19 per cent), the same as in Germany (18 per cent) but more than the United Kingdom (17 per cent) and Spain (9 per cent). There was no change in Italy and in Japan the contribution rose 19 per cent.
Overall, capitalising all intangibles in the growth accounting (compared with capitalising none) generally shifted the sources of growth towards capital deepening and away from MFP growth. However, this shift was less pronounced in percentage terms for Australia than some of the other countries because of lower investment in intangibles and/or relatively high MFP growth. For Australia, even after the capitalising all intangibles, MFP growth remained a larger contributor to LP growth than capital deepening — this was not the case for most of the other countries.
Relative importance of ‘new’ and ‘old’ intangibles
As noted above, the national accounts already include some intangibles (mainly computerised information). This raises two questions:
• How do the contributions of the new intangibles compare with those of the existing intangibles?
• To what extent are the national accounts estimates affected by not treating the new intangibles as capital?
24 MHW (2007, p. 22) noted that the effect in the United Kingdom is less than the United States
because capital deepening is already quite high in the United Kingdom.
96 INTANGIBLE ASSETS AND AUSTRALIA'S PRODUCTIVITY
Figure 6.5 illustrates the progressive effect of capitalising the national accounts and the new intangibles for Australia, the United States and the United Kingdom (and the new intangibles for Finland). The answer to the first question is that over the period examined the ‘new’ intangibles affect the MFP results more than the ‘old’ intangibles25, highlighting the importance of attempting to capitalise the new intangibles in the national accounts. For Australia, however, the difference between the ‘new’ and ‘old’ intangibles is small.
The answer to the second question varies across countries. Overall, in percentage terms, not treating the new intangibles as capital affects MFP growth in the Australian national accounts26 less than it affects the national accounts of most of the other countries for which data are available (figure 6.5).27 Australian MFP growth is overstated by 10 per cent (0.15 of a percentage point), compared with 18 per cent (0.24 of a percentage point) in the United States, 14 per cent (0.08) in the United Kingdom and 3 per cent (0.12) in Finland (table 6.4).
Overall, not capitalising all intangibles in the national accounts affects the picture of the relative importance of the sources of growth. Capital deepening is relatively more important and MFP growth relatively less important when the new intangibles are measured.
Effect on growth accounting results over shorter periods
The above results cover only one period but data for various shorter periods were examined in most of the country studies and the growth cycle periods were examined for Australia in chapter 5. While in many cases treating intangibles as capital altered the extent of any acceleration/deceleration in MFP growth between periods, in only two countries is it reported to have reversed the pattern of MFP growth.
• For the United Kingdom, the inclusion of the ‘new’ intangibles changed a deceleration in LP growth and MFP growth between the early and late 1990s to an acceleration in LP growth and MFP growth (MHW 2007, table 3).
25 The change in MFP growth from moving from a capital definition that includes no intangibles to
one that includes the national accounts intangibles is less than the change in MFP growth from moving from a capital definition that includes national accounts intangibles to one that includes all intangibles.
26 The estimates for the national accounts definition of capital are not the same as ABS published estimates for Australia because of differences in methodology (see appendix C).
27 There are some differences across countries as to which intangibles are already treated as capital in the national accounts — the US estimates do not include artistic originals, which are included in the Australian and UK national accounts.
INTERNATIONAL COMPARISONS
97
– MHW (2007) suggest that the ‘mystery’ of the LP growth slowdown in the conventionally measured statistics was in fact a ‘statistical illusion’ caused by not accounting for investment in intangibles.
– This was a period of rapid investment in intangibles that raised output growth more than input growth was raised by including intangible capital services as an input.
• For the Netherlands, capitalising intangibles resulted in a deceleration rather than an acceleration in MFP growth between 1996-2000 and 2001-05.
– Capitalising intangibles left MFP growth unchanged in 1996-2000 but lowered it in 2001-05. The MFP growth rate therefore became higher in 1996-2000 than 2001-05, the reverse of the pattern before capitalising intangibles (van Rooijen-Horsten et al. 2008, p. 30).
• For Australia, as shown in chapter 5, there has been no change in the pattern of growth across the cycles (in terms of a switch from acceleration to deceleration).
– In general, the lower levels of investment in intangibles means that treating intangibles as capital has a lesser effect on the growth accounting results than in some of the other countries. This also makes it less likely that the effect of treating intangibles as capital will be large enough to change the periods of acceleration and deceleration between cycles.
6.3 Summary
The estimates for Australia (and the other countries) are exploratory and have a number of identified deficiencies. And the international comparisons are further hampered by differences in coverage and underlying data used in the estimates. Even comparable estimates should be interpreted carefully — the country with the highest ratio of intangibles to output should not be seen as a benchmark. Country-specific circumstances will affect the appropriate level and type of intangible investment for a particular country. However, with these caveats in mind, there are a number of broad similarities and differences between Australia and the other countries that are of interest.
• Australia has a lower rate of intangible investment than the United States, United Kingdom, Japan, France, Germany and Finland but greater than the Netherlands, Canada, Italy and Spain (when measured as a share of adjusted output for the sector for which intangibles were measured).
– But Australian investment in intangibles is still large — $57 billion or around 10 per cent of adjusted market sector gross value added in 2005-06.
98 INTANGIBLE ASSETS AND AUSTRALIA'S PRODUCTIVITY
– And the pattern of growth has been similar to most of the other countries examined, including the United States and United Kingdom.
• Even though Australia (like Japan, Italy and Spain) has a relatively low ratio of intangibles to tangibles investment, compared with the United States, it is still around half the size of tangible investment.
– And with higher growth in intangible investment than tangible investment over the longer term, this changes the trend in the Australian ratio of investment to output from a declining to relatively stable one.
• The composition of Australia’s intangible investment is more similar to the United States than most of the other countries examined (particularly Japan).
– The lower ratio of intangible investment to output is due to lower levels across the three main groups of intangibles rather than particularly low investment in any one group.
• While further analysis is required, the international comparisons suggest that the type of intangible investment may be important for growth performance.
– For example, Japan has a higher share of its intangibles investment in computerised information than the United States or Australia but a lower share of investment in economic competencies. Fukao et al. (2008b) note that differences in the accumulation of intangible assets that play a complementary role to ICT capital (for example, organisational capital) might explain differences in productivity growth compared with the United States.
– Other studies have suggested that Australian productivity performance has benefited from links between ICTs and organisational capital. Gretton et al. (2003) found significant interactions between ICT use and complementary organisational variables (including human capital, history of innovation, the use of advanced business practices and the intensity of organisational change) using an Australian firm-based longitudinal dataset. And Australia is one of the few countries to show evidence of MFP gains related to ICT use (OECD 2003). The differences between Australia and Japan in organisational capital investment (as measured using the CHS-methodology) also suggest that this is a potential explanation for some of the difference in MFP growth.28
28 It should be noted that comparability of organisational capital measures across countries is
affected by data limitations — the Japanese estimate is likely to be an underestimate (Fukao et al. 2008b) and the Australian estimate may be an overestimate (see chapter 3).
INTERNATIONAL COMPARISONS
99
• In most countries, when intangibles are capitalised LP growth and capital deepening rise and MFP growth falls — that is, part of conventionally-measured MFP growth was actually attributable to previously unmeasured intangible assets.
– The percentage contribution of ‘new’ intangibles to conventionally-measured MFP growth is relatively low in Australia compared with the United States and United Kingdom. This reflects a lower level of intangible investment and relatively high MFP growth in Australia. (However, it also reflects the use of an exogenous floor rate of return rather than endogenous rate of return, under which the contribution of intangibles to conventionally-measured MFP growth in Australia is larger.)
• Only a small proportion of Australia’s relatively high MFP growth is directly attributable to intangibles and capitalising intangibles does not appreciably change the pattern of growth over the productivity cycles (unlike in the United Kingdom).
– This does not rule out indirect effects from intangibles, such as complementarities with ICTs, contributing to MFP growth.

DATA SOURCES 101
A Data sources for investment in intangibles
This appendix describes the Australian data sources used in this study and presents the capital series estimates. While the intent has been to follow the Corrado, Hulten and Sichel (CHS) methodology used in the studies of the United States (CHS 2005, CHS 2006), the United Kingdom (Marrano and Haskel 2006, Marrano, Haskel and Wallis 2007) and Japan (Fukao et al. 2008b), to allow comparability, data availability has led to some differences. A discussion of how the data sources compare with those used in the other studies is included.1
The estimates of intangibles have been constructed for the market sector (the industries that make up the market sector are listed in table A.1). All references to ABS ANZSIC (Australian Bureau of Statistics Australian and New Zealand Standard Industrial Classification) are to the ANZSIC 1993 edition. The closest available ASIC (Australian Standard Industrial Classification) industry division/subdivision has been used for early years in the absence of sufficient data to use a more precise concordance.
Table A.1 Industries included in the market sectora
Agriculture, forestry & fishing Retail trade
Mining Accommodation, cafes & restaurants
Manufacturing Transport & storage
Electricity, gas & water Communication services
Construction Finance & insurance
Wholesale trade Cultural & recreational services a The industries excluded are Property & business services, Government administration & defence, Education, Health & community services, and Personal & other services.
1 The Corrado, Hulten and Sichel methodology (CHS 2006) has also been used to measure
intangibles for Finland (Jalava, Aulin-Ahmavaara and Alanen 2007), the Netherlands (RBT 2008, van Rooijen-Horsten et al. 2008), France, Germany, Italy and Spain (Hao, Manole and van Ark 2008) and Canada (Belhocine 2008). Any major measurement differences in these studies are noted in table A.3 and the international comparisons in chapter 6.
102 INTANGIBLE ASSETS AND AUSTRALIA'S PRODUCTIVITY
Table A.2 summarises the measures, data sources, deflators and depreciation rates used to construct the Australian capital stock for each of the intangibles. The following sections explain these factors, and the rationale for them, in more detail. Table A.3 at the end of the chapter compares data sources across studies.
A.1 Expenditure on computerised information
As noted above, computer software is already capitalised into the national accounts by the ABS and these data are used in this paper.
The ABS defines computer software as: … computer programs, program descriptions and supporting materials for both systems and applications software. Included are purchased software, and, if the expenditure is large, software developed on own-account. Large expenditure on the purchase, development or extension of computer databases that are expected to be used for more than one year, whether marketed or not, are also included. (ABS 2000, p. 452)
CHS (2006) identify computer software and computerised databases separately — taking the computer software data and own account computer databases data from the US National Income and Product Accounts. The purchased component of computer databases is estimated from US Services Annual Survey (based on subscription revenue from database and directory publishing industry).2
The ABS measure appears broadly similar to the combined CHS measures. However, the ABS measure may understate this intangible through the exclusion of some database and own-account software development.
It should be noted that the asset lives used for computer software differ across countries. For example, the average depreciation rate is 20 per cent in the Australian national accounts compared with 40 per cent in the United Kingdom. In the US study, CHS (2006) use 33 per cent and this is followed by in the Japanese study.
2 This was around 2 per cent of software included in the US National Income and Product
Accounts in 1998–2000 (CHS 2005, table 3).
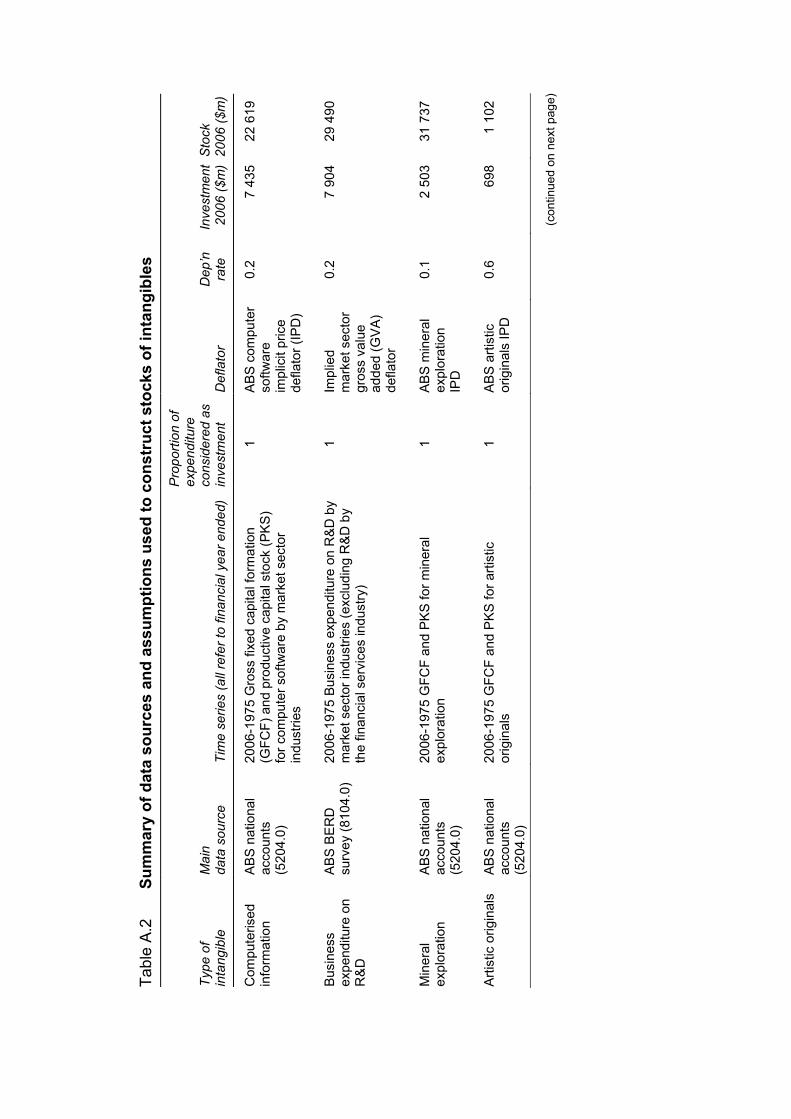
Tabl
e A
.2
Sum
mar
y of
dat
a so
urce
s an
d as
sum
ptio
ns u
sed
to c
onst
ruct
sto
cks
of in
tang
ible
s
Type
of
inta
ngib
le
Mai
n
data
sou
rce
Tim
e se
ries
(all
refe
r to
finan
cial
yea
r end
ed)
Pro
porti
on o
f ex
pend
iture
co
nsid
ered
as
inve
stm
ent
Def
lato
r
D
ep’n
ra
te
Inve
stm
ent
2006
($m
)
Sto
ck
2006
($m
)
Com
pute
rised
in
form
atio
n A
BS
nat
iona
l ac
coun
ts
(520
4.0)
2006
-197
5 G
ross
fixe
d ca
pita
l for
mat
ion
(GFC
F) a
nd p
rodu
ctiv
e ca
pita
l sto
ck (P
KS
) fo
r com
pute
r sof
twar
e by
mar
ket s
ecto
r in
dust
ries
1 A
BS
com
pute
r so
ftwar
e im
plic
it pr
ice
defla
tor (
IPD
)
0.2
7 43
5 22
619
Busi
ness
ex
pend
iture
on
R&
D
AB
S B
ER
D
surv
ey (8
104.
0)
2006
-197
5 Bu
sine
ss e
xpen
ditu
re o
n R
&D b
y m
arke
t sec
tor i
ndus
tries
(exc
ludi
ng R
&D
by
the
finan
cial
ser
vice
s in
dust
ry)
1 Im
plie
d m
arke
t sec
tor
gros
s va
lue
adde
d (G
VA
) de
flato
r
0.2
7 90
4 29
490
Min
eral
ex
plor
atio
n A
BS
nat
iona
l ac
coun
ts
(520
4.0)
2006
-197
5 G
FCF
and
PK
S fo
r min
eral
ex
plor
atio
n 1
AB
S m
iner
al
expl
orat
ion
IPD
0.1
2 50
3 31
737
Arti
stic
orig
inal
s A
BS
nat
iona
l ac
coun
ts
(520
4.0)
2006
-197
5 G
FCF
and
PK
S fo
r arti
stic
or
igin
als
1 A
BS
arti
stic
or
igin
als
IPD
0.
6 69
8 1
102
(con
tinue
d on
nex
t pag
e)
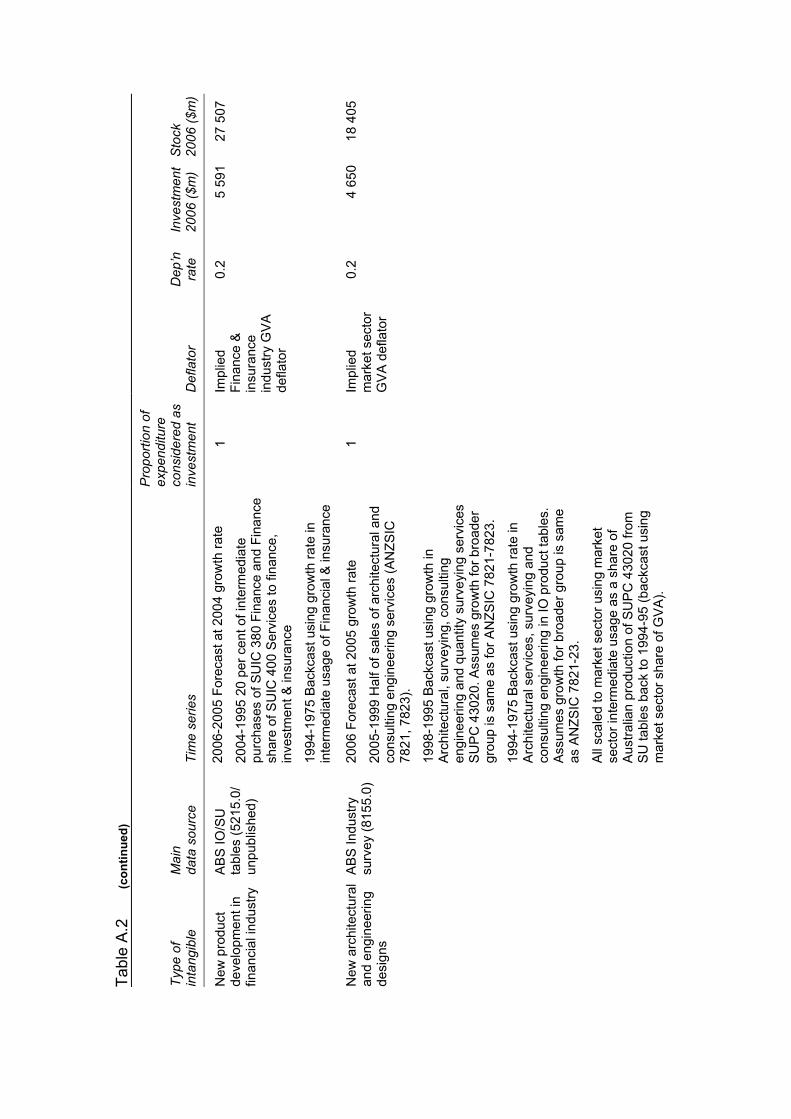
Tabl
e A
.2
(con
tinue
d)
Type
of
inta
ngib
le
Mai
n
data
sou
rce
Tim
e se
ries
Pro
porti
on o
f ex
pend
iture
co
nsid
ered
as
inve
stm
ent
Def
lato
r
D
ep’n
ra
te
Inve
stm
ent
2006
($m
)
Sto
ck
2006
($m
)
New
pro
duct
de
velo
pmen
t in
finan
cial
indu
stry
AB
S IO
/SU
ta
bles
(521
5.0/
un
publ
ishe
d)
2006
-200
5 Fo
reca
st a
t 200
4 gr
owth
rate
2004
-199
5 20
per
cen
t of i
nter
med
iate
pu
rcha
ses
of S
UIC
380
Fin
ance
and
Fin
ance
sh
are
of S
UIC
400
Ser
vice
s to
fina
nce,
in
vest
men
t & in
sura
nce
1994
-197
5 Ba
ckca
st u
sing
gro
wth
rate
in
inte
rmed
iate
usa
ge o
f Fin
anci
al &
insu
ranc
e
1 Im
plie
d Fi
nanc
e &
in
sura
nce
indu
stry
GV
A
defla
tor
0.2
5 59
1 27
507
New
arc
hite
ctur
al
and
engi
neer
ing
desi
gns
AB
S In
dust
ry
surv
ey (8
155.
0)
2006
For
ecas
t at 2
005
grow
th ra
te
2005
-199
9 H
alf o
f sal
es o
f arc
hite
ctur
al a
nd
cons
ultin
g en
gine
erin
g se
rvic
es (A
NZS
IC
7821
, 782
3).
1998
-199
5 Ba
ckca
st u
sing
gro
wth
in
Arc
hite
ctur
al, s
urve
ying
, con
sulti
ng
engi
neer
ing
and
quan
tity
surv
eyin
g se
rvic
es
SU
PC
430
20. A
ssum
es g
row
th fo
r bro
ader
gr
oup
is s
ame
as fo
r AN
ZSIC
782
1-78
23.
1994
-197
5 Ba
ckca
st u
sing
gro
wth
rate
in
Arc
hite
ctur
al s
ervi
ces,
sur
veyi
ng a
nd
cons
ultin
g en
gine
erin
g in
IO p
rodu
ct ta
bles
. A
ssum
es g
row
th fo
r bro
ader
gro
up is
sam
e as
AN
ZSIC
782
1-23
.
All
scal
ed to
mar
ket s
ecto
r usi
ng m
arke
t se
ctor
inte
rmed
iate
usa
ge a
s a
shar
e of
A
ustra
lian
prod
uctio
n of
SU
PC
430
20 fr
om
SU
tabl
es b
ack
to 1
994-
95 (b
ackc
ast u
sing
m
arke
t sec
tor s
hare
of G
VA
).
1 Im
plie
d m
arke
t sec
tor
GV
A d
efla
tor
0.2
4 65
0 18
405
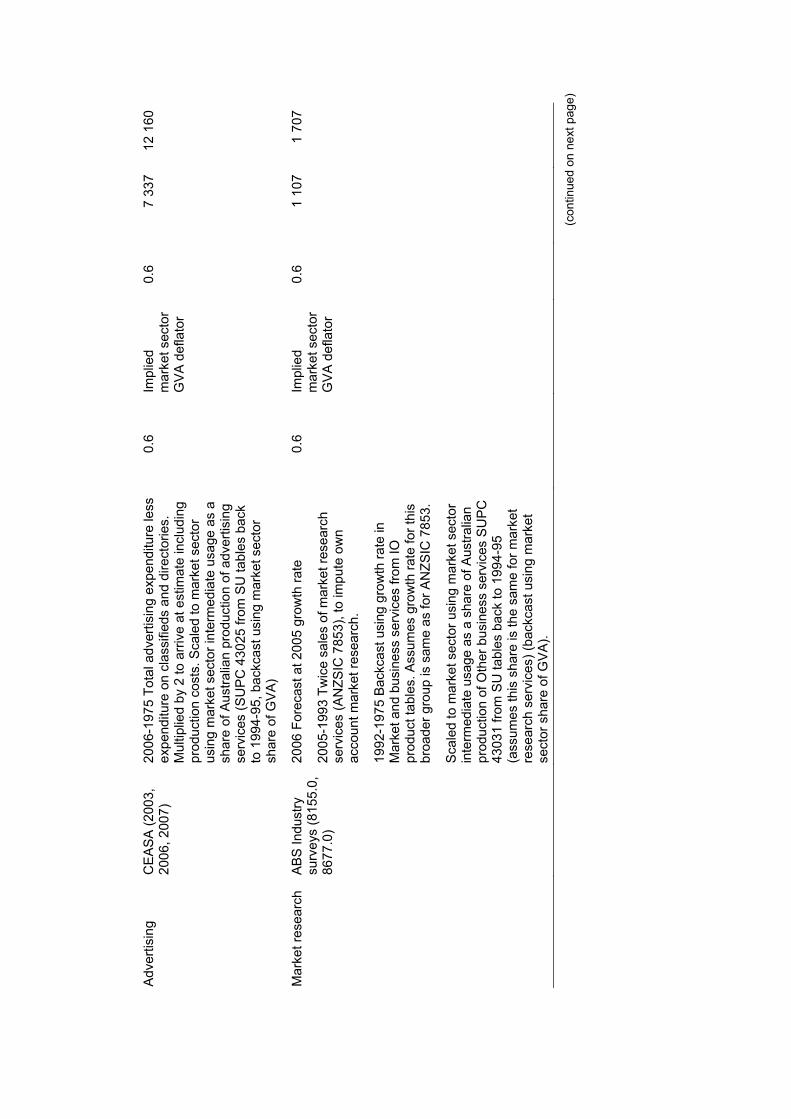
Adv
ertis
ing
CE
AS
A (2
003,
20
06, 2
007)
20
06-1
975
Tota
l adv
ertis
ing
expe
nditu
re le
ss
expe
nditu
re o
n cl
assi
fieds
and
dire
ctor
ies.
M
ultip
lied
by 2
to a
rrive
at e
stim
ate
incl
udin
g pr
oduc
tion
cost
s. S
cale
d to
mar
ket s
ecto
r us
ing
mar
ket s
ecto
r int
erm
edia
te u
sage
as
a sh
are
of A
ustra
lian
prod
uctio
n of
adv
ertis
ing
serv
ices
(SU
PC
430
25 fr
om S
U ta
bles
bac
k to
199
4-95
, bac
kcas
t usi
ng m
arke
t sec
tor
shar
e of
GV
A)
0.6
Impl
ied
mar
ket s
ecto
r G
VA
def
lato
r
0.6
7 33
7 12
160
Mar
ket r
esea
rch
AB
S In
dust
ry
surv
eys
(815
5.0,
86
77.0
)
2006
For
ecas
t at 2
005
grow
th ra
te
2005
-199
3 Tw
ice
sale
s of
mar
ket r
esea
rch
serv
ices
(AN
ZSIC
785
3), t
o im
pute
ow
n ac
coun
t mar
ket r
esea
rch.
1992
-197
5 Ba
ckca
st u
sing
gro
wth
rate
in
Mar
ket a
nd b
usin
ess
serv
ices
from
IO
prod
uct t
able
s. A
ssum
es g
row
th ra
te fo
r thi
s br
oade
r gro
up is
sam
e as
for A
NZS
IC 7
853.
Sca
led
to m
arke
t sec
tor u
sing
mar
ket s
ecto
r in
term
edia
te u
sage
as
a sh
are
of A
ustra
lian
prod
uctio
n of
Oth
er b
usin
ess
serv
ices
SU
PC
43
031
from
SU
tabl
es b
ack
to 1
994-
95
(ass
umes
this
sha
re is
the
sam
e fo
r mar
ket
rese
arch
ser
vice
s) (b
ackc
ast u
sing
mar
ket
sect
or s
hare
of G
VA).
0.6
Impl
ied
mar
ket s
ecto
r G
VA
def
lato
r
0.6
1 10
7 1
707
(con
tinue
d on
nex
t pag
e)
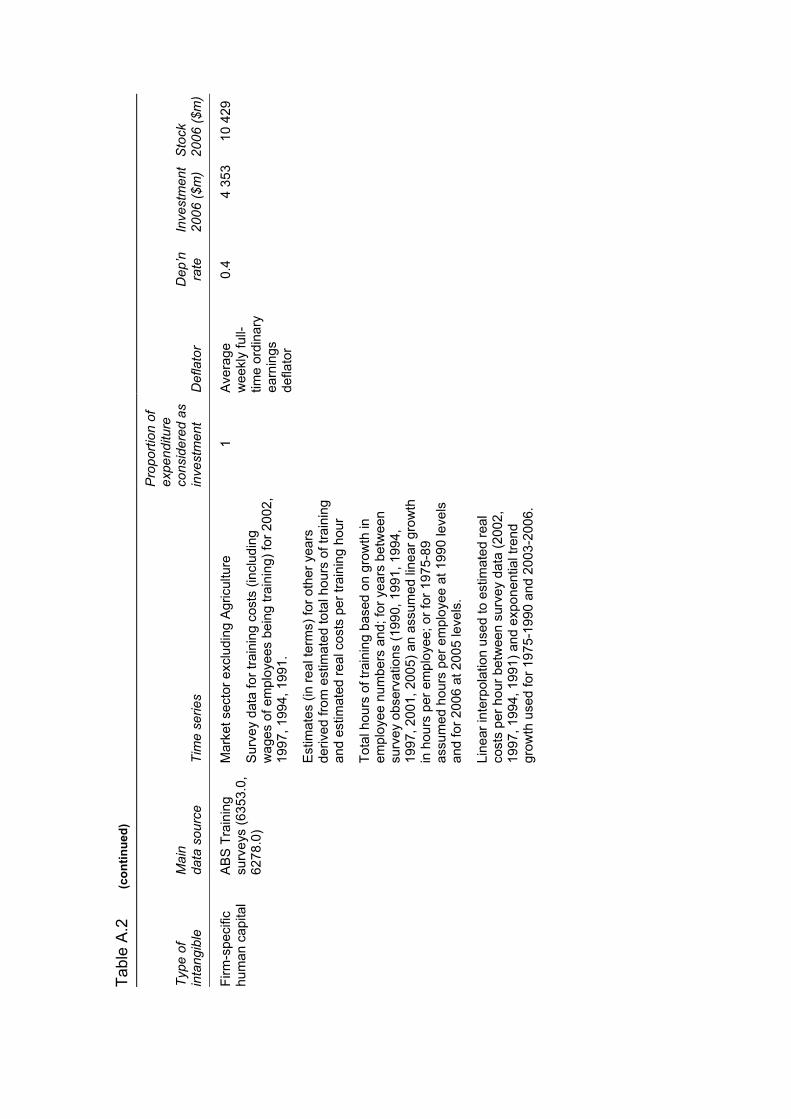
Tabl
e A
.2
(con
tinue
d)
Type
of
inta
ngib
le
Mai
n
data
sou
rce
Tim
e se
ries
Pro
porti
on o
f ex
pend
iture
co
nsid
ered
as
inve
stm
ent
Def
lato
r
D
ep’n
ra
te
Inve
stm
ent
2006
($m
)
Sto
ck
2006
($m
)
Firm
-spe
cific
hu
man
cap
ital
AB
S T
rain
ing
surv
eys
(635
3.0,
62
78.0
)
Mar
ket s
ecto
r exc
ludi
ng A
gric
ultu
re
Sur
vey
data
for t
rain
ing
cost
s (in
clud
ing
wag
es o
f em
ploy
ees
bein
g tra
inin
g) fo
r 200
2,
1997
, 199
4, 1
991.
Est
imat
es (i
n re
al te
rms)
for o
ther
yea
rs
deriv
ed fr
om e
stim
ated
tota
l hou
rs o
f tra
inin
g an
d es
timat
ed re
al c
osts
per
trai
ning
hou
r
Tota
l hou
rs o
f tra
inin
g ba
sed
on g
row
th in
em
ploy
ee n
umbe
rs a
nd; f
or y
ears
bet
wee
n su
rvey
obs
erva
tions
(199
0, 1
991,
199
4,
1997
, 200
1, 2
005)
an
assu
med
line
ar g
row
th
in h
ours
per
em
ploy
ee; o
r for
197
5-89
as
sum
ed h
ours
per
em
ploy
ee a
t 199
0 le
vels
an
d fo
r 200
6 at
200
5 le
vels
.
Line
ar in
terp
olat
ion
used
to e
stim
ated
real
co
sts
per h
our b
etw
een
surv
ey d
ata
(200
2,
1997
, 199
4, 1
991)
and
exp
onen
tial t
rend
gr
owth
use
d fo
r 197
5-19
90 a
nd 2
003-
2006
.
1 A
vera
ge
wee
kly
full-
time
ordi
nary
ea
rnin
gs
defla
tor
0.4
4 35
3 10
429
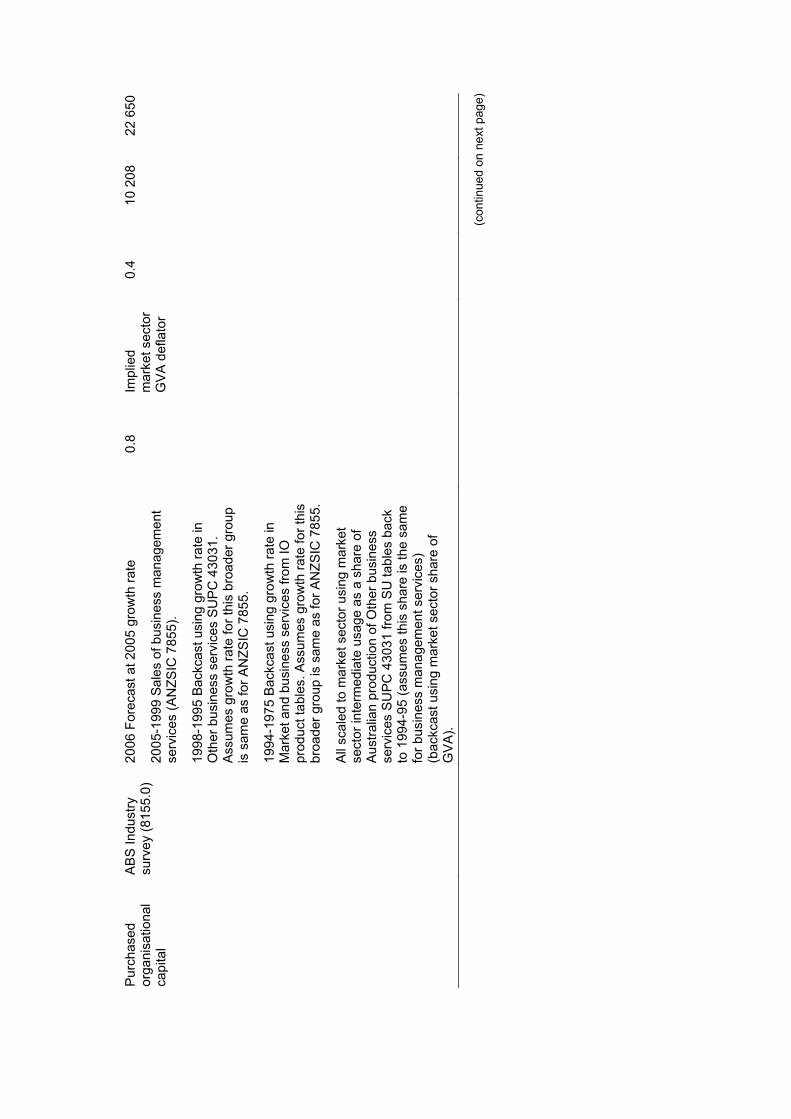
Pur
chas
ed
orga
nisa
tiona
l ca
pita
l
AB
S In
dust
ry
surv
ey (8
155.
0)
2006
For
ecas
t at 2
005
grow
th ra
te
2005
-199
9 Sa
les
of b
usin
ess
man
agem
ent
serv
ices
(AN
ZSIC
785
5).
1998
-199
5 Ba
ckca
st u
sing
gro
wth
rate
in
Oth
er b
usin
ess
serv
ices
SU
PC
430
31.
Ass
umes
gro
wth
rate
for t
his
broa
der g
roup
is
sam
e as
for A
NZS
IC 7
855.
1994
-197
5 Ba
ckca
st u
sing
gro
wth
rate
in
Mar
ket a
nd b
usin
ess
serv
ices
from
IO
prod
uct t
able
s. A
ssum
es g
row
th ra
te fo
r thi
s br
oade
r gro
up is
sam
e as
for A
NZS
IC 7
855.
All
scal
ed to
mar
ket s
ecto
r usi
ng m
arke
t se
ctor
inte
rmed
iate
usa
ge a
s a
shar
e of
A
ustra
lian
prod
uctio
n of
Oth
er b
usin
ess
serv
ices
SU
PC 4
3031
from
SU
tabl
es b
ack
to 1
994-
95 (a
ssum
es th
is s
hare
is th
e sa
me
for b
usin
ess
man
agem
ent s
ervi
ces)
(b
ackc
ast u
sing
mar
ket s
ecto
r sha
re o
f G
VA
).
0.8
Impl
ied
mar
ket s
ecto
r G
VA
def
lato
r
0.4
10 2
08
22 6
50
(con
tinue
d on
nex
t pag
e)
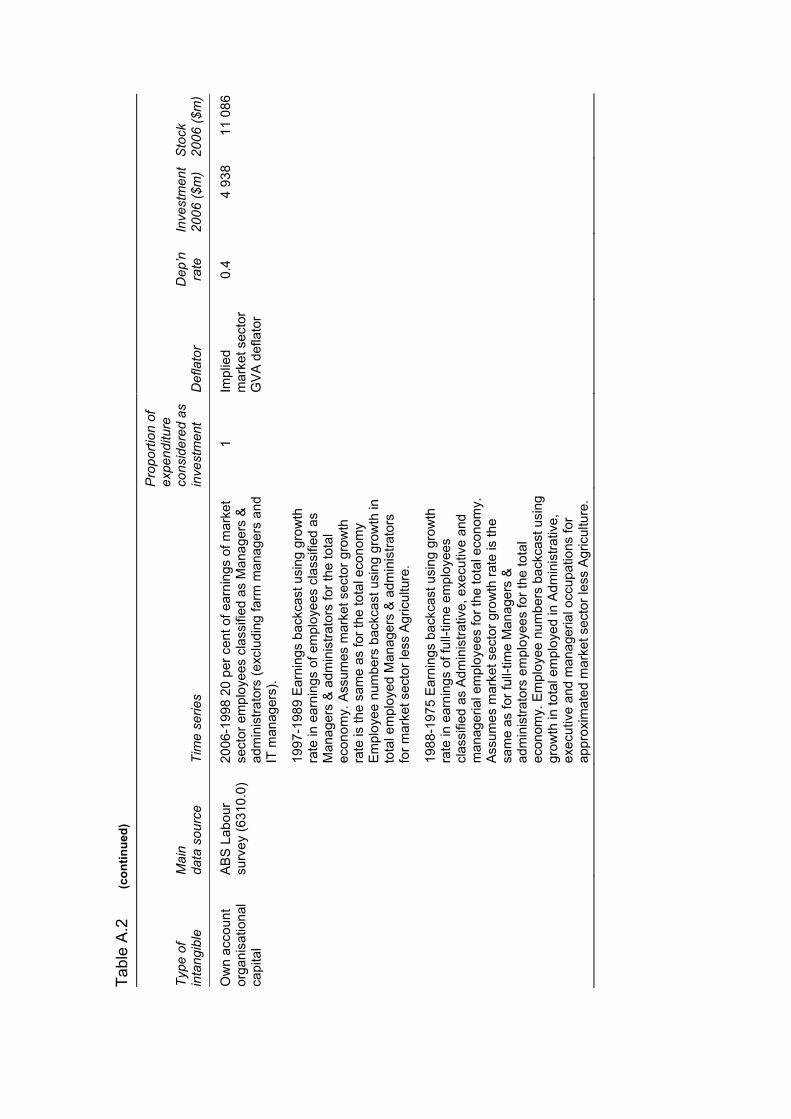
Tabl
e A
.2
(con
tinue
d)
Type
of
inta
ngib
le
Mai
n
data
sou
rce
Tim
e se
ries
Pro
porti
on o
f ex
pend
iture
co
nsid
ered
as
inve
stm
ent
Def
lato
r
D
ep’n
ra
te
Inve
stm
ent
2006
($m
)
Sto
ck
2006
($m
)
Ow
n ac
coun
t or
gani
satio
nal
capi
tal
AB
S L
abou
r su
rvey
(631
0.0)
20
06-1
998
20 p
er c
ent o
f ear
ning
s of
mar
ket
sect
or e
mpl
oyee
s cl
assi
fied
as M
anag
ers
&
adm
inis
trato
rs (e
xclu
ding
farm
man
ager
s an
d IT
man
ager
s).
1997
-198
9 Ea
rnin
gs b
ackc
ast u
sing
gro
wth
ra
te in
ear
ning
s of
em
ploy
ees
clas
sifie
d as
M
anag
ers
& a
dmin
istra
tors
for t
he to
tal
econ
omy.
Ass
umes
mar
ket s
ecto
r gro
wth
ra
te is
the
sam
e as
for t
he to
tal e
cono
my
Em
ploy
ee n
umbe
rs b
ackc
ast u
sing
gro
wth
in
tota
l em
ploy
ed M
anag
ers
& a
dmin
istra
tors
fo
r mar
ket s
ecto
r les
s A
gric
ultu
re.
1988
-197
5 Ea
rnin
gs b
ackc
ast u
sing
gro
wth
ra
te in
ear
ning
s of
full-
time
empl
oyee
s cl
assi
fied
as A
dmin
istra
tive,
exe
cutiv
e an
d m
anag
eria
l em
ploy
ees
for t
he to
tal e
cono
my.
A
ssum
es m
arke
t sec
tor g
row
th ra
te is
the
sam
e as
for f
ull-t
ime
Man
ager
s &
ad
min
istra
tors
em
ploy
ees
for t
he to
tal
econ
omy.
Em
ploy
ee n
umbe
rs b
ackc
ast u
sing
gr
owth
in to
tal e
mpl
oyed
in A
dmin
istra
tive,
ex
ecut
ive
and
man
ager
ial o
ccup
atio
ns fo
r ap
prox
imat
ed m
arke
t sec
tor l
ess
Agr
icul
ture
.
1 Im
plie
d m
arke
t sec
tor
GV
A d
efla
tor
0.4
4 93
8 11
086
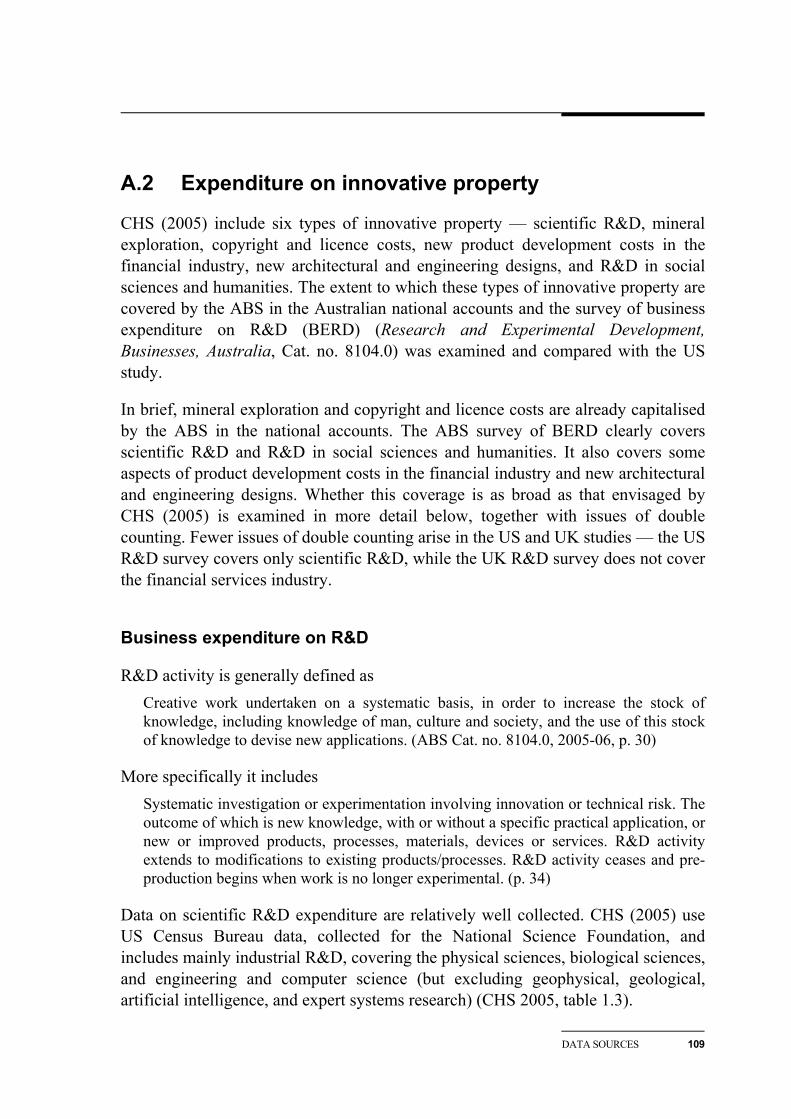
DATA SOURCES 109
A.2 Expenditure on innovative property
CHS (2005) include six types of innovative property — scientific R&D, mineral exploration, copyright and licence costs, new product development costs in the financial industry, new architectural and engineering designs, and R&D in social sciences and humanities. The extent to which these types of innovative property are covered by the ABS in the Australian national accounts and the survey of business expenditure on R&D (BERD) (Research and Experimental Development, Businesses, Australia, Cat. no. 8104.0) was examined and compared with the US study.
In brief, mineral exploration and copyright and licence costs are already capitalised by the ABS in the national accounts. The ABS survey of BERD clearly covers scientific R&D and R&D in social sciences and humanities. It also covers some aspects of product development costs in the financial industry and new architectural and engineering designs. Whether this coverage is as broad as that envisaged by CHS (2005) is examined in more detail below, together with issues of double counting. Fewer issues of double counting arise in the US and UK studies — the US R&D survey covers only scientific R&D, while the UK R&D survey does not cover the financial services industry.
Business expenditure on R&D
R&D activity is generally defined as Creative work undertaken on a systematic basis, in order to increase the stock of knowledge, including knowledge of man, culture and society, and the use of this stock of knowledge to devise new applications. (ABS Cat. no. 8104.0, 2005-06, p. 30)
More specifically it includes Systematic investigation or experimentation involving innovation or technical risk. The outcome of which is new knowledge, with or without a specific practical application, or new or improved products, processes, materials, devices or services. R&D activity extends to modifications to existing products/processes. R&D activity ceases and pre-production begins when work is no longer experimental. (p. 34)
Data on scientific R&D expenditure are relatively well collected. CHS (2005) use US Census Bureau data, collected for the National Science Foundation, and includes mainly industrial R&D, covering the physical sciences, biological sciences, and engineering and computer science (but excluding geophysical, geological, artificial intelligence, and expert systems research) (CHS 2005, table 1.3).
110 INTANGIBLE ASSETS AND AUSTRALIA'S PRODUCTIVITY
Expenditure series
A current price series for Australian BERD for the market sector (excluding Agriculture, forestry & fishing3) was available from Shanks and Zheng (2006).4 This series covered 1968-69 to 2002-03. For this paper it was updated and extended to 2005-06 using revised and updated data from the ABS Research and Experimental Development, Businesses, Australia, 2005-06 (Cat. no. 8104.0).5
The Shanks and Zheng dataset is primarily based on ABS Cat. no. 8104.0 and related unpublished data but has been adjusted in several ways. These adjustments are discussed in detail in appendix A of Shanks and Zheng (2006). The main adjustment was to approximate the market sector expenditure by deducting Property & business services (excluding Scientific research).6
It should be noted that the ABS BERD data includes R&D in social sciences and humanities (identified as a separate category of intangible in the US study). In this paper, the intangible category of ‘scientific R&D’ includes ‘R&D in social sciences and humanities’ The ABS BERD survey uses the Frascati definition of R&D (as described above), which includes R&D in fields classed as social sciences and humanities.
• For R&D undertaken by businesses themselves, the scope of the activity includes social sciences and humanities (for example, fields such economics; commerce, management, tourism and services; journalism, librarianship and curatorial services; language and culture; and the arts). To the extent that R&D in these fields is undertaken by businesses in the market sector, that R&D is included in the market sector BERD estimates discussed above.
3 The ABS did not directly survey farms and other businesses in this industry until 2005-06.
Generally R&D related to this industry is performed in government, higher education and private non-profit institutions, as well as by businesses classified to other industries (Shanks and Zheng 2006, p. A.3). Agriculture has been excluded from the 2005-06 data to maintain comparability over time.
4 An electronic dataset is available athttp://www.pc.gov.au/research/staffworkingpaper/ economicmodelling [R&D stocks constructions (domestic) Ext Rel.xls: Series - adjusted BERD (less PBS)] (accessed 31 October 2007).
5 The series used is total expenditure on R&D, not just current expenditure. This means that there is some double counting of capital expenditure, as was also the case in the UK study. However, capital expenditure was only 6 per cent of total Australian BERD in 2005-06 ($641 million out of $10 081 million).
6 Some non-market sectors could not be excluded because of lack of disaggregated data. The industry ‘Scientific Research’ (ANZSIC 781) was not excluded because it undertakes R&D principally for other industries. The R&D of this industry was therefore redistributed to the other industries using a breakdown by socio-economic objective of the R&D, so as to obtain the market sector portion of this research. See Shanks and Zheng (2006, appendix A) for further details.
DATA SOURCES 111
• In addition, the market sector BERD estimates include a portion of ANZSIC industry 7810 Scientific research. The scope of this industry also includes social sciences as well as agricultural, biological and physical sciences.
van Rooijen-Horsten et al. (2008, p. 12) note that it is possible that an R&D survey based on Frascati definitions of R&D would result in an underestimation of R&D in social sciences and humanities (as well as R&D in financial services). This is because ad hoc R&D is common in social sciences, humanities and financial services industries rather than systematic R&D (as would be required to meet the Frascati definition of R&D). However, in the absence of any measure of the likely understatement, in this paper (as in van Rooijen-Horsten et al. 2008) it is assumed that the BERD survey correctly measures R&D in social sciences and humanities.
While R&D in social sciences and humanities was separately identified in the US and UK studies of intangibles this has not been possible for this paper.7 A separate consistent time series for this subset of R&D was not readily available for Australia.
It should also be noted that the ABS BERD data does include some R&D related to financial services and architectural/engineering services. It appears that the scope of these types of R&D as discussed in CHS (2005) is broader than those activities that may be covered by the BERD survey. For this reason the CHS method has been used to estimate these components of R&D (as discussed below). The ABS BERD data have therefore been adjusted, where possible, to avoid double counting of these types of R&D under Scientific research. For R&D in financial services it has been possible to construct a series for the financial services industry component of the ABS BERD estimates8 and reduce BERD by this amount. Insufficient data are available to make any adjustment for ‘new architectural and engineering designs’ (the extent of any duplication is discussed below under that heading).
Investment series
Marrano and Haskel (MH 2006) exclude expenditure on R&D in the computer industry from its investment series in order to avoid double counting with software. It has not been possible to make this exclusion for this paper. However, much of software R&D would be undertaken by the Computer services industry (part of Property and business services and outside the market sector) and is already excluded from the Shank and Zheng estimates of BERD for the market sector. 7 R&D in social sciences was also included with Scientific R&D for Finland and the Netherlands.
For the Japanese study this category was not included at all due to lack of data. 8 Data are available for expenditure on R&D by the financial services industry from 1986-87 to
2005-06. Prior to this R&D for the financial services industry was included in ‘Other nec’ and the growth in this series has been used to backcast the financial services industry series.
112 INTANGIBLE ASSETS AND AUSTRALIA'S PRODUCTIVITY
In line with CHS (2006) the whole of BERD for the market sector was considered investment. The expenditure series was deflated by the implied market sector GVA deflator (base year 2005-06) to obtain the real investment series.
Capital series
The capital stock series was constructed using the perpetual inventory method (PIM), as described in chapter 4, with an assumed 20 per cent depreciation rate. This was in line with the rate used in CHS (2005, p. 23), which is assumed to be the mid-range of rates reported in the literature. As discussed in chapter 4, instead of selecting a year when the initial stock is equal to zero, the alternative method was used in which the initial stock for the first year of the data series is estimated by dividing that year’s investment by the sum of the depreciation rate and the trend growth rate over years for which investment data are available.
Mineral exploration
As noted above, mineral exploration is already capitalised into the national accounts by the ABS and these data are used in this paper. There is no overlap between R&D carried out for Mining, such as the development of new exploration techniques and associated research, which is included in Scientific R&D, and mineral exploration as currently capitalised, which is the use of existing exploration techniques.
CHS (2005, table 1.3) include mining R&D and mineral exploration, having excluded mining R&D from scientific research. The UK study includes mining R&D under scientific R&D, and therefore includes only mineral exploration in its estimate of this intangible.
Artistic originals
As noted above, artistic originals are already capitalised into the national accounts by the ABS and these data are used in this paper. The ABS defines entertainment, literary or artistic originals as:
… originals of films, sound recordings, manuscripts, tapes, models, etc., on which drama performances, radio and television programming, musical performances, sporting events, literary and artistic output, etc., are recorded or embodied. (ABS 2000, p. 454)
The UK, Finnish and Netherlands studies also use artistic originals as defined under the System of National Accounts (SNA93). This measure appears to have similar coverage to the copyright and licence cost intangible in CHS (2005), which is
DATA SOURCES 113
proxied by development costs in the motion picture industry plus double new product development costs for motion pictures as crude proxy for development costs in radio, TV, sound recording and book publishing industries. MH (2006, p. 6) note that while the national accounts measure may not cover as wide a definition as envisaged by CHS it probably covers the main expenditures of this type.
Other product development, design and research
Traditional definitions of R&D exclude items such as design and some non-scientific research. However, the Frascati Manual (OECD 2002) in its proposed standard practice for surveys on R&D does include R&D activities beyond the traditional scientific R&D, such as R&D in banking and insurance, other service industries and R&D in social sciences and humanities. This is the classification system used by the ABS in its survey of business R&D. Therefore the estimates of BERD will include some of these ‘other product development, design and research’ listed in CHS (2005). The scope of the measures used in this paper for each type of other product R&D is discussed below.
New product development costs in the financial industry
CHS (2005) use a crude proxy for spending on new product development by the financial services industry of 20 per cent of total intermediate purchases of that industry. CHS (2006, p. 18) note
Many new products in the financial services industry involve computerized information; to avoid double-counting (particularly with the own-account portion of computer software), we deliberately were very conservative in our estimates for this component.
MH (2006, p. 7) improve on this crude proxy by deducting purchases of intermediate inputs counted elsewhere in intangibles — that is, advertising, software, consulting services and architectural and engineering activities.
The ABS BERD survey follows the Frascati Manual classification of R&D. Examples of R&D in banking provided in the Frascati Manual (OECD 2002, pp. 49–50) include:
• Mathematical research relating to financial risk analysis.
• Development of risk models for credit policy.
• Experimental development of new software for home banking.
• Development of techniques for investigating consumer behaviour for the purpose of creating new types of accounts and banking services.
114 INTANGIBLE ASSETS AND AUSTRALIA'S PRODUCTIVITY
• R&D related to electronic banking and insurance, Internet-related services and e-commerce applications.
• R&D related to new or significantly improved financial services (new concepts for accounts, loans, insurance and saving instruments).
Australian BERD would therefore appear to cover at least some of the types of developments envisaged by CHS (2006), although no specific examples were given in their paper. van Rooijen-Horsten et al. (2008, p. 12) note that it is possible that an R&D survey based on Frascati definitions of R&D would result in an underestimation of R&D in financial services industries. They suggest that ad hoc R&D is common in the financial services industries and is excluded from the Frascati definition of R&D since it is not undertaken on a systematic basis.
Estimates based on the CHS method were compared with the financial services industry component of the ABS BERD survey and found to be considerably smaller.9 For comparability with the US study, the CHS method of estimating financial services R&D has been used in this paper.10 To avoid double counting, the financial services industry component of total BERD from the ABS R&D survey has been excluded from Scientific research (as noted above).
However, it should be noted that if the ABS estimate of financial services industry R&D does cover all relevant R&D activity in this industry, the CHS-type estimate will represent a considerable overstatement of this intangible.
Expenditure series
The financial services industries of interest in the Australian context are a subset of ANZSIC Division K Finance & insurance — that is, Finance (ANZSIC 73) and a share of Services to finance and insurance (ANZSIC 75).
For this paper, a series for total intermediate purchases by the financial services industries has been constructed from ABS data from input-output (IO) and supply-use (SU) tables. The SU industry codes equivalent to ANZSIC 73 and 75 are 380 Finance and 400 Services to finance, investment and insurance. The share of Services to finance, investment and insurance is based on the output share of Finance in the combined output of Finance and Insurance.
9 In 2005-06 the ABS BERD survey (Cat. no. 8104.0) reported total expenditure on R&D by
Finance & insurance of $902 million, which equates to only 16 per cent of the estimate using the CHS methodology. It is estimated that this percentage ranged from 2 to 17 per cent over the full period examined.
10 Both the US and UK surveys of R&D do not include financial services.
DATA SOURCES 115
An unpublished ABS SU data series was obtained for 1994-95 to 2003-04. To construct a data series covering the period 1974-75 to 2005-06 it was necessary to backcast and forecast sections of the data series. To backcast the period to 1974-75 a series for total intermediate purchases of financial services industries was assembled from ABS published IO tables, in the same manner as for the SU tables. The IO tables were available annually up to 1993-94, except for 1976-77, 1977-78, 1984-85, 1985-86, 1987-88, 1988-89, 1990-91 and 1991-92. The data for the missing years was interpolated and then the year on year growth rates from this series were applied to backcast the actual SU data series.11 The last two years of the SU series were then forecast on a linear growth path based on the actual SU data series. The resulting series was smoothed using a 3-period moving average.12
In line with CHS (2005), 20 per cent of intermediate purchases was counted as expenditure on financial services R&D. The Finance & insurance industry is part of the market sector so all expenditure on this intangible is relevant to a market sector estimate.
Investment series
Deductions of specific intermediate inputs (as suggested by MH 2006) have not been made. The need to combine irregular data from different sources in different classifications would have made any adjustment of this kind very imprecise. Some account of the potential for double counting is made by using the CHS (2006) ‘conservative’ 20 per cent of total intermediate purchases.
The investment series was deflated by the implied Finance & insurance gross value added (GVA) deflator.
Capital series
The capital stock series was constructed using PIM, as described in chapter 4, with an assumed depreciation rate of 20 per cent. This is in line with CHS (2006, p. 23) — based on the mid-range of rates for R&D in general (not specifically this type of R&D) reported in the literature.
11 The IO intermediate usage series is in basic prices while the SU series is in purchaser prices.
This backcasting method therefore assumes no major change in the rate of taxes, subsidies and margins (the difference between basic and purchaser prices).
12 The series was smoothed to remove some volatility caused by changes in classifications. The ABS cautions against interpreting IO data as a time series.
116 INTANGIBLE ASSETS AND AUSTRALIA'S PRODUCTIVITY
New architectural and engineering designs
CHS (2005) estimate this intangible as half of the revenue of the architectural and engineering industries. MH (2006) use 50 per cent of architectural and engineering activities industry turnover (after deducting industry purchases of advertising, software and consulting to avoid double counting with other intangibles). They also add twice the turnover of another industry, specialty design activities, as an estimate of own account new designs. Fukao et al. (2008b) estimate this intangible using input-output table data for new architectural design and service industry survey data for engineering design.
The Frascati Manual (OECD 2002) includes engineering and architectural R&D amongst the fields covered and these are also included in the ABS BERD survey. There are few details given in CHS (2005) as to the nature of the new architectural and engineering designs that make up this intangible asset in their study. However, it appears clear that the activities the authors have in mind fall outside what would ‘normally’ be considered architectural and engineering R&D — an example may be new designs using existing technology and methods — since their data source for ‘scientific R&D’ already includes engineering R&D in its scope. It is therefore assumed there is no issue of double counting between a CHS-type measure for Australia and activities covered above under the ABS BERD survey.
It is also the case that the ABS already capitalises some portion of architectural services (allocated to dwellings capital expenditure) and consulting engineering services (allocated to non-dwelling construction capital expenditure).13 Sufficient data to make an adjustment for double counting with the CHS-type measure were not available. However, in the case of architectural services there should not be any overlap with an estimate for the market sector since dwellings capital falls outside the market sector.
Expenditure series
A time series of revenue of architectural and engineering industries was constructed for this paper using a number of data sources. The relevant industries for new designs are ANZSIC 7821 Architectural services and ANZSIC 7823 Consulting engineering.
13 The Dutch and Finnish studies (RBT 2008 and Jalava, Aulin-Ahmavaara and Alanen 2007) both
refer to a large part of architectural and engineering design expenditure being registered as investment in the national accounts. In those studies, this investment is deducted from tangible capital and separately identified.

DATA SOURCES 117
Data on revenue for ANZSIC industry classes are available from Australian Industry (ABS Cat. no. 8155.0).14 Sales of goods and services/operating income is available for 1998-99 to 2000-01 and 2002-03 and total income (including other income such as interest income) for 2002-03 to 2004-05. Sales of goods and services is the most relevant measure so the growth rate in total income for the latter period was applied to sales in 2002-03 to estimate this series to 2004-05. The 2005-06 estimate was made assuming that growth rate for sales was the same as in 2004-05.
To estimate data for the missing years and backcast the aggregate series of architectural and engineering services to 1974-75, the growth rates for Australian production in published data for a related group of services from the product details of the ABS Australian National Accounts: Input-Output Tables (Cat. no. 5215.0) and unpublished SU tables were used.15,16
The SU data were used to backcast from 1998-99 to 1994-95 and derive an estimate for 2001-02. The most recent data in the SU tables (1994-95 to 2002-03) cover Architectural services, surveying, consulting engineering and quantity surveying (SUPC 43020).17 Surveying (equivalent to ANZSIC 7822) is not included above but accounts for only a small proportion of the combined total of ANZSIC 7821-7823 (for example, 7 per cent in 2004-05) and should not distort the growth rate to any great extent for this purpose.
The IO Australian production data were used to backcast from 1998-99 to 1974-75. The IO tables cover selected years over the period 1974-75 to 2001-02.18 There has been a variety of classification changes over time but a reasonably consistent series is available for the sum of Architectural services, Surveying and Consulting engineering (including Technical services nec which is not included above) for the period 1974-75 to 1986-87.19 In 1989-90 and 1992-93 there were classification 14 Prior to 1998-99 there were some irregular surveys of selected technical services (for example,
Technical Service, 1992-93, ABS Cat. no. 8676.0 and Engineering and Technical Services Industry, 1987-88, Cat. no. 8666.0) but data from these surveys was not comparable as a result of definitional changes.
15 Product data included the amount of that product produced by all industries not just the main industry that produces that product. However, in this case most of these services are produced by one industry.
16 The series was smoothed with a 3-period moving average to remove some volatility due to classification changes.
17 There is no equivalent group in the SU tables from 2003-04 onwards because of a change in classification.
18 Annual except for 1975-76, 1976-77, 1984-85, 1985-86, 1987-88, 1988-89, 1990-91, 1991-92, 1995-96, 1997-98, 1999-00 and 2000-01.
19 Unable to exclude Surveying because of apparent changes in classification over time.
118 INTANGIBLE ASSETS AND AUSTRALIA'S PRODUCTIVITY
changes that affected the growth rate but there were no readily available data to use to adjust for these changes. The missing years in the IO series were interpolated by simple averages.
The resulting series for sales income for architectural and engineering design services was for the total economy (that is, Australian production of these services20). It was necessary to scale it down to the share relevant to market sector intermediate usage. Using the SU tables the market sector intermediate usage share of Australian production of SUPC 43020 Architectural, surveying, consulting engineering and quantity surveying services was calculated for 1994-95 to 2002-03.21 This share was backcast to 1974-75 and forecast for 2003-04 to 2005-06 using growth in the market sector share of gross value added.22
In line with CHS (2005), 50 per cent of the derived sales series was counted as expenditure on new architectural and engineering designs.
Investment series
Deductions of specific intermediate inputs (as suggested by MH 2006) have not been made due to lack of data. Nor has any additional estimate been made of own account design.
The investment series was deflated by the implied market sector GVA deflator.
Capital series
The capital stock series was constructed using PIM, as described in chapter 4, with an assumed depreciation rate of 20 per cent, in line with CHS (2006, p. 23).
20 Insufficient data were available to make any adjustment for any difference between exports and
imports of these services. The estimates implicitly assume net exports are zero — if net exports are positive (negative) then the estimates will be overstated (understated).
21 This share was smoothed using a 3-period moving average to remove volatility. 22 Intermediate usage data from IO tables for a broader group of services (Scientific research,
technical and computing services) that includes architectural and engineering services) were examined but the series was quite volatile — partly due to changes in classifications over time. The ABS cautions against using such data as a time series.
DATA SOURCES 119
A.3 Expenditure on economic competencies
Economic competencies are defined by CHS (2005, p. 28) as the value of brand names and other knowledge embedded in firm-specific human and structural resources.
Brand equity
Spending on brand development is proxied by spending on advertising and market research. CHS (2005, p. 28) suggest this includes the costs of launching new products, developing customer lists and maintaining brand equity and note that
Although advertising and market research are generally aimed at building a firm’s market share at the expense of its competitors, such spending is necessary for developing new brands and maintaining the value of existing brands.
Various rationales have been put forward for capitalising advertising and marketing expenditures — they may result in a positive image of the firm in the market and help to secure future orders (De and Dutta 2007); and they may establish a reputation for quality or educate consumers about the existence of new goods (Nakamura 1999, p. 6). A reputation for reliability may persuade shoppers to try a new item for the first time.
Advertising
CHS (2005) and Marrano, Haskel and Wallis (MHW 2006) estimate this intangible using data on advertising spending as collected by advertising associations. Fukao et al. (2008b) use advertising industry output from the national accounts. In all three studies 60 per cent of the expenditure on advertising was treated as investment.23
Expenditure series
Advertising expenditure by media sector is available from an annual survey of the industry conducted by Commercial Economic Advisory Service of Australia (CEASA 2003, 2006, 2007). This expenditure includes only media costs, not advertising agency commission, production costs or any other costs than for time
23 US data included all commissions as well as the art, mechanical and production expenses that
are part of the advertising budget for each medium (Universal McCann 2007). UK data also included production costs (Advertising Association 2005).
120 INTANGIBLE ASSETS AND AUSTRALIA'S PRODUCTIVITY
and space. This is a similar type of data source to that used in the overseas studies, except for the exclusion of production costs.
Hamilton and Denniss (2000, p. 55), stated that data on Australian production costs of advertisements, such as recording, editing and graphic design, are not available. This still appears to be the case. The production activities undertaken for advertising are also undertaken for other purposes. ABS data is not sufficiently disaggregated to identify the share relevant to advertising.
As the most readily available and complete time series of advertising expenditure for the total Australian economy, the CEASA series has been used. Data were compiled for 1974-2006. An adjustment was then made for production costs.
There are some readily available data on the likely share of production costs in total advertising expenditure in the United States. Data on total advertising expenditure are available from Universal McCann (2007) (as used in CHS 2006) and advertising expenditure excluding production costs from CEASA (2003, 2006, 2007). Production costs averaged 44 per cent of total advertising expenditure between 1993 and 2006. A similar calculation for the United Kingdom for 2004, using data from MHW (2006) and CEASA (2006), puts the UK share at 52 per cent. This assumes the data sources with and without production costs are reasonably comparable, which they appear to be.
Based on these data it is assumed that Australian advertising expenditure excluding production costs is 50 per cent of total advertising expenditure. Therefore the CEASA series, which excludes production costs, has been multiplied by two. The CEASA calendar year data were also averaged to derive a financial year series.
This has been scaled down to a market sector estimate using market sector intermediate usage as a share of Australian production24 of advertising services from the ABS SU tables for 1994-95 to 2003-04.25 This share was backcast to 1974-75 and forecast for 2004-05 and 2005-06 using growth in the market sector share of gross value added.26
24 Insufficient data were available to make any adjustment for any difference between exports and
imports of these services. The estimates implicitly assumes net exports are zero — if net exports are positive (negative) then the estimates will be overstated (understated).
25 This share was smoothed using a 3-period moving average to remove volatility. 26 Intermediate usage data from IO tables for a broader group of services (Legal, accounting,
marketing and business management services) were examined but the series was quite volatile — partly due to changes in classifications over time. The ABS cautions against using such data as a time series.
DATA SOURCES 121
Investment series
The extent to which expenditure on advertising is building an asset rather than being consumed is a separate issue. MH (2006, p. 8) suggest this is a difficult question.
An advertisement proclaiming the reliability of a good would seem, at least in part, to be expenditure on an asset. An advertisement proclaiming a price reduction for the next two weeks would seem to be better thought of as an intermediate spending, although if it is building a reputation for lower prices that would be an asset.
There are two issues — does the ad build an asset and how long lived is it? Some studies deducted from the expenditure series those types of ads not considered to be asset building at all. The US study only included the national ads as they were considered to be those aimed at selling specific products rather than promoting sales at specific stores (CHS 2005, p. 33). The UK study excluded classified ads (small personal ads by individuals or recruiting advertisements for vacancies to be filled in a relatively short time period) (MH 2006, p. 8). It has been possible to deduct classifieds and directories from the CEASA series for Australia.
Further adjustments were then made to account for ads that had short-lived effects. Those ads with a service life of less than one year would be an expense not an investment. CHS (2005, p. 32) note that while the literature finds that the effects of advertising are generally short-lived, more than half has a service life of at least one year. From this they assumed that 60 per cent of total advertising expenditures should be counted as investment.
In this study it will be assumed that 60 per cent of expenditure is an investment — this will provide comparability with the overseas studies.
The series was deflated by the implied market sector GVA deflator.
Capital series
The capital stock series was constructed using PIM, as described in chapter 4, with an assumed depreciation rate of 60 per cent. CHS (2006, p. 24) noted that the literature reports a wide range of findings on the longevity of advertising capital — with studies estimating service lives of between 0 and 7 years. They concluded that advertising has a service life of less than 3 years, implying a geometric rate of depreciation of 60 per cent.
122 INTANGIBLE ASSETS AND AUSTRALIA'S PRODUCTIVITY
Market research
CHS (2005) and MH (2006) estimate this intangible as twice the revenue of the market and consumer research industry. The use of twice industry revenue is to estimate firm’s own account spending on market research.
Expenditure series
A time series of revenue of the market research industry was constructed for this paper using a number of data sources. The relevant industry is ANZSIC 7853 Market research services.
Data on revenue for ANZSIC industry classes are available from Australian Industry (ABS Cat. no. 8155.0). Sales of goods and services/operating income is available for 1998-99 to 2000-01 and 2002-03 and total income (including other income such as interest income) for 2002-03 to 2004-05. Sales of goods and services is the most relevant measure so the growth rate in total income for the latter period was applied to sales in 2002-03 to estimate this series to 2004-05. The 2005-06 estimate was made assuming that the growth rate for sales was the same as in 2004-05.
Prior to 1998-99, an irregular survey, Selected Business Services, 1992-93 (ABS Cat. no. 8677.0) was carried out. From this survey data on sales of goods and services was available.27
The estimates for the missing year 2001-02 was interpolated by simple averages.
To backcast the series of market research services from 1992-93 to 1974-75, the growth in published data for a related group of services from the product details of the ABS Australian National Accounts: Input-Output Tables (Cat. no. 5215.0) was used.28 The IO tables cover selected years over the period.29 There has been a variety of classification changes over time but a reasonably consistent series is
27 An irregular survey conducted in 2001-02 (Market Research Services, ABS Cat. no. 8556.0) but
this had a different coverage of business services and was not comparable. 28 Product data included the amount of that product produced by all industries not just the main
industry that produces that product. However, in this case most of these products (or services in this case) are produced by one industry.
29 Annual except for 1975-76, 1976-77, 1984-85, 1985-86, 1987-88, 1988-89, 1990-91, 1991-92, 1995-96, 1997-98, 1999-00 and 2000-01.
DATA SOURCES 123
available for the sum of market and business services to 1991-92.30 Missing years were interpolated by simple averages.
The resulting series for sales income for market research services was for the total economy (that is, Australian production of these services31). It was necessary to scale it down to the share relevant to market sector intermediate usage using data on the closest available group of services. Using the SU tables the market sector intermediate usage share of Australian production of SUPC 43031 Other business services (which includes market research services among many other services) was calculated for 1994-95 to 2003-04.32 This share was backcast to 1974-75 and forecast for 2004-05 and 2005-06 using growth in the market sector share of gross value added.33
In line with CHS (2005), this series was doubled to obtain total expenditure on market research including own account market research.
Investment series
The expenditure series was adjusted to account for some market research information having a service life of less than one year. In this study it will be assumed that 60 per cent of expenditure is an investment — this will provide comparability with the overseas studies. The investment series was deflated by the implied market sector GVA deflator.
Capital series
The capital stock series was constructed using PIM, as described in chapter 4, with an assumed depreciation rate of 60 per cent, in line with CHS (2006, pp. 23–4) and the same as for advertising. This is based on a service life of less than 3 years, the average of the range reported in the advertising literature (see the discussion of advertising above).
30 The series was smoothed with a 3-period moving average to remove some volatility due to
classification changes. 31 Insufficient data were available to make any adjustment for any difference between exports and
imports of these services. The estimates implicitly assumes net exports are zero — if net exports are positive (negative) then the estimates will be overstated (understated).
32 This share was smoothed using a 3-period moving average to remove volatility. 33 Intermediate usage data from IO tables for a broader group of services (Legal, accounting,
marketing and business management services) were examined but the series was quite volatile — partly due to changes in classifications over time. The ABS cautions against using such data as a time series.
124 INTANGIBLE ASSETS AND AUSTRALIA'S PRODUCTIVITY
Firm-specific human capital
CHS (2005, p. 29) suggest that spending on firm-specific human capital can be measured by the costs of workforce training and education. Spending on workforce training consists of two types of expenses:
• direct firm expenses (outlays on inhouse and external training)
• wage and salary costs of employee time spent in informal and formal training.
Expenditure series
No single data source provides a time series of employer-provided training expenditure. To construct a series, several different sources were used, together with a number of assumptions. The resulting series is therefore only indicative.
The ABS Employer Training Expenditure, Australia (Cat. no. 6353.0), an employer survey, measured both direct costs and wage and salary costs for the total economy (excluding agriculture) for July to September34 1989, 1990, 1993 and 1996. The ABS also estimated this measure for 2001-02 based on data from Employer Training Expenditure and Practices (Cat. no. 6362.0) and Education and Training Experience (Cat. no. 6278.0) (NCETS 2004).35 Specifically the measure includes
The sum of employers’ expenditure for employees gross wages and salaries for time receiving and providing structured training, fees paid to consultants and institutions and other expenditure on structured training. (ABS Cat. no. 6353.0, 1996, p. 46)
where structured training is defined as all training activities which have a predetermined plan and format designed to develop employment-related skills and competencies. It consists of periods of instruction, or a combination of instruction and monitored practical work. (ABS Cat. no. 6353.0, 1996, p. 45)
34 These were multiplied by four to arrive at financial year estimates for 1989-90, 1990-91,
1993-94 and 1996-97. 35 It has not been possible to assess the effect of differences between these surveys on the trend in
the expenditure data. However, the ABS did make some adjustments for differences in scope to the expenditure data reported in NCETS (2004) for its comparison across surveys.
DATA SOURCES 125
No adjustment was made to account for Agriculture so the estimates will be an understatement.36
For 1993-94 and 1996-97 expenditure data were also available by industry enabling the construction of a market sector (excluding Agriculture) total. For 1990-91, the market sector estimate was derived by using the total economy growth in expenditure between 1990-91 and 1993-94. (This assumes a constant market sector share over this period.) For 1989-90 total expenditure was not available — data were only available for the total economy average of expenditure per training hour and training hours per employee. These data were used with the estimated training hours series for the market sector (discussed below) to derived total training expenditure for the market sector.
For 2001-02 the market sector estimate was derived by using total economy growth in expenditure between 1996-97 and 2001-02, adjusted for the fall in market sector share of total hours of training from ABS Education and Training Experience, Australia (Cat. no. 6278.0).
To complete the expenditure series it was necessary to use growth in a related series. No ideal series was available, but it was possible to construct an approximate series for total training hours for the market sector (excluding Agriculture). Hours of training per market sector employee was available for 1993-94 and 1996-97 from ABS Cat. no. 6353.0. The same measure for all employees was available from the same source for 1989-90, 1990-91, 1993-94 and 1996-97. The growth rate in this series was used to estimate the market sector measure for 1989-90 and 1990-91. It was also possible to derive hours of training per market sector employee from ABS Cat. no. 6278.0 for 1996-97, 2000-01 and 2004-05.37 Because of differences in survey coverage and methodology between these two surveys38, the growth rate from Cat. no. 6278.0 was applied to the Cat. no. 6353.0 series to estimate it for 2000-01 and 2004-05. In the absence of any other data, a time series of training hours per market sector employee from 1974-75 to 2006-07 was completed by assuming linear growth in that measure between the data points discussed above 36 Sufficient data were not available to estimate a time series for training expenditure for
Agriculture. However, Richardson (2004, p. 31) notes that Agriculture offers particularly low levels of training (around 60 per cent of the total industries average for training hours per employee in 1996).
37 Total training hours for the market sector were available from table 26 of the 2005 issue of Cat. no. 6278.0. The market sector employee numbers to which these training hours related were estimated using the market sector share of total employees from Labour Force, Australia (ABS Cat. no. 6291.0) and total employees (excluding owner managers) from Cat. no. 6278.0. Training hours per market sector employee was derived from these data.
38 ABS Cat. no. 6353.0 is an employer survey while Cat. no. 6278.0 is an employee survey that covers the four most recent training courses undertaken by an employee.
126 INTANGIBLE ASSETS AND AUSTRALIA'S PRODUCTIVITY
and a constant level of hours per employee from 1974-75 to 1989-90 (at the 1989-90 level) and for 2005-06 (at the 2004-05 level).39 This was used in conjunction with a series for market sector employees40 to derive a series for market sector total hours of training.
The actual training expenditure data points were deflated using an index of average weekly ordinary time earnings for full-time adult employees in the total economy (excluding Agriculture) from Average Weekly Earnings (ABS Cat. no. 6302.0).41 This provided real expenditure for these years. This was then used to calculate a real expenditure per hour of training. An exponential trend was fitted to this data and used to estimate real cost per hour from 1974-75 to 1988-99 and from 2002-03. Linear growth in cost per hour was assumed between the actual cost data points from 1990-91 to 2001-02. Multiplying real costs per hour and total hours, a market sector total expenditure was derived for the missing years to complete the real training cost series for the market sector.
39 These assumptions are crude, particularly for the earlier period. However, they are made for
transparency in the absence of sufficient data to fit a trendline. There are breaks in series caused by the Training Guarantee, which was introduced in 1990, suspended in 1994 and abolished in 1996 (ABS Cat. no. 6353.0, 1996). The Training Guarantee required employers with an payroll above a set amount to spend a minimum amount on training equivalent to a specific proportion of their gross wages and salaries. Apart from the 1989 ABS data, there are no reliable and comparable measures of training expenditure prior to the introduction of the Training Guarantee. The Business Council of Australia (BCA) survey from the mid-1980s, often cited to suggest that training levels in Australia were lower than other countries (see, for example, Curtain, Krbavac and Stretton 1986), does not provide a measure that is comparable with the ABS data. It has also been suggested that the BCA survey, as a small survey designed to gather data about total labour oncosts, provides highly unreliable estimates of small components of this total, such as training costs (Stromback and Moy 1989).
The ABS data post-1996 are suggestive of a decrease in training hours after the removal of the Training Guarantee. However, as noted by Long (2002, p. 8), decreases in training hours do not necessarily indicate a decrease in training effort because of the possibility of increased efficiency of training delivery.
40 The employee numbers from ABS Cat. no. 6353.0 (from which the cost data are taken) do not correspond to the standard series from the Labour Force Survey (even after excluding Agriculture). For consistency with the training survey data, the growth rate in the LFS employed persons series (ABS Labour Force Timeseries 6291.0.55.003 EO5_nov84 and aug_94 and 6204.0.55.001 Labour Force Historical Timeseries, Australia, 1966 to 1984) was applied to the employee numbers from Cat. no. 6353.0 at either end of the series (pre 1990-91 and post 1996-97). The missing years in between these two years were filled using a linear trend between the actual data points (rather than growth in the employed numbers from the LFS, because of differences in trends over these short time periods).
41 This was available back to 1983-84. This was backcast using the Reserve Bank of Australia historical series for average weekly ordinary time earnings for full-time adult employees to 1980-81 and average weekly total earnings for full-time adult employee to 1974-75 (RBA 2008).
DATA SOURCES 127
It should be noted that the 2001-02 training expenditure data suggest a large increase in real training costs per hour compared with 1996-97, while training hours per employee appear to have fallen. It has not been possible to determine the extent to which this may reflect differences in the ABS surveys from which these data are derived. However, the ABS data also show a large increase in fees paid to external trainers (NCETS 2004, table 2). This may mean that a change in pattern of training provision has affected costs per hour of training. It may also reflect a change in the composition of those participating in training (for example, those in higher paid employment representing a larger proportion of total participants) or a change in the quality of the training.
Investment series
All such expenditure is counted as investment, in line with overseas studies.
The process of constructing the expenditure series was done in real terms (using the average weekly earnings deflator), so no further deflation was required to get the real investment series.
Capital series
The capital stock series was constructed using PIM, as described in chapter 4, with an assumed depreciation rate of 40 per cent. This was the rate assumed by CHS (2006, p. 24), an average of the depreciation rates of brand equity and R&D (see discussion under organisational capital).
Organisational capital
This intangible, along with firm specific human capital, is particularly difficult to estimate. However, CHS (2006, p. 18–9) note that importance of organisational capital requires its treatment as an investment for consistency with other assets. They also cite micro data evidence that firm level differences in organisational practices are strongly related to productivity.
MH (2006, p. 11) liken the measurement problem of establishing a volume of organisational capital from observed expenditure to that of establishing the volume of R&D knowledge capital from observed expenditure on R&D. An additional problem is that expenditure on organisational capital is unobserved.
CHS (2005, p. 29) suggest that investment in organisational capital is made up of two components
128 INTANGIBLE ASSETS AND AUSTRALIA'S PRODUCTIVITY
• purchased — such as management consultant fees
• own account — measured in terms of the value of executive time spent on improving the effectiveness of business organisations (that is, time spent on developing business models and corporate cultures).
CHS (2005, pp. 29–30) note that Consulting expenditure and the estimated value of executive time conceptually overlap by a small amount (the value of executive time in the management consulting industry). In addition, some portion of management time arguably overlaps with R&D, so that, for some industries, the line between industry-specific process innovation and organizational change more generally may not be easily drawn. But, whatever uncertainty the amount induces in our estimates, it is dwarfed by the use of an arbitrary fraction for the amount of executive time devoted to organizational change and development.
MH (2006, p. 12) also suggest some overlap with IT consulting and software investment. They also note that some expenditure on management consultants is to deal with short term problems (for example, closing down businesses and discharging employees).
Purchased
CHS (2005) estimate this intangible from the revenue of the management consulting industry. Only 80 per cent of this revenue is included to account for the portion devoted to short term problems.42 Fukao et al. (2008b) were not able to find data for the consulting industry in Japan, so instead use the output of the closest relevant industry (law and accounting business services) from input-output tables.
Expenditure series
It has been noted in studies of the Australian management consulting industry that there is a paucity of available data (see, for example, Kitay and Wright 1999 and Gowen 1999). The measurement difficulties are compounded by the industry being
42 CHS (2005, p. 34) note that little is known about the composition of purchased management
expertise but they have a strong suspicion that a portion of these costs are current expenses rather than investment. They make an arbitrary deduction of 20 per cent of the spending estimate to arrive at the estimate for investment. There are some anomalies in the treatment of purchased organisational capital across the papers using the CHS method — in some cases the 20 per cent deduction is made to the own-account spending estimate instead. However, it seems clear that the original CHS methodology intended that the deduction be made to purchased component of spending rather than own account spending component (which they note was developed by explicitly considering what was investment).
DATA SOURCES 129
defined in various ways and changes in the range of activities undertaken by management consultants over time.
For this paper, a time series of revenue of the management consulting industry was therefore constructed using the few data sources available for the business management services industry (ANZSIC 7855). This industry is broader than just management consultancy — for example, it includes public relations consultancies (which are excluded from the UK and US studies). An adjustment for this difference of scope is discussed below.
Data on revenue for ANZSIC industry classes are available from Australian Industry (ABS Cat. no. 8155.0). Sales of goods and services/operating income is available for 1998-99 to 2000-01 and 2002-03 and total income (including other income such as interest income) for 2002-03 to 2004-05.43 Sales of goods and services is the most relevant measure so the growth rate in total income for the latter period was applied to sales in 2002-03 to estimate this series to 2004-05. The 2005-06 estimate was made assuming that the growth rate for sales was the same as in 2004-05. The estimates for the missing year 2001-02 was interpolated by simple averages.
To backcast the series of business management services from 1998-99 to 1974-75, the growth in published data for a related group of services from the product details of the ABS Australian National Accounts: Input-Output Tables (Cat. no. 5215.0) was used.44 The IO tables cover selected years over the period.45 There has been a variety of classification changes over time but a reasonably consistent series is available for the sum of market and business services.46 Missing years were interpolated by simple averages.
43 Prior to 1998-99, an irregular survey, Selected Business Services, 1992-93 (ABS Cat.
no. 8677.0) was carried out. However, this was not used because of an apparent break in series. Gowen (1999) suggests the 1992-93 figure considerably understates revenue but provides no firm alternative estimate.
44 Product data included the amount of that product produced by all industries not just the main industry that produces that product. However, in this case most of these products (or services in this case) are produced by one industry.
45 Annual except for 1975-76, 1976-77, 1984-85, 1985-86, 1987-88, 1988-89, 1990-91, 1991-92, 1995-96, 1997-98, 1999-00 and 2000-01.
46 The series was smoothed with a 3-period moving average to remove some volatility due to classification changes.
130 INTANGIBLE ASSETS AND AUSTRALIA'S PRODUCTIVITY
The resulting series for sales income for business management services was for the total economy (that is, Australian production of these services47). It was necessary to scale it down to the share relevant to market sector intermediate usage using data on the closest available group of services. Using the SU tables the market sector intermediate usage share of Australian production of SUPC 43031 Other business services (which includes business management services among many other services) was calculated for 1994-95 to 2003-04.48 This share was backcast to 1974-75 and forecast for 2004-05 and 2005-06 using growth in the market sector share of gross value added.49
A final adjustment was made to account for the broader scope of ANZSIC 7855 Business management services compared with the other studies. There is very limited information about the size of the public relations segment of this industry. The ABS in an irregular survey of Business management services in 1992-93 estimated that public relations consulting services accounted for 23 per cent of total income from business management consulting services (Selected Business Services, 1992-93, Cat. no. 8677.0, table 14.1). In the absence of additional data, for each year of the series only 77 per cent of the total income from Business management services has been counted as management consulting. The assumption of a constant share may lead to the adjusted estimate in any given year being understated or overstated.
No adjustment has been possible for some differences in the scope of this measure compared with the studies for the United States and United Kingdom.
• ANZSIC 7855 Business management services includes environmental consultancies, which are not included in the US estimate of organisational capital.50 This means that the Australian estimate is likely to be overstated compared with that of the United States. And this overstatement may have grown over time if environmental consultancies have increased as a share of total business management services. However, it has not been possible to make any adjustment for this overstatement.
47 Insufficient data were available to make any adjustment for any difference between exports and
imports of these services. The estimates implicitly assumes net exports are zero — if net exports are positive (negative) then the estimates will be overstated (understated).
48 This share was smoothed using a 3-period moving average to remove volatility. 49 Intermediate usage data from IO tables for a broader group of services (Legal, accounting,
marketing and business management services) were examined but the series was quite volatile — partly due to changes in classifications over time. The ABS cautions against using such data as a time series.
50 It is unclear if environmental consultancies are included in the UK estimates.
DATA SOURCES 131
• MH (2006) adjust the UK estimate to exclude subcontracting of smaller consulting firms to larger consulting firms. Insufficient data are available to make any adjustment to the Australian data and this may result in an overstatement of organisational capital.
The resulting Australian series shows considerable growth in the management consulting industry (around 24 per cent a year between 1974-75 and 2005-06), particularly in the 1980s (30 per cent) and from the mid to late 1990s (around 20 per cent). There are few data sources against which to validate the estimates — however, there are some references to size and growth of the industry in particular years that suggest the estimates in this paper are plausible (putting aside issues of comparability of scope with the overseas estimates).
• It has been generally reported that growth in the management consulting industry has been high globally (see, for example, Wooldridge 1997; Gowen 1999). Kitay and Wright (1999, p. 7) estimated that the number of consulting businesses in Sydney and Melbourne (as listed in the yellow pages) grew nearly four-fold between 1978 and 1998. They also acknowledged that while estimates of the overall size of the Australian consulting market varied wildly, several studies had suggested growth of 25 per cent a year. Wright (2000, p. 99) refers to dramatic growth in the 1980s in the Australian management consulting industry as being fuelled by fundamental economic and technological changes. Kitay and Wright (2003, p. 22) note that the Australian consulting industry grew rapidly in the 1990s as was the case worldwide.
• Gowen (1999, p. 33) estimated the size of the management consulting industry to be $5-$6 billion in 1996, although she acknowledges that it is likely this may include non-consulting revenue. Allen (1990) reported the annual turnover of the Australian market and business consultancy industry as $1.3 billion in 1990. Wright (2000, pp. 100–1) cited data for the leading firms that suggests total turnover was $0.5 billion in 1985.51 The estimates based on the backcasting method described above are broadly in line with these estimates at $5.1 billion for 1995-96, $1.5 billion for 1989-90 and $0.4 billion for 1984-85.52
51 This is based on the reported turnover of leading firms of $104 million in 1985 and the
assumption that the reported share of these firms in the late 1980s (20 per cent) also applied in 1985.
52 Estimates of business management services after deducting estimated public relations consultancies (and before scaling down to market sector usage).
132 INTANGIBLE ASSETS AND AUSTRALIA'S PRODUCTIVITY
Investment series
In line with CHS (2005), 80 per cent of the expenditure series is used to represent investment. No adjustment was made for any overlap with own account organisational capital (for the same reasons as noted by CHS above).
The investment series was deflated by the implied market sector GVA deflator.
Capital series
The capital stock series was constructed using PIM, as described in chapter 4, with an assumed depreciation rate of 40 per cent. This is in line with CHS (2006, pp. 23) — an average of the rates used for brand equity and R&D. CHS (2006, p. 24) justify this as follows
Investments through strategic planning and reorganization reflect business’ need to constantly adapt to changing economic conditions. While such investments undoubtedly have a long-lasting “learning-by-doing” dimension (similar to that in R&D), we believe they also have a short-lived “organizational forgetting” dimension (similar to that in advertising).
Own account
CHS (2005, table 1.3) estimate the own account component of organisational capital as 20 per cent of the value of executive time using US Bureau of Labor Statistics (BLS) data on employment and wages in executive occupations. MH (2006, p. 13) use a similar approach but exclude ICT managers (to avoid double counting with capitalised software) and self-employed (who they indicate they do not believe built organisational capital in the same way as in other industries). The definition of managers appears to be relatively broad (not just, for example, CEOs), although it has not been possible to compare the specific occupational groups used.
It should be noted that percentage of executives’ time spent building organisational capital is likely to have changed over time and to vary across countries — the use of a constant 20 per cent of executive time may therefore be a source of mismeasurement. For example, Fukao et al. (2008a) cite a 2006 study that estimated that Japanese CEOs spent only 9 per cent of their time on activities related to building organisational capital. But he also noted that some Japanese firms have divisions specialising in these activities, although there are no data about their expenditure. As Fukao notes, a new survey is probably needed to obtain better measures of organisational capital.
DATA SOURCES 133
Expenditure series
The own account portion of organisational capital is estimated from average earnings of managers and the number of managers in the market sector.
The specific occupation group used was Managers & administrators (ASCO 1) excluding, where possible, both IT managers (ASCO 1224) and Farmers & farm managers (ASCO 13).53 The exclusions of IT managers was based on the reasoning used by MH (2006) — avoiding double counting with IT capital. It was possible to exclude the self-employed (owner-managers of unincorporated enterprises54), as done by MH (2006), because the ABS survey used excluded this group. The additional exclusion of Farmers & farm managers has been made on the basis that this subgroup is considerably different from the other managers and would not be expected to build organisational capital in the same way.
Data on average weekly earnings and number of Managers & administrators were available from the Employee Earnings, Benefits and Trade Union Membership (EEBTUM) survey (ABS Cat. no. 6310.0) (a supplement to the August Labour Force Survey). Weekly earnings are defined in this survey as the amount of ‘last total pay’ (that is, before taxation and other deductions have been made).55 The average earnings are calculated excluding those employees who did not draw a wage or salary, that is, people working in their own incorporated enterprises.
Unpublished data on earnings and employee numbers from Cat. no. 6310.0 were available for Managers & administrators excluding IT managers and farmers in the market sector annually for August 1997 to August 2006. These August observations were used for the financial years 1997-98 to 2006-07. The number of employees obtained includes persons who receive a wage or salary or persons who operate their own incorporated enterprises. Using this number of employees to obtain the wages bill, implicitly assumes the value for own account organisational capital
53 Australian Standard Classification of Occupations (ASCO), Second edition, 1997 (ABS Cat.
no. 1222.0) has been used or the closest available occupation from the earlier occupational classifications, ASCO 1st edition and Classification and Classified List of Occupations (CCLO). It has not been possible to compare the scope of Managers and administrators in this classification with the ‘executive’ occupations used in the US and UK papers.
54 Owner-managers of incorporated enterprises are included. 55 No adjustment is made for any back payment of wage increases, prepayment of leave, or
bonuses, etc. No explicit reference to the treatment of salary sacrifice amounts years is made in the survey questions, and the ABS considers it probable that some respondents are already including amounts salary sacrificed in their responses, depending upon how their pay is reported. (See Changes to ABS Measures of Employee Remuneration, 2006, ABS Cat. no. 6313.0, p. 31 for further details).
134 INTANGIBLE ASSETS AND AUSTRALIA'S PRODUCTIVITY
investment for owner-managers equal to the average earnings of Managers & administrators drawing a wage or salary.
Prior to 1997 data were only available from the annual publication of Cat. no. 6310.0.56 This provided data for the total economy for Managers & administrators numbers and average weekly earnings but insufficient data to calculate market sector estimates. The EEBTUM Employee numbers were backcast using growth in a series constructed from Labour Force Survey (LFS) data for all Managers and administrators (not just employees) in an approximated market sector (excluding Agriculture).57
Average weekly earnings were also backcast using growth in the closest available series to Managers and administrators (or the closest occupational classification) in the market sector (less Agriculture). From 1988 to 1996, the closest series was average weekly earnings of Managers and administrators (ASCO1) for the total economy. Prior to this, it was full-time managers for the total economy (Manager & administrators ASCO1/Administrative, executive and managerial employees CCLO). It was not possible to apply any industry or occupational concordance to these dollar averages. The implicit assumption is therefore that growth in these wages was representative of the ASCO2 Managers & administrators group of interest. The use of full-time average weekly earnings growth for the earlier period also assumes a constant share of part-time workers, that part-time workers work constant hours and that part-time wages are proportional to full-time wages according to hours worked. The share of part-time workers among Managers & administrators increased from 4 per cent in 1975 to 6 per cent in 198558 so is unlikely to represent a major distortion. The EEBTUM survey (Cat. no. 6310.0) commenced in 1975, so the August 1974 estimate (used for 1974-75) was derived using growth in Managers & administrators total employed from the Labour Force
56 No survey was conducted in 1996. No publication was produced in 1995 and the electronic data
file is no longer available. Data for these years are interpolated on a linear trend between 1994 and 1997 data.
57 Employed Managers & administrators by industry were taken from ABS 6291.0.55.003 EO9_aug 86 back to 1986-87 and from LFS microfiche back to 1974-75 (the ASIC to ANZSIC industry concordance used in Gretton and Fisher 1997 was applied to the latter industry numbers to construct a market sector estimate). Growth in each segment of this series was spliced together as there were also two breaks in the series due to changes in occupational classification — from CCLO to ASCO1 in 1986 and to ASCO2 in 1996. The closest occupational classification to ASCO2 Managers and administrators was used in each case — CCLO Administrative, executive and managerial and ASCO1 Managers and administrators (with ASCO 1st edition having a different definitions of Managers & administrators).
58 From ABS Labour Force Historical Timeseries, Australia, 1966 to 1984 (Cat. no. 6204.0.55.001).
DATA SOURCES 135
Survey for the number of employees and average weekly earnings estimated assuming the growth rates between 1975 and 1976.
From these employee number series and average weekly earnings series, the total wages bill was calculated as the number of employees multiplied by average weekly earnings multiplied by 52 weeks. As noted above, this number of employees excludes owner-managers of unincorporated enterprises. This may lead to an underestimate of own-account organisational capital if this group does invest in this intangible in the same way as other Managers & administrators.
Twenty per cent of this wages bill was counted as expenditure on own account organisational capital. CHS (2005, p. 30) note that their assumption that managers spend 20 per cent of their time investing in organisational development is arbitrary. However, for the purposes of comparability and in the absence of alternative estimates of time spent, the same percentage is used in this paper.
Investment series
No further adjustments were made to the nominal expenditure to obtain nominal investment.
The series was deflated by the implied market sector gross value added deflator.
Capital series
The capital stock series was constructed using PIM, as described in chapter 4, with an assumed depreciation rate of 40 per cent. This depreciation rate was selected for the same reasons as described under purchased organisational capital above.
A.4 Comparison of data sources with other studies
As discussed in chapter 6, the various country studies do not measure intangibles for the same group of industries in each case — the market sector for Australia and the United Kingdom (but the UK market sector is much broader than that for Australia); the non-farm business sector for the United States; the non-financial business sector for Finland; and the whole economy for the Netherlands and Japan.
If the rates of investment in intangibles differ across industries, the average rate will be affected by the differences in industry coverage across countries. For example, the Australian market sector is defined more narrowly than the UK market sector, which includes additional industries such as property and business services and
136 INTANGIBLE ASSETS AND AUSTRALIA'S PRODUCTIVITY
private education and health. Higher than average rates of investment in intangibles in these additional industries would increase the UK market sector average compared with a more narrowly defined market sector. Differences between the rate of intangible investment in the United Kingdom and Australia could therefore be due to differences in industry coverage of the measure, rather than actual differences between the countries at the industry level. However, it has not been possible to adjust for this possible source of bias and determine if this is the case.
Table A.3 summarises details of the proxies and sources used in other studies (for the sector of the economy as listed above) and compares them with the Australian sources used.
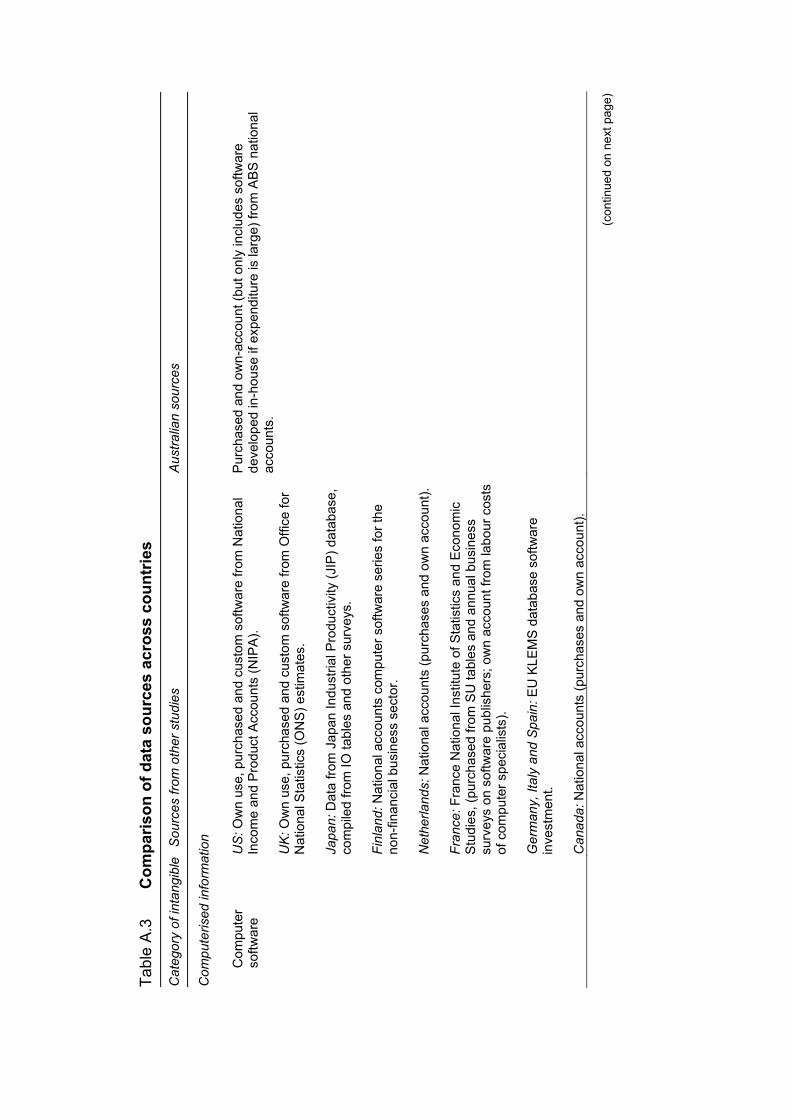
Tabl
e A
.3
Com
paris
on o
f dat
a so
urce
s ac
ross
cou
ntrie
s
Cat
egor
y of
inta
ngib
le
Sou
rces
from
oth
er s
tudi
es
Aus
tralia
n so
urce
s
Com
pute
rised
info
rmat
ion
Com
pute
r so
ftwar
e U
S: O
wn
use,
pur
chas
ed a
nd c
usto
m s
oftw
are
from
Nat
iona
l In
com
e an
d P
rodu
ct A
ccou
nts
(NIP
A).
UK
: Ow
n us
e, p
urch
ased
and
cus
tom
sof
twar
e fro
m O
ffice
for
Nat
iona
l Sta
tistic
s (O
NS
) est
imat
es.
Japa
n: D
ata
from
Jap
an In
dust
rial P
rodu
ctiv
ity (J
IP) d
atab
ase,
co
mpi
led
from
IO ta
bles
and
oth
er s
urve
ys.
Finl
and:
Nat
iona
l acc
ount
s co
mpu
ter s
oftw
are
serie
s fo
r the
no
n-fin
anci
al b
usin
ess
sect
or.
Net
herla
nds:
Nat
iona
l acc
ount
s (p
urch
ases
and
ow
n ac
coun
t).
Fran
ce: F
ranc
e N
atio
nal I
nstit
ute
of S
tatis
tics
and
Econ
omic
S
tudi
es, (
purc
hase
d fro
m S
U ta
bles
and
ann
ual b
usin
ess
surv
eys
on s
oftw
are
publ
ishe
rs; o
wn
acco
unt f
rom
labo
ur c
osts
of
com
pute
r spe
cial
ists
).
Ger
man
y, It
aly
and
Spa
in: E
U K
LEM
S d
atab
ase
softw
are
inve
stm
ent.
Can
ada:
Nat
iona
l acc
ount
s (p
urch
ases
and
ow
n ac
coun
t).
Pur
chas
ed a
nd o
wn-
acco
unt (
but o
nly
incl
udes
sof
twar
e de
velo
ped
in-h
ouse
if e
xpen
ditu
re is
larg
e) fr
om A
BS
nat
iona
l ac
coun
ts.
(con
tinue
d on
nex
t pag
e)
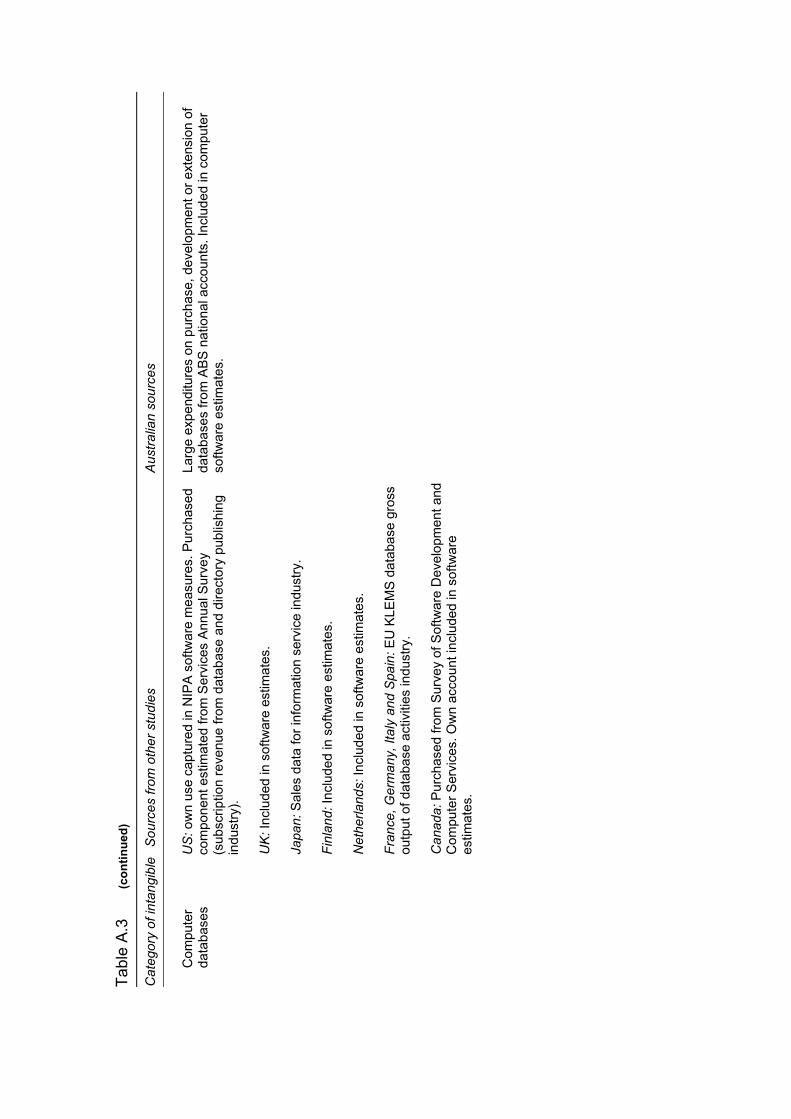
Tabl
e A
.3
(con
tinue
d)
Cat
egor
y of
inta
ngib
le
Sou
rces
from
oth
er s
tudi
es
Aus
tralia
n so
urce
s
Com
pute
r da
taba
ses
US
: ow
n us
e ca
ptur
ed in
NIP
A s
oftw
are
mea
sure
s. P
urch
ased
co
mpo
nent
est
imat
ed fr
om S
ervi
ces
Ann
ual S
urve
y (s
ubsc
riptio
n re
venu
e fro
m d
atab
ase
and
dire
ctor
y pu
blis
hing
in
dust
ry).
UK
: Inc
lude
d in
sof
twar
e es
timat
es.
Japa
n: S
ales
dat
a fo
r inf
orm
atio
n se
rvic
e in
dust
ry.
Finl
and:
Incl
uded
in s
oftw
are
estim
ates
.
Net
herla
nds:
Incl
uded
in s
oftw
are
estim
ates
.
Fran
ce, G
erm
any,
Ital
y an
d S
pain
: EU
KLE
MS
dat
abas
e gr
oss
outp
ut o
f dat
abas
e ac
tiviti
es in
dust
ry.
Can
ada:
Pur
chas
ed fr
om S
urve
y of
Sof
twar
e D
evel
opm
ent a
nd
Com
pute
r Ser
vice
s. O
wn
acco
unt i
nclu
ded
in s
oftw
are
estim
ates
.
Larg
e ex
pend
iture
s on
pur
chas
e, d
evel
opm
ent o
r ext
ensi
on o
f da
taba
ses
from
AB
S n
atio
nal a
ccou
nts.
Incl
uded
in c
ompu
ter
softw
are
estim
ates
.
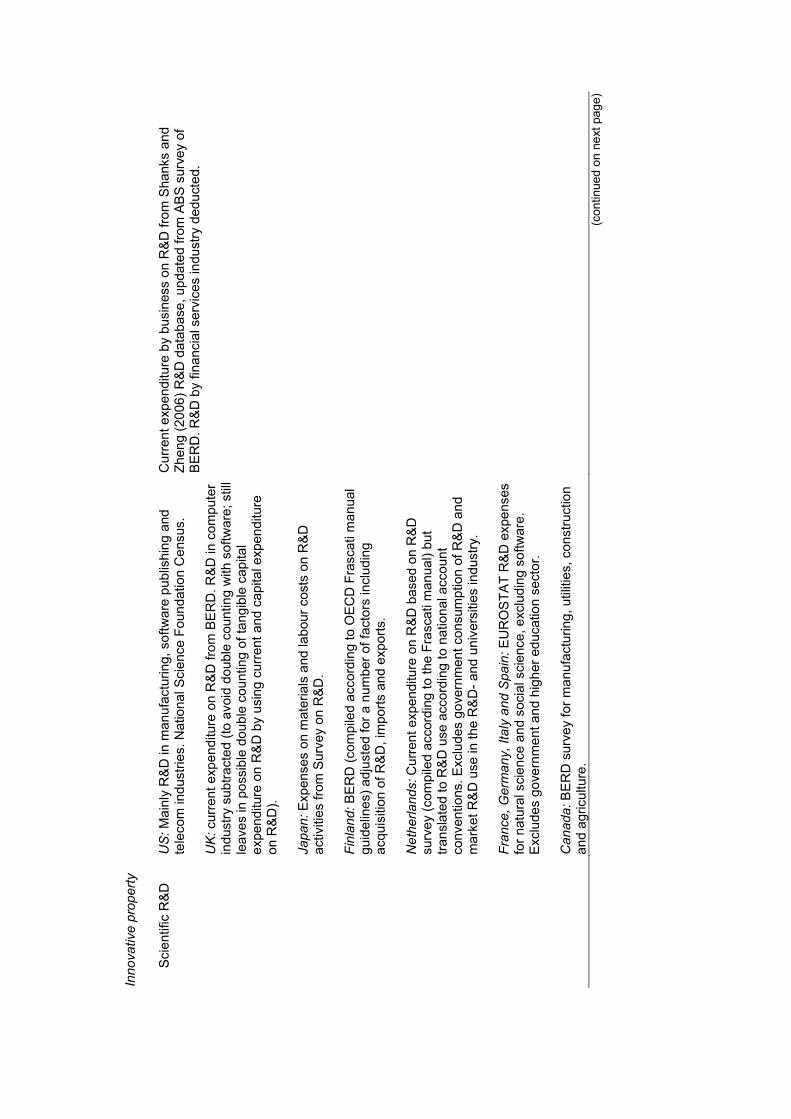
Inno
vativ
e pr
oper
ty
Sci
entif
ic R
&D
US
: Mai
nly
R&
D in
man
ufac
turin
g, s
oftw
are
publ
ishi
ng a
nd
tele
com
indu
strie
s. N
atio
nal S
cien
ce F
ound
atio
n C
ensu
s.
UK
: cur
rent
exp
endi
ture
on
R&
D fr
om B
ERD
. R&D
in c
ompu
ter
indu
stry
sub
tract
ed (t
o av
oid
doub
le c
ount
ing
with
sof
twar
e; s
till
leav
es in
pos
sibl
e do
uble
cou
ntin
g of
tang
ible
cap
ital
expe
nditu
re o
n R
&D
by
usin
g cu
rren
t and
cap
ital e
xpen
ditu
re
on R
&D
).
Japa
n: E
xpen
ses
on m
ater
ials
and
labo
ur c
osts
on
R&D
ac
tiviti
es fr
om S
urve
y on
R&
D.
Finl
and:
BE
RD
(com
pile
d ac
cord
ing
to O
EC
D F
rasc
ati m
anua
l gu
idel
ines
) adj
uste
d fo
r a n
umbe
r of f
acto
rs in
clud
ing
acqu
isiti
on o
f R&
D, i
mpo
rts a
nd e
xpor
ts.
Net
herla
nds:
Cur
rent
exp
endi
ture
on
R&D
bas
ed o
n R
&D
su
rvey
(com
pile
d ac
cord
ing
to th
e Fr
asca
ti m
anua
l) bu
t tra
nsla
ted
to R
&D
use
acc
ordi
ng to
nat
iona
l acc
ount
co
nven
tions
. Exc
lude
s go
vern
men
t con
sum
ptio
n of
R&
D a
nd
mar
ket R
&D
use
in th
e R
&D
- and
uni
vers
ities
indu
stry
.
Fran
ce, G
erm
any,
Ital
y an
d S
pain
: EU
RO
STA
T R
&D e
xpen
ses
for n
atur
al s
cien
ce a
nd s
ocia
l sci
ence
, exc
ludi
ng s
oftw
are.
E
xclu
des
gove
rnm
ent a
nd h
ighe
r edu
catio
n se
ctor
.
Can
ada:
BE
RD
sur
vey
for m
anuf
actu
ring,
util
ities
, con
stru
ctio
n an
d ag
ricul
ture
.
Cur
rent
exp
endi
ture
by
busi
ness
on
R&D
from
Sha
nks
and
Zhen
g (2
006)
R&
D d
atab
ase,
upd
ated
from
AB
S s
urve
y of
B
ER
D. R
&D
by
finan
cial
ser
vice
s in
dust
ry d
educ
ted.
(con
tinue
d on
nex
t pag
e)
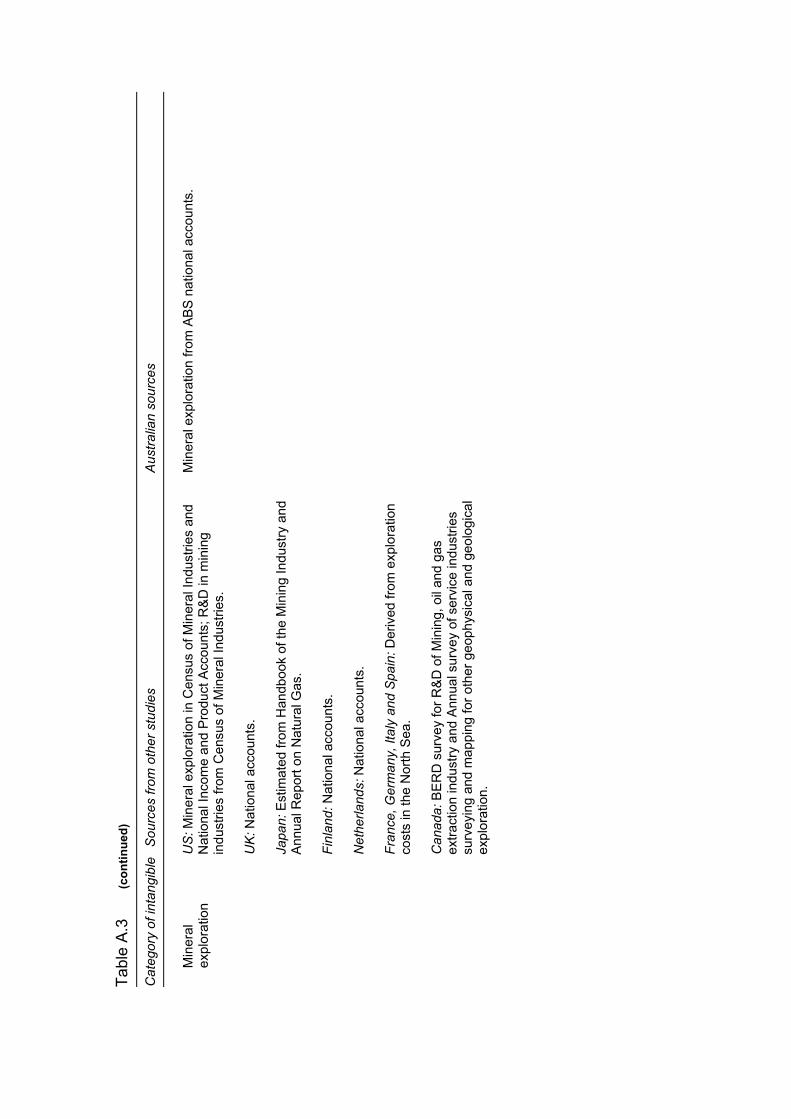
Tabl
e A
.3
(con
tinue
d)
Cat
egor
y of
inta
ngib
le
Sou
rces
from
oth
er s
tudi
es
Aus
tralia
n so
urce
s
Min
eral
ex
plor
atio
n U
S: M
iner
al e
xplo
ratio
n in
Cen
sus
of M
iner
al In
dust
ries
and
Nat
iona
l Inc
ome
and
Pro
duct
Acc
ount
s; R
&D
in m
inin
g in
dust
ries
from
Cen
sus
of M
iner
al In
dust
ries.
UK
: Nat
iona
l acc
ount
s.
Japa
n: E
stim
ated
from
Han
dboo
k of
the
Min
ing
Indu
stry
and
A
nnua
l Rep
ort o
n N
atur
al G
as.
Finl
and:
Nat
iona
l acc
ount
s.
Net
herla
nds:
Nat
iona
l acc
ount
s.
Fran
ce, G
erm
any,
Ital
y an
d S
pain
: Der
ived
from
exp
lora
tion
cost
s in
the
Nor
th S
ea.
Can
ada:
BE
RD
sur
vey
for R
&D
of M
inin
g, o
il an
d ga
s ex
tract
ion
indu
stry
and
Ann
ual s
urve
y of
ser
vice
indu
strie
s su
rvey
ing
and
map
ping
for o
ther
geo
phys
ical
and
geo
logi
cal
expl
orat
ion.
Min
eral
exp
lora
tion
from
AB
S n
atio
nal a
ccou
nts.
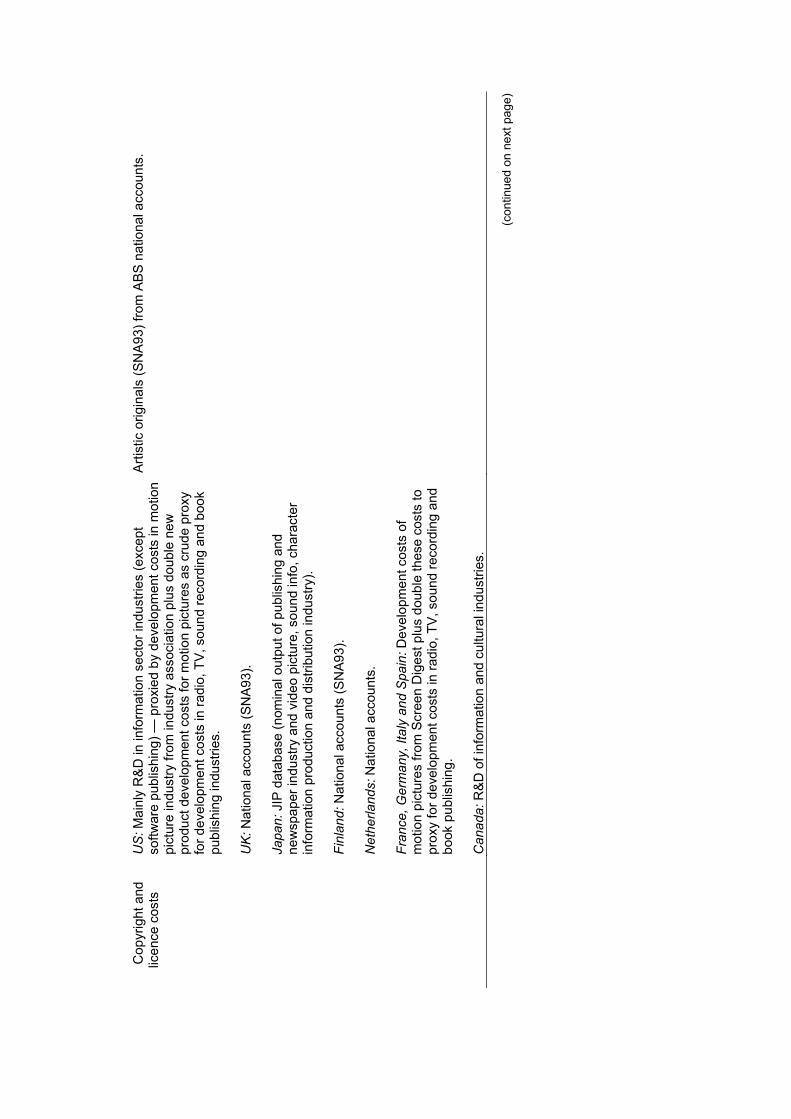
Cop
yrig
ht a
nd
licen
ce c
osts
U
S: M
ainl
y R
&D
in in
form
atio
n se
ctor
indu
strie
s (e
xcep
t so
ftwar
e pu
blis
hing
) — p
roxi
ed b
y de
velo
pmen
t cos
ts in
mot
ion
pict
ure
indu
stry
from
indu
stry
ass
ocia
tion
plus
dou
ble
new
pr
oduc
t dev
elop
men
t cos
ts fo
r mot
ion
pict
ures
as
crud
e pr
oxy
for d
evel
opm
ent c
osts
in ra
dio,
TV
, sou
nd re
cord
ing
and
book
pu
blis
hing
indu
strie
s.
UK
: Nat
iona
l acc
ount
s (S
NA
93).
Japa
n: J
IP d
atab
ase
(nom
inal
out
put o
f pub
lishi
ng a
nd
new
spap
er in
dust
ry a
nd v
ideo
pic
ture
, sou
nd in
fo, c
hara
cter
in
form
atio
n pr
oduc
tion
and
dist
ribut
ion
indu
stry
).
Finl
and:
Nat
iona
l acc
ount
s (S
NA9
3).
Net
herla
nds:
Nat
iona
l acc
ount
s.
Fran
ce, G
erm
any,
Ital
y an
d S
pain
: Dev
elop
men
t cos
ts o
f m
otio
n pi
ctur
es fr
om S
cree
n D
iges
t plu
s do
uble
thes
e co
sts
to
prox
y fo
r dev
elop
men
t cos
ts in
radi
o, T
V, s
ound
reco
rdin
g an
d bo
ok p
ublis
hing
.
Can
ada:
R&D
of i
nfor
mat
ion
and
cultu
ral i
ndus
tries
.
Arti
stic
orig
inal
s (S
NA
93) f
rom
AB
S n
atio
nal a
ccou
nts.
(con
tinue
d on
nex
t pag
e)
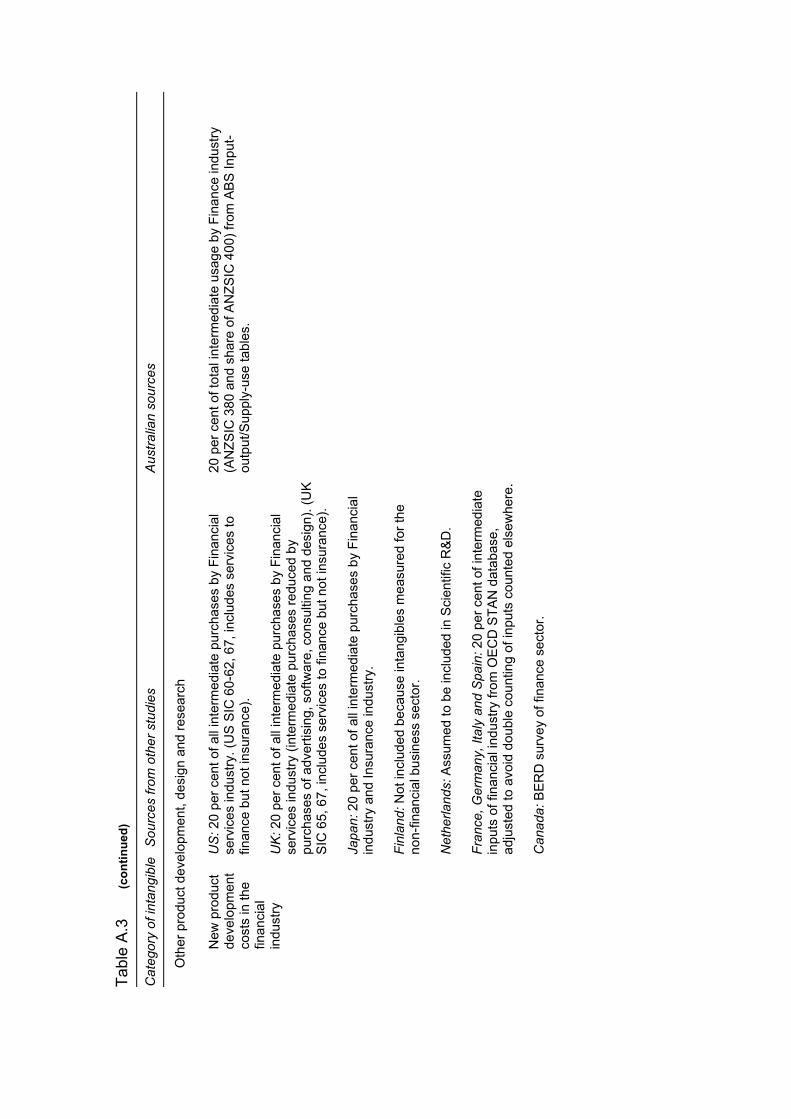
Tabl
e A
.3
(con
tinue
d)
Cat
egor
y of
inta
ngib
le
Sou
rces
from
oth
er s
tudi
es
Aus
tralia
n so
urce
s
Oth
er p
rodu
ct d
evel
opm
ent,
desi
gn a
nd re
sear
ch
New
pro
duct
de
velo
pmen
t co
sts
in th
e fin
anci
al
indu
stry
US
: 20
per c
ent o
f all
inte
rmed
iate
pur
chas
es b
y Fi
nanc
ial
serv
ices
indu
stry
. (U
S S
IC 6
0-62
, 67,
incl
udes
ser
vice
s to
fin
ance
but
not
insu
ranc
e).
UK
: 20
per c
ent o
f all
inte
rmed
iate
pur
chas
es b
y Fi
nanc
ial
serv
ices
indu
stry
(int
erm
edia
te p
urch
ases
redu
ced
by
purc
hase
s of
adv
ertis
ing,
sof
twar
e, c
onsu
lting
and
des
ign)
. (U
K
SIC
65,
67,
incl
udes
ser
vice
s to
fina
nce
but n
ot in
sura
nce)
.
Japa
n: 2
0 pe
r cen
t of a
ll in
term
edia
te p
urch
ases
by
Fina
ncia
l in
dust
ry a
nd In
sura
nce
indu
stry
.
Finl
and:
Not
incl
uded
bec
ause
inta
ngib
les
mea
sure
d fo
r the
no
n-fin
anci
al b
usin
ess
sect
or.
Net
herla
nds:
Ass
umed
to b
e in
clud
ed in
Sci
entif
ic R
&D.
Fran
ce, G
erm
any,
Ital
y an
d S
pain
: 20
per c
ent o
f int
erm
edia
te
inpu
ts o
f fin
anci
al in
dust
ry fr
om O
EC
D S
TAN
dat
abas
e,
adju
sted
to a
void
dou
ble
coun
ting
of in
puts
cou
nted
els
ewhe
re.
Can
ada:
BE
RD
sur
vey
of fi
nanc
e se
ctor
.
20 p
er c
ent o
f tot
al in
term
edia
te u
sage
by
Fina
nce
indu
stry
(A
NZS
IC 3
80 a
nd s
hare
of A
NZS
IC 4
00) f
rom
AB
S In
put-
outp
ut/S
uppl
y-us
e ta
bles
.
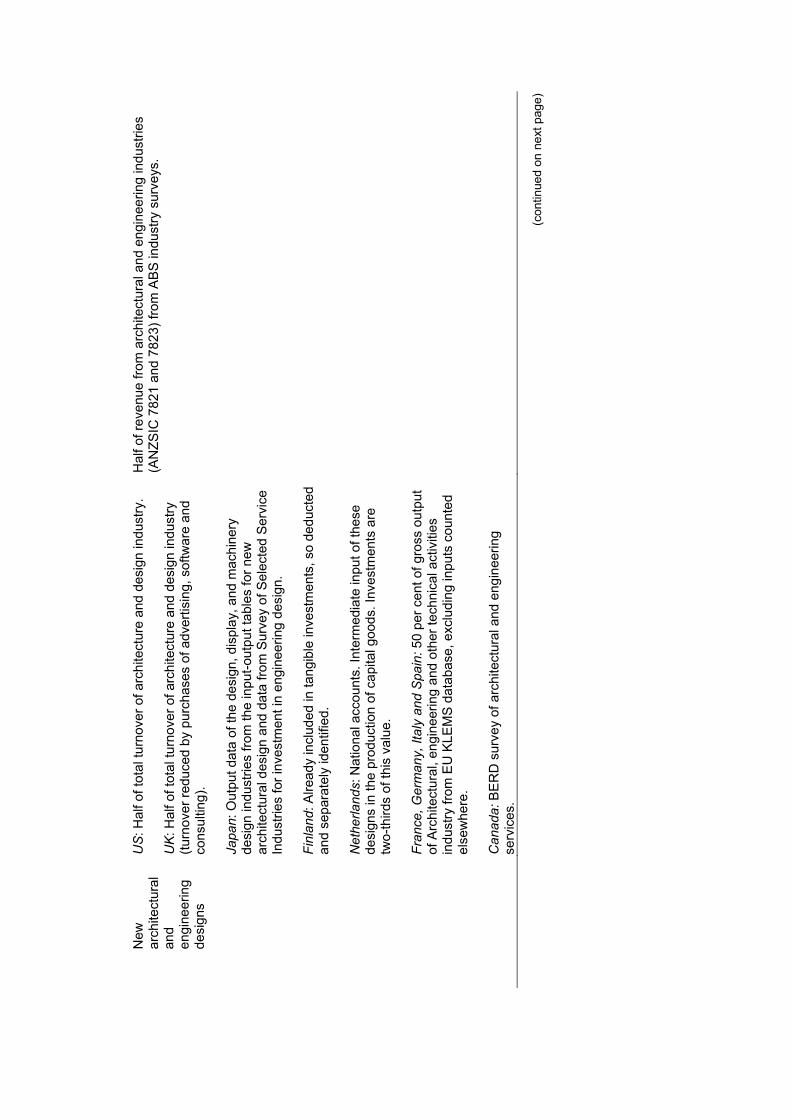
New
ar
chite
ctur
al
and
engi
neer
ing
desi
gns
US
: Hal
f of t
otal
turn
over
of a
rchi
tect
ure
and
desi
gn in
dust
ry.
UK
: Hal
f of t
otal
turn
over
of a
rchi
tect
ure
and
desi
gn in
dust
ry
(turn
over
redu
ced
by p
urch
ases
of a
dver
tisin
g, s
oftw
are
and
cons
ultin
g).
Japa
n: O
utpu
t dat
a of
the
desi
gn, d
ispl
ay, a
nd m
achi
nery
de
sign
indu
strie
s fro
m th
e in
put-o
utpu
t tab
les
for n
ew
arch
itect
ural
des
ign
and
data
from
Sur
vey
of S
elec
ted
Ser
vice
In
dust
ries
for i
nves
tmen
t in
engi
neer
ing
desi
gn.
Finl
and:
Alre
ady
incl
uded
in ta
ngib
le in
vest
men
ts, s
o de
duct
ed
and
sepa
rate
ly id
entif
ied.
Net
herla
nds:
Nat
iona
l acc
ount
s. In
term
edia
te in
put o
f the
se
desi
gns
in th
e pr
oduc
tion
of c
apita
l goo
ds. I
nves
tmen
ts a
re
two-
third
s of
this
val
ue.
Fran
ce, G
erm
any,
Ital
y an
d S
pain
: 50
per c
ent o
f gro
ss o
utpu
t of
Arc
hite
ctur
al, e
ngin
eerin
g an
d ot
her t
echn
ical
act
iviti
es
indu
stry
from
EU
KLE
MS
dat
abas
e, e
xclu
ding
inpu
ts c
ount
ed
else
whe
re.
Can
ada:
BE
RD
sur
vey
of a
rchi
tect
ural
and
eng
inee
ring
serv
ices
.
Hal
f of r
even
ue fr
om a
rchi
tect
ural
and
eng
inee
ring
indu
strie
s (A
NZS
IC 7
821
and
7823
) fro
m A
BS
indu
stry
sur
veys
.
(con
tinue
d on
nex
t pag
e)
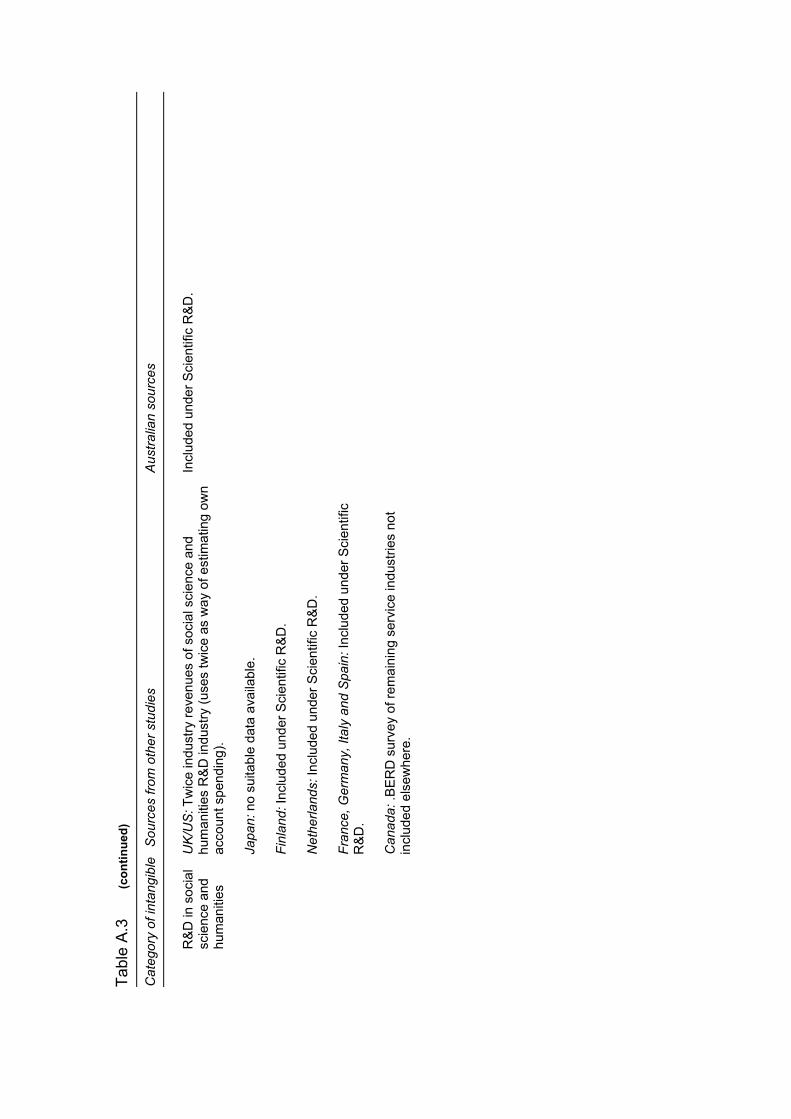
Tabl
e A
.3
(con
tinue
d)
Cat
egor
y of
inta
ngib
le
Sou
rces
from
oth
er s
tudi
es
Aus
tralia
n so
urce
s
R&
D in
soc
ial
scie
nce
and
hum
aniti
es
UK
/US
: Tw
ice
indu
stry
reve
nues
of s
ocia
l sci
ence
and
hu
man
ities
R&
D in
dust
ry (u
ses
twic
e as
way
of e
stim
atin
g ow
n ac
coun
t spe
ndin
g).
Japa
n: n
o su
itabl
e da
ta a
vaila
ble.
Finl
and:
Incl
uded
und
er S
cien
tific
R&
D.
Net
herla
nds:
Incl
uded
und
er S
cien
tific
R&
D.
Fran
ce, G
erm
any,
Ital
y an
d S
pain
: Inc
lude
d un
der S
cien
tific
R
&D
.
Can
ada:
.BE
RD
sur
vey
of re
mai
ning
ser
vice
indu
strie
s no
t in
clud
ed e
lsew
here
.
Incl
uded
und
er S
cien
tific
R&
D.
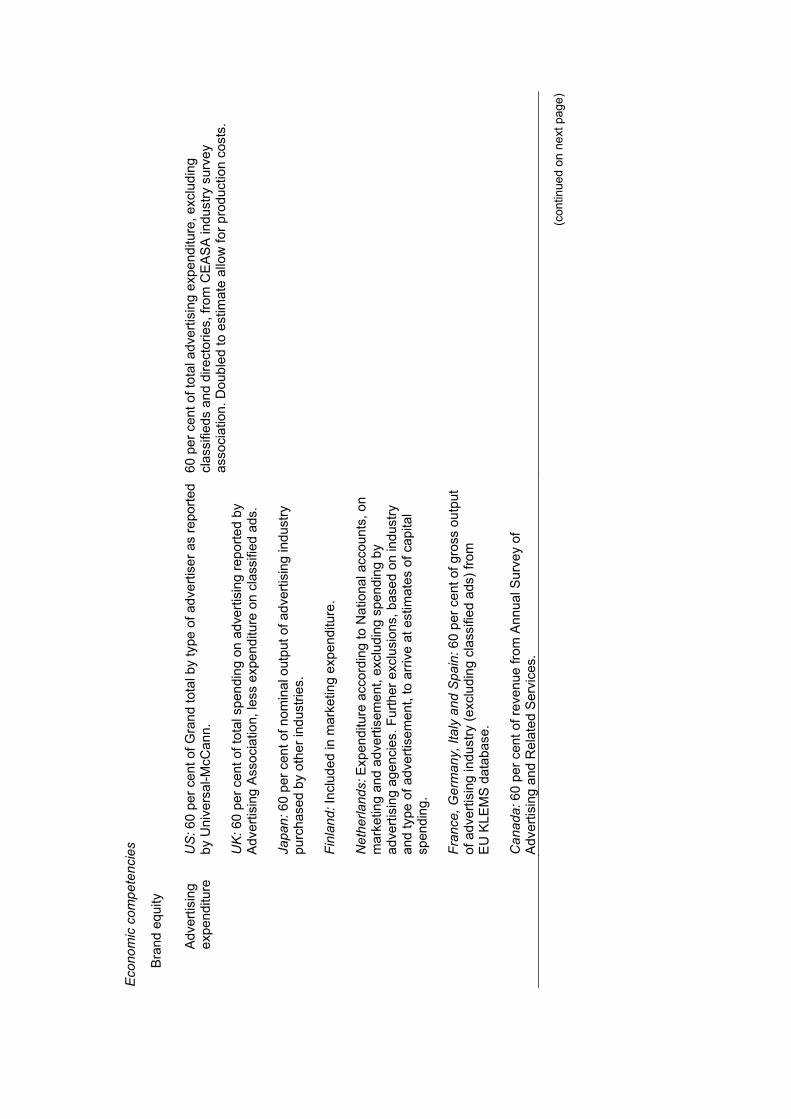
Eco
nom
ic c
ompe
tenc
ies
Bra
nd e
quity
Adv
ertis
ing
expe
nditu
re
US
: 60
per c
ent o
f Gra
nd to
tal b
y ty
pe o
f adv
ertis
er a
s re
porte
d by
Uni
vers
al-M
cCan
n.
UK
: 60
per c
ent o
f tot
al s
pend
ing
on a
dver
tisin
g re
porte
d by
A
dver
tisin
g A
ssoc
iatio
n, le
ss e
xpen
ditu
re o
n cl
assi
fied
ads.
Japa
n: 6
0 pe
r cen
t of n
omin
al o
utpu
t of a
dver
tisin
g in
dust
ry
purc
hase
d by
oth
er in
dust
ries.
Finl
and:
Incl
uded
in m
arke
ting
expe
nditu
re.
Net
herla
nds:
Exp
endi
ture
acc
ordi
ng to
Nat
iona
l acc
ount
s, o
n m
arke
ting
and
adve
rtise
men
t, ex
clud
ing
spen
ding
by
adve
rtisi
ng a
genc
ies.
Fur
ther
exc
lusi
ons,
bas
ed o
n in
dust
ry
and
type
of a
dver
tisem
ent,
to a
rrive
at e
stim
ates
of c
apita
l sp
endi
ng.
Fran
ce, G
erm
any,
Ital
y an
d S
pain
: 60
per c
ent o
f gro
ss o
utpu
t of
adv
ertis
ing
indu
stry
(exc
ludi
ng c
lass
ified
ads
) fro
m
EU
KLE
MS
dat
abas
e.
Can
ada:
60
per c
ent o
f rev
enue
from
Ann
ual S
urve
y of
A
dver
tisin
g an
d R
elat
ed S
ervi
ces.
60 p
er c
ent o
f tot
al a
dver
tisin
g ex
pend
iture
, exc
ludi
ng
clas
sifie
ds a
nd d
irect
orie
s, fr
om C
EA
SA
indu
stry
sur
vey
asso
ciat
ion.
Dou
bled
to e
stim
ate
allo
w fo
r pro
duct
ion
cost
s.
(con
tinue
d on
nex
t pag
e)
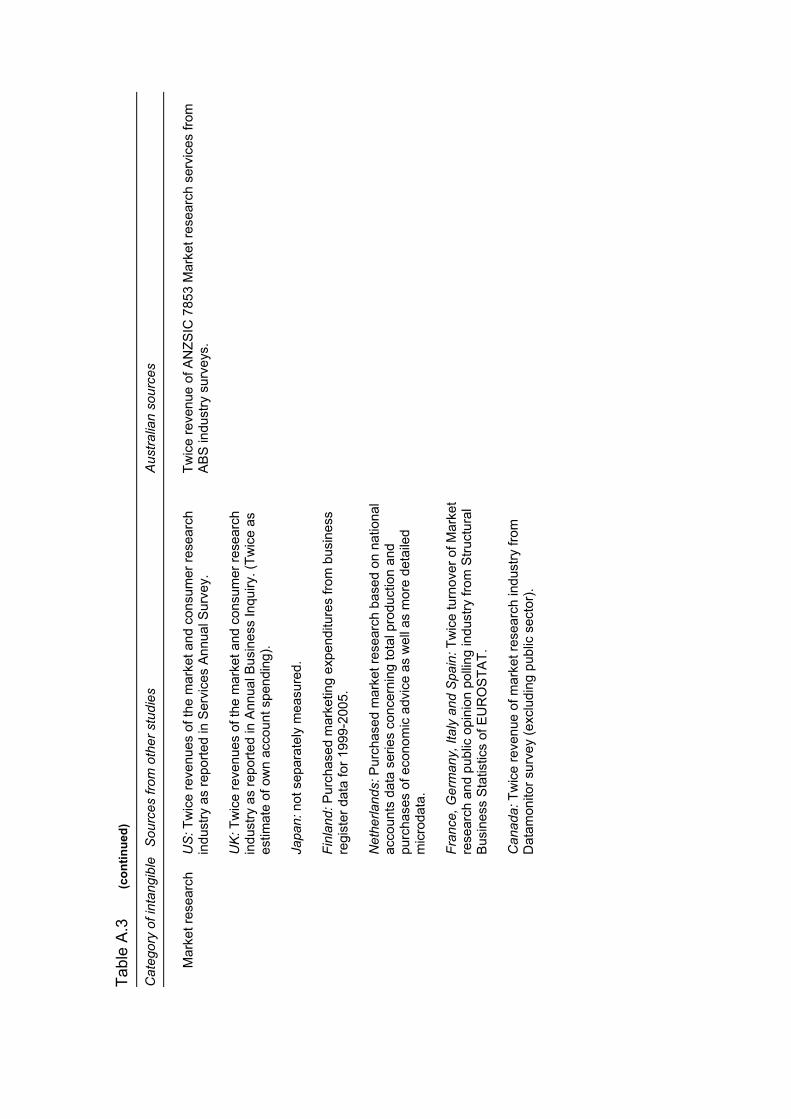
Tabl
e A
.3
(con
tinue
d)
Cat
egor
y of
inta
ngib
le
Sou
rces
from
oth
er s
tudi
es
Aus
tralia
n so
urce
s
Mar
ket r
esea
rch
US
: Tw
ice
reve
nues
of t
he m
arke
t and
con
sum
er re
sear
ch
indu
stry
as
repo
rted
in S
ervi
ces
Ann
ual S
urve
y.
UK
: Tw
ice
reve
nues
of t
he m
arke
t and
con
sum
er re
sear
ch
indu
stry
as
repo
rted
in A
nnua
l Bus
ines
s In
quiry
. (Tw
ice
as
estim
ate
of o
wn
acco
unt s
pend
ing)
.
Japa
n: n
ot s
epar
atel
y m
easu
red.
Finl
and:
Pur
chas
ed m
arke
ting
expe
nditu
res
from
bus
ines
s re
gist
er d
ata
for 1
999-
2005
.
Net
herla
nds:
Pur
chas
ed m
arke
t res
earc
h ba
sed
on n
atio
nal
acco
unts
dat
a se
ries
conc
erni
ng to
tal p
rodu
ctio
n an
d pu
rcha
ses
of e
cono
mic
adv
ice
as w
ell a
s m
ore
deta
iled
mic
roda
ta.
Fran
ce, G
erm
any,
Ital
y an
d S
pain
: Tw
ice
turn
over
of M
arke
t re
sear
ch a
nd p
ublic
opi
nion
pol
ling
indu
stry
from
Stru
ctur
al
Busi
ness
Sta
tistic
s of
EU
RO
STAT
.
Can
ada:
Tw
ice
reve
nue
of m
arke
t res
earc
h in
dust
ry fr
om
Dat
amon
itor s
urve
y (e
xclu
ding
pub
lic s
ecto
r).
Twic
e re
venu
e of
AN
ZSIC
785
3 M
arke
t res
earc
h se
rvic
es fr
om
AB
S in
dust
ry s
urve
ys.
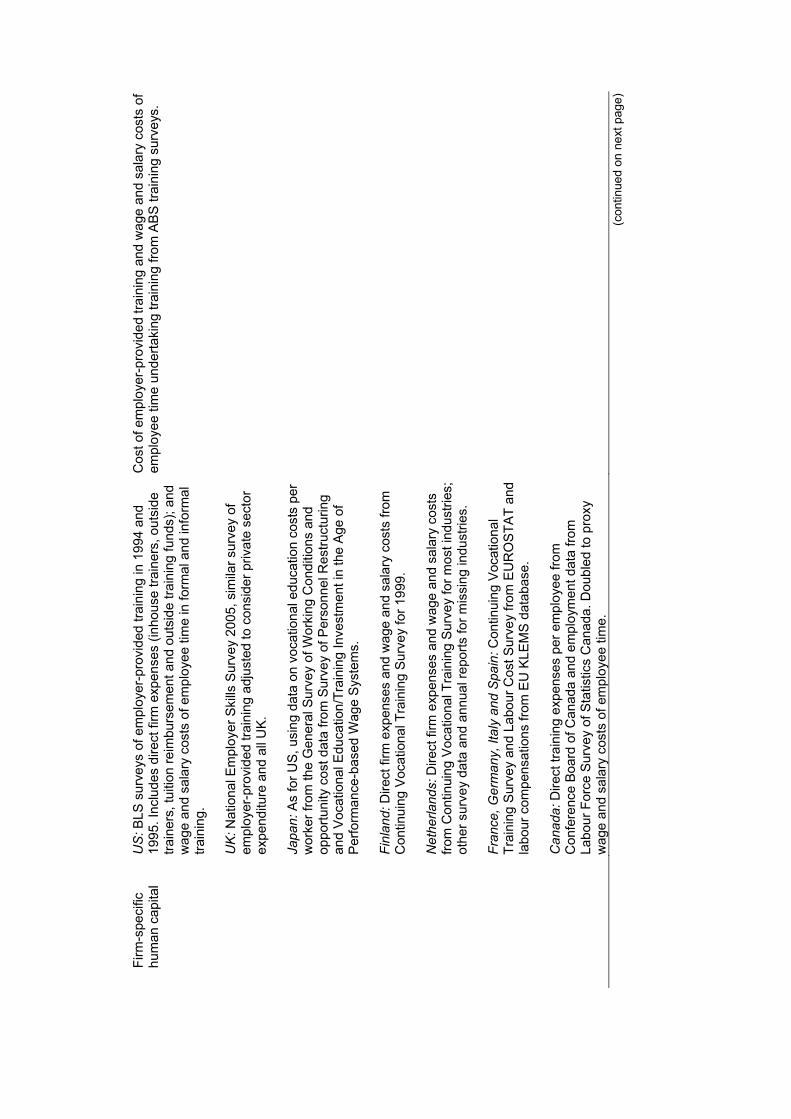
Firm
-spe
cific
hu
man
cap
ital
US
: BLS
sur
veys
of e
mpl
oyer
-pro
vide
d tra
inin
g in
199
4 an
d 19
95. I
nclu
des
dire
ct fi
rm e
xpen
ses
(inho
use
train
ers,
out
side
tra
iner
s, tu
ition
reim
burs
emen
t and
out
side
trai
ning
fund
s); a
nd
wag
e an
d sa
lary
cos
ts o
f em
ploy
ee ti
me
in fo
rmal
and
info
rmal
tra
inin
g.
UK
: Nat
iona
l Em
ploy
er S
kills
Sur
vey
2005
, sim
ilar s
urve
y of
em
ploy
er-p
rovi
ded
train
ing
adju
sted
to c
onsi
der p
rivat
e se
ctor
ex
pend
iture
and
all
UK
.
Japa
n: A
s fo
r US
, usi
ng d
ata
on v
ocat
iona
l edu
catio
n co
sts
per
wor
ker f
rom
the
Gen
eral
Sur
vey
of W
orki
ng C
ondi
tions
and
op
portu
nity
cos
t dat
a fro
m S
urve
y of
Per
sonn
el R
estru
ctur
ing
and
Voc
atio
nal E
duca
tion/
Trai
ning
Inve
stm
ent i
n th
e A
ge o
f P
erfo
rman
ce-b
ased
Wag
e S
yste
ms.
Finl
and:
Dire
ct fi
rm e
xpen
ses
and
wag
e an
d sa
lary
cos
ts fr
om
Con
tinui
ng V
ocat
iona
l Tra
inin
g S
urve
y fo
r 199
9.
Net
herla
nds:
Dire
ct fi
rm e
xpen
ses
and
wag
e an
d sa
lary
cos
ts
from
Con
tinui
ng V
ocat
iona
l Tra
inin
g S
urve
y fo
r mos
t ind
ustri
es;
othe
r sur
vey
data
and
ann
ual r
epor
ts fo
r mis
sing
indu
strie
s.
Fran
ce, G
erm
any,
Ital
y an
d S
pain
: Con
tinui
ng V
ocat
iona
l Tr
aini
ng S
urve
y an
d La
bour
Cos
t Sur
vey
from
EU
RO
STA
T an
d la
bour
com
pens
atio
ns fr
om E
U K
LEM
S d
atab
ase.
Can
ada:
Dire
ct tr
aini
ng e
xpen
ses
per e
mpl
oyee
from
C
onfe
renc
e Bo
ard
of C
anad
a an
d em
ploy
men
t dat
a fro
m
Labo
ur F
orce
Sur
vey
of S
tatis
tics
Can
ada.
Dou
bled
to p
roxy
w
age
and
sala
ry c
osts
of e
mpl
oyee
tim
e.
Cos
t of e
mpl
oyer
-pro
vide
d tra
inin
g an
d w
age
and
sala
ry c
osts
of
empl
oyee
tim
e un
derta
king
trai
ning
from
AB
S tr
aini
ng s
urve
ys.
(con
tinue
d on
nex
t pag
e)
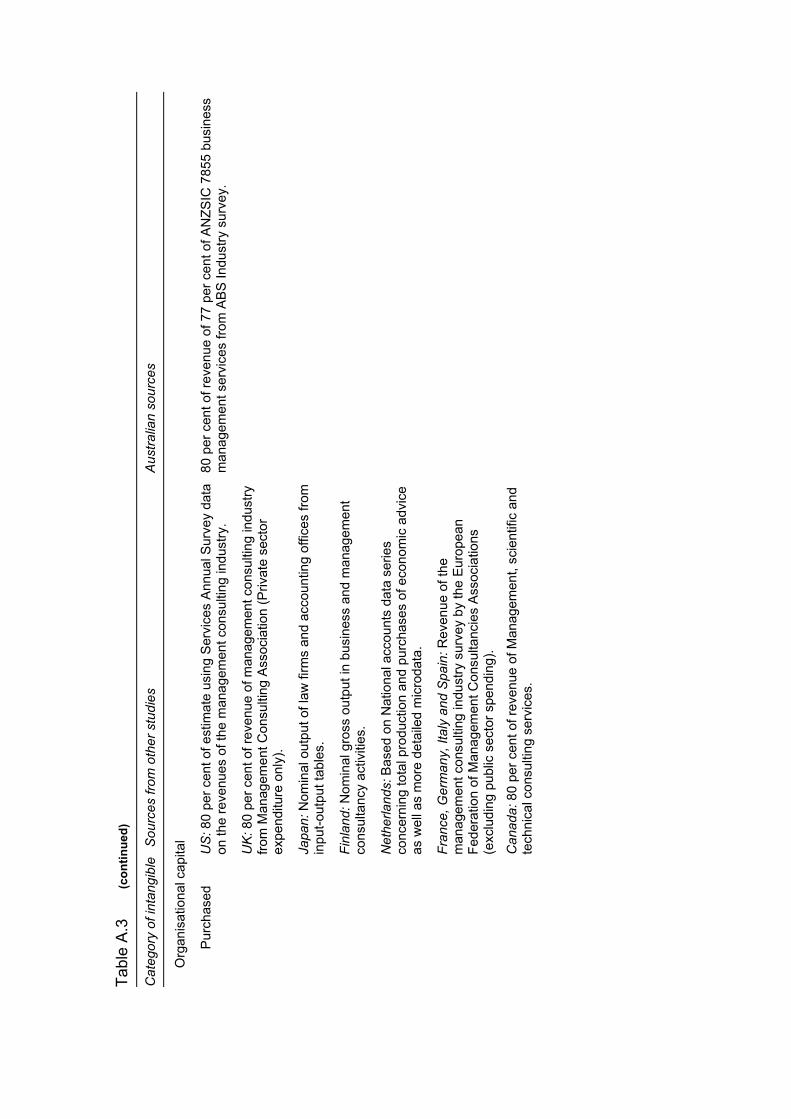
Tabl
e A
.3
(con
tinue
d)
Cat
egor
y of
inta
ngib
le
Sou
rces
from
oth
er s
tudi
es
Aus
tralia
n so
urce
s
Org
anis
atio
nal c
apita
l
Pur
chas
ed
US
: 80
per c
ent o
f est
imat
e us
ing
Ser
vice
s A
nnua
l Sur
vey
data
on
the
reve
nues
of t
he m
anag
emen
t con
sulti
ng in
dust
ry.
UK
: 80
per c
ent o
f rev
enue
of m
anag
emen
t con
sulti
ng in
dust
ry
from
Man
agem
ent C
onsu
lting
Ass
ocia
tion
(Priv
ate
sect
or
expe
nditu
re o
nly)
.
Japa
n: N
omin
al o
utpu
t of l
aw fi
rms
and
acco
untin
g of
fices
from
in
put-o
utpu
t tab
les.
Finl
and:
Nom
inal
gro
ss o
utpu
t in
busi
ness
and
man
agem
ent
cons
ulta
ncy
activ
ities
.
Net
herla
nds:
Bas
ed o
n N
atio
nal a
ccou
nts
data
ser
ies
conc
erni
ng to
tal p
rodu
ctio
n an
d pu
rcha
ses
of e
cono
mic
adv
ice
as w
ell a
s m
ore
deta
iled
mic
roda
ta.
Fran
ce, G
erm
any,
Ital
y an
d S
pain
: Rev
enue
of t
he
man
agem
ent c
onsu
lting
indu
stry
sur
vey
by th
e E
urop
ean
Fede
ratio
n of
Man
agem
ent C
onsu
ltanc
ies
Ass
ocia
tions
(e
xclu
ding
pub
lic s
ecto
r spe
ndin
g).
Can
ada:
80
per c
ent o
f rev
enue
of M
anag
emen
t, sc
ient
ific
and
tech
nica
l con
sulti
ng s
ervi
ces.
80 p
er c
ent o
f rev
enue
of 7
7 pe
r cen
t of A
NZS
IC 7
855
busi
ness
m
anag
emen
t ser
vice
s fro
m A
BS
Indu
stry
sur
vey.
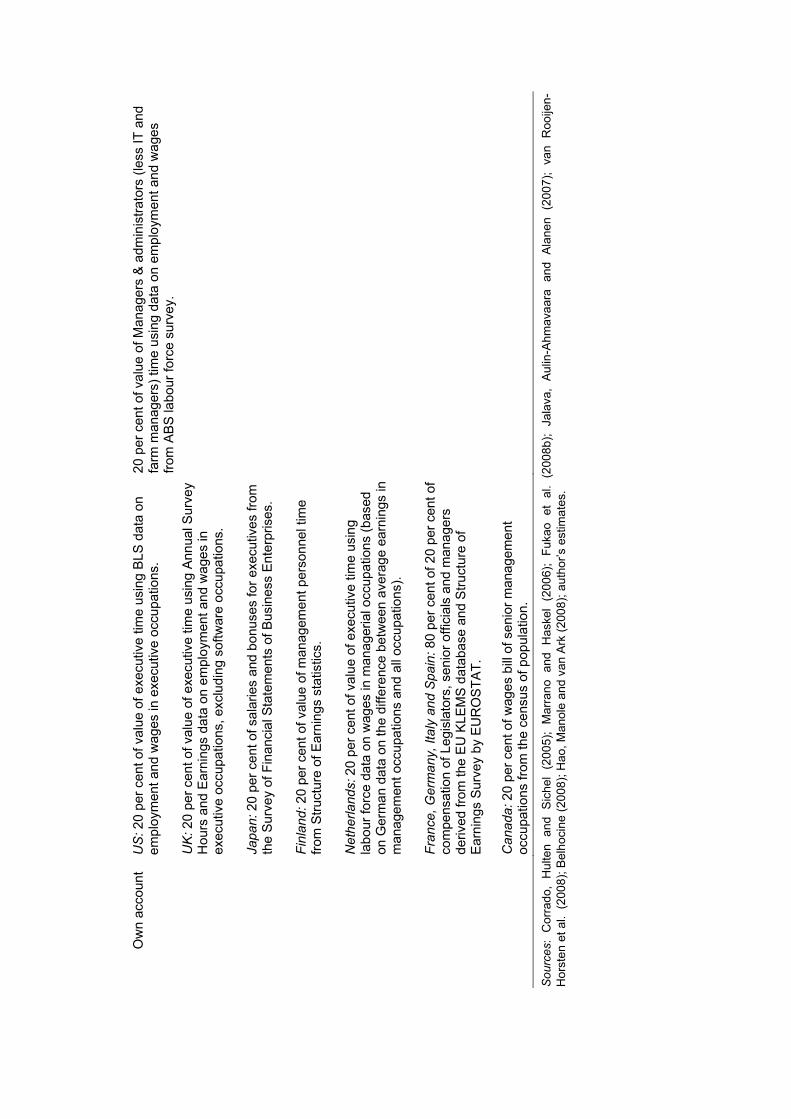
Ow
n ac
coun
t U
S: 2
0 pe
r cen
t of v
alue
of e
xecu
tive
time
usin
g B
LS d
ata
on
empl
oym
ent a
nd w
ages
in e
xecu
tive
occu
patio
ns.
UK
: 20
per c
ent o
f val
ue o
f exe
cutiv
e tim
e us
ing
Ann
ual S
urve
y H
ours
and
Ear
ning
s da
ta o
n em
ploy
men
t and
wag
es in
ex
ecut
ive
occu
patio
ns, e
xclu
ding
sof
twar
e oc
cupa
tions
.
Japa
n: 2
0 pe
r cen
t of s
alar
ies
and
bonu
ses
for e
xecu
tives
from
th
e S
urve
y of
Fin
anci
al S
tate
men
ts o
f Bus
ines
s E
nter
pris
es.
Finl
and:
20
per c
ent o
f val
ue o
f man
agem
ent p
erso
nnel
tim
e fro
m S
truct
ure
of E
arni
ngs
stat
istic
s.
Net
herla
nds:
20
per c
ent o
f val
ue o
f exe
cutiv
e tim
e us
ing
labo
ur fo
rce
data
on
wag
es in
man
ager
ial o
ccup
atio
ns (b
ased
on
Ger
man
dat
a on
the
diffe
renc
e be
twee
n av
erag
e ea
rnin
gs in
m
anag
emen
t occ
upat
ions
and
all
occu
patio
ns).
Fran
ce, G
erm
any,
Ital
y an
d S
pain
: 80
per c
ent o
f 20
per c
ent o
f co
mpe
nsat
ion
of L
egis
lato
rs, s
enio
r offi
cial
s an
d m
anag
ers
deriv
ed fr
om th
e E
U K
LEM
S d
atab
ase
and
Stru
ctur
e of
E
arni
ngs
Sur
vey
by E
UR
OS
TAT.
Can
ada:
20
per c
ent o
f wag
es b
ill o
f sen
ior m
anag
emen
t oc
cupa
tions
from
the
cens
us o
f pop
ulat
ion.
20 p
er c
ent o
f val
ue o
f Man
ager
s &
adm
inis
trato
rs (l
ess
IT a
nd
farm
man
ager
s) ti
me
usin
g da
ta o
n em
ploy
men
t and
wag
es
from
AB
S la
bour
forc
e su
rvey
.
Sou
rces
: C
orra
do,
Hul
ten
and
Sic
hel
(200
5);
Mar
rano
and
Has
kel
(200
6);
Fuka
o et
al.
(200
8b);
Jala
va,
Aul
in-A
hmav
aara
and
Ala
nen
(200
7);
van
Roo
ijen-
Hor
sten
et a
l. (2
008)
; Bel
hoci
ne (2
008)
; Hao
, Man
ole
and
van
Ark
(200
8); a
utho
r’s e
stim
ates
.

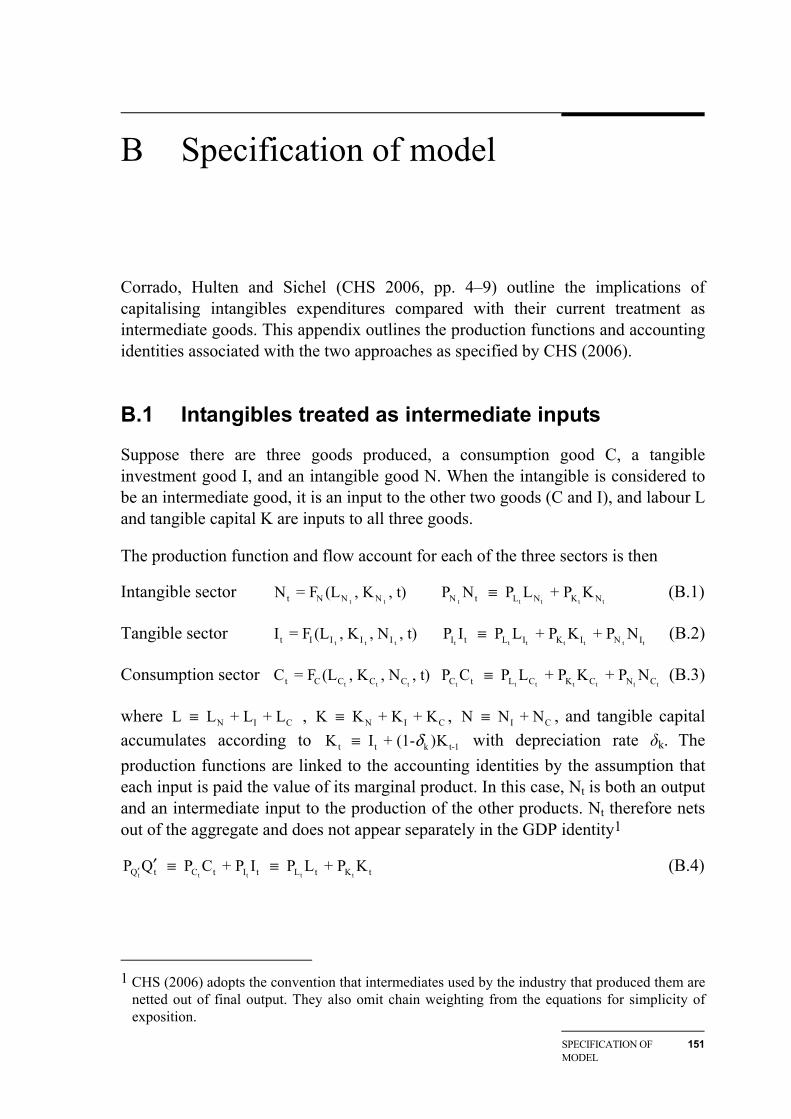
SPECIFICATION OF MODEL
151
B Specification of model
Corrado, Hulten and Sichel (CHS 2006, pp. 4–9) outline the implications of capitalising intangibles expenditures compared with their current treatment as intermediate goods. This appendix outlines the production functions and accounting identities associated with the two approaches as specified by CHS (2006).
B.1 Intangibles treated as intermediate inputs
Suppose there are three goods produced, a consumption good C, a tangible investment good I, and an intangible good N. When the intangible is considered to be an intermediate good, it is an input to the other two goods (C and I), and labour L and tangible capital K are inputs to all three goods.
The production function and flow account for each of the three sectors is then
Intangible sector t t t t t t tt N N N N t L N K NN = F (L , K , t) P N P L + P K≡ (B.1)
Tangible sector t t t t t t t t t tt I I I I I t L I K I N II = F (L , K , N , t) P I P L + P K + P N≡ (B.2)
Consumption sector t t t t t t t t t tt C C C C C t L C K C N CC = F (L , K , N , t) P C P L + P K + P N≡ (B.3)
where N I CL L + L + L ≡ , N I CK K + K + K≡ , I CN N + N≡ , and tangible capital accumulates according to t t k t-1K I + (1- )K≡ δ with depreciation rate δk. The production functions are linked to the accounting identities by the assumption that each input is paid the value of its marginal product. In this case, Nt is both an output and an intermediate input to the production of the other products. Nt therefore nets out of the aggregate and does not appear separately in the GDP identity1
t t t t tQ t C t I t L t K tP Q P C + P I P L + P K′ ′ ≡ ≡ (B.4)
1 CHS (2006) adopts the convention that intermediates used by the industry that produced them are
netted out of final output. They also omit chain weighting from the equations for simplicity of exposition.
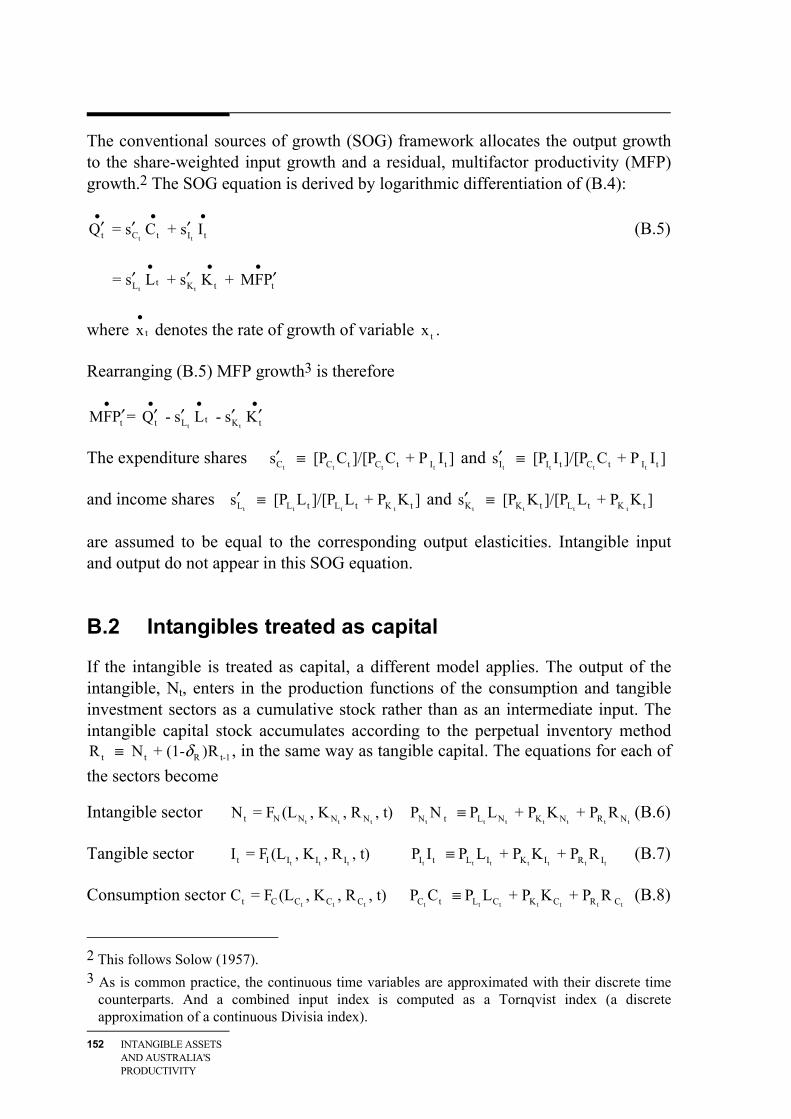
152 INTANGIBLE ASSETS AND AUSTRALIA'S PRODUCTIVITY
The conventional sources of growth (SOG) framework allocates the output growth to the share-weighted input growth and a residual, multifactor productivity (MFP) growth.2 The SOG equation is derived by logarithmic differentiation of (B.4):
t tt C t I tQ = s C + s I• • •′ ′ ′ (B.5)
t t
tL K t t= s L + s K + MFP• • •
′ ′ ′
where tx•
denotes the rate of growth of variable tx .
Rearranging (B.5) MFP growth3 is therefore
t ttt t L K tMFP = Q - s L - s K
• • • •′ ′ ′ ′ ′
The expenditure shares t t t tC C t C t I ts [P C ]/[P C + P I ]′ ≡ and
t t t tI I t C t I ts [P I ]/[P C + P I ]′ ≡
and income shares t t t tL L t L t K ts [P L ]/[P L + P K ]′ ≡ and
t t t tK K t L t K ts [P K ]/[P L + P K ]′ ≡
are assumed to be equal to the corresponding output elasticities. Intangible input and output do not appear in this SOG equation.
B.2 Intangibles treated as capital
If the intangible is treated as capital, a different model applies. The output of the intangible, Nt, enters in the production functions of the consumption and tangible investment sectors as a cumulative stock rather than as an intermediate input. The intangible capital stock accumulates according to the perpetual inventory method
t t R t-1R N + (1- )R≡ δ , in the same way as tangible capital. The equations for each of the sectors become
Intangible sector t t t t t t t t t tt N N N N N t L N K N R NN = F (L , K , R , t) P N P L + P K + P R≡ (B.6)
Tangible sector t t t t t t t t t tt I I I I I t L I K I R II = F (L , K , R , t) P I P L + P K + P R≡ (B.7)
Consumption sector t t t t t t t t t tt C C C C C t L C K C R CC = F (L , K , R , t) P C P L + P K + P R≡ (B.8)
2 This follows Solow (1957). 3 As is common practice, the continuous time variables are approximated with their discrete time
counterparts. And a combined input index is computed as a Tornqvist index (a discrete approximation of a continuous Divisia index).
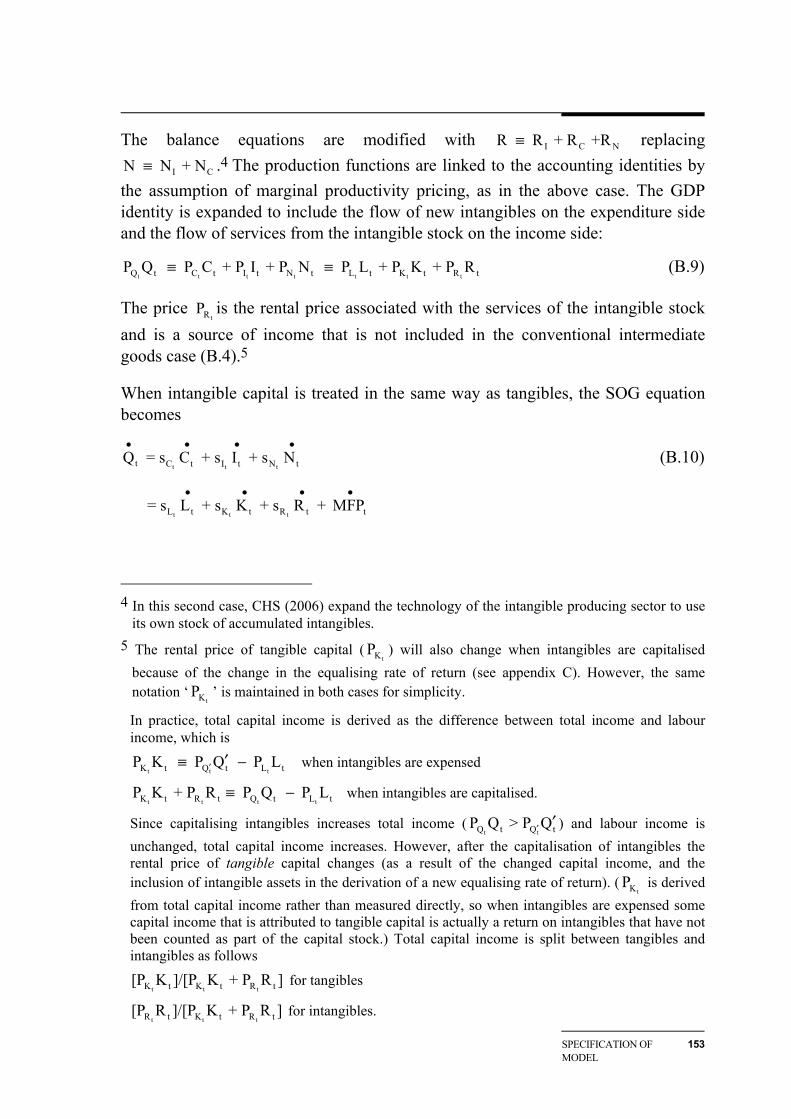
SPECIFICATION OF MODEL
153
The balance equations are modified with I C NR R + R +R≡ replacing
I CN N + N≡ .4 The production functions are linked to the accounting identities by the assumption of marginal productivity pricing, as in the above case. The GDP identity is expanded to include the flow of new intangibles on the expenditure side and the flow of services from the intangible stock on the income side:
t t t t t t tQ t C t I t N t L t K t R tP Q P C + P I + P N P L + P K + P R≡ ≡ (B.9)
The price tRP is the rental price associated with the services of the intangible stock
and is a source of income that is not included in the conventional intermediate goods case (B.4).5
When intangible capital is treated in the same way as tangibles, the SOG equation becomes
t t tt C t I t N tQ = s C + s I + s N• • • •
(B.10)
t t tL t K t R t t = s L + s K + s R + MFP• • • •
4 In this second case, CHS (2006) expand the technology of the intangible producing sector to use
its own stock of accumulated intangibles. 5 The rental price of tangible capital (
tKP ) will also change when intangibles are capitalised because of the change in the equalising rate of return (see appendix C). However, the same notation ‘
tKP ’ is maintained in both cases for simplicity.
In practice, total capital income is derived as the difference between total income and labour income, which is
t t tK t Q t L tP K P Q P L′ ′≡ − when intangibles are expensed
t t t tK t R t Q t L tP K + P R P Q P L≡ − when intangibles are capitalised.
Since capitalising intangibles increases total income (t tQ t Q tP Q > P Q′ ′ ) and labour income is
unchanged, total capital income increases. However, after the capitalisation of intangibles the rental price of tangible capital changes (as a result of the changed capital income, and the inclusion of intangible assets in the derivation of a new equalising rate of return). (
tKP is derived from total capital income rather than measured directly, so when intangibles are expensed some capital income that is attributed to tangible capital is actually a return on intangibles that have not been counted as part of the capital stock.) Total capital income is split between tangibles and intangibles as follows
t t tK t K t R t[P K ]/[P K + P R ] for tangibles
t t tR t K t R t[P R ]/[P K + P R ] for intangibles.
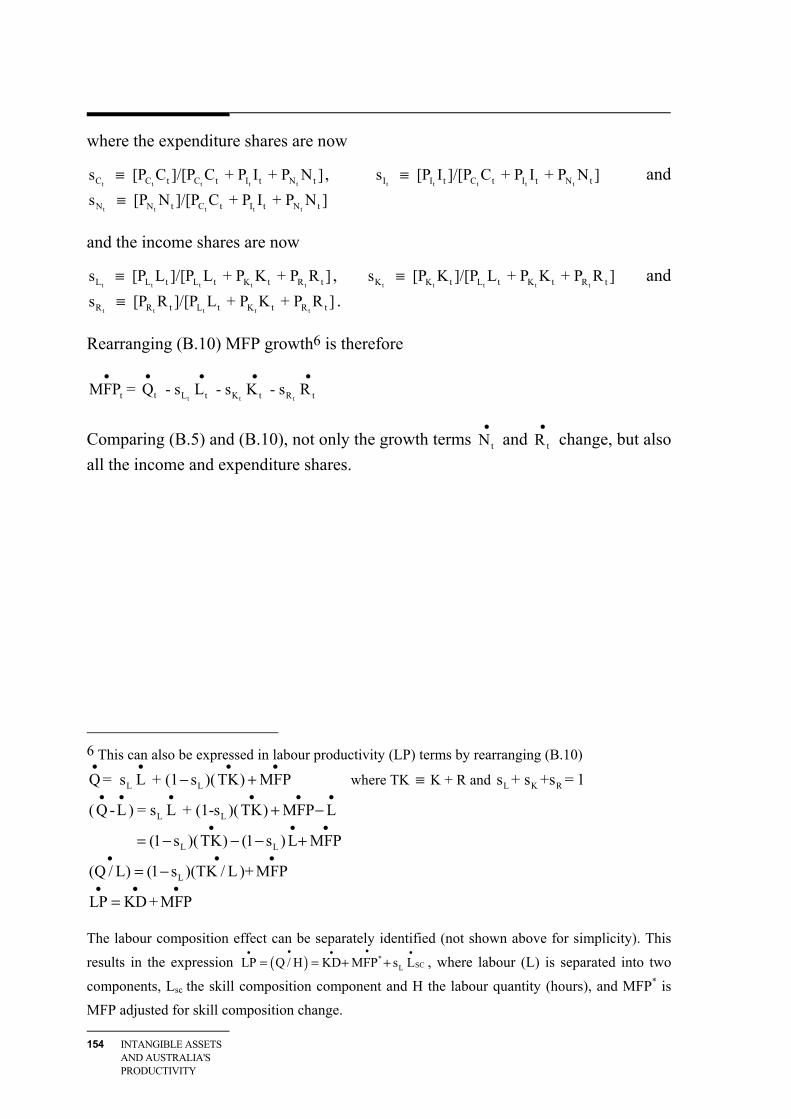
154 INTANGIBLE ASSETS AND AUSTRALIA'S PRODUCTIVITY
where the expenditure shares are now
t t t t tC C t C t I t N ts [P C ]/[P C + P I + P N ]≡ , t t t t tI I t C t I t N ts [P I ]/[P C + P I + P N ]≡ and
t t t t tN N t C t I t N ts [P N ]/[P C + P I + P N ]≡
and the income shares are now
t t t t tL L t L t K t R ts [P L ]/[P L + P K + P R ]≡ , t t t t tK K t L t K t R ts [P K ]/[P L + P K + P R ]≡ and
t t t t tR R t L t K t R ts [P R ]/[P L + P K + P R ]≡ .
Rearranging (B.10) MFP growth6 is therefore
t t ttt L t K t R tMFP = Q - s L - s K - s R• • • • •
Comparing (B.5) and (B.10), not only the growth terms tN•
and tR•
change, but also all the income and expenditure shares.
6 This can also be expressed in labour productivity (LP) terms by rearranging (B.10)
L LQ = s L + (1 s )(TK) MFP• • • •
− + where TK ≡ K + R and L K Rs + s +s = 1
L L(Q-L ) = s L + (1-s )(TK) MFP L• • • • • •
+ −
L L(1 s )(TK) (1 s ) L MFP• • •
= − − − +
L(Q / L) (1 s )(TK / L )+ MFP• • •
= −
LP KD + MFP• • •
=
The labour composition effect can be separately identified (not shown above for simplicity). This results in the expression ( ) *
SCLLP Q / H KD MFP s L••• • •
= = + + , where labour (L) is separated into two components, Lsc the skill composition component and H the labour quantity (hours), and MFP* is MFP adjusted for skill composition change.
GROWTH ACCOUNTING
155
C Growth accounting
This appendix describes the methodology used in this paper to construct new growth accounting results for the market sector. These have been calculated using the three different definitions of capital detailed in chapter 5. The first definition includes all intangible and tangible assets. The second definition contains the same capital assets as the Australian Bureau of Statistics (ABS) national accounts, while the third definition of capital excludes all intangible assets.
Section C.1 details the methodology for constructing new capital services indexes for the market sector including intangible assets. This includes detailing how the new rental prices were calculated and how a rate of return for all assets including the new intangible assets was calculated. Section C.2 details changes to other terms in the production function. This includes output, labour inputs and the factor income shares.
Unpublished ABS data have been used for all of the tangible assets as well as for the intangible assets already capitalised in the national accounts (computer software, artistic originals and mineral exploration).1 The capital services indexes including the new intangible assets (those not already capitalised in the national accounts) have been constructed using the intangible capital stock series estimated as described in chapter 4.
C.1 Construction of capital services indexes
To measure the impact of intangible investment on multifactor productivity (MFP) growth, new estimates of capital services growth need to be constructed for the market sector. Capital services reflect the amount of ‘service’ each asset provides during a set period. For each asset, the services provided are directly proportional to the asset's productive capital value. Aggregate capital services indexes are created using the volume index of the productive capital stock of each asset weighted using rental prices.
1 All published and unpublished national accounts data used in the growth accounting in this paper
are from the dataset underlying ABS Australian System of National Accounts, 2006-07 (Cat. no. 5204.0).
156 INTANGIBLE ASSETS AND AUSTRALIA'S PRODUCTIVITY
The productive capital stock of an asset is the real stock of capital, adjusted for efficiency losses related to age (according to the relevant age-efficiency profile). The productive capital stock of each asset type is weighted and summed to form an aggregate capital services measure. For the purposes of this paper, the real economic capital stock (net capital stock) and the productive capital stock for new intangible assets are assumed to be equal.2 The use of the net rather than productive capital stock means that the capital stock for intangible assets is understated.
The weights used in the summation of productive capital stocks are based on the rental prices for each asset type. Rental prices can be thought of as estimates of the rates each asset type would attract if leased under a commercial agreement. The use of rental prices as weights assumes that the rental price reflects the marginal product of an asset, hence more productive assets have a higher rental price and therefore a higher weight in the aggregate capital services measure. The compilation of rental prices is discussed below.
Aggregate estimates of capital services for the market sector are formed by combining estimates of the productive capital stock and rental price for each asset type into a Tornqvist3 index of aggregate capital services. For some asset types4, capital is also split by industry and institutional sector — this is not shown for simplicity. The flow of aggregate capital services K equals the product of the change in the capital stock of each asset jK , weighted by the rental price weight of each asset jw .
( 1)
1jw
j
j j t
KK
K −
⎡ ⎤= −⎢ ⎥
⎢ ⎥⎣ ⎦∏& (C.1)
The rental price weight for each asset is based on its share of total market sector capital rent. Capital rent is the rental price jtr multiplied by the real productive capital stock jK .
2 The productive value and the economic value of an asset are slightly different. The productive
capital stock represents an age-efficiency function while the net capital stock represents an age-price function. Because an asset’s value depreciates faster than its productive capacity, the net capital stock is invariably smaller than the productive capital stock (ABS 2000).
3 A Tornqvist index is the weighted geometric mean of the component growth rates. 4 For the tangible assets and the national account intangibles, assets are split by type, industry and
institutional sector (corporate, unincorporated). Splitting the new intangibles by industry and institutional sector has not been possible due to data limitations.
GROWTH ACCOUNTING
157
1 1
1 1
. .0.5*
. .j j jt jt
jj ij jt jtj j
r K r Kw
r K r K− −
− −
⎛ ⎞⎜ ⎟
= +⎜ ⎟Σ Σ⎜ ⎟⎝ ⎠
(C.2)
This methodology differs from the ABS methodology because all assets in all industries are aggregated in a single stage. The ABS constructs capital services indexes for each of the twelve market sector industries separately, then weights these indexes together using the gross operating surplus (GOS) of each industry as a weight (see ABS 2000, chapter 27 for further details). It has not been possible to estimate the intangible assets for each industry due to data limitations, so the single stage aggregation had to be used. Because of this difference in methodology, the capital services indexes used in this paper differ from published ABS estimates.
The new methodology has been used to construct new capital services indexes for each of the three capital definitions described above — the existing national accounts assets, tangible assets only and tangibles plus all intangible assets. Constructing all the indexes using the new methodology allows a direct comparison of the change in the growth rate of capital services due to the treatment of intangibles as capital. The implications of changing the capital services methodology are discussed in detail below.
Rental prices
The rental price of an asset is equivalent to the user cost of capital.5 It is the implicit price for employing or obtaining the productive value of a unit of capital for one period. Because the majority of capital is owned by its user rather than rented in the market, the rental price for the asset is an estimate of what the market rental price of the asset would be. The rental price includes most of the measurable costs incurred in the use of that asset. It covers the expected return on the asset, represented by the internal rate of return; the loss in market value of the good due to ageing; the capital gains or losses due to asset price inflation/deflation; a non-income tax parameter and adjustments for tax concessions made to correct for distortions in rental prices due to differential tax treatment across capital items.
5 The rental price formula used in this paper is based on that used in the ABS’s standard
methodology for measuring capital services (see ABS 2000, chapter 27). This approach to the measurement of rental prices may differ from that used elsewhere. For a discussion of alternative rental price methodologies used in capital services measures see OECD (2001, chapter 9).
158 INTANGIBLE ASSETS AND AUSTRALIA'S PRODUCTIVITY
The rental price is derived using the following formula
( 1)( . . ) .j j j j j j j t jr T i p d p p p p x−= + − + + (C.3)
where for asset type j , the rental price r is a function of the income tax rate T ; the internal rate of return i ; the price deflator p ; the depreciation rate d ; and the non-income tax parameter x (which is assumed to be the same for all j).6
For existing tangible assets and the intangible assets currently capitalised in the national accounts, most of the above data have been provided by the ABS. However, capitalising the new intangible assets will change two of the parameters for the tangible assets and existing intangibles — the internal rate of return and the non-income tax parameter. The methodology used for calculating the rate of return is discussed below.
Because there is very little existing data about the new intangible assets, assumptions need to be made about the parameters to be used for them in the rental price calculations. Assumptions have been made for the depreciation rate, the income tax parameter, the deflator and the effective average non-income tax rate on production.
In this paper, the depreciation rates used for the new intangible assets are those used in Corrado, Hulten and Sichel (CHS 2006) and for the national accounts intangibles the ABS rates are used (table C.1). These depreciation rates are relatively high, which reflects the assumption that intangible investment has a relatively short productive life.
6 There is some debate as to whether or not all of the functions in the rental price equation should
be included for intangible assets due to the nature of those assets. Sensitivity tests, detailed in appendix D, have been performed on several parts of the rental price equation for the new intangibles.
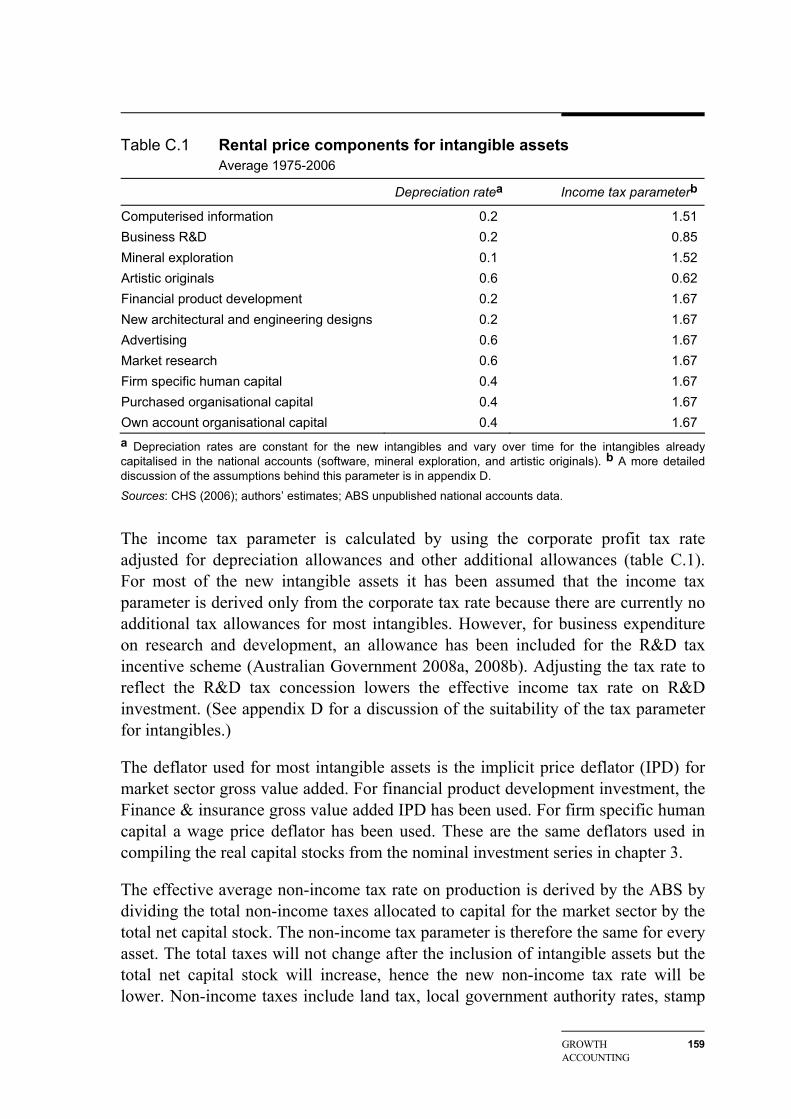
GROWTH ACCOUNTING
159
Table C.1 Rental price components for intangible assets Average 1975-2006
Depreciation ratea Income tax parameterb
Computerised information 0.2 1.51 Business R&D 0.2 0.85 Mineral exploration 0.1 1.52 Artistic originals 0.6 0.62 Financial product development 0.2 1.67 New architectural and engineering designs 0.2 1.67 Advertising 0.6 1.67 Market research 0.6 1.67 Firm specific human capital 0.4 1.67 Purchased organisational capital 0.4 1.67 Own account organisational capital 0.4 1.67 a Depreciation rates are constant for the new intangibles and vary over time for the intangibles already capitalised in the national accounts (software, mineral exploration, and artistic originals). b A more detailed discussion of the assumptions behind this parameter is in appendix D.
Sources: CHS (2006); authors’ estimates; ABS unpublished national accounts data.
The income tax parameter is calculated by using the corporate profit tax rate adjusted for depreciation allowances and other additional allowances (table C.1). For most of the new intangible assets it has been assumed that the income tax parameter is derived only from the corporate tax rate because there are currently no additional tax allowances for most intangibles. However, for business expenditure on research and development, an allowance has been included for the R&D tax incentive scheme (Australian Government 2008a, 2008b). Adjusting the tax rate to reflect the R&D tax concession lowers the effective income tax rate on R&D investment. (See appendix D for a discussion of the suitability of the tax parameter for intangibles.)
The deflator used for most intangible assets is the implicit price deflator (IPD) for market sector gross value added. For financial product development investment, the Finance & insurance gross value added IPD has been used. For firm specific human capital a wage price deflator has been used. These are the same deflators used in compiling the real capital stocks from the nominal investment series in chapter 3.
The effective average non-income tax rate on production is derived by the ABS by dividing the total non-income taxes allocated to capital for the market sector by the total net capital stock. The non-income tax parameter is therefore the same for every asset. The total taxes will not change after the inclusion of intangible assets but the total net capital stock will increase, hence the new non-income tax rate will be lower. Non-income taxes include land tax, local government authority rates, stamp
160 INTANGIBLE ASSETS AND AUSTRALIA'S PRODUCTIVITY
duties and other miscellaneous taxes (ABS 2000, chapter 27). Given the ABS method for allocating non-income taxes, the non-income tax rate changes for all assets when intangible capital is included — therefore rental prices for all tangible and existing intangible assets will also change.
All new intangible capital is allocated to the corporate sector because the required data are not available to split the intangibles between sectors. The corporate sector is much larger than the unincorporated sector and is likely to represent the bulk of investment in intangibles (if not all, in cases such as financial product development). However, it should be noted that the assumption that all intangible investment is contained within the corporate sector will overstate the impact of intangibles in the capital services index because rental prices for the unincorporated sector are derived as a function of corporate rental prices and are invariably lower.
Rental prices for the unincorporated sector are derived by the ABS as a function of the corporate rental price weighted by the ratio of unincorporated capital income to proprietors’ labour income. This methodology is maintained in this paper as there will be no change in proprietors’ labour income and no change in the unincorporated capital because all intangibles were allocated to the corporate sector.
Occasionally, rental prices calculated using equation (C.3) can be negative. If this occurs the approach used by the ABS is to set these rental prices to a very small positive number, usually 0.001. This is to prevent negative rental prices from causing complications in the later growth rate calculations. This approach is also followed in this paper. When calculating rental prices, only a limited number of asset types, such as agricultural land, regularly display negatives. Of the intangible assets, either national accounts or new, only software has a negative rental price in any year.
Internal rate of return
The rate of return represents the expected return on a unit of an asset after adjusting for all other price factors, taxes and depreciation. Normally the ABS calculates the rate of return for all assets in each particular industry, but for this paper a new rate of return had to be calculated for the entire market sector.7 The rate of return for the market sector has been recalculated for each of the three definitions of capital, as the treatment of intangibles as capital will change the rate of return for all assets.
7 The Jorgenson-Griliches methodology for estimating the rate of return as a common rate across
all assets (both tangibles and intangibles) has been used. This assumes that businesses arbitrage their investments across all types of capital, investing in each type until the rate of return for all assets is equal (CHS 2006). This assumes there is no risk differential.
GROWTH ACCOUNTING
161
The rate of return for an asset can be either calculated or assumed. An endogenous rate of return can be calculated by assuming that capital income, or adjusted gross operating surplus, is equal to capital rent. Alternatively, an exogenous rate of return can be used, usually based on an external variable such as the consumer price index (CPI). The ABS currently uses a hybrid system, using an endogenous rate of return for each industry, but with an exogenous floor rate of return of the CPI growth plus 4 per cent as a lower limit (ABS 2000). This paper uses the same lower limit when deriving a rate of return for all market sector assets.
As mentioned above, under an endogenous model capital rent is assumed to equal capital income. If an endogenous model was used for the rates of return, with no lower limit as used by the ABS, then the sum of the rental prices for each asset multiplied by the productive capital stocks for each asset class would equal capital income.8
.j jj
Q r K=∑ (C.4)
summed across assets j
Using this assumption, calculating the endogenous rates of return9 is simply a case of reorganising the rental price equation to include capital income and the productive capital stock.
( 1)( ( . ) . )
. .
j j j j j j t jj
j j jj
Q K T d p p p p xi
K T p
−− − + +=
∑∑
(C.5)
where Q is capital income (including non-income taxes attributed to capital) and K is the real productive capital stock.10
8 Provided all the endogenous rental prices are positive, as a negative rental price forced to zero
would also affect the total capital income. 9 This rate of return takes account of taxes and capital gains/losses due to asset price inflation that
may not be included in rates of return calculated for other purposes. 10 ABS (2007, p. 107) notes that there is a question as to whether the productive capital stock or
the net capital stock should be used to estimate the endogenous rate of return. Currently the ABS uses the real productive capital stock but has noted that it will consider changing its approach in the future.
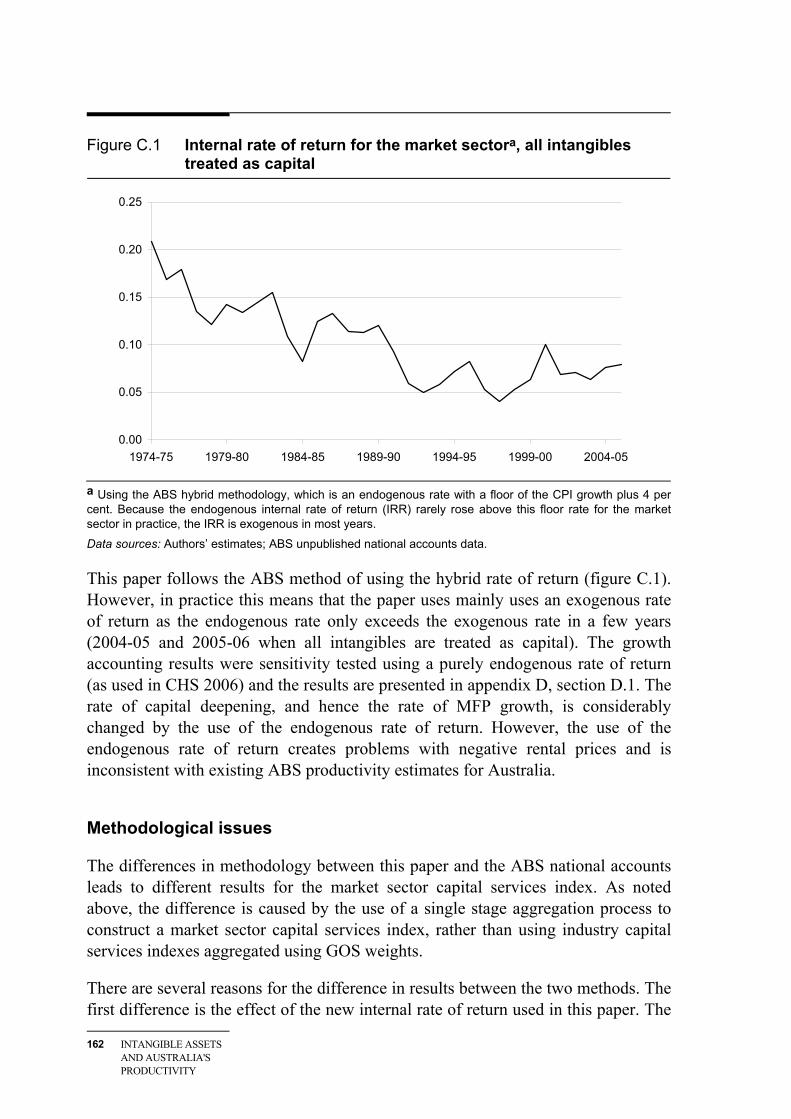
162 INTANGIBLE ASSETS AND AUSTRALIA'S PRODUCTIVITY
Figure C.1 Internal rate of return for the market sectora, all intangibles treated as capital
0.00
0.05
0.10
0.15
0.20
0.25
1974-75 1979-80 1984-85 1989-90 1994-95 1999-00 2004-05
a Using the ABS hybrid methodology, which is an endogenous rate with a floor of the CPI growth plus 4 per cent. Because the endogenous internal rate of return (IRR) rarely rose above this floor rate for the market sector in practice, the IRR is exogenous in most years.
Data sources: Authors’ estimates; ABS unpublished national accounts data.
This paper follows the ABS method of using the hybrid rate of return (figure C.1). However, in practice this means that the paper uses mainly uses an exogenous rate of return as the endogenous rate only exceeds the exogenous rate in a few years (2004-05 and 2005-06 when all intangibles are treated as capital). The growth accounting results were sensitivity tested using a purely endogenous rate of return (as used in CHS 2006) and the results are presented in appendix D, section D.1. The rate of capital deepening, and hence the rate of MFP growth, is considerably changed by the use of the endogenous rate of return. However, the use of the endogenous rate of return creates problems with negative rental prices and is inconsistent with existing ABS productivity estimates for Australia.
Methodological issues
The differences in methodology between this paper and the ABS national accounts leads to different results for the market sector capital services index. As noted above, the difference is caused by the use of a single stage aggregation process to construct a market sector capital services index, rather than using industry capital services indexes aggregated using GOS weights.
There are several reasons for the difference in results between the two methods. The first difference is the effect of the new internal rate of return used in this paper. The
GROWTH ACCOUNTING
163
rate of return used in the estimates in this paper is calculated as a single rate for the market sector. This rate of return is generally equal to the minimum rate of return under the ABS methodology. Because the ABS calculates a separate rate of return for each industry, some of these rates of return exceed the minimum rate in some years. Therefore the average rate of return across all industries under the ABS methodology will be higher than the rate of return used in this paper, which is nearly always equal to the minimum ABS rate. If the gap between the ABS average rate of return and the minimum rate of return is increasing, then a capital services index calculated using rental prices based on the minimum rate of return will grow more slowly than that using the ABS average rate. An analysis of the results shows this to be the case, mainly due to strong growth in the internal rates of return calculated for assets in Construction and Finance & insurance.
The second difference between the methodologies concerns the rental price weight of each asset in the aggregate market sector capital services index. The ABS compiles indexes of capital services for each industry and then weights these together using GOS weights. However, because the intangible assets cannot be split between industries, in this paper the market sector capital services index is compiled in a single stage. Under the ABS methodology the rental price weight of an asset in the final market sector capital service index is equal to its weight in its relevant industry capital services index multiplied by that industry’s GOS weight. Under the new methodology an asset’s weight in the market sector capital services index is equal to its rental price weight in total industry capital income. The change of weighting will change the growth rate of market sector capital services.
The change in the rate of return will also affect the relative weight of each asset in the aggregate capital services index. Using a single rate of return across all industries will mean that some assets have their rental price weight affected by the change in the rate of return.
C.2 Growth accounting components
This section details the methodology and data sources used for the other (non-capital) parameters in the growth accounting framework.
Output
For the all intangibles case, output is equal to existing market sector gross value added (GVA) plus investment in the new intangible assets. For each of the new intangible assets expenditure series were constructed (as described in chapter 3) and these expenditure series were then used to calculate an investment series for
164 INTANGIBLE ASSETS AND AUSTRALIA'S PRODUCTIVITY
intangible assets. A new chain volume measure of value added for the market sector was calculated by adding this investment series to current price GVA for the existing market sector. This was then deflated using a market sector IPD and individual price deflators for each intangible asset.
Output for the market sector including only the existing national accounts intangible assets is equal to market sector GVA supplied by the ABS.
Output excluding all intangible assets was constructed by deducting current price investment in the existing intangible assets from existing market sector GVA.11 The result was then deflated using a market sector IPD.12
Income shares
The inclusion of intangibles investment increases the level of capital income, which in turn increases the capital share of total income with an equivalent fall in the labour income share. The impact on the income shares is outlined in more detail in appendix B, section B.2.
Total factor income as currently measured in the national accounts was provided by the ABS.
• Capital income in the ABS national accounts is gross operating surplus (GOS) plus the capital share of Gross Mixed Income (GMI) and taxes.
• Labour income is Compensation of Employees (COE) plus the labour share of GMI and taxes.
• Labour and capital income estimates were supplied with GMI and taxes already split between capital and labour income.
11 Current price gross fixed capital formation (GFCF) for the existing national accounts intangible
assets (computer software, artistic originals and mineral exploration) was used as the investment estimate for the national accounts intangibles.
12 When market sector output was reinflated after the exclusion of current price investment in the existing intangible assets, the market sector IPD was used to reinflate the output estimates. No adjustment was made to the IPD to reflect the removal of those intangible assets. Sufficient data were not available to construct an IPD for the reduced scope of output. However, testing was performed to approximately measure the impact of removing these assets on the price deflator using an adjustment based on the corporate sector asset price deflators only, without also including the unincorporated sector asset deflators. The outcome of this testing showed that adjusting for the removal of the existing intangible assets from the market sector price deflator had little effect on the market sector IPD and therefore little effect on total market sector output. It was therefore decided that using the original market sector IPD would be sufficient for calculating real output for the market sector minus the national accounts intangible assets.
GROWTH ACCOUNTING
165
Because this paper assumes all intangible assets are in the corporate sector, no change to the split of GMI (income of the unincorporated sector) was required when treating intangibles as capital.
Capital income for the three capital definitions are as follows.
• For the case including all intangible assets, capital income is equal to national accounts capital income (adjusted GOS) plus all investment in new intangibles.
• For the existing national accounts definition of capital, capital income is GOS adjusted for GMI and taxes (as outlined above).
• For the case excluding all intangible assets, capital income is equal to national accounts capital income minus GFCF in the national accounts intangible assets.
As detailed in chapter 5 and appendix B, investment in intangibles will increase total factor income and capital income while labour income is unchanged. Therefore treating intangibles as capital will decrease the labour income share while increasing the capital income share. For the case excluding all intangible assets, the reverse is true.
Labour inputs
The labour inputs index used in the growth accounting is the growth in hours worked for the market sector from the ABS national accounts. In chapters 5 and 6, a labour composition component has been included in the growth accounting results. This is calculated using a quality adjusted labour inputs index (QALI) supplied by the ABS for the period 1982-83 to 2005-06. This index is used to construct MFP estimates that are adjusted to take account of general improvements in the experience, education and training of the workforce. The ABS constructs this quality-adjusted index of hours worked by disaggregating total hours worked on the basis of educational attainment and potential workforce experience and weighting these hours by wages (see ABS 2001 and ABS 2005 for details).13
The contribution of QALI to MFP is included in tables 5.3, 6.3 and 6.4 from 1984-85. The contribution of QALI to MFP growth will stay constant with the treatment of intangibles as capital — therefore as the total rate of MFP growth falls with the treatment of intangibles as capital, the contribution of QALI to labour productivity growth will also fall.
13 See chapter 3 for a discussion of the potential overlap between QALI and the firm-specific
training intangible.

SENSITIVITY TESTING 167
D Sensitivity testing
This appendix details the sensitivity testing undertaken on the growth accounting results from chapter 5. The appendix is split into three sections. The first section tests the results using a different methodology for calculating the internal rate of return for the capital stock. The second section tests different values for other parameters in the rental price equation. The third section tests the growth accounting results with different investment estimates for the new intangible assets.
D.1 Internal rate of return
This paper applies the hybrid Australian Bureau of Statistics (ABS) methodology for calculating the internal rate of return on capital (see appendix C). The methodology uses an endogenous rate of return unless the rate falls below an exogenous rate equal to consumer price index (CPI) growth plus 4 per cent. If the rate falls below this floor level, the exogenous rate is used. In practice the rate of return, which is constrained to be the same across all assets, fell below this mark in most years when calculated for the aggregate market sector. Therefore, the rate of return used in this paper is mainly exogenous. Because this differs from the Corrado, Hulten and Sichel (CHS 2006) methodology, which used an endogenous rate of return, the Australian results have been re-estimated with an endogenous rate of return1 for the purposes of international comparison. This section compares the Australian growth accounting results with an endogenous rate of return with those using the ABS hybrid method (as reported in chapters 5 and 6).
There is a considerable difference between the exogenous rate of return and the endogenous rates calculated for the three definitions of capital (figure D.1). In particular, the endogenous rate of return is negative for 1990-91 and 1991-92. The figure also shows there is only a small difference between the average endogenous rates of return for the three definitions of capital. Because the stock of intangibles is small relative to tangibles (and intangible investment is a small share of total capital
1 It should be noted that the internal rates of return used in this paper relate to the specific context
of calculating rental prices and take into account factors (such as taxes and asset revaluations) that may not be included in rates of return calculated for other purposes (see appendix C).
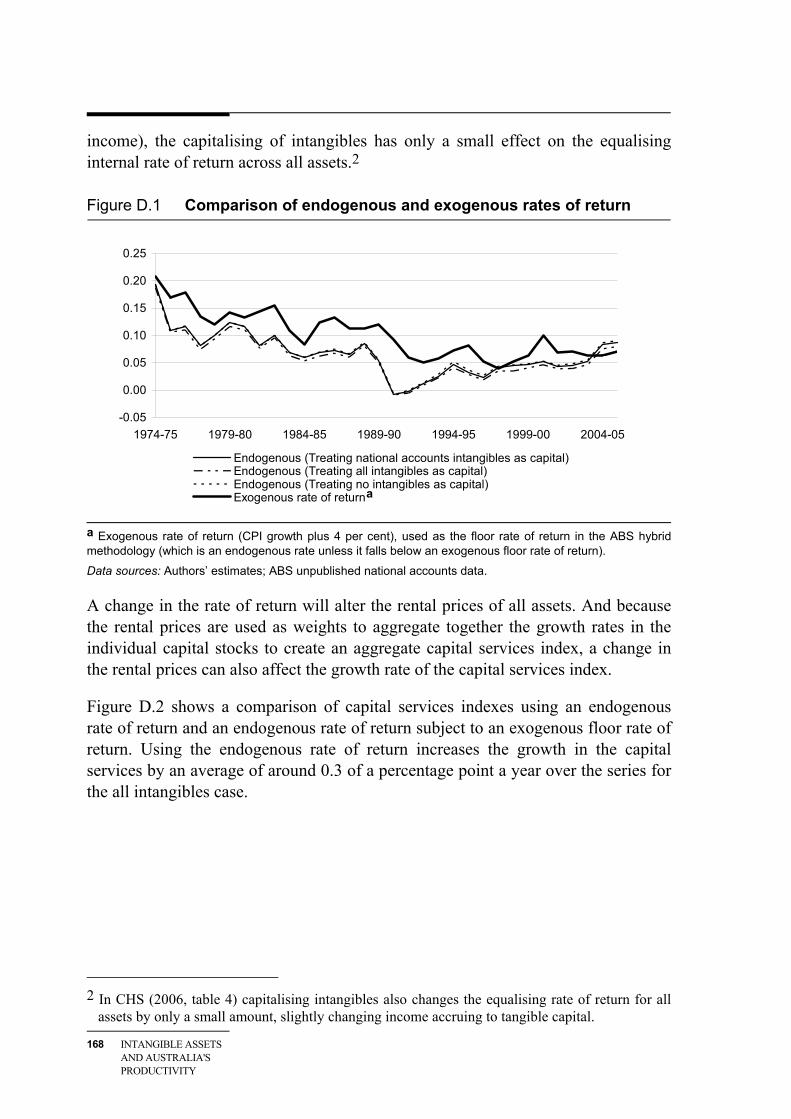
168 INTANGIBLE ASSETS AND AUSTRALIA'S PRODUCTIVITY
income), the capitalising of intangibles has only a small effect on the equalising internal rate of return across all assets.2
Figure D.1 Comparison of endogenous and exogenous rates of return
-0.05
0.00
0.05
0.10
0.15
0.20
0.25
1974-75 1979-80 1984-85 1989-90 1994-95 1999-00 2004-05
Endogenous (Treating national accounts intangibles as capital)Endogenous (Treating all intangibles as capital)Endogenous (Treating no intangibles as capital)Exogenous rate of returna
a Exogenous rate of return (CPI growth plus 4 per cent), used as the floor rate of return in the ABS hybrid methodology (which is an endogenous rate unless it falls below an exogenous floor rate of return).
Data sources: Authors’ estimates; ABS unpublished national accounts data.
A change in the rate of return will alter the rental prices of all assets. And because the rental prices are used as weights to aggregate together the growth rates in the individual capital stocks to create an aggregate capital services index, a change in the rental prices can also affect the growth rate of the capital services index.
Figure D.2 shows a comparison of capital services indexes using an endogenous rate of return and an endogenous rate of return subject to an exogenous floor rate of return. Using the endogenous rate of return increases the growth in the capital services by an average of around 0.3 of a percentage point a year over the series for the all intangibles case.
2 In CHS (2006, table 4) capitalising intangibles also changes the equalising rate of return for all
assets by only a small amount, slightly changing income accruing to tangible capital.
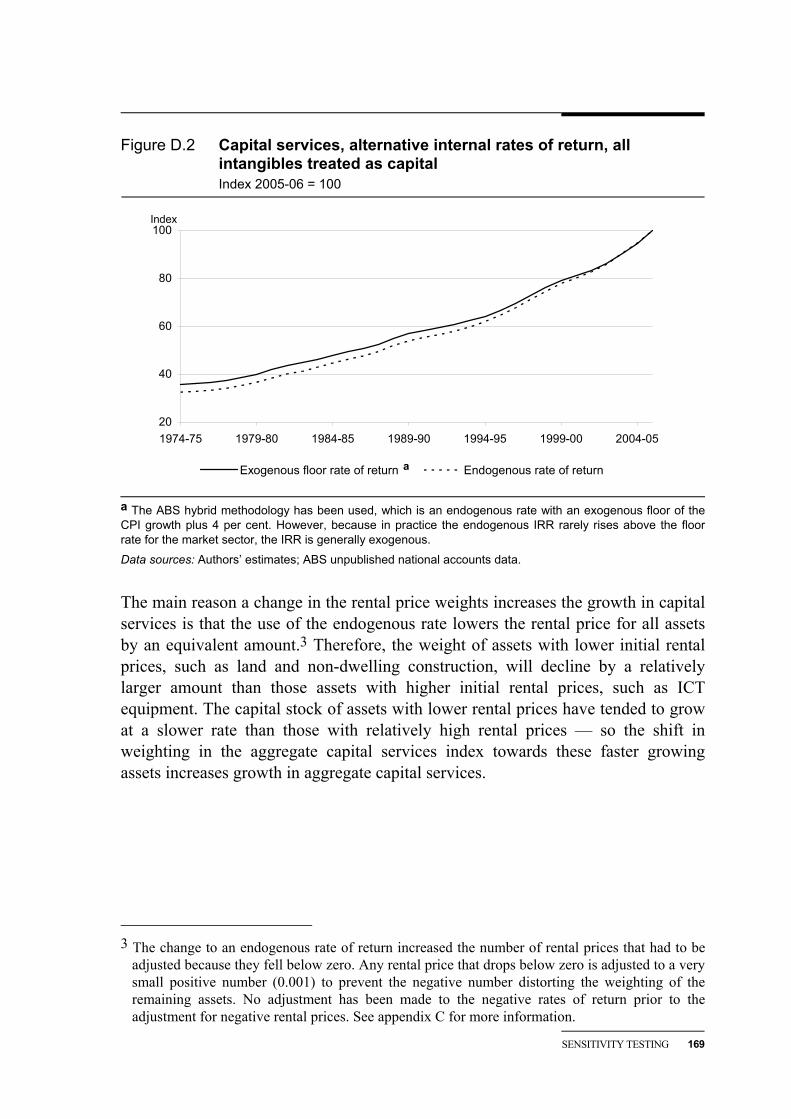
SENSITIVITY TESTING 169
Figure D.2 Capital services, alternative internal rates of return, all intangibles treated as capital Index 2005-06 = 100
20
40
60
80
100
1974-75 1979-80 1984-85 1989-90 1994-95 1999-00 2004-05
Exogenous floor rate of return Endogenous rate of return a
Index
a The ABS hybrid methodology has been used, which is an endogenous rate with an exogenous floor of the CPI growth plus 4 per cent. However, because in practice the endogenous IRR rarely rises above the floor rate for the market sector, the IRR is generally exogenous.
Data sources: Authors’ estimates; ABS unpublished national accounts data.
The main reason a change in the rental price weights increases the growth in capital services is that the use of the endogenous rate lowers the rental price for all assets by an equivalent amount.3 Therefore, the weight of assets with lower initial rental prices, such as land and non-dwelling construction, will decline by a relatively larger amount than those assets with higher initial rental prices, such as ICT equipment. The capital stock of assets with lower rental prices have tended to grow at a slower rate than those with relatively high rental prices — so the shift in weighting in the aggregate capital services index towards these faster growing assets increases growth in aggregate capital services.
3 The change to an endogenous rate of return increased the number of rental prices that had to be
adjusted because they fell below zero. Any rental price that drops below zero is adjusted to a very small positive number (0.001) to prevent the negative number distorting the weighting of the remaining assets. No adjustment has been made to the negative rates of return prior to the adjustment for negative rental prices. See appendix C for more information.
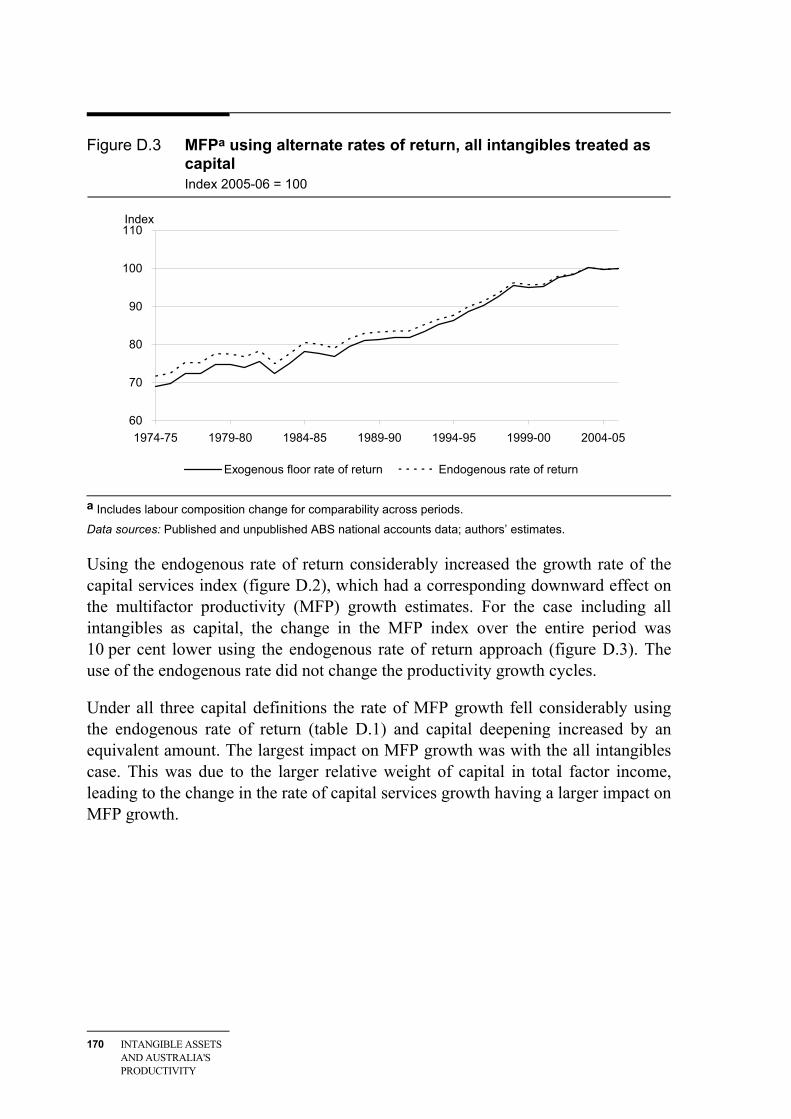
170 INTANGIBLE ASSETS AND AUSTRALIA'S PRODUCTIVITY
Figure D.3 MFPa using alternate rates of return, all intangibles treated as capital Index 2005-06 = 100
60
70
80
90
100
110
1974-75 1979-80 1984-85 1989-90 1994-95 1999-00 2004-05
Exogenous floor rate of return Endogenous rate of return
Index
a Includes labour composition change for comparability across periods.
Data sources: Published and unpublished ABS national accounts data; authors’ estimates.
Using the endogenous rate of return considerably increased the growth rate of the capital services index (figure D.2), which had a corresponding downward effect on the multifactor productivity (MFP) growth estimates. For the case including all intangibles as capital, the change in the MFP index over the entire period was 10 per cent lower using the endogenous rate of return approach (figure D.3). The use of the endogenous rate did not change the productivity growth cycles.
Under all three capital definitions the rate of MFP growth fell considerably using the endogenous rate of return (table D.1) and capital deepening increased by an equivalent amount. The largest impact on MFP growth was with the all intangibles case. This was due to the larger relative weight of capital in total factor income, leading to the change in the rate of capital services growth having a larger impact on MFP growth.

SENSITIVITY TESTING 171
Table D.1 Comparison of MFP growth ratesa using alternative rates of return Per cent per year
1974-75 – 2005-06
1974-75 – 1984-85
1984-85 – 1994-95
1994-95 – 2005-06
Including all intangibles assets
Exogenous floor 1.20 1.25 1.00 1.35
Endogenous 1.08 1.16 0.86 1.20
Including national accounts intangible assets
Exogenous floor 1.26 1.30 1.02 1.45
Endogenous 1.17 1.25 0.92 1.34
Excluding all intangible assets
Exogenous floor 1.36 1.31 1.13 1.63
Endogenous 1.31 1.26 1.09 1.55 a Includes labour composition change for comparability across periods.
Sources: Published and unpublished ABS national accounts data; authors’ estimates.
As mentioned in chapter 5, the reason for testing the results using a purely endogenous rate of return is for comparability with the other country studies. Table D.2 shows that the Australian results using an endogenous rate of return are considerably closer to the US results than those using an exogenous floor rate of return. The effect of treating all intangibles as capital (compared with no intangibles) is also closer between the two countries when using an endogenous rate, both in absolute value terms and percentages changes.
However, it should be noted that the Australian results using an endogenous rate of return may still not be directly comparable with the US results. It is not known whether CHS (2006) found any negative rates of return or made any adjustment for them — the negative rates of return in the Australian results have not been adjusted.4
4 The US Bureau of Labor Statistics methodology (as reported in Dean and Harper 2001, p. 68) is
to assume a 3.5 per cent rate of return where the endogenous rate of return is negative and deduct nothing for asset revaluation in the rental price calculation. However, this is done at the industry level and mainly affects property industries. It is not known if CHS (2006) followed this methodology at the aggregate economy level.
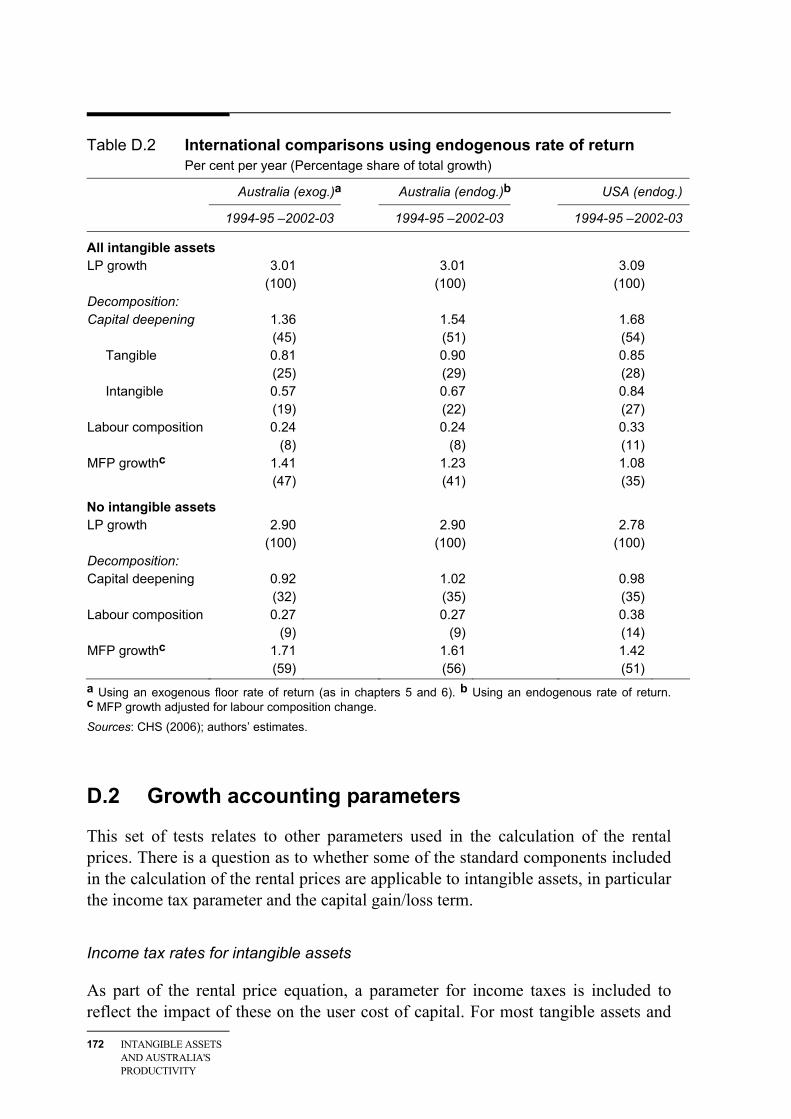
172 INTANGIBLE ASSETS AND AUSTRALIA'S PRODUCTIVITY
Table D.2 International comparisons using endogenous rate of return Per cent per year (Percentage share of total growth)
Australia (exog.)a Australia (endog.)b USA (endog.) 1994-95 –2002-03 1994-95 –2002-03 1994-95 –2002-03
All intangible assets LP growth 3.01 3.01 3.09 (100) (100) (100) Decomposition: Capital deepening 1.36 1.54 1.68
(45) (51) (54) Tangible 0.81 0.90 0.85
(25) (29) (28) Intangible 0.57 0.67 0.84 (19) (22) (27)
Labour composition 0.24 0.24 0.33 (8) (8) (11) MFP growthc 1.41 1.23 1.08 (47) (41) (35)
No intangible assets LP growth 2.90 2.90 2.78 (100) (100) (100) Decomposition: Capital deepening 0.92 1.02 0.98
(32) (35) (35) Labour composition 0.27 0.27 0.38 (9) (9) (14) MFP growthc 1.71 1.61 1.42
(59) (56) (51) a Using an exogenous floor rate of return (as in chapters 5 and 6). b Using an endogenous rate of return. c MFP growth adjusted for labour composition change.
Sources: CHS (2006); authors’ estimates.
D.2 Growth accounting parameters
This set of tests relates to other parameters used in the calculation of the rental prices. There is a question as to whether some of the standard components included in the calculation of the rental prices are applicable to intangible assets, in particular the income tax parameter and the capital gain/loss term.
Income tax rates for intangible assets
As part of the rental price equation, a parameter for income taxes is included to reflect the impact of these on the user cost of capital. For most tangible assets and
SENSITIVITY TESTING 173
intangible assets already capitalised in the national accounts, the corporate profit tax rate is used by the ABS with adjustments made for depreciation allowances and other factors (ABS 2000, paras 27.61 – 27.71). For this paper, income tax rates for the new intangible assets were assumed to be equal to the corporate income tax rate. The exception to this was business R&D, where a tax adjustment was made to compensate for the R&D tax incentive scheme.5 Because investment in intangibles is currently treated as intermediate expenditure rather than being capitalised, including a tax adjustment for intangibles might not be ideal.6 Therefore it is useful to test the results using an unity tax parameter to see what impact this could potentially have on the results.
Adjusting the income tax parameter to a neutral rate of one (no net taxes)7 for the new intangible assets marginally decreases the growth rate of the aggregate capital services index (table D.3). This has the effect of slightly reducing the impact of capitalising intangibles on MFP growth. However, there is little difference in the aggregate MFP and capital deepening results due to the small size of intangibles in total capital services growth.
Capital gain/loss term
There is a question as to whether a capital gain/loss term should be included for some intangible assets. The purpose of this function is to adjust the value of an asset to reflect holding gains. Because many intangibles are not tradeable, it could be argued that holding gains are irrelevant and therefore should not be included when estimating the rental prices.
A sensitivity test was performed by removing the capital gain/loss term from the rental price equation for the new intangible assets. The effect of removing the capital gain/loss function was a slight increase in the growth rate of capital services. As with the sensitivity test of income tax rates, the impact of this adjustment was too small to appreciably change the final growth accounting results (table D.3).
5 Including an adjustment for the R&D tax incentive scheme lowered the average tax rate on
business R&D. For more information see appendix C. 6 Under current accounting rules, corporate investment in intangibles would come from pre-tax
income, not post-tax income. The tax treatment of intangible investment is important because different tax treatments can potentially change the incentive to invest in intangibles.
7 The tax parameter for business R&D is therefore assumed to be less than one (a tax credit) due to the R&D tax concession.
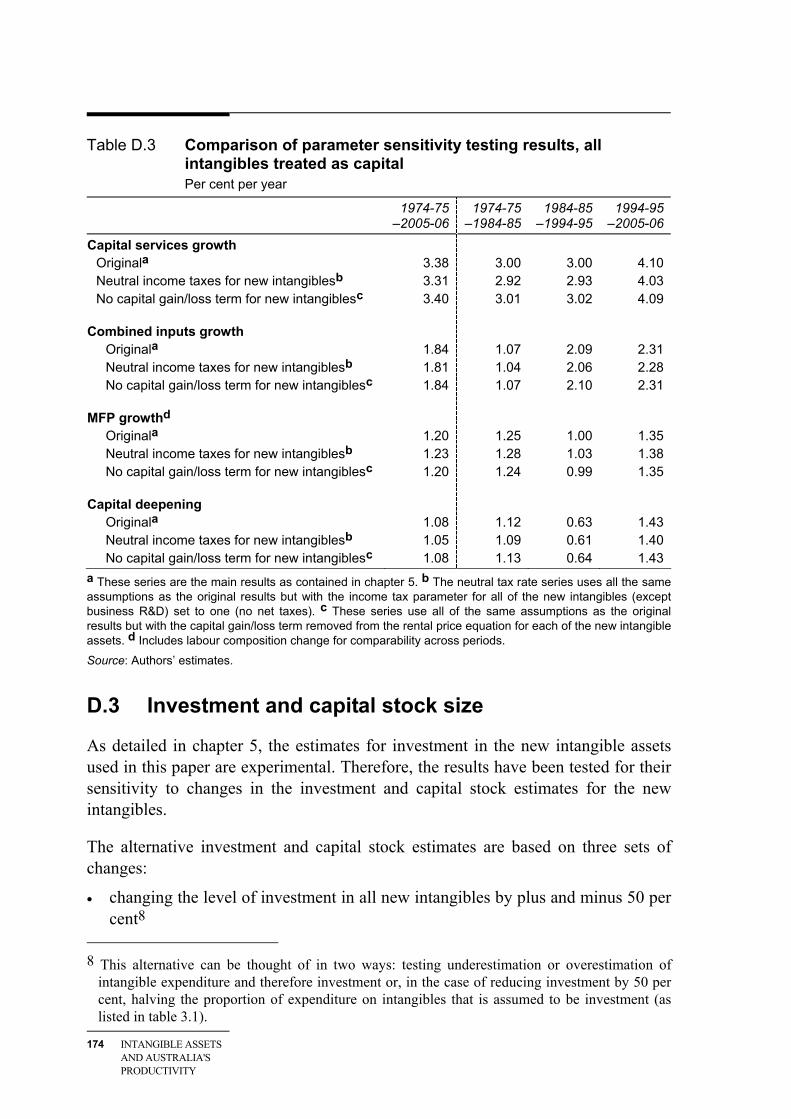
174 INTANGIBLE ASSETS AND AUSTRALIA'S PRODUCTIVITY
Table D.3 Comparison of parameter sensitivity testing results, all intangibles treated as capital Per cent per year
1974-75 –2005-06
1974-75 –1984-85
1984-85 –1994-95
1994-95 –2005-06
Capital services growth Originala 3.38 3.00 3.00 4.10 Neutral income taxes for new intangiblesb 3.31 2.92 2.93 4.03 No capital gain/loss term for new intangiblesc 3.40 3.01 3.02 4.09
Combined inputs growth
Originala 1.84 1.07 2.09 2.31 Neutral income taxes for new intangiblesb 1.81 1.04 2.06 2.28 No capital gain/loss term for new intangiblesc 1.84 1.07 2.10 2.31
MFP growthd Originala 1.20 1.25 1.00 1.35 Neutral income taxes for new intangiblesb 1.23 1.28 1.03 1.38 No capital gain/loss term for new intangiblesc 1.20 1.24 0.99 1.35
Capital deepening Originala 1.08 1.12 0.63 1.43 Neutral income taxes for new intangiblesb 1.05 1.09 0.61 1.40 No capital gain/loss term for new intangiblesc 1.08 1.13 0.64 1.43
a These series are the main results as contained in chapter 5. b The neutral tax rate series uses all the same assumptions as the original results but with the income tax parameter for all of the new intangibles (except business R&D) set to one (no net taxes). c These series use all of the same assumptions as the original results but with the capital gain/loss term removed from the rental price equation for each of the new intangible assets. d Includes labour composition change for comparability across periods.
Source: Authors’ estimates.
D.3 Investment and capital stock size
As detailed in chapter 5, the estimates for investment in the new intangible assets used in this paper are experimental. Therefore, the results have been tested for their sensitivity to changes in the investment and capital stock estimates for the new intangibles.
The alternative investment and capital stock estimates are based on three sets of changes:
• changing the level of investment in all new intangibles by plus and minus 50 per cent8
8 This alternative can be thought of in two ways: testing underestimation or overestimation of
intangible expenditure and therefore investment or, in the case of reducing investment by 50 per cent, halving the proportion of expenditure on intangibles that is assumed to be investment (as listed in table 3.1).
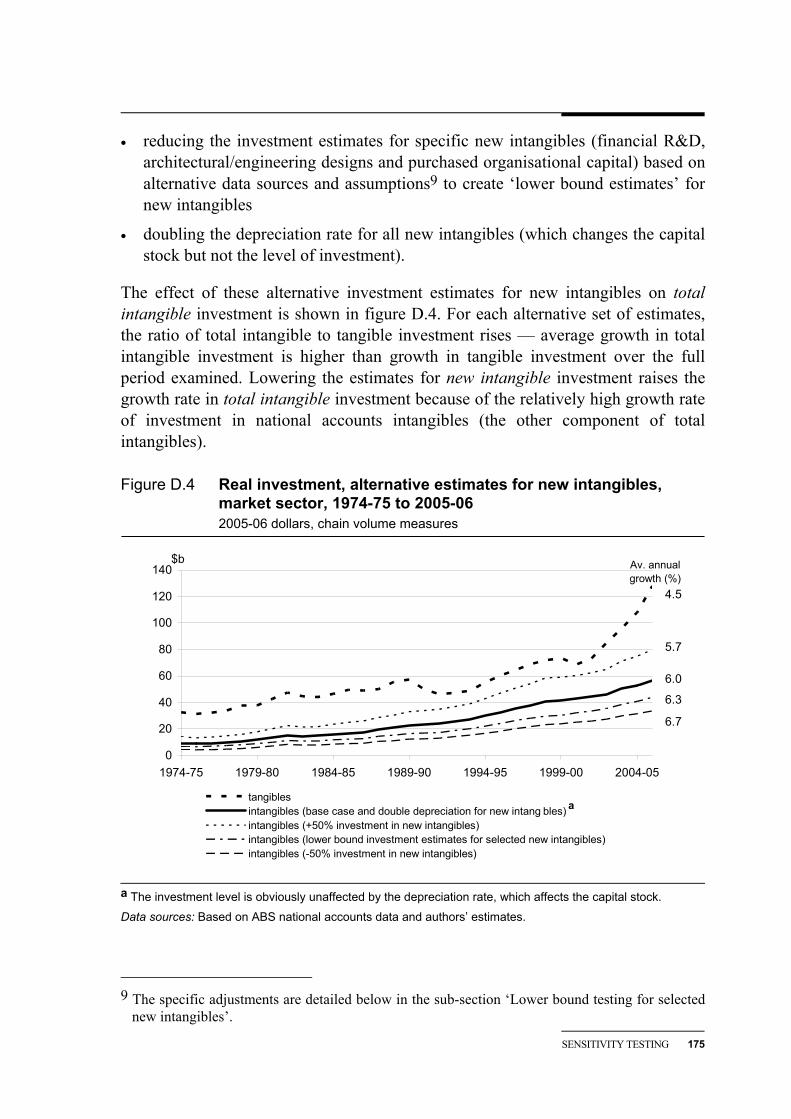
SENSITIVITY TESTING 175
• reducing the investment estimates for specific new intangibles (financial R&D, architectural/engineering designs and purchased organisational capital) based on alternative data sources and assumptions9 to create ‘lower bound estimates’ for new intangibles
• doubling the depreciation rate for all new intangibles (which changes the capital stock but not the level of investment).
The effect of these alternative investment estimates for new intangibles on total intangible investment is shown in figure D.4. For each alternative set of estimates, the ratio of total intangible to tangible investment rises — average growth in total intangible investment is higher than growth in tangible investment over the full period examined. Lowering the estimates for new intangible investment raises the growth rate in total intangible investment because of the relatively high growth rate of investment in national accounts intangibles (the other component of total intangibles).
Figure D.4 Real investment, alternative estimates for new intangibles, market sector, 1974-75 to 2005-06 2005-06 dollars, chain volume measures
0
20
40
60
80
100
120
140
1974-75 1979-80 1984-85 1989-90 1994-95 1999-00 2004-05
tangiblesintangibles (base case and double depreciation for new intang bles)intangibles (+50% investment in new intangibles)intangibles (lower bound investment estimates for selected new intangibles)intangibles (-50% investment in new intangibles)
$b Av. annual growth (%)
6.0
6.7
5.7
6.3
4.5
a
a The investment level is obviously unaffected by the depreciation rate, which affects the capital stock.
Data sources: Based on ABS national accounts data and authors’ estimates.
9 The specific adjustments are detailed below in the sub-section ‘Lower bound testing for selected
new intangibles’.
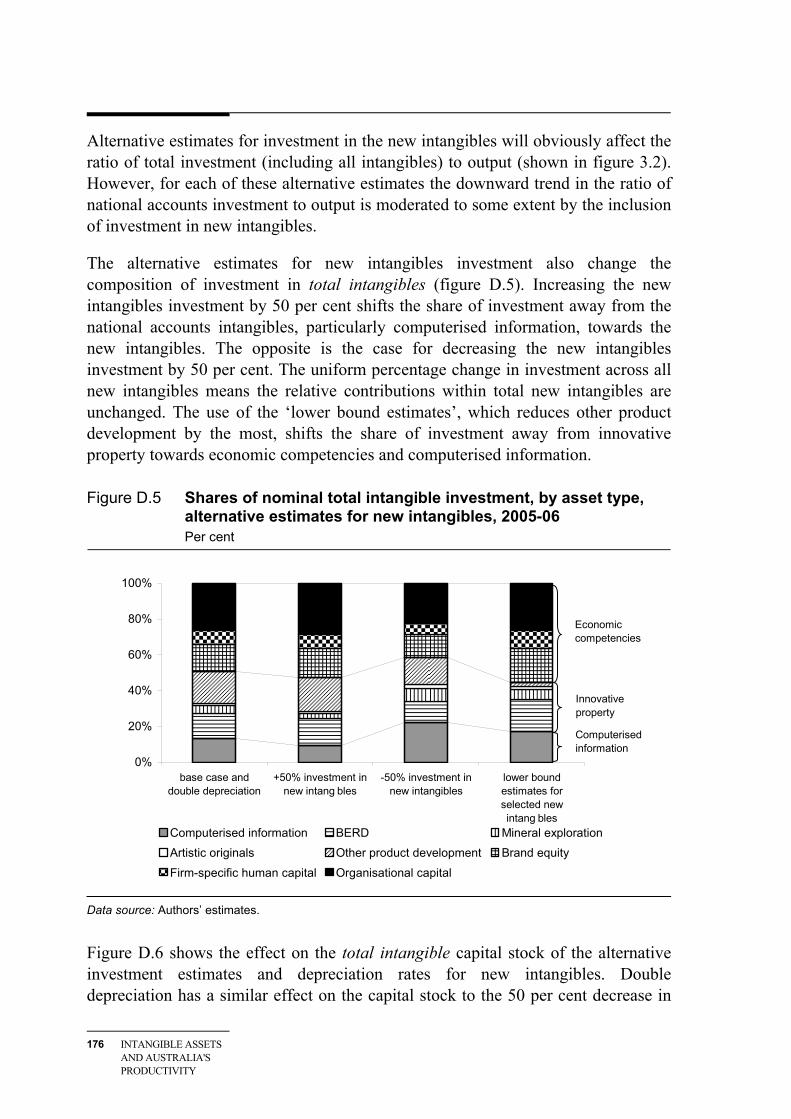
176 INTANGIBLE ASSETS AND AUSTRALIA'S PRODUCTIVITY
Alternative estimates for investment in the new intangibles will obviously affect the ratio of total investment (including all intangibles) to output (shown in figure 3.2). However, for each of these alternative estimates the downward trend in the ratio of national accounts investment to output is moderated to some extent by the inclusion of investment in new intangibles.
The alternative estimates for new intangibles investment also change the composition of investment in total intangibles (figure D.5). Increasing the new intangibles investment by 50 per cent shifts the share of investment away from the national accounts intangibles, particularly computerised information, towards the new intangibles. The opposite is the case for decreasing the new intangibles investment by 50 per cent. The uniform percentage change in investment across all new intangibles means the relative contributions within total new intangibles are unchanged. The use of the ‘lower bound estimates’, which reduces other product development by the most, shifts the share of investment away from innovative property towards economic competencies and computerised information.
Figure D.5 Shares of nominal total intangible investment, by asset type, alternative estimates for new intangibles, 2005-06 Per cent
0%
20%
40%
60%
80%
100%
base case anddouble depreciation
+50% investment innew intang bles
-50% investment innew intangibles
lower boundestimates forselected newintang bles
Computerised information BERD Mineral exploration
Artistic originals Other product development Brand equity
Firm-specific human capital Organisational capital
Economic competencies
Computerised information
Innovative property
Data source: Authors’ estimates.
Figure D.6 shows the effect on the total intangible capital stock of the alternative investment estimates and depreciation rates for new intangibles. Double depreciation has a similar effect on the capital stock to the 50 per cent decrease in
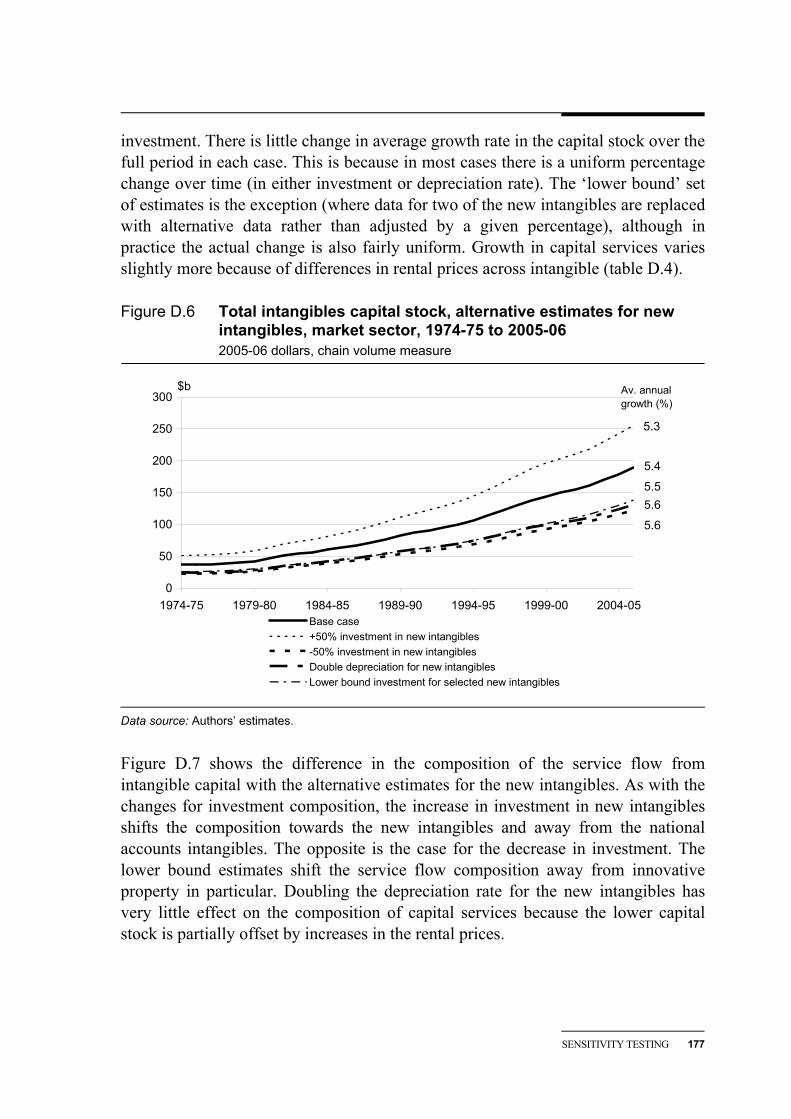
SENSITIVITY TESTING 177
investment. There is little change in average growth rate in the capital stock over the full period in each case. This is because in most cases there is a uniform percentage change over time (in either investment or depreciation rate). The ‘lower bound’ set of estimates is the exception (where data for two of the new intangibles are replaced with alternative data rather than adjusted by a given percentage), although in practice the actual change is also fairly uniform. Growth in capital services varies slightly more because of differences in rental prices across intangible (table D.4).
Figure D.6 Total intangibles capital stock, alternative estimates for new intangibles, market sector, 1974-75 to 2005-06 2005-06 dollars, chain volume measure
0
50
100
150
200
250
300
1974-75 1979-80 1984-85 1989-90 1994-95 1999-00 2004-05Base case+50% investment in new intangibles-50% investment in new intangiblesDouble depreciation for new intangiblesLower bound investment for selected new intangibles
$b Av. annual growth (%)
5.4
5.3
5.65.5
5.6
Data source: Authors’ estimates.
Figure D.7 shows the difference in the composition of the service flow from intangible capital with the alternative estimates for the new intangibles. As with the changes for investment composition, the increase in investment in new intangibles shifts the composition towards the new intangibles and away from the national accounts intangibles. The opposite is the case for the decrease in investment. The lower bound estimates shift the service flow composition away from innovative property in particular. Doubling the depreciation rate for the new intangibles has very little effect on the composition of capital services because the lower capital stock is partially offset by increases in the rental prices.
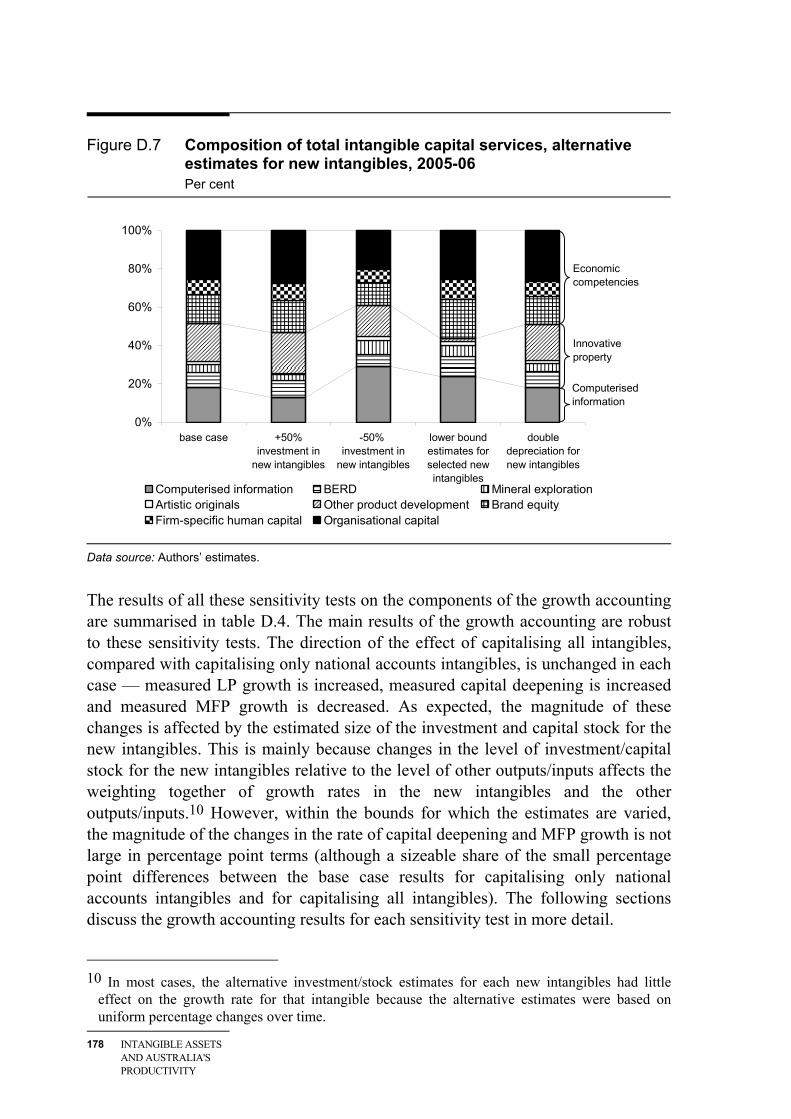
178 INTANGIBLE ASSETS AND AUSTRALIA'S PRODUCTIVITY
Figure D.7 Composition of total intangible capital services, alternative estimates for new intangibles, 2005-06 Per cent
0%
20%
40%
60%
80%
100%
base case +50%investment in
new intangibles
-50% investment in
new intangibles
lower boundestimates forselected newintangibles
doubledepreciation fornew intangibles
Computerised information BERD Mineral explorationArtistic originals Other product development Brand equityFirm-specific human capital Organisational capital
Economic competencies
Innovative property
Computerised information
Data source: Authors’ estimates.
The results of all these sensitivity tests on the components of the growth accounting are summarised in table D.4. The main results of the growth accounting are robust to these sensitivity tests. The direction of the effect of capitalising all intangibles, compared with capitalising only national accounts intangibles, is unchanged in each case — measured LP growth is increased, measured capital deepening is increased and measured MFP growth is decreased. As expected, the magnitude of these changes is affected by the estimated size of the investment and capital stock for the new intangibles. This is mainly because changes in the level of investment/capital stock for the new intangibles relative to the level of other outputs/inputs affects the weighting together of growth rates in the new intangibles and the other outputs/inputs.10 However, within the bounds for which the estimates are varied, the magnitude of the changes in the rate of capital deepening and MFP growth is not large in percentage point terms (although a sizeable share of the small percentage point differences between the base case results for capitalising only national accounts intangibles and for capitalising all intangibles). The following sections discuss the growth accounting results for each sensitivity test in more detail.
10 In most cases, the alternative investment/stock estimates for each new intangibles had little
effect on the growth rate for that intangible because the alternative estimates were based on uniform percentage changes over time.
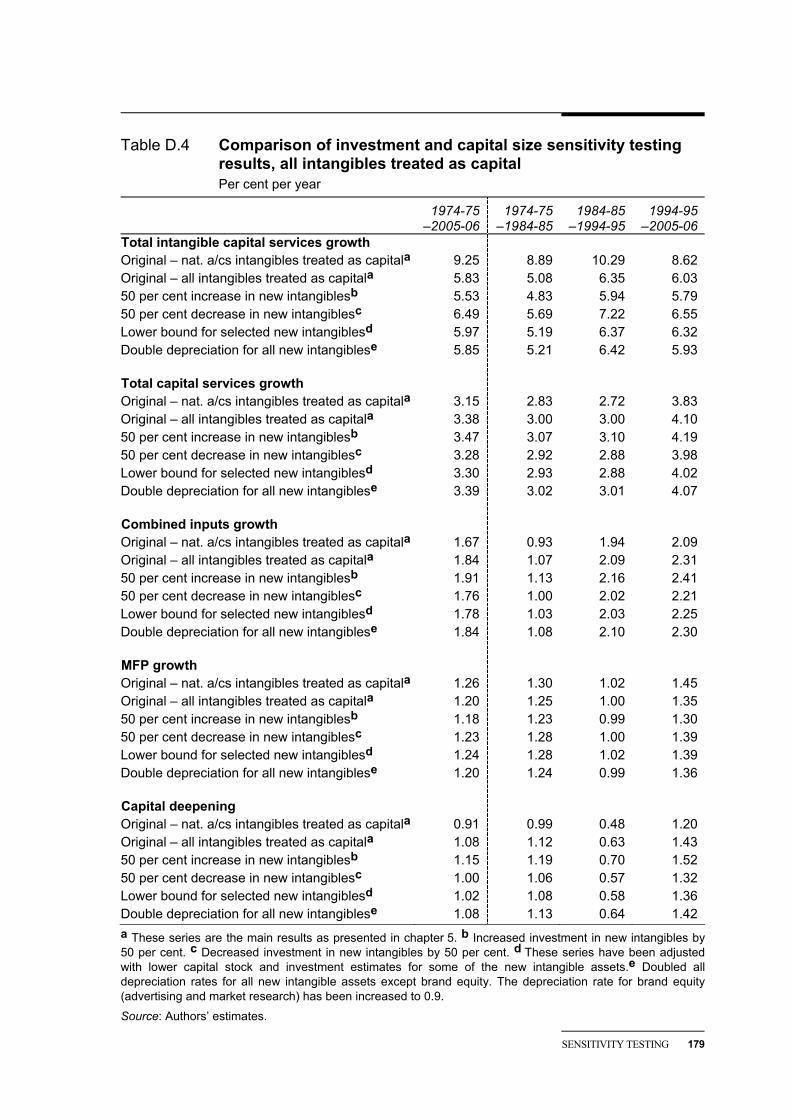
SENSITIVITY TESTING 179
Table D.4 Comparison of investment and capital size sensitivity testing results, all intangibles treated as capital Per cent per year
1974-75 –2005-06
1974-75 –1984-85
1984-85 –1994-95
1994-95 –2005-06
Total intangible capital services growth Original – nat. a/cs intangibles treated as capitala 9.25 8.89 10.29 8.62 Original – all intangibles treated as capitala 5.83 5.08 6.35 6.03 50 per cent increase in new intangiblesb 5.53 4.83 5.94 5.79 50 per cent decrease in new intangiblesc 6.49 5.69 7.22 6.55 Lower bound for selected new intangiblesd 5.97 5.19 6.37 6.32 Double depreciation for all new intangiblese 5.85 5.21 6.42 5.93
Total capital services growth Original – nat. a/cs intangibles treated as capitala 3.15 2.83 2.72 3.83 Original – all intangibles treated as capitala 3.38 3.00 3.00 4.10 50 per cent increase in new intangiblesb 3.47 3.07 3.10 4.19 50 per cent decrease in new intangiblesc 3.28 2.92 2.88 3.98 Lower bound for selected new intangiblesd 3.30 2.93 2.88 4.02 Double depreciation for all new intangiblese 3.39 3.02 3.01 4.07
Combined inputs growth Original – nat. a/cs intangibles treated as capitala 1.67 0.93 1.94 2.09 Original – all intangibles treated as capitala 1.84 1.07 2.09 2.31 50 per cent increase in new intangiblesb 1.91 1.13 2.16 2.41 50 per cent decrease in new intangiblesc 1.76 1.00 2.02 2.21 Lower bound for selected new intangiblesd 1.78 1.03 2.03 2.25 Double depreciation for all new intangiblese 1.84 1.08 2.10 2.30
MFP growth Original – nat. a/cs intangibles treated as capitala 1.26 1.30 1.02 1.45 Original – all intangibles treated as capitala 1.20 1.25 1.00 1.35 50 per cent increase in new intangiblesb 1.18 1.23 0.99 1.30 50 per cent decrease in new intangiblesc 1.23 1.28 1.00 1.39 Lower bound for selected new intangiblesd 1.24 1.28 1.02 1.39 Double depreciation for all new intangiblese 1.20 1.24 0.99 1.36
Capital deepening Original – nat. a/cs intangibles treated as capitala 0.91 0.99 0.48 1.20 Original – all intangibles treated as capitala 1.08 1.12 0.63 1.43 50 per cent increase in new intangiblesb 1.15 1.19 0.70 1.52 50 per cent decrease in new intangiblesc 1.00 1.06 0.57 1.32 Lower bound for selected new intangiblesd 1.02 1.08 0.58 1.36 Double depreciation for all new intangiblese 1.08 1.13 0.64 1.42 a These series are the main results as presented in chapter 5. b Increased investment in new intangibles by 50 per cent. c Decreased investment in new intangibles by 50 per cent. d These series have been adjusted with lower capital stock and investment estimates for some of the new intangible assets.e Doubled all depreciation rates for all new intangible assets except brand equity. The depreciation rate for brand equity (advertising and market research) has been increased to 0.9.
Source: Authors’ estimates.
180 INTANGIBLE ASSETS AND AUSTRALIA'S PRODUCTIVITY
Lower bound testing for selected new intangibles
The specific variations for the lower bound estimates are:
• for financial product development, the CHS-based estimate of 20 per cent of intermediate usage of the Finance industry is replaced by financial services R&D from the ABS survey of business expenditure on R&D
• for architectural and engineering designs, it is assumed that all relevant expenditure is already capitalised as part of the associated tangible assets so no additional investment is included
• for purchased organisational capital, the proportion of the business management services industry that is included is reduced from 77 per cent (which was to exclude public relations) to 50 per cent (which aims to also exclude some other services that may not be within the scope of the CHS variable). Investment is still assumed to be 80 per cent of this reduced expenditure.
These changes all reduce the size of total new intangibles investment — the degree to which investment is reduced varies by type of intangible and over time.
• Total nominal investment in new intangibles is reduced by around a quarter (25 per cent in 1974-75 up to 28 per cent in 2005-06).
• Financial product development investment is reduced by an average of around 93 per cent (a range of 98 to 83 per cent between 1974-75 and 2005-06).
• Architectural and engineering designs investment (as separately identified) is reduced by 100 per cent in each year (to zero). The amount of expenditure already capitalised by the ABS as part of associated tangible assets cannot be separately identified.
• Purchased organisational capital is reduced by 35 per cent in each year (since it is a fixed percentage adjustment made in each year).
Incorporating these lower bound estimates into the growth accounting affects the MFP growth results by a small amount (table D.5). Compared with the original all intangibles case, the rate of MFP growth falls from 1.36 per cent a year when excluding all intangible assets, to 1.24 per cent a year rather than 1.20 per cent (a 3 per cent difference).
The change in MFP growth is small for two reasons:
• the intangible investment series that are changed contribute only a small percentage of total investment and capital services growth
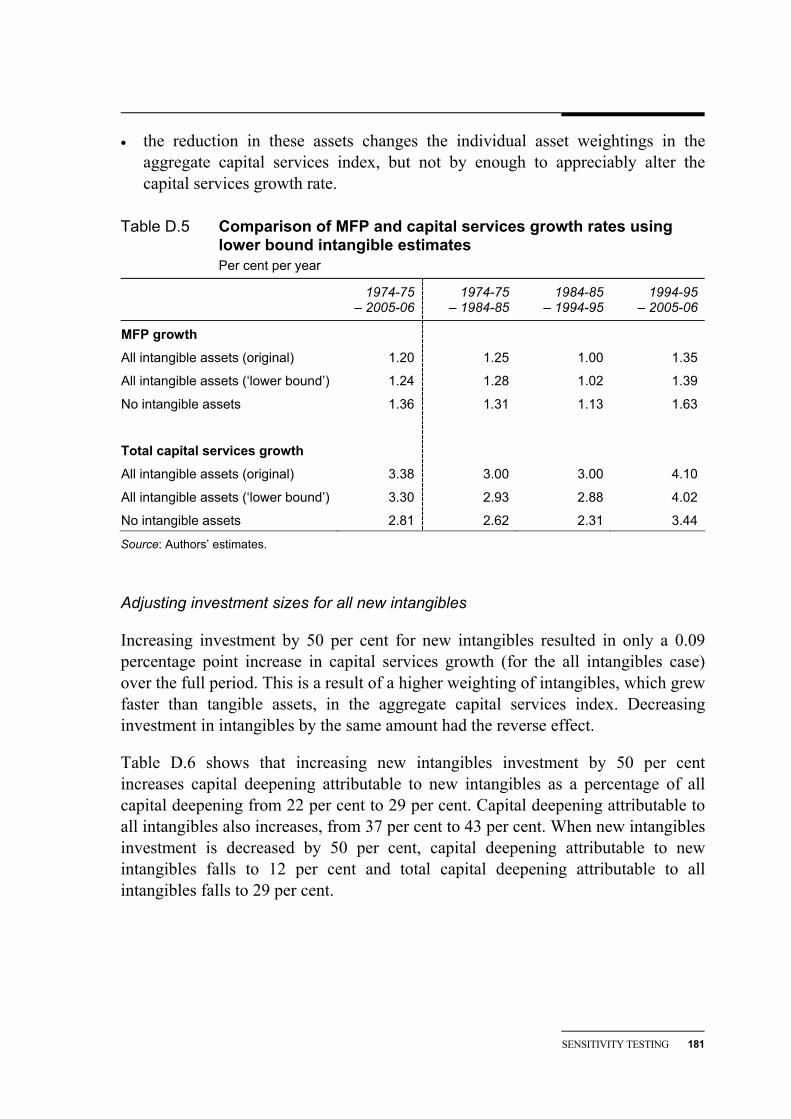
SENSITIVITY TESTING 181
• the reduction in these assets changes the individual asset weightings in the aggregate capital services index, but not by enough to appreciably alter the capital services growth rate.
Table D.5 Comparison of MFP and capital services growth rates using lower bound intangible estimates Per cent per year
1974-75 – 2005-06
1974-75 – 1984-85
1984-85 – 1994-95
1994-95 – 2005-06
MFP growth
All intangible assets (original) 1.20 1.25 1.00 1.35
All intangible assets (‘lower bound’) 1.24 1.28 1.02 1.39
No intangible assets 1.36 1.31 1.13 1.63
Total capital services growth
All intangible assets (original) 3.38 3.00 3.00 4.10
All intangible assets (‘lower bound’) 3.30 2.93 2.88 4.02
No intangible assets 2.81 2.62 2.31 3.44
Source: Authors’ estimates.
Adjusting investment sizes for all new intangibles
Increasing investment by 50 per cent for new intangibles resulted in only a 0.09 percentage point increase in capital services growth (for the all intangibles case) over the full period. This is a result of a higher weighting of intangibles, which grew faster than tangible assets, in the aggregate capital services index. Decreasing investment in intangibles by the same amount had the reverse effect.
Table D.6 shows that increasing new intangibles investment by 50 per cent increases capital deepening attributable to new intangibles as a percentage of all capital deepening from 22 per cent to 29 per cent. Capital deepening attributable to all intangibles also increases, from 37 per cent to 43 per cent. When new intangibles investment is decreased by 50 per cent, capital deepening attributable to new intangibles falls to 12 per cent and total capital deepening attributable to all intangibles falls to 29 per cent.
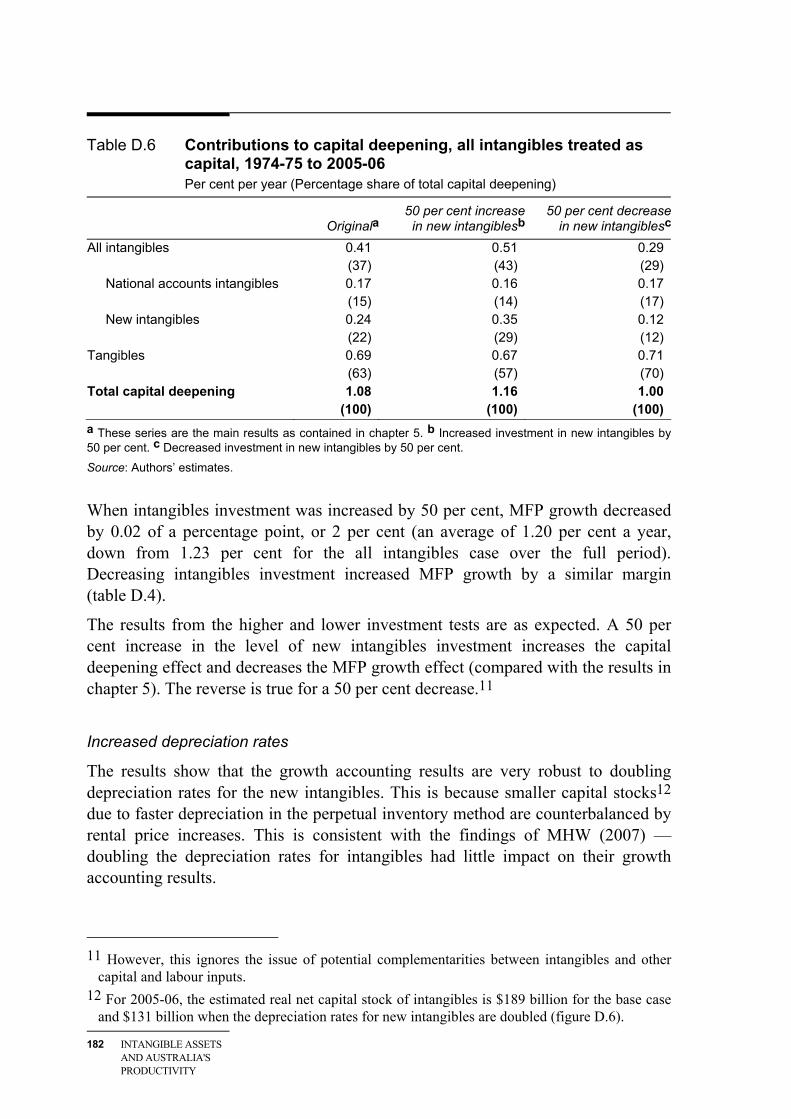
182 INTANGIBLE ASSETS AND AUSTRALIA'S PRODUCTIVITY
Table D.6 Contributions to capital deepening, all intangibles treated as capital, 1974-75 to 2005-06 Per cent per year (Percentage share of total capital deepening)
Originala
50 per cent increase in new intangiblesb
50 per cent decrease in new intangiblesc
All intangibles 0.41 0.51 0.29 (37) (43) (29)
National accounts intangibles 0.17 0.16 0.17 (15) (14) (17)
New intangibles 0.24 0.35 0.12 (22) (29) (12) Tangibles 0.69 0.67 0.71 (63) (57) (70) Total capital deepening 1.08 1.16 1.00 (100) (100) (100) a These series are the main results as contained in chapter 5. b Increased investment in new intangibles by 50 per cent. c Decreased investment in new intangibles by 50 per cent.
Source: Authors’ estimates.
When intangibles investment was increased by 50 per cent, MFP growth decreased by 0.02 of a percentage point, or 2 per cent (an average of 1.20 per cent a year, down from 1.23 per cent for the all intangibles case over the full period). Decreasing intangibles investment increased MFP growth by a similar margin (table D.4).
The results from the higher and lower investment tests are as expected. A 50 per cent increase in the level of new intangibles investment increases the capital deepening effect and decreases the MFP growth effect (compared with the results in chapter 5). The reverse is true for a 50 per cent decrease.11
Increased depreciation rates
The results show that the growth accounting results are very robust to doubling depreciation rates for the new intangibles. This is because smaller capital stocks12 due to faster depreciation in the perpetual inventory method are counterbalanced by rental price increases. This is consistent with the findings of MHW (2007) — doubling the depreciation rates for intangibles had little impact on their growth accounting results.
11 However, this ignores the issue of potential complementarities between intangibles and other
capital and labour inputs. 12 For 2005-06, the estimated real net capital stock of intangibles is $189 billion for the base case
and $131 billion when the depreciation rates for new intangibles are doubled (figure D.6).
REFERENCES 183
References
ABS (Australian Bureau of Statistics) 2000, Australian System of National Accounts: Sources, Concepts and Methods, Cat. no. 5216.0, ABS, Canberra.
—— 2001, Australian National Accounts: National Income, Expenditure and Product, Cat. no. 5206.0, September Quarter, ABS, Canberra.
—— 2005, Quality-adjusted Labour Inputs, Cat. no. 1351.0.55.010, ABS, Canberra.
—— 2007, Experimental Estimates of Industry Multifactor Productivity, Australia, 2007, ABS Information Paper, Cat. no. 5260.0.55.001, ABS, Canberra.
Advertising Association 2005, ‘Advertising Association publishes Advertising Statistics Yearbook 2005’, News Release, 8 July, http://www.adassoc.org.uk/ News_Release_080705.pdf (accessed 1 July 2008).
Allen, R. 1990, ‘Big six take lead in a billion-dollar market’, Business Review Weekly, 20 July, pp. 84–6.
Aspden, C. 2007, ‘The revision of the 1993 System of National Accounts. What does it change?’, Statistics Brief, no. 13, OECD, Paris.
Australian Government 2008a, Science and Innovation Budget Statements 2001-2008, Canberra http://www.dest.gov.au/sectors/science_innovation/publications_ resources/indexes/previous_budget_tables.htm (accessed 12 June 2008).
—— 2008b, Science and Technology Budget Statements 1985-2001, Canberra http://www.dest.gov.au/sectors/science_innovation/publications_ resources/indexes/previous_budget_tables.htm (accessed 12 June 2008).
BEA (Bureau of Economic Analysis) 2008, National Income and Product Accounts, Table 1.3.5 Gross Value Added by Sector, 27 March 2007 release, http://www.bea.gov/national/nipaweb (accessed 14 April 2008).
Belhocine, N. 2008, Treating Intangible Inputs as Investment Goods: The Impact on Canadian GDP, Paper presented to the 2008 World Congress on National Accounts and Economic Performance Measures of nations, May 12-17, Arlington, Virginia, http://www. indexmeasues.com/dc2008/papers/ Nazim%30Belhocine%20-%20Intangible%20Exp%20Approach.pdf (accessed 13 November 2008).
184 INTANGIBLE ASSETS AND AUSTRALIA'S PRODUCTIVITY
BLS (Bureau of Labor Statistics) 2008, Occupational Employment and Wages, May 2006, http://www.bls.gov./oes/oes_pub_2006.htm (accessed 21 August 2008).
Borland, J. 1990, ‘Worker training’, The Australian Economic Review, 4th Quarter, pp. 74–80.
Bosworth, D. and Webster, E. (eds) 2006, The Management of Intellectual Property, Edward Elgar, Cheltenham.
Brynjolfsson, E. and Yang, S. 1999, The Intangible Costs and Benefits of Computer Investments: Evidence from the Financial Markets, Proceeding of the International Conference on Information Systems, Atlanta, Georgia, December 1997, revised May 1999, http://ebusiness.mit.edu/erik/ITQ00-11-25.pdf (accessed 25 March 2008).
——, Hitt, L.M. and Yang, S. 2000, Intangible Assets: How the Interaction of Computers and Organizational Structure affects Stock Market Valuations, MIT Working Paper, Massachusetts Institute of Technology, Massachusetts.
——, —— and —— 2002, Intangible Assets: Computers and Organizational Capital, Center for eBusiness@MIT, Paper 138, Massachusetts Institute of Technology, Massachusetts.
CEASA (Commercial Economic Advisory Service of Australia) 2003, Advertising Expenditure in Main Media and Australia 1960-2002, CEASA, Sydney.
—— 2006, Advertising Expenditure in Main Media, Year ended 31 December, 2005, CEASA, Sydney.
—— 2007, Advertising Expenditure in Main Media, Year ended 31 December, 2006, CEASA, Sydney.
CHS (Corrado, C., Hulten, C. and Sichel, D.) 2005, ‘Measuring capital and technology: An expanded framework’, in Corrado, C., Haltiwanger, J. and Sichel, D. (eds), Measuring Capital in the New Economy, Studies in Income and Wealth, vol. 65, The University of Chicago Press, Chicago, pp. 11–41.
—— 2006, Intangible Capital and Economic Growth, NBER Working Paper No. 11948, National Bureau of Economic Research, Cambridge, Massachusetts.
Cully, M. 2005, Employer-provided Training: Findings from Case Studies, National Centre for Vocational Education Research, Adelaide.
Cummins, J. 2005, ‘A new approach to the valuation of intangible capital’ in Corrado, C., Haltiwanger, J. and Sichel, D. (eds), Measuring Capital in the New Economy, Studies in Income and Wealth, vol. 65, National Bureau of Economic Research, Chicago, pp. 47–72.
REFERENCES 185
Curtain, R., Krbavac, L. and Stretton, A. 1986, Skill formation in Australia: In search of a research agenda, Paper presented to the Workshop on Skills Formation, Bureau of Labour Market Research and the National Training Council.
De, S. and Dutta, D. 2007, ‘Impact of intangible capital on productivity and growth: Lessons from the Indian information technology software industry’, Economic Record, vol. 83, Special Issue, pp. S73–86.
Dean, E.R. and Harper, M.J. 2001, ‘The BLS Productivity Measurement Program’, in Hulten, C.R., Dean, E.R. and Harper, M.J. (eds), New Developments in Productivity Analysis, National Bureau of Economic Research, Studies in Income and Wealth, vol. 63, University of Chicago Press, Chicago, pp. 55–84.
Dolman, B., Parham, D. and Zheng, S. 2007, Can Australia Match US Productivity Performance, Staff Working Paper, Productivity Commission, Canberra.
EU KLEMS 2008, EU KLEMS Database March 2008, see Timmer, M., O'Mahony, M. and van Ark, B., The EU KLEMS Growth and Productivity Accounts: An Overview, University of Groningen and University of Birmingham, http://www.euklems.net (accessed 23 July 2008).
Fukao, K., Hamagata, S., Miyagawa, T. and Tonogi, K. 2007, Intangible Investment in Japan: Measurement and Contribution to Economic Growth, Discussion Paper 07-E-034, Research Institute of Economy, Trade, and Industry, Tokyo.
——, Inui, T., Kawai, H. and Miyagawa, T. 2003, Sectoral Productivity and Economic Growth in Japan, 1970–1998: An Empirical Analysis Based on the JIP Database, ESRI Discussion Paper no. 67, Economic and Social Research Institute, Cabinet Office, Tokyo.
——, Miyagawa, T., Mukai, K., Shinoda, Y. and Tonogi, K. 2008a, Intangible investment in Japan: New estimates and contribution to economic growth, Presentation to the National Academies Conference on Intangible Assets: Measuring and Enhancing their Contribution to Corporate Value and Economic Growth, Washington DC, June 23.
——, ——, ——, —— and —— 2008b, Intangible Investment in Japan: New Estimates and Contribution to Economic Growth, Revised version of Discussion Paper 07-E-034, Research Institute of Economy, Trade, and Industry, Tokyo, July.
Giorgio Marrano, M., Haskel, J. and Wallis, G. 2007, Intangible Investment and Britain’s Productivity, Treasury Economic Working Paper No. 1, HM Treasury, London.
186 INTANGIBLE ASSETS AND AUSTRALIA'S PRODUCTIVITY
Gowen, B. 1999, Developing an industry profile for management consulting in Australia, Research Project for Institute of Management Consultants, http://www.management-consultants.com.au/htm/publications-profile.asp (accessed 18 September 2007).
Gretton, P., Gali, J. and Parham, D. 2003, The Effects of ICTs and Complementary Innovations on Australian Productivity Growth, Productivity Commission Staff Working Paper, Canberra.
Hamilton, C. and Denniss, R. 2000, Tracking Well-being in Australia: The Genuine Progress Indicator 2000, The Australia Institute Discussion Paper no. 35, The Australia Institute, Canberra.
Hao, J., Manole, V. and van Ark, B 2008, Intangible Capital and Growth — An International Comparison, Economics Program Working Paper Series, EPWP #08 - 14, The Conference Board, New York, December.
Healy, T. 2005, In Each Other’s Shadow. What has been the Impact of Human and Social Capital on Life Satisfaction in Ireland? Phd Thesis, Department of Sociology, Faculty of Human Sciences, University College Dublin, National University of Ireland, http://www.socialcapitalgateway.org/ Final%20TH%20PhD%209%20Feb.pdf (accessed 28 July 2008).
Hulten, C. and Hao, J. 2008, Intangible Capital and the “Market to Book Value” Puzzle, Economics Program Working Paper Series, EPWP #08 - 02, The Conference Board, New York, June.
Hunter, L.C., Webster, E., and Wyatt, A. 2005, Measuring Intangible Capital, Melbourne Institute Working Paper No. 15/05, University of Melbourne, Melbourne.
JAA (Jalava, J., Aulin-Ahmavaara, P. and Alanen, A.) 2007, Intangible Capital in the Finnish Business Sector, 1975-2005, ETLA Discussion paper No. 1103, The Research Institute of the Finnish Economy, Helsinki.
Kitay, J. and Wright, C. 1999, ‘An unexplored relationship: Australian management consulting and the management of human resources’, Asia Pacific Journal of Human Resources, vol. 37, no. 3, pp. 1–17.
—— and —— 2003, ‘Expertise and organizational boundaries: The varying roles of Australian management consultants’, Asia Pacific Business Review, vol. 9, no. 3, pp. 21–40.
Kneller, R. and Young, G. 2001, ‘The new British economy’, National Institute Economic Review, vol. 177, pp. 70–84.
Lev, B. 2001, Intangibles: Management, Measurement, and Reporting, Brookings Institution Press, Washington DC.
REFERENCES 187
—— and Radhakrishnan, S. 2005, ‘The valuation of organizational capital’ in Corrado, C., Haltiwanger, J. and Sichel, D. (eds), Measuring Capital in the New Economy, Studies in Income and Wealth, vol. 65, National Bureau of Economic Research, Chicago, pp. 73–110.
Long, M. 2002, What is Happening to Training? What the ABS Training Surveys Tell Us, Working Paper No. 41, Centre for the Economics of Education and Training, Monash University, Melbourne.
MH (Marrano, M.G. and Haskel, J.) 2006, How Much does the UK Invest in Intangible Assets?, Department of Economics Working Paper No. 578, Queen Mary, University of London, London.
MHW (Marrano, M.G., Haskel, J. and Wallis, G.) 2007, What Happened to the Knowledge Economy? ICT, Intangible Investment and Britain’s Productivity Record Revisited, Department of Economics Working Paper No. 603, Queen Mary, University of London, London.
McGrattan, E.R. and Prescott, E.C. 2005, ‘Taxes, regulations, and the value of U.S. and U.K. corporations’, Review of Economic Studies, vol. 72, pp. 767–96.
Mortenson, J. 2000, ‘Intellectual capital: Economic theory and analysis’, in Buigues, P., Jacquemin, A. and Marchipont, J-F. (eds), Competitiveness and the Value of Intangible Assets, Edward Elgar, Cheltenham, pp. 3–16.
Nakamura, L. 1999, ‘Intangibles: What put the New in the New Economy?’, Federal Reserve Bank of Philadelphia Business Review, July/August, pp. 3–16.
—— 2001, What is the US Gross Investment in Intangibles? (At Least) One Trillion Dollars A Year!, Federal Reserve Bank of Philadelphia Working Paper 01-15, Philadelphia.
NCETS (National Centre for Education and Training Statistics) 2004, ‘Deriving alternative measures for training investment’, Paper presented to the Education and Training Statistics Advisory Group, 18 June.
OECD (Organisation for Economic Cooperation and Development) 2001, Measuring Capital: Manual on the Measurement of Capital Stocks, Consumption of Fixed Capital and Capital Services, OECD, Paris.
—— 2002, Frascati Manual: Proposed Standard Practice for Surveys on Research and Experimental Development, OECD, Paris.
—— 2003, ICT and Economic Growth: Evidence for OECD Countries, Industries and Firms, OECD, Paris.
ONS (Office of National Statistics) 2006, Market Sector and Non-market Sector Activity 1992-2004, Extract taken from United Kingdom Input-Output Analyses, 2006 Edition, ONS, London.
188 INTANGIBLE ASSETS AND AUSTRALIA'S PRODUCTIVITY
PC (Productivity Commission) 2007, Public Support for Science and Innovation, Research Report, Productivity Commission, Canberra.
Pilat, D. 2007, Measuring innovation and intangible assets, Presentation to the Global Innovation Ecosystem Workshop, Tokyo, 30 June, http://www.gies2007.com/en/workshop/materials/ppt/session4/Pilat_ppt.pdf (accessed 18 September 2007).
RBA (Reserve Bank of Australia) 2008, Australian Economic Statistics 1949–50 to 1996–97, Occasional Paper No. 8, Table 4-18, http://www.rba.gov.au/Statistics/OP8ExcelFiles/4-18.xls (accessed 7 July 2008).
RBT (Rooijen-Horsten, M. van, Bergen, D. van den and Tanriseven, M.) 2008, Intangible Capital in the Netherlands: A Benchmark, Discussion Paper No. 08001, Statistics Netherlands, Voorburg.
Richardson, S. 2004, Employers’ Contribution to Training, National Centre for Vocational Education Research, Adelaide.
Rooijen-Horsten, M. van, Bergen, D. van den, Haan, M. de, Klinkers, A. and Tanriseven, M. 2008, Intangible Capital in the Netherlands: Measurement and Contribution to Economic Growth, Discussion Paper No. 08016, Statistics Netherlands, The Hague.
Schreyer, P. 2007, ‘Old and new asset boundaries: A review article on Measuring Capital in the New Economy’, International Productivity Monitor, No. 15, pp. 77–82.
Shanks, S. and Zheng, S. 2006, Econometric Modelling of R&D and Australia’s Productivity, Productivity Commission Staff Working Paper, Canberra.
Sichel, D. 2008, ‘Intangible capital’, in Durlauf, S.N. and Blume, L.E. (eds), The New Palgrave Dictionary of Economics, 2nd edition, Palgrave Macmillan, http://www.dictionaryofeconomics.com/article?id=pde2008_I000299 (accessed 20 March, 2008).
Smith, A. 1999, ‘Training and development in Australia’, International Journal of Training and Development, vol. 3, no. 4, pp. 301–13.
Solow, R. 1957, ‘Technical change and the aggregate production function’, Review of Economics and Statistics, vol. 39, no. 3, pp. 312–20.
Statistics Canada 2007, Table 379-0027-GDP at basic prices by North American Industry Classification System, http://cansim2.statcan.ca (accessed 18 November 2008).
—— 2008, GDP, income based, www40.statcan.ca/101/cst01/econ03.htm (accessed 13 November 2008).
REFERENCES 189
Statistics Finland 2008, Annual National Accounts database, http://pxweb2.stat.fi/ database/StatFin/kan/vtp/vtp_en.asp (accessed 10 July 2008).
Stromback, C.T. and Moy, P.J. 1989, ‘Industry training: The emerging myth’, Labour Economics and Productivity, vol. 1, pp. 111–22.
Universal McCann 2007, Insider’s report — Robert Coen presentation on advertising expenditure June 2007, http:// www.McCann.com/news/pdfs/ insiders6-07.pdf (accessed 3 October 2007).
Vickery, G. 2000, ‘Accounting for intangibles: Issues and prospects’, in Buigues, P., Jacquemin, A. and Marchipont, J-F. (eds), Competitiveness and the Value of Intangible Assets, Edward Elgar, Cheltenham, pp. 72–99.
Webster, E. 1999, The Economics of Intangible Investment, Edward Elgar, Cheltenham.
—— 2000, ‘The growth of intangible enterprise investment in Australia’, Information Economics and Policy, vol. 12, pp. 1–25.
—— and Jensen, P. 2006 ‘ Investment in intangible capital: An enterprise perspective’, The Economic Record, vol. 82, no. 256, pp. 82–96.
Wei, H. 2008, Measuring Human Capital Flows for Australia: A Lifetime Labour Income Approach, ABS Research Paper, Cat. no. 1351.0.55.023, Australian Bureau of Statistics, Canberra.
Wooldridge, A. 1997, ‘The advice business’, The Economist, 22 March, pp. S3–5.
World Bank 2006, Where is the Wealth of Nations? Measuring Capital for the 21st Century, World Bank, Washington DC.
Wright, C. 2000, ‘From shop floor to boardroom: The historical evolution of Australian management consulting, 1940s to 1980s’, Business History, vol. 42, no. 1, pp. 85–106.
Wyatt, A. 2006, ‘An accounting perspective’ in Bosworth, D. and Webster, E. (eds), The Management of Intellectual Property, Edward Elgar, Cheltenham, pp. 40–65.
