investor and analyst meetings -...
TRANSCRIPT

Investor and Analyst Meetings
July 2014
01.
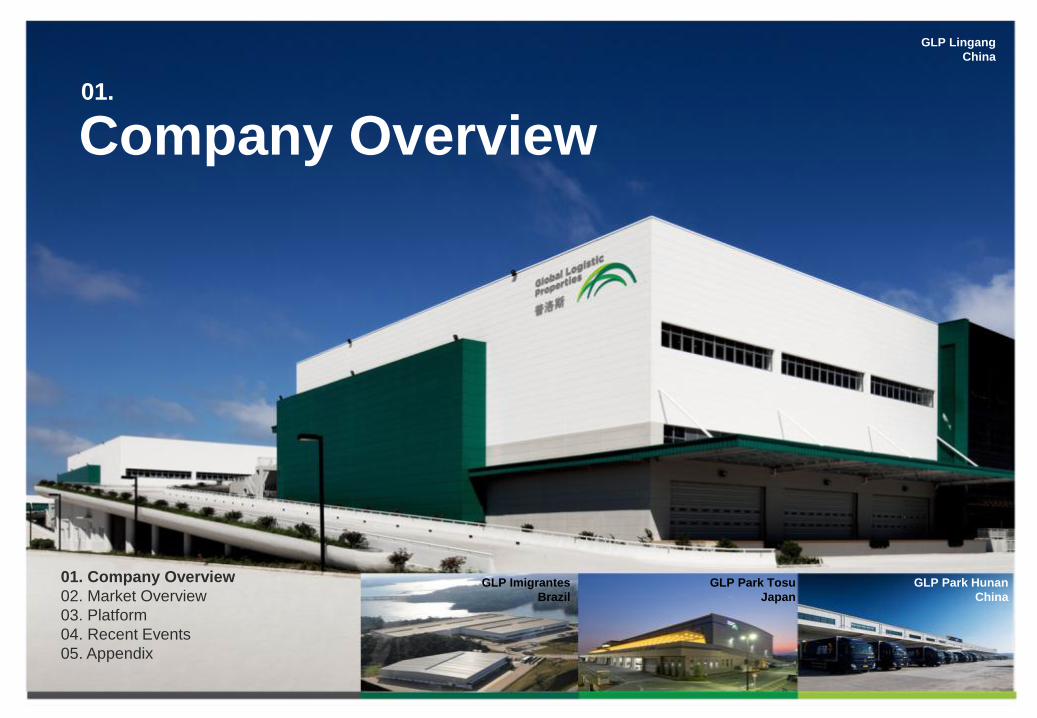
01. Company Overview
02. Market Overview
03. Platform
04. Recent Events
05. Appendix
GLP Park Tosu
Japan
GLP Park Hunan
China
GLP Lingang
China
GLP Imigrantes
Brazil
Company Overview

3
GLP is the leading provider of modern logistics facilities in China,
Japan and Brazil
Our US$17.6 billion property portfolio comprises 25.3 million sqm
(272 million sq ft) and forms an efficient logistics network serving
more than 700 customers. Domestic consumption is a key driver
of demand for GLP
GLP is a SGX-listed company with a market capitalization of
S$13.21 billion; GIC is the largest single investor in GLP
GLP Park Colgate & Elog
Brazil
GLP Park Suzhou
China GLP Park Tokyo
Japan
NAV breakdown
China 53%
Brazil 5% Japan
23%
Others 19%
Note:
(1) As of 22 May 2014
About Global Logistic Properties

4
Leading Provider of Modern Logistics Facilities
in the Best Markets
GLP’s Global Footprint
China
Presence in 34 cities
18.7mm sqm total area
9.5mm sqm completed
9.3mm sqm development pipeline
12.8mm sqm land reserves
Brazil
87% in São Paulo and Rio
3.0mm sqm total area
2.3mm sqm completed
0.7mm sqm development pipeline
Japan
86% in Tokyo and Osaka
4.5mm sqm total area
3.9mm sqm completed
0.5mm sqm development pipeline

5
7.6
1.1 1.0 0.8 0.7
0.4 0.4 0.4 0.2 0.1
GL
P
Blo
gis
Go
odm
an
Ma
ple
tre
e
Pro
log
is
AC
L
e-S
ha
ng
Yu
pe
i
Be
ijing
Pro
pe
rtie
s
Va
ilog
Unrivalled Network in China, Japan and Brazil
3.9
2.6
1.8
1 0.8 0.7 0.6 0.6 0.5 0.5
GL
P
Pro
log
is
Daiw
a H
ou
se
JLF
LIM
Nom
ura
RE
Ma
ple
tre
e
Ori
x
Mitsu
bis
hi
Go
odm
an
Japan Brazil
(mm sqm) (mm sqm)
Significant barriers to entry
Benefiting from the increased economies of scale
China
Based on completed area for modern logistics facilities, as of March 31, 2014, and BRP 1st tranche acquisition as of June 12, 2014. The remaining properties are expected to be acquired in phases,
subject to the receipt of required regulatory and third party approvals.
Source: Based on completed parks from company websites, various news sources, CBRE estimates based on available information
GLP
Sta
ke: 1
9.9
%
GLP
Sta
ke: 5
3.1
%
(mm sqm)
GLP
Sta
ke: 9
0-9
5%
2.3
0.6 0.4 0.4 0.4 0.3
0.1 0.1
GL
P
Hin
es
CC
P /
Pro
log
is
MR
V L
og
BR
Pro
pe
rtie
s
Sa
nca
GR
Pro
pert
ies
WT
Go
od
ma
n

6
2002-2004 2005-2007 2008–2010 FY11–FY14
Key Milestones GLP founding partners Jeff
Schwartz and Ming Mei
established presence in China
and Japan
Presence in five key markets in
China and Japan – Suzhou,
Shanghai, Guangzhou, Tokyo and
Nagoya
Established network in 18 major
logistics hubs in China
Expanded into Osaka, Sendai and
Fukuoka markets in Japan
Named best developer in China
by Euromoney for the first time
Selected as the exclusive distribution
center provider for the Beijing 2008
Olympic Games
Japan AUM exceeds JPY 500 billion
(US$5.3 billion)
Listed on the Main Board of Singapore
Stock Exchange on 18 Oct 2010 in the
largest real estate IPO ever globally
Named Best Overall Developer in China and
Asia in 2013 Euromoney Awards
Listed GLP J-REIT, Japan’s largest real
estate IPO
Launched CLF Fund I, world’s largest
China-focused real estate fund
Signed a landmark agreement with Chinese
SOEs and leading financial institutions
investing up to US$2.5 billion
Announced the acquisition of 36 stabilized
properties from BR Properties for US$1.34
billion
0.5 1.0 1.62.4 2.8 2.8 2.8
3.6 3.6
6.9
1.3
0.20.6
1.3
2.3
3.8
5.46.0
6.8
10.0
11.8
0.2 0.1
6.4
4.03.22.6
1.4
0.80.3
FY04 FY05 FY06 FY07 FY08 FY09 FY10 FY11 FY12 PF 2QFY13
Japan China Brazil
Proven Track Record of Delivering Growth
GFA of Completed Properties
(mm sqm)
0.5 1.0 1.6 2.4 2.8 2.8 2.8
3.6 3.6 3.9
1.4
2.6 3.2 4.0
6.4 7.6
9.5
1.0
1.4
0.2 0.6
1.3
2.3
3.8
5.4 6.0
6.8
10.0
12.2
14.8
FY04 FY05 FY06 FY07 FY08 FY09 FY10 FY11 FY12 FY13 FY14
Portfolio Growth of GLP
FY04 – FY14 CAGR: 54%

Growing Fund Management Platform
7
Vintage Sep 2011 Dec 2011 Nov 2012 Nov 2012 Dec 2012 Nov 2013
Fund Name
GLP Japan
Development
Venture
GLP Japan
Income
Partners I
GLP Brazil
Income
Partners I
GLP Brazil
Development
Partners I
GLP J-REIT CLF Fund I
Assets under
Management2 US$1.9bn US$1.0bn US$1.2bn US$1.1bn US$2.9bn US$3.0bn
Investment To-
Date US$0.8bn US$1.0bn US$1.1bn US$0.6bn US$2.9bn US$0.5bn
Joint Venture
Partners CPPIB CIC & CBRE
CIC, CPPIB
& GIC CPPIB & GIC Public Various
Total Equity
Commitment US$1.0bn US$500m US$600m US$800m US$1.4bn US$1.5bn
GLP Co-
Investment 50.0% 33.3% 34.2% 40.0% 15.0% 55.9%
Investment
Mandate Opportunistic Value-add Value-add Opportunistic Core Opportunistic
Invested
Capital
Uncalled
Capital
$11.1
Six property funds with total AUM of US$11.1bn when fully leveraged and invested
FY2014 fund management revenue up 112% year-on-year to US$68 million1 (asset & property
management fees of US$40 million and development & acquisition fees of US$28 million)
Further growth expected from US$4.2 billion of uncalled capital
Fund Management Platform Assets Under Management (US$bn)
1) Fund management fee income reflects 100% of fees charged and is recognized primarily via two line items: “management fee income” under revenue and “share of fund management fees payable to GLP” under non-controlling interests
2) AUM based on cost for in-progress developments (does not factor in potential value creation) and latest appraised values for completed assets
1.9 1.9 1.9 1.9 1.9
1.0 1 1 1
2.3
2.9 2.9
6.9
3.0
4.2
JapanDevt
Venture
JapanIncome
Partners I
Brazil JVs J-REIT CLF FundI
TotalAUM

2.7x
5.4x
Net Debt / EBITDA EBITDA / Interest
8
Low Leverage and Significant Cash on Hand
Debt Ratios for the period ended March 31, 2014
• EBITDA: US$403.7m
• Interest: US$74.5m
Leverage Ratios as of March 31, 2014
(US$ million)As at
Mar 31, 2014
As at
Mar 31, 2013
Change
%
Total assets 13,947 13,248 5.3
Total equity 9,933 9,047 9.8
Cash 1,486 1,957 (24.1)
Total loans and borrowings 2,592 2,882 (10.1)
Net debt 1,106 925 19.7
Weighted average interest cost 3.0% 2.7% 0.3
Group Financial Position
20.0%
11.8%
18.6%
8.9%
Total Debt to Assets Net Debt to Assets
Q3 FY2014 Q4 FY2014

9
Unique Investment Proposition with a Focus on the
Best Markets
China & Brazil
domestic consumption
growth
Robust
Strategy
Powerful
Platform
Attractive
Markets
Limited supply of modern
facilities in China, Japan
& Brazil
Strong capital
structure
Unrivalled
network in
China, Japan
& Brazil
Vast China
land bank
Experienced
team
Outsourcing &
e-commerce trends
in Japan
Customer demand driven expansion
Strong development capabilities with leading
land positions
Growing fund management platform

GLP Soja
Japan
GLP Park Xi’an Hi-Tech
China
GLP Tokyo II
Japan
02.
Market Overview
GLP Guarulhos
Brazil
01. Company Overview
02. Market Overview
03. Platform
04. Recent Events
05. Appendix

11
Over 75% of China Warehouses Do Not Meet
Modern Logistics Requirements & Face
Demolition Amid Urbanization
Current Supply of Logistics Facilities in the
US is ~12 times that of China
Source: China Association of Warehouses and Storage; CB Richard Ellis estimates;
CIA The World Factbook
Mo
dern
M
idd
le
Interior
Lo
w-e
nd
Exterior Characteristics
>Wide column spacing
> Large floor plates
> High ceilings
>Modern loading docks,
enhanced safety systems
and other value-added
features
> Some converted from
factories
> Insufficient clear height
and lack of loading
docks
> Lack of office space
> Poorly constructed
> Restricted vehicle
accessibility
Limited Supply of Modern Logistics Facilities in China
Modern Logistics Facilities1 Account for 15-
20% of Total Supply; Market is Fragmented
Warehouse stock: total area (sqm) per capita
(million sqm)
100.0
Modern
Logistics Facilities1
550.0
Total Market Supply
of Logistics Facilities
Notes:
1. Includes facilities provided by major international and national developers, small and midsize developers, state-owned enterprises, and facilities for owned for self-use
2. From JLL report covering 11 cities
13.0
Major Providers2
0.41
5.06
0.00
1.00
2.00
3.00
4.00
5.00
6.00
China US
12x
12
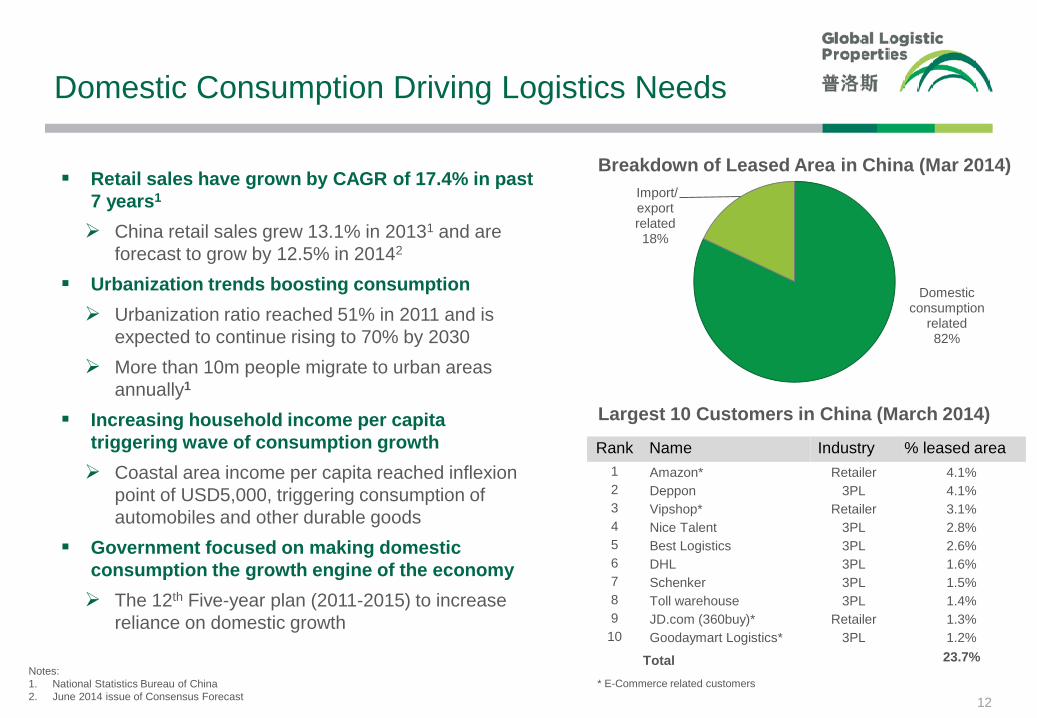
Domestic Consumption Driving Logistics Needs
Retail sales have grown by CAGR of 17.4% in past
7 years1
China retail sales grew 13.1% in 20131 and are
forecast to grow by 12.5% in 20142
Urbanization trends boosting consumption
Urbanization ratio reached 51% in 2011 and is
expected to continue rising to 70% by 2030
More than 10m people migrate to urban areas
annually1
Increasing household income per capita
triggering wave of consumption growth
Coastal area income per capita reached inflexion
point of USD5,000, triggering consumption of
automobiles and other durable goods
Government focused on making domestic
consumption the growth engine of the economy
The 12th Five-year plan (2011-2015) to increase
reliance on domestic growth
Domestic consumption
related 82%
Import/ export related 18%
Breakdown of Leased Area in China (Mar 2014)
Notes:
1. National Statistics Bureau of China
2. June 2014 issue of Consensus Forecast
Rank Name Industry % leased area
1 Amazon* Retailer 4.1%
2 Deppon 3PL 4.1%
3 Vipshop* Retailer 3.1%
4 Nice Talent 3PL 2.8%
5 Best Logistics 3PL 2.6%
6 DHL 3PL 1.6%
7 Schenker 3PL 1.5%
8 Toll warehouse 3PL 1.4%
9 JD.com (360buy)* Retailer 1.3%
10 Goodaymart Logistics* 3PL 1.2%
Total 23.7%
Largest 10 Customers in China (March 2014)
* E-Commerce related customers

13
Capitalizing on China’s Fast Evolving
Retail Landscape
Source:Strong and Steady, 2011 Asia ‘s Retail and Consumption Outlook by PWC
Chain Store Sales as % of Total Retail
5% 10%
65%
0%
10%
20%
30%
40%
50%
60%
70%
India China US
26 56 128 263 498
774
1,300
1,850
2,420
3,119
3,790
0
500
1,000
1,500
2,000
2,500
3,000
3,500
4,000
2006 2007 2008 2009 2010 2011 2012 2013 2014E 2015E 2016E
10-year CAGR: 65%
Online Retail Sales in China
RMB Bn
Source: iResearch Consulting Group; Ministry of Commerce
Huge room
to grow
GLP’s modern logistic facilities support the rapid growth of chain stores in China
Accelerating store opening of major chain stores in China; Watsons plans to increase number of stores in China
from over 1,600 at the end of 2013 to 3,000 by 2016
China’s retail chain market has significant room to grow compared to the U.S.
E-commerce is a fast growing industry for GLP
Online retail sales have increased roughly 70-fold since 2006 (7-year CAGR of 84%) and are expected to further
double over the next three years to RMB3.8 trillion (US$610 billion)
Online retail volume accounted for 7.9% of the total retail sales in 20131
Notes:
1. iResearch Consulting Group

14
Limited Supply of Modern Logistics Facilities in Japan
Modern Logistics Facilities in Japan are Scarce¹
Existing Facilities Not Built to Modern Standards
Source: JLL
Owned by users
Small-sized and old facilities
Fragmented market
Leased spaces, largely to 3PL
operators
Large-sized modern facilities
Few players of scale
Existing Logistics Facilities Modern Logistics Facilities
Notes:
1. Represents facilities with GFA ≥ 10,000 sqm
Various Features of Modern Logistics Facilities
Source: CBRE
Modern
Logistic
Facilities
2.8%
Others
97.2% 5.5 m or more
High Ceilings
10,000 sqm or more
Large Floor Area
Wide Column Spacing Wide Truck Yard
Dock Leveler Ramp Ways
Elevated Berths
1.5 t/sqm or more
High Load Tolerance
Elevator with Large
Capacity

15
Growth of Outsourcing & E-Commerce Trends Drives
Demand for Modern Logistics Facilities in Japan
Source: Ministry of Economy, Trade and Industry “e-Commerce Market Survey” Source: Logi-Biz (Logistics Business, Sep. 2012 issue)
Growth of Japanese Third Party Logistics (“3PL”) Market Market Size of B to C E-Commerce in Japan
(JPY billion)
Strong demand from 3PL companies for GLP’s
modern logistic facilities
3PL companies benefit from the increasing trend of
companies outsourcing their logistics in order to
reduce costs and focus on their core business
3PL market has grown by 78% in 6 years
Fast growing e-commerce market represent new
growth industry for GLP
Internet/mail order service has grown by 145% in 6
years
E-commerce sales have reached ~JPY 10 trillion
and are expected to double over the next 5 years
(JPY billion)
1,001
1,124
1,306 1,275 1,272
1,461
1,784 1,883
0
200
400
600
800
1000
1200
1400
1600
1800
2000
2005 2006 2007 2008 2009 2010 2011 2012
3,456
4,391
5,344
6,089
6,696
7,788
8,459
9,513
0
1000
2000
3000
4000
5000
6000
7000
8000
9000
10000
2005 2006 2007 2008 2009 2010 2011 2012

16
Brazil: Severe Shortage of Modern Logistics Facilities
Creates Significant Opportunities
Key Growth Drivers
Modern Logistics Facilities Account for ~20% of Supply
Brazil:
64mm sqm
20%
Modern Logistics Facilities:
~13mm sqm
Source: CBRE
(sqm per capita)
5.06
0.33
United States Brazil
15x
Logistics Space Per Capita is 1/15th of the US
Retail Sales Growth (%)
4.3%
5.4%
3.9%
6.2%
8.7%
7.1%
10.6%
4.6%
9.5% 10.2%
6.3%6.9%
2005 2006 2007 2008 2009 2010 2011 2012 2013 Jan-
14
Feb-
14
Mar-
14
Average: 7%
Robust domestic consumption drive demand for modern
logistics facilities
87% of GLP’s Brazil portfolio leased to domestic consumption
related customers
While economic growth has slowed, long-term prospects
remain attractive
Outsourcing trend: Companies shifting from owning
warehouses to leasing amid continued efforts to improve
supply chain efficiency Source: CBRE estimates, EIU
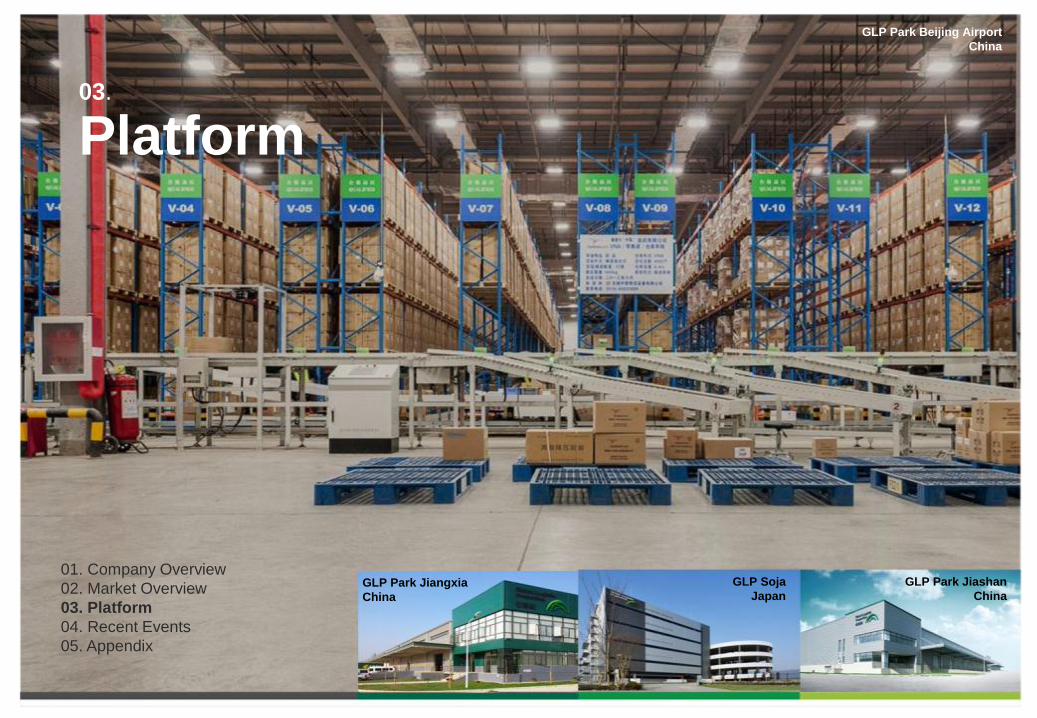
03.
Platform
GLP Park Beijing Airport
China
GLP Park Jiashan
China
GLP Soja
Japan GLP Park Jiangxia
China
01. Company Overview
02. Market Overview
03. Platform
04. Recent Events
05. Appendix

504
804
4QFY13 4QFY14
• Highest new leases: 1,044,000 sqm, up 123% yoy
• FY2014: 2,301,000 sqm, up 61% yoy
STRONG
LEASING
TRENDS
China Business Highlights for 4Q FY2014 Strong Leasing and Development Momentum
STRONG
DEVELOPMENT
PIPELINE
• Record land acquisition of 1.7 million sqm, up 39% yoy
• Further growth driven by 12.8 million sqm of land reserves
18
CONTINUED
DEVELOPMENT
MOMENTUM
• Development starts: US$429 million, up 54% yoy (804,000 sqm)
• FY2014: US$1.2 billion (2.5 million sqm in line with target)
• Target for FY2015: US$1.7 billion, up 43% yoy (3.3 million sqm)
• Highest development completions in a quarter: US$455 million (880,000 sqm, up 141% yoy)
Development Starts
(‘000 sqm)
Development Completions
(‘000 sqm)
365
880
4QFY13 4QFY14
New & Expansion Leases
(‘000 sqm)
469
1,044
4QFY13 4QFY14
Lease ratios (%) and Rental (RMB/sqm/day)
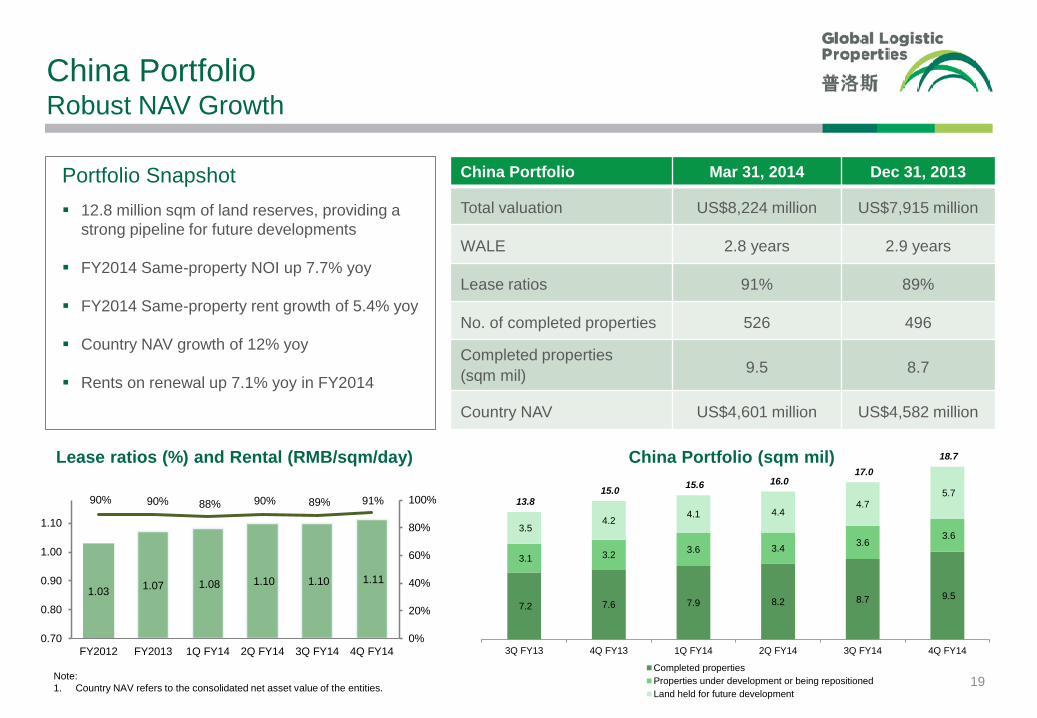
China Portfolio Robust NAV Growth
China Portfolio Mar 31, 2014 Dec 31, 2013
Total valuation US$8,224 million US$7,915 million
WALE 2.8 years 2.9 years
Lease ratios 91% 89%
No. of completed properties 526 496
Completed properties
(sqm mil) 9.5 8.7
Country NAV US$4,601 million US$4,582 million
Portfolio Snapshot
12.8 million sqm of land reserves, providing a
strong pipeline for future developments
FY2014 Same-property NOI up 7.7% yoy
FY2014 Same-property rent growth of 5.4% yoy
Country NAV growth of 12% yoy
Rents on renewal up 7.1% yoy in FY2014
China Portfolio (sqm mil)
19
1.031.07 1.08 1.10 1.10 1.11
90% 90% 88% 90% 89% 91%
0%
20%
40%
60%
80%
100%
0.70
0.80
0.90
1.00
1.10
FY2012 FY2013 1Q FY14 2Q FY14 3Q FY14 4Q FY14
7.2 7.6 7.9 8.2 8.7 9.5
3.1 3.23.6 3.4
3.63.6
3.5 4.2
4.1 4.44.7
5.7 13.8
15.0 15.6 16.0
17.0
18.7
3Q FY13 4Q FY13 1Q FY14 2Q FY14 3Q FY14 4Q FY14
Completed properties
Properties under development or being repositioned
Land held for future development
Note:
1. Country NAV refers to the consolidated net asset value of the entities.

20
Japan Portfolio Stable Portfolio
Portfolio Snapshot
85% of completed area located in Tokyo and Osaka
Portfolio well leased at 99%
Improving rents with high retention rate of 80%
Long WALE of 5.1 years
Lease ratios (%) and Rental (JPY/sqm/mth) Japan Portfolio (sqm mil)
Japan Portfolio Mar 31, 2014 Dec 31, 2013
Total Valuation US$7,659 million US$7,239 million
WALE 5.1 years 5.4 years
Lease ratios 99% 99%
No. of completed properties 85 84
Completed properties
(sqm mil) 3.9 3.8
Country NAV US$2,052 million US$1,894 million
3.6
2.3 2.4 2.4 2.3 2.3
1.3 1.3 1.3 1.5 1.6
0.4 0.4 0.3 0.3 0.5 0.5 0.06 0.2
0.04 4.0 4.0 4.0
4.2 4.3 4.5
3Q FY13 4Q FY13 1Q FY14 2Q FY14 3Q FY14 4Q FY14
Completed properties (excld J-REIT prop)
Completed properties (J-REIT prop)
Properties under development or being repositioned
Land held for future development
1,077 1,083 1,081 1,081 1,085 1,087
99% 99% 99% 99% 99% 99%
0%
20%
40%
60%
80%
100%
900
950
1,000
1,050
1,100
FY2012 FY2013 1Q FY14 2Q FY14 3Q FY14 4Q FY14
Note:
1. Country NAV refers to the consolidated net asset value of the entities.

21
Brazil Portfolio Leading Position in the Market
Portfolio Snapshot
Healthy development pipeline of 0.7 million sqm (vs
completed area of 1.4 million sqm)
Long WALE of 7.5 years
High lease ratios of 96% and stable rents
Lease ratios (%) and Rental (BRL/sqm/mth) Brazil Portfolio (sqm mil)
Brazil Portfolio Mar 31, 2014 Dec 31, 2013
Total Valuation US$1,754 million US$1,730 million
WALE 7.5 years 7.7 years
Lease ratios 96% 95%
No. of completed properties 44 43
Completed properties
(sqm mil) 1.4 1.4
Country NAV US$446 million US$440 million
16.8 16.8 17.3 17.3 17.8
98% 98% 95% 95%96%
0%
20%
40%
60%
80%
100%
10.0
12.0
14.0
16.0
18.0
4Q FY13 1Q FY14 2Q FY14 3Q FY14 4Q FY14Note:
1. Country NAV refers to the consolidated net asset value of the entities.
1.3 1.3 1.3 1.4 1.4
0.2 0.2 0.2 0.2 0.1
0.6 0.6 0.6 0.6 0.6
2.1 2.1 2.1 2.2 2.1
4Q FY13 1Q FY14 2Q FY14 3Q FY14 4Q FY14
Completed properties
Properties under development or being repositioned
Land held for future development

22
Accelerating Growth in China Portfolio
Our China portfolio includes land reserves of 12.8 million sqm in addition to the above
Total Area
(sqm million)
Pro-rata Area
(sqm million)
Total valuation
(US$m)
Pro-rata
valuation
(US$m)
Pro-rata
valuation %
change
Total Area
(sqm million)
Pro-rata Area
(sqm million)
Total valuation
(US$m)
Pro-rata
valuation
(US$m)
China portfolio 18.7 13.8 8,224 6,249 3% 17.0 13.0 7,915 6,066
Completed and stabilized 7.4 6.1 5,147 4,148 6% 7.0 5.7 4,865 3,913
Completed and pre-stabilized 1.3 1.1 900 692 25% 0.9 0.8 679 552
Other facilities 0.8 0.4 207 110 -1% 0.8 0.4 209 111
Properties under development or being repositioned 3.6 2.3 787 541 -31% 3.6 2.6 1,083 778
Land held for future development 5.7 3.9 1,184 759 7% 4.7 3.4 1,079 712
Japan portfolio 4.5 2.3 7,659 4,036 0% 4.3 2.3 7,239 4,056
Completed and stabilized 3.7 1.9 7,010 3,707 -1% 3.6 1.9 6,627 3,747
Completed and pre-stabilized 0.2 0.1 433 216 64% 0.2 0.1 263 132
Properties under development or being repositioned 0.5 0.3 204 106 -40% 0.5 0.3 349 178
Land held for future development 0.0 0.0 13 6 100% 0.0 0.0 0 0
Brazil portfolio 2.1 0.8 1,754 629 2% 2.1 0.8 1,730 617
Completed and stabilized 1.4 0.5 1,454 515 5% 1.4 0.5 1,398 491
Completed and pre-stabilized 0.0 0.0 0 0 N.M. 0.0 0.0 0 0
Properties under development or being repositioned 0.1 0.0 73 27 -50% 0.2 0.1 139 53
Land held for future development 0.6 0.2 227 87 19% 0.6 0.2 193 73
Total GLP portfolio 25.3 16.9 17,638 10,914 2% 23.4 16.1 16,884 10,739
As at Mar 31, 2014 As at Dec 31, 2013

04.
Recent Events
GLP Guarulhos
Brazil
GLP Liantang
China
GLP Park AGV
Brazil
GLP Park Amagasaki
Japan
01. Company Overview
02. Market Overview
03. Platform
04. Recent Events
05. Appendix

24
LEADER IN THE WORLD’S
THREE BEST MARKETS
OUTSTANDING GROWTH
OPPORTUNITIES
FINANCIAL STABILITY
AND FLEXIBILITY
ON-GOING
DEVELOPMENT
MOMENTUM
Driving Growth Opportunities through Landmark
Partnership Agreement in China
Enhanced access to land, customers and capital
Highest quarter of new leases, completions and land
acquisitions in China
Strong leasing across all markets - highest quarter of
new leases in 4Q FY2014
1.2 million sqm, up 124% yoy
Acquisition of BR Properties portfolio – doubles the
size of completed Brazil Platform
Substantial Development Pipeline of US$2.5 billion
(10.5 million sqm)
FY2014 Group PATMI (ex J-REIT/FX) up 31% yoy
FY2014 China PATMI up 42% yoy
Strong Balance Sheet with low leverage
Net debt to assets 8.9% (3Q FY2014: 11.8%)
Powering Ahead into the Future

4Q FY2014 Key Business Highlights
STRONG
CORE
PORTFOLIO
• Market-leading positions in China, Japan and Brazil
• 655 properties with total 14.8 million sqm of completed area
• High lease ratios of 91%, 99% & 96% for China, Japan and Brazil respectively
• Highest quarter of new leases of 1.2 million sqm, up 124% yoy
• FY2014 development starts US$2.0 billion, up 12% yoy (3.0 million sqm)
• Accelerating growth with FY2015 target US$2.7 billion, up 38% yoy (4.1 million sqm)
• FY2014 value creation US$205 million from development portfolio
• Development pipeline supported by 12.8 million sqm of land reserves, up 22% yoy
• US$11.1 billion of assets under management, up from US$8.4 billion yoy
• US$25 million fund fees in 4Q FY2014, doubled yoy
• Future growth expected from US$4.2 billion uncalled capital
STRONG
CORE PORTFOLIO
SUSTAINABLE
DEVELOPMENT
GROWTH
BEST-IN-CLASS
FUND
MANAGEMENT
PLATFORM
25
• Weighted average debt maturity of 4.3 years
• Low leverage (net debt to assets 8.9%) and strong cash position (US$1.5 billion)
• 73% fixed rate debt
• Proposed dividend of 4.5 SGD cents per ordinary share, up 13% yoy (US$170 million)
STRONG
BALANCE SHEET,
LOW LEVERAGE

GROUP PATMI
26
Key Financial Highlights
(US$ million)
1
Note:
1. Comparative proforma figures adjusted for J-REIT and FX related effects to enable a like-for-like comparable base. FX related effects include FX translation, FX gain/loss and changes in fair value of
financial derivatives.
522
J-REIT & FX
684 685
FY2013 FY2014
FY2014 FY2013 ChangeFY2013 Proforma
(J-REIT & FX adj)
Change
(vs FY2013
Proforma)
4Q FY2014 4Q FY2013 Change4Q FY2013
Proforma
(J-REIT & FX adj)
Change (vs
4Q FY2013
Proforma)
Revenue 598 642 -7% 498 20% 150 125 20% 124 21%
EBIT 918 908 1% 752 22% 217 252 -14% 243 -11%
EBIT ex revaluation 401 484 -17% 354 13% 90 88 2% 88 3%
PATMI 685 684 - 522 31% 160 224 -29% 174 -8%
PATMI ex revaluation 250 350 -29% 213 17% 54 82 -35% 41 31%
Diluted EPS (in US cents) 13.67 13.95 -2% N.M. N.M. 3.18 4.53 -30% N.M. N.M.

Auto & Parts, 3%
Electronics / High-tech, 6%
FMCG, 11%
General Logistics Services, 23% Others, 5%
Pharma & Medical
Instruments, 1%
Retail/Fast Food Chain, 50%
27
Existing Customers
71%
New Customers
29%
Composition of China New Leases – 4Q FY2014
E-commerce represents 45% of 4Q FY2014 leasing & 25% of
total leased area in China
New and Expansion Leases in 4Q FY2014
• 4Q FY2014: Highest quarter of new and expansion leases (1.2 million sqm, up 124% yoy)
• Record new leases in China (1.0 million sqm, up 123% yoy)
• Strong performance in Japan (52,000 sqm) and Brazil (150,000 sqm)
• FY2014: New and expansion leases of 3.0 million sqm, up 74% yoy
STRONG
LEASING
TRENDS
New & Expansion Leases (‘000 sqm)
469
198
575 485
1,044 50
145
20 197
52
36
21
121
150
555
343
615
803
1,245
4Q FY13 1Q FY14 2Q FY14 3Q FY14 4Q FY14
China Japan Brazil

28
Landmark Agreement in China Drives Increased
Growth Opportunities
Overview Investment by a group of leading Chinese
domestic institutions
Investors Include China Life Insurance, Bank of China
Group Investment, HOPU Funds
Investment in Tranche 1 Tranche 2
Investee China
Holdco GLP Listco China Holdco
Investment Amount US$1.48bn US$163m Up to
US$875m
Shareholdings in
Investee 24.4%
1.5% issued
capital
(74m shares)*
~9.6%
Estimated Closing Closed on 6 June 2014
Within 6
months from
Tranche 1
New partnerships enhance access to strategic land holdings and best-in-class-customers, while
bringing additional capital to accelerate growth
30-40% annual growth in China development expenditure for the next 3-5 years
GLP’s recently announced strategic partnerships with leading Chinese institutions to accelerate
growth
Increased Growth Opportunities
Access to strategic land holdings- Land
supply increasingly constrained amid
new land reforms in China
Increased leasing demand- Space
requirements getting larger; having
portfolio to accommodate growth will
be key to winning and retaining
customers
Strengthened network and local brand-
More strategic partnerships will lead to
a larger customer network, more
solutions for customers and stronger
brand recognition across China

05.
Appendix
GLP Lingang
China
GLP Park Longgang
China
GLP Campinas
Brazil GLP Shinsuna
Japan 01. Company Overview
02. Market Overview
03. Platform
04. Recent Events
05. Appendix

30
GLP China Portfolio
Shanghai
Beijing
Greater
Guangzhou-
Foshan Shenzhen
Tianjin
Suzhou
Greater
Hangzhou
Qingdao
Nanjing
Chengdu
Chongqing
Ningbo
Dalian
Shenyang
Offices(20)
Founded: 2003
Headquarters: Shanghai
Locations: 34 cities1
Number of GLP parks: 134
Number of completed properties: 526
Completed area: 9.5 million sqm
Xi’an
Zhuhai
Region # of Cities Completed area
North 7 1.9 million sqm
East 14 5.0 million sqm
South 7 0.9 million sqm
West 6 1.7 million sqm
34 9.5 million sqm Hefei
Changsha
Greater
Wuhan
Notes:
1. Other cities in which GLP has presence (from north to south): Harbin, Changchun, Langfang, Greater Jinan, Zhengzhou, Yangzhou, Nantong, Changzhou, Wuhu, Wenzhou, Fuzhou, Xiamen,
Nanning and Dongguan
Wuxi

3-9 Months
City / submarket identification
Site selection
Negotiation with government
Customer demand analysis
Bidding process
Project design
Building permitting
Government approvals
Pre-marketing
Construction financing
Contracting
Foundation
Base-building
Substantial completion
6-12 Months* 3-6 Months Various
A typical development takes ~21 months from site acquisition to lease-up
Marketing
Customer relationships
Lease contracts – negotiation
and drafting
Tenant fit-out
Project Identification /
Acquisition Pre-Development Construction Lease-Up
Tianjin TEDA Park – Completed Tianjin TEDA Park – Pre-Construction
Typical Development Process Timeline
* Typical construction period for single-storey warehouses. Multi-storey warehouses will take about 18 months to be built. 31

32
Network Effect Case Study Deppon: Complete National Coverage
Network Effect The scale of GLP’s national network offers customers efficient logistics solutions for their expansion, leading to
faster lease up, strong customer retention and good visibility on future demand
Deppon is China’s leading integrated logistics provider offering a full range of products including express road shipping, road
freight and air freight
Deppon’s services are critical in improving e-commerce companies distribution efficiency and service quality
Deppon is GLP’s 2nd largest customer in China, leasing 324,000 sqm or 4.1% of total leased area, across 16 locations
Cumulative Lease (sqm)
+6
mths +6
mths
+9
mths
+3
mths
+6
mths
14,000 16,000 27,000
38,000
Mar, 2010
Qingdao
11,000 sqm
4
Jun, 2010
Dalian
11,000 sqm
5
Dec, 2010
Suzhou
28,000 sqm
6 +8
mths
+12
mths
+2
mths 7
Aug, 2011
Shanghai
17,000 sqm
8
Aug, 2012
Changzhou
16,000 sqm
99,000
1
Hangzhou
12,000 sqm
Jun, 2008
Guangzhou
2,000 sqm
2
Dec, 2008
Wuxi
2,000 sqm
3
Jun, 2009
66,000 83,000
Hangzhou, Wuxi,
Suzhou, Shanghai,
Changzhou, Yangzhou
1,3,6,7,8,14, 16
Langfang
5,9,15
Shenyang
10,17 Qingdao
Wuhan
13
2 Guangzhou
Dalian
12 Harbin
4
11 Hefei
9
Oct, 2012
Shenyang
16,000 sqm
115,000
+3
mths
+3
mths 12
Harbin
23,000 sqm
13
Wuhan
68,000 sqm
Mar, 2013
279,000
10
Langfang
53,000 sqm
11
Hefei
20,000 sqm
Jan, 2013
188,000
Oct, 2013
14
Suzhou
18,000 sqm
304,000
15
Shenyang
7,000 sqm
+7
mths
+2
mths 16
Dec, 2013
Yangzhou
16,000 sqm
319,000
+1
mth 17
Jan, 2014
Beijing
5,000 sqm
324,000
Beijing

33
Embedded Acquisition Pipeline
Asset Size US$2.9 billion
LTV Target 45-55%
Portfolio 44 modern logistics facilities in Japan,
majority in Tokyo and Osaka
Total 1.59 million sqm
Key Dates
IPO: 21 Dec 2012
Purchase of Initial Properties: 4 Jan 2013
Purchase of Option Properties: 1 Feb 2013
GLP Stake 15%
GLP J-REIT Overview
Overview (as of Mar 31, 2014)
Corporate Structure
Right of
First Look
On 33 properties, till 2022
1.4 million sqm of additional GFA
US$2.8 billion as of Mar 31, 2014
100% Sponsor Group
J-REIT
Asset Manager 15%
Asset Management
Agreement
Portfolio growth: +37% since IPO
Rental growth1: +2.5% since IPO
Occupancy: 99.9%
NAV2 Per Unit: +15.4% since IPO
Distribution3 Per Unit: +14.2% since IPO
1. Average rental increase on renewal leases
2. Based on February 2014 results and including unrealized gain from four recently acquired properties
3. Includes extra distribution beyond dividends

34
Overview of Brazil Funds
GLP Brazil Income Partners I
Ownership (%)
GLP 34.2%
CIC 34.2%
GIC 20.0%
CPP 11.6%
GLP Brazil Development Partners I
Ownership (%)
GLP 40.0%
GIC 20.4%
CPP 39.6%
Total Area 1,276,104 sqm
Latest Book Value US$1.1 billion
Existing LTV 40%
Occupancy Rate 98%
Weighted Average Lease Expiry 8.0 Years
Total Area 999,434 sqm
Investment To-date US$0.6 billion
Incremental Development Spend US$353 million
GLP Share of Incremental
Development Spend US$141 million

Diversified Exposure Across Industries
35
Japan China
Lease profile by End-user Industry (by Leased Area)
E-commerce represents 25% of leased area in China, 10% in Japan and 21% in Brazil
Brazil
Auto & Parts, 3%
Electronics/ High-tech, 19%
FMCG, 42%
General Logistics Services, 8%
Others, 10%
Pharma & Medical
Instruments, 6%Retail/Fast Food Chain, 12%
Auto & Parts, 10%
Electronics / High-tech, 10%
FMCG, 19%
General Logistics Services, 19%
Machinery, 1%
Others, 4%
Pharma & Medical Instruments, 3%
Retail/Fast Food Chain, 33%
Auto & Parts, 3%
FMCG, 32%
General Logistics Services, 20%
Pharma & Medical Instruments, 2%
Others, 18%
Machinery, 6%
Retail/ Fast Food Chain, 19%

Well Staggered Lease Expiry Profile
36
Lease Expiry Profile (by Leased Area)
Note:
1. Group percentages in italics above the bars.
8%
20%14% 13%
45%
26%
19%
16%
8%
31%
3%3%
4%
14%
77%
18%18%
14%
10%
40%
FY2015 FY2016 FY2017 FY2018 Beyond FY2018
Japan China Brazil

Consolidated Income Statements
37
(US$'000)
Three-month
period ended
Mar 31, 2014
Three-month
period ended
Mar 31, 2013
Year ended
Mar 31, 2014
Year ended
Mar 31, 2013
Revenue 150,430 125,100 598,288 642,094
Other income 951 2,530 7,901 6,949
Property-related expenses (28,756) (24,674) (105,404) (104,794)
Other expenses (38,961) (37,402) (136,248) (119,403)
83,664 65,554 364,537 424,846
Share of results (net of income tax) of jointly-controlled entities 40,665 115,225 140,334 164,852
Share of results 6,295 22,397 31,297 49,528
Share of changes in fair value of investment properties 34,370 92,828 109,037 115,324
Profit from operating activities after share of results of jointly-
controlled entities
124,329 180,779 504,871 589,698
Net finance (costs)/ income (29,022) 12,178 (76,160) (66,725)
Interest income 1,851 3,673 7,620 10,659
Net borrowing costs (21,528) (26,761) (85,413) (112,851)
Foreign exchange (loss)/ gain (1,916) 28,776 6,505 24,459
Changes in fair value of financial derivatives (7,429) 6,490 (4,872) 11,008
Non-operating (costs) /income (151) 171 4,992 9,167
Profit before changes in fair value of subsidiaries'
investment properties
95,156 193,128 433,703 532,140
Changes in fair value of investment properties 92,364 71,184 408,519 309,560
Profit before income tax 187,520 264,312 842,222 841,700
Income tax expense (22,702) (34,366) (132,251) (126,421)
Profit for the period/year 164,818 229,946 709,971 715,279
Attributable to:
Owners of the company 159,976 224,033 685,150 684,281
Non-controlling interests 4,842 5,913 24,821 30,998
Profit for the period/year 164,818 229,946 709,971 715,279

Consolidated Statement of Financial Position
(US$'000) As at As at
Mar 31, 2014 Mar 31, 2013
Investment properties 9,645,698 8,721,995
Jointly-controlled entities 1,328,761 1,200,804
Deferred tax assets 28,313 25,382
Plant and equipment 57,500 13,985
Intangible assets 491,198 494,668
Other investments 412,337 366,307
Other non-current assets 111,682 105,977
Non-current assets 12,075,489 10,929,118
Financial derivative assets 3,452 6,891
Trade and other receivables 382,228 304,099
Cash and cash equivalents 1,485,961 1,957,457
Assets classified as held for sale - 49,977
Current assets 1,871,641 2,318,424
Total assets 13,947,130 13,247,542
Share capital 6,278,812 6,274,886
Capital securities 595,375 595,844
Reserves 1,883,568 1,527,549
Equity attributable to equity holder of the company 8,757,755 8,398,279
Non-controlling interests 1,175,230 648,388
Total equity 9,932,985 9,046,667
Loans and borrowings 2,449,385 2,786,701
Financial derivative liabilities 8,321 19,778
Deferred tax liabilities 656,708 544,519
Other non-current liabilities 160,159 173,070
Non-current liabilities 3,274,573 3,524,068
Loans and borrowings 143,058 95,442
Trade and other payables 575,976 529,224
Financial derivative liabilities 4,444 3,648
Current tax payable 16,094 48,493
Current liabilities 739,572 676,807
Total liabilities 4,014,145 4,200,875
Total equity and liabilities 13,947,130 13,247,542 38

1. Comparative proforma income statement adjusting for J-REIT and FX related adjustments are prepared to present the results on a like-for-like
comparable basis. The J-REIT adjustment accordingly adjust for the revenue and expenses from the properties disposed to J-REIT since 4Q FY2013,
the resultant J-REIT management fee and dividend income received subsequent to the transaction, as if they were disposed off at the beginning of the
comparative period. The FX related adjustments include FX translation effects, FX gain/loss and fair value changes in financial derivatives.
2. Country NAV refers to the consolidated net asset value of the entities representing its operations in China, Japan and Brazil. Segment NAV refers to
Country NAV and adjusted to include intercompany loans from GLP, and bonds attributable to China segment to reflect the usage of proceeds in China
developments.
3. EBIT or PATMI ex-revaluation refers to EBIT or PATMI excluding changes in fair value of investment properties of subsidiaries and share of changes
in fair value of investment properties of jointly-controlled entities, net of deferred taxes.
4. EBITDA is defined as earnings before net interest expense, income tax, amortization and depreciation, excluding revaluation. Gross Interest is
computed before deductions of capitalized interest and interest income.
5. Exchange rates used in the preparation of the financial information and the portfolio summary are as follows:
6. Net Debt to Assets ratio – total assets used for computation excludes cash balances.
7. RMB3 billion fixed note notes and JPY15 billion fixed rate note issued by Listco are allocated to China segment to reflect the usage of these funds
in China developments.
8. Weighted average interest cost includes the amortization of transaction costs for bonds and loans.
Notes to the Results Presentation
39
Notes to Financial Information
As at As at 1 Jan 14 1 Jan 13 1 Apr 13 1 Apr 12
31 Mar 14 31 Mar 13 to 31 Mar 14 to 31 Mar 13 to 31 Mar 14 to 31 Mar 13
Month end closing rates: - Reporting period average rates:-
RMB / USD 6.21 6.28 RMB / USD 6.11 6.22 6.15 6.31
JPY / USD 102.18 94.52 JPY / USD 102.87 91.13 100.15 82.90
SGD / USD 1.26 1.24 SGD / USD 1.27 1.22 1.26 1.24
BRL / USD 2.26 2.02 BRL / USD 2.36 2.00 2.25
Balance sheet
items Income statement items

Notes to the Results Presentation (cont’d)
40
Notes to Portfolio Assets under Management information
1. Completed Asset Value relates to carrying value of the completed properties, expected completed value of the properties under development and/or
targeted completed properties value based on approved investment plans which do not factor in any potential value creation. Any amounts denominated
in currencies other than USD are translated based on the exchange rate as of reporting date.
2. Total Area and Total valuation refer to GFA/GLA and valuation of properties in GLP Portfolio. These includes completed and stabilized properties,
completed and pre-stabilized properties, other facilities, properties under development or being repositioned, and land held for future development but
exclude land reserves.
3. GLP Portfolio comprises all assets under management which includes all properties held by subsidiaries, jointly-controlled entities and GLP J-REIT on
a 100% basis, but excludes Blogis, unless otherwise indicated.
4. Land held for future development refers to land which we have signed the land grant contract and/or we have land certificate, including non-core land
and properties occupied by Air China and the Government or its related entities, that GLP doesn’t wish to own and will sell. The total area is computed
based on estimated buildable area.
5. Land reserves are not recognized on the balance sheet and there is a possibility that it may not convert into land bank. The total area is computed
based on estimated buildable area.
6. Lease ratios of China and Japan relate to stabilized logistics portfolio. Lease ratio of Brazil relates to stabilized portfolio including both logistics and
industrial properties.
7. Lease profile by End-user Industry analysis includes contracted leases for completed logistics properties and pre-leases for logistics properties under
development as at reporting date.
8. New and Expansion Leases include logistic facilities, light industry, industrial and container yards and pre-leases signed by customers.
9. Other facilities includes container yard and parking lot facilities, which are in various stages of completion.
10. Properties under development or being repositioned consists of four sub-categories of properties: (i) properties that we have commenced
development; (ii) logistics facilities that are being converted from bonded logistics facilities to non-bonded logistics facilities; (iii) a logistics facility which
will be upgraded into a standard logistics facility; iv) a logistic facility which is waiting for heating and power supply from government and v) logistics
facilities which are undergoing more than 3 months of major renovation.
11. Pro-rata area and Pro-rata valuation refer to area and valuation of properties in GLP Portfolio, pro-rated based on our interest in these entities.
12. Stabilized properties relate to properties with more than 93% lease ratio or more than one year after completion or acquisition.
13. Any discrepancy between sum of individual amounts and total is due to rounding.
Disclaimer
41
The information contained in this presentation (the “Information”) is provided by Global Logistic Properties Limited (the
“Company”) to you solely for your reference and may not be retransmitted or distributed to any other person. The Information
has not been independently verified and may not contain, and you may not rely on this presentation as providing, all material
information concerning the condition (financial or other), earnings, business affairs, business prospects, properties or results of
operations of the Company or its subsidiaries. Please refer to our unaudited financial statements for a complete report of our
financial performance and position. None of the Company or any of their members, directors, officers, employees or affiliates
nor any other person accepts any liability (in negligence, or otherwise) whatsoever for any loss howsoever arising (including,
without limitation for any claim, proceedings, action, suits, losses, expenses, damages or costs) from any use of this
presentation or its contents or otherwise arising in connection therewith.
This presentation contains statements that constitute forward-looking statements which involve risks and uncertainties. These
statements include descriptions regarding the intent, belief or current expectations of the Company with respect to the
consolidated results of operations and financial condition, and future events and plans, of the Company. These statements can
be recognised by the use of words such as “believes”, “expects”, “anticipates”, “intends”, “plans”, “foresees”, “will”, “estimates”,
“projects”, or words of similar meaning. Similarly, statements that describe the Company’s objectives, plans or goals also are
forward-looking statements. All such forward-looking statements do not guarantee future performance and actual results may
differ materially from those in the forward-looking statements as a result of various factors and assumptions. You are cautioned
not to place undue reliance on these forward-looking statements, which are based on the current view of the management of
the Company on future events. The Company does not undertake to revise forward-looking statements to reflect future events
or circumstances. No assurance can be given that future events will occur, that projections will be achieved, or that the
Company’s assumptions are correct.
By accepting and/or viewing the Information, you agree to be bound by the foregoing limitations.

Investor
Relations
Contact
Ambika Goel, CFA SVP- Capital Markets and Investor Relations
Tel: +65 6643 6372
Email: [email protected]
GLP Tianjin Pujia
China