investor booklet -...
TRANSCRIPT

November 2017
Investor
Booklet

Legal Disclaimer
This presentation includes forward-looking statements within the meaning of Section 27A of theSecurities Act of 1933 and Section 21E of the Securities and Exchange Act of 1934. All statementsother than statements of historical facts included in this presentation regarding, among other things,our prospects, plans, financial position and business strategy, may constitute forward lookingstatements. These statements are based on the beliefs and assumptions of our management andon the information currently available to our management at the time of such statements. Forward-looking statements generally include discussions and descriptions other than historical information.These forward-looking statements can generally be identified as such because the context of thestatement will include words such as "trend," "may," "annualized," "should," "outlook," "project,""intend," "seek," "plan," "believe, "anticipate," "expect," "estimate," "potential," "continue," "goal," or"opportunity," the negatives of these words, or similar words or expressions. The forward-lookingstatements made herein are only made as of the date of this presentation and we undertake noobligation to publicly update such forward looking statements to reflect subsequent events orcircumstances. Although we believe that the expectations reflected in these forward-lookingstatements are reasonable, these expectations may not prove to be correct. All subsequent writtenand oral forward-looking statements attributable to us or persons acting on our behalf are expresslyqualified in their entirety by the cautionary statements included in this document. These forward-looking statements are subject to risks and uncertainties that are discussed in greater detail in theCompany’s filings with the Securities and Exchange Commission, including our Annual Reports onForm 10-K and Quarterly Reports on Form 10-Q, that may cause actual results to differ materially.
1

Continental is a leading, high margin manufacturer of
gypsum wallboard and complementary finishing products
• Market position: Leader in core geographic regions
• Plants: 3 drywall manufacturing facilities (owned)
2 joint compound facilities (owned)
1 joint venture paperboard liner facility
• Manufacturing: 3.3 billion square feet; operated at
79% capacity utilization YTD 2016
• Key financials: Total revenue of $476 mm
(LTM 9/30/2017) Adj. EBITDA of $133 mm (27.9% margin)
• Headquarters: Herndon, Virginia
Company Overview
2016 Sales Breakdown by Country
Geographic Footprint
Canada North Central North East South East
Corporate Wallboard Plants Joint Compound
Paperboard Liner
2 Source: Company filings.
United States93%
Canada7%

3
Company Highlights
Focused on Operational Excellence with New, Low-Cost Production1
Well Positioned to Capitalize on Construction Recovery2
Favorable Industry Dynamics3
Strong Margins and Cash Flow Drive Value Enhancing Opportunities4
• Among the newest capacity in the industry results in higher operating efficiency and lower capex needs
• Strategic locations near raw material sources and customer end markets drive lower material and freight costs
• Strong positions in markets growing faster than the national average, but still well below peak
• U.S housing starts recovering but remain well below 50-year average of 1.4 million
• Repair and remodel provides stable demand base; housing and commercial embed significant potential upside
• Market leader in key geographic regions with an estimated 30-35% average market share in key major markets
• As of 2016, industry capacity 16% below prior peak level.
• Significant EBITDA and margin growth through low-cost, efficient operating structure
• Strong cash flow generation and low capex drives deleveraging and other value enhancing opportunities
• Stock repurchase program of up to $200 million through December 2018.

Sustainable
Platform for
EBITDA and
Cash Flow
Generation
4
Solid Platform for EBITDA and Cash Flow Generation
Attractive Market Position Low-Cost, Efficient Capacity
Strategic Raw Material Supply Strict Capital Deployment
• Over 55% of US wallboard demand in
CBPX addressable markets
• Plants strategically located close to
end markets
• Strong customer relationships in
growing markets
• Seven Hills JV provides captive paper
supply
• Natural gas hedges in place for ~50%
of energy needs
• Primary and secondary synthetic
gypsum supply contracts provide
ample gypsum for long term horizon
• One of lowest industry costs per unit
• Invested over $587mm in state-of-the-art
capacity from 2000 to 2016, creating
some of the fastest industry line-speeds
• Energy consumption per MSF reduced
by 18% since 2007
• New ERP system implemented below
budget and ahead of schedule in 2014
• Low sustaining capital needs given
recent investments
• Strategic capex program focused on high
return projects with <3 year paybacks
• Repurchased $98M of shares through the
company’s $200M stock repurchase
program as of September 30, 2017.
• Net debt / LTM Adjusted EBITDA ratio
improved to 1.6x as of September 2017
Springfield
Nashville
Knoxville
Richmond
Charlottesville
HuntingtonCincinnati
Columbus
Cleveland
Detroit
GrandRapidsMilwaukee
Chicago
De Moines
Kansas City
St. Louis
Memphis
Louisville
Indianapolis
Toronto
Silver Grove
Source: Management estimates, public filings.5
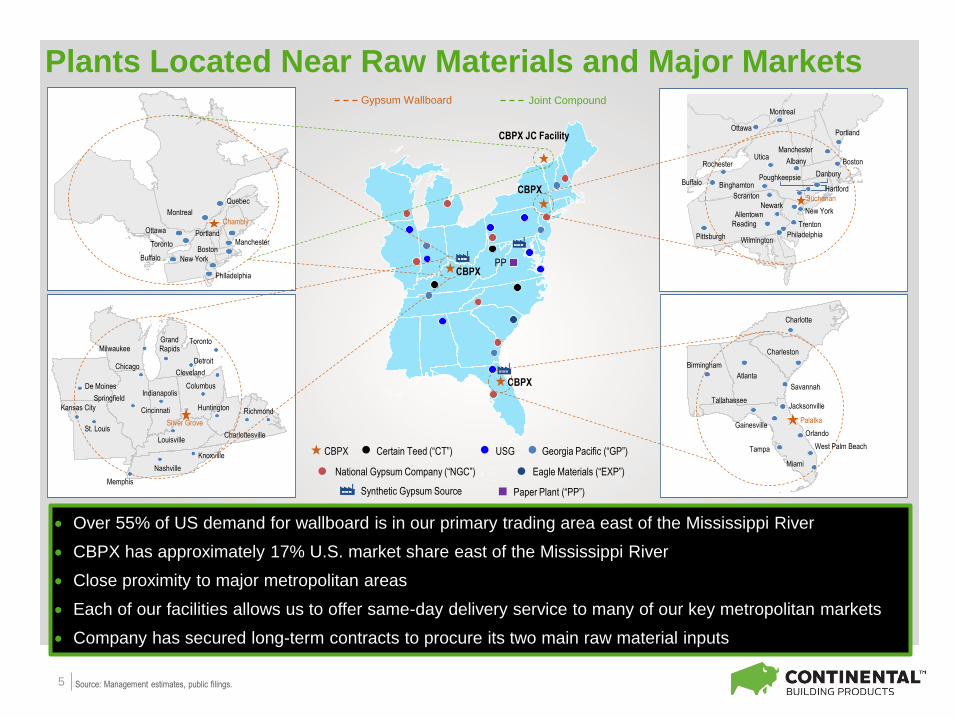
Over 55% of US demand for wallboard is in our primary trading area east of the Mississippi River
CBPX has approximately 17% U.S. market share east of the Mississippi River
Close proximity to major metropolitan areas
Each of our facilities allows us to offer same-day delivery service to many of our key metropolitan markets
Company has secured long-term contracts to procure its two main raw material inputs
Plants Located Near Raw Materials and Major Markets
PortlandManchester
Philadelphia
Buffalo New York
Ottawa
Montreal
Quebec
Toronto
Chambly
Boston
Pittsburgh
Reading
Ottawa
Montreal
Portland
ManchesterUtica
Albany
Buchanan
New YorkNewark
Binghamton
ScrantonHartford
Allentown
Trenton
PhiladelphiaWilmington
Poughkeepsie Danbury
Boston
Buffalo
Rochester
Charlotte
Charleston
Birmingham
Atlanta
Savannah
JacksonvilleTallahassee
Gainesville
Tampa
Orlando
West Palm Beach
Miami
Palatka
CBPX
CBPX
CBPX
CBPX JC Facility
Eagle Materials (“EXP”)National Gypsum Company (“NGC”)
USGCertain Teed (“CT”) Georgia Pacific (“GP”)CBPX
PP
Paper Plant (“PP”)Synthetic Gypsum Source
Gypsum Wallboard Joint Compound
6
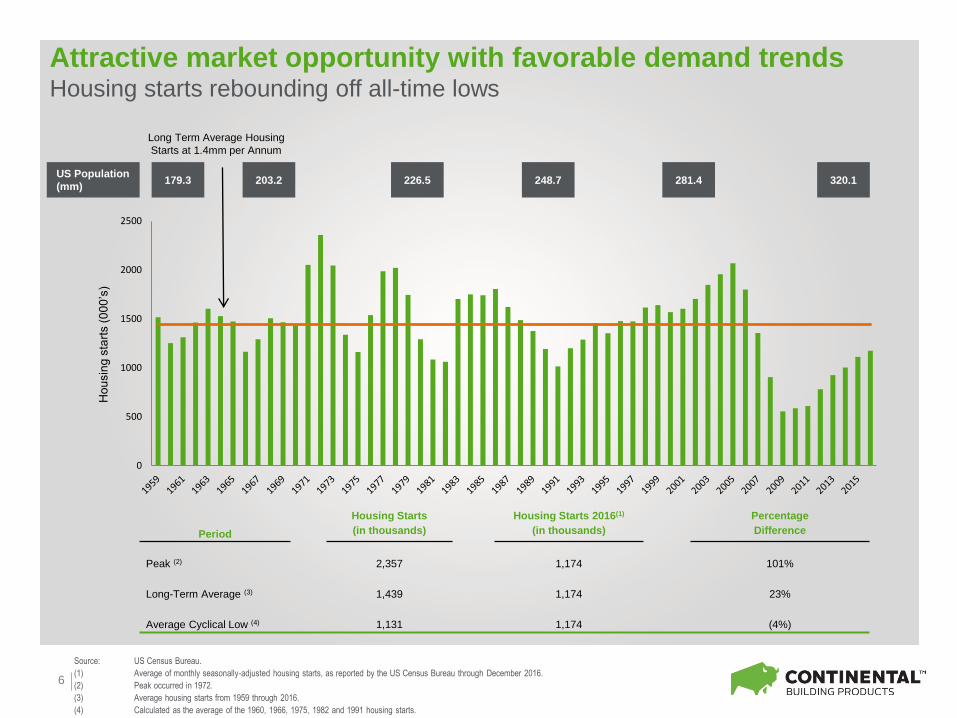
Attractive market opportunity with favorable demand trends Housing starts rebounding off all-time lows
US Population
(mm)179.3 203.2 226.5 248.7 281.4 320.1
Long Term Average Housing
Starts at 1.4mm per Annum
Period
Housing Starts
(in thousands)
Housing Starts 2016(1)
(in thousands)
Percentage
Difference
Peak (2) 2,357 1,174 101%
Long-Term Average (3) 1,439 1,174 23%
Average Cyclical Low (4) 1,131 1,174 (4%)
Source: US Census Bureau.
(1) Average of monthly seasonally-adjusted housing starts, as reported by the US Census Bureau through December 2016.
(2) Peak occurred in 1972.
(3) Average housing starts from 1959 through 2016.
(4) Calculated as the average of the 1960, 1966, 1975, 1982 and 1991 housing starts.
Hou
sin
g s
tart
s (
00
0’s
)
0
500
1000
1500
2000
2500

0.0
500
1,000
1,500
2,000
0
5
10
15
20
25
30
35
40
1990 1992 1994 1996 1998 2000 2002 2004 2006 2008 2010 2012 2014 2016
(BS
F)
(th
ou
sa
nd
s)
Source: Gypsum Association (wallboard demand) and U.S. Census Bureau (housing starts).
Upside to Wallboard Demand Highly Correlated To
Improving Housing Starts
7
New Housing Starts
Wallboard Demand
New Housing Starts Correlation = 91%
8
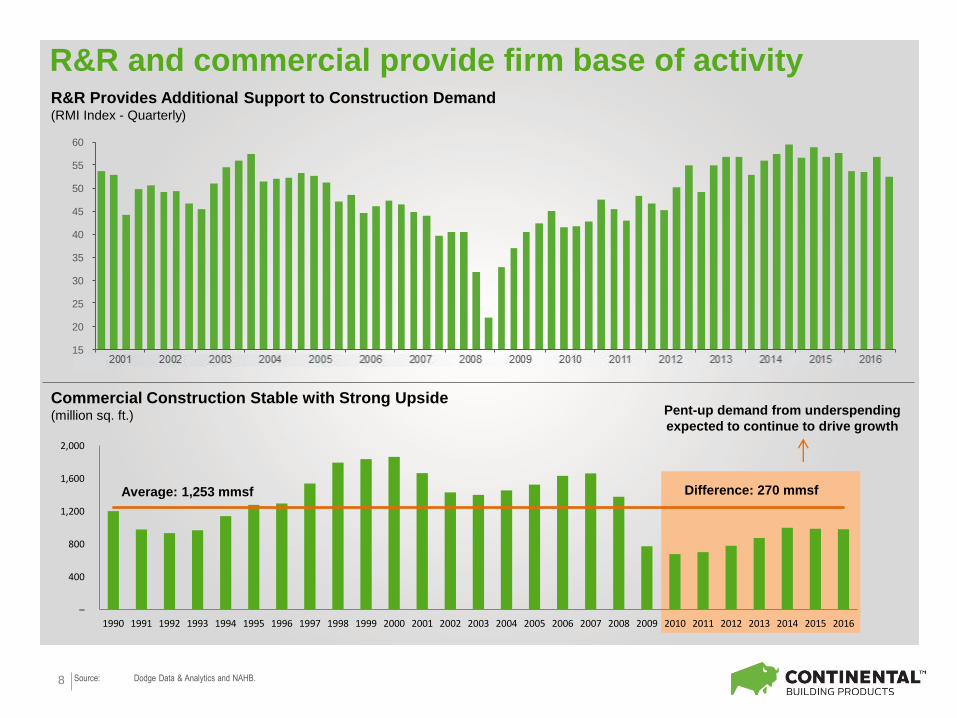
R&R and commercial provide firm base of activityR&R Provides Additional Support to Construction Demand(RMI Index - Quarterly)
Commercial Construction Stable with Strong Upside(million sq. ft.)
Average: 1,253 mmsf Difference: 270 mmsf
Pent-up demand from underspending
expected to continue to drive growth
Source: Dodge Data & Analytics and NAHB.
15
20
25
30
35
40
45
50
55
60
2001 2002 2003 2004 2005 2006 2007 2008 2009 2010 2011 2012 2013 2014 2015 2016
–
400
800
1,200
1,600
2,000
1990 1991 1992 1993 1994 1995 1996 1997 1998 1999 2000 2001 2002 2003 2004 2005 2006 2007 2008 2009 2010 2011 2012 2013 2014 2015 2016

39.6
33.4
2008 2017
187
129
96 104 99 98
124
146 155 154
144
87%
65% 60%
54% 53% 55% 58% 63% 66% 67% 79%
2006 2007 2008 2009 2010 2011 2012 2013 2014 2015 2016
9
Industry dynamics remain favorable
Industry Capacity Rationalized
(Billions of sq. ft.)
CBPX Capacity Utilization and Mill-Net Price Still Below Peak
(CBPX Mill-Net price per thousand sq. ft., MSF)
1997 2016
(Capacity Share) (Capacity Share)
Briar
26%
21%16%
13%
10%
10%
4%
31%
22%19%
5%
5%
4%
4%
3% 2%
Source: Management estimates, Gypsum Association and public corporate presentations.

10
Wallboard volume growth expected as construction recovery continues
New, low-cost production generates high margins and operating leverage
Positive Pricing Actions
Generating strong cash flow
• Housing cycle viewed as having a longer recovery as starts remain at trough levels seen in previous cycles
• Repair and remodel has provided consistent base demand
• New commercial recovering from historical lows
• Substantially improved cost structure with a strong commitment to operational excellence
• Significant past capex investments drive strong operating leverage and EBITDA growth
• Average mill-net price up approximately 50% from 2011 to 2016 and remains well below previous peak levels
• Strong cash flow generation with near term focus on balance sheet strength and value enhancing opportunities
• Solid track record of disciplined deployment of cash flows to maximize shareholder value
2
1
4
3
Financial and Operational Overview

Source: Company filings.
Volume(millions of square feet, mmsf)
Mill-Net Price Per MSF
Total Net Sales($ in millions)
11
Capacity Utilization
Total Capacity: 3,300 mmsf 740 mmsf of head room
Improving Top Line with Plenty of Headroom for Growth
$124
$146 $155 $154
$144
2012 2013 2014 2015 2016
1903
2161 2180 2199
2560
58%
65% 66% 67%
79%
2012 2013 2014 2015 2016
$311
$402 $425 $422
$461
2012 2013 2014 2015 2016
Adjusted EBITDA($ in millions)
Total Capex($ in millions)
Adjusted EBITDA - Capex($ in millions)
12
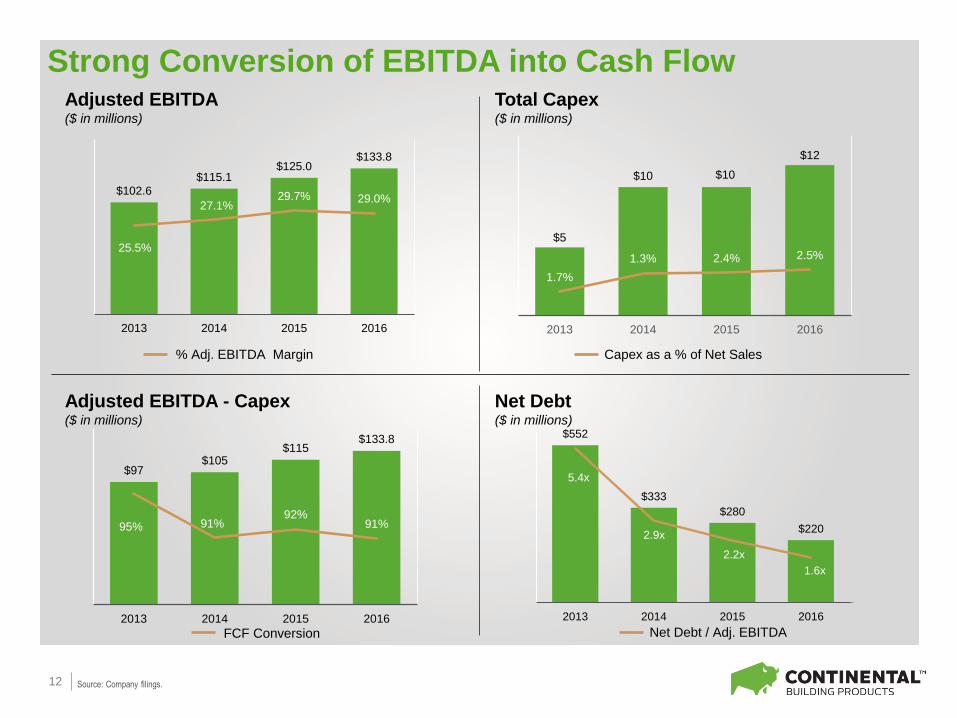
Capex as a % of Net Sales% Adj. EBITDA Margin
Strong Conversion of EBITDA into Cash Flow
Source: Company filings.
Net Debt($ in millions)
Net Debt / Adj. EBITDAFCF Conversion
$102.6
$115.1 $125.0
$133.8
25.5%
27.1% 29.7% 29.0%
2013 2014 2015 2016
$5
$10 $10
$12
1.7%
1.3% 2.4% 2.5%
2013 2014 2015 2016
$97 $105
$115 $133.8
95% 91%92%
91%
2013 2014 2015 2016
$552
$333
$280
$220
5.4x
2.9x
2.2x
1.6x
0
1
2
3
4
5
6
2013 2014 2015 2016

Strong Cash Flows Driving Deleveraging and Other
Value Enhancing Opportunities
13
($ in millions) 9/30/2016 9/30/2017
Cash $35 $60
Revolver -- --
1st lien term loan due 2021 274 272
Original issue discount (2) (2)
Total debt $272 $270
Book equity 302 299
Total capitalization $574 $568
Net Debt $238 $210
LTM Adjusted EBITDA $133 $133
Credit Statistics
Net debt / LTM Adj. EBITDA 1.8x 1.6x
Liquidity $108 $133
Source: Company filings.
Since 2015, the Company has repurchased a total of approximately 4.7 million shares for
$97.8 million as of September 30, 2017.

14
Recent Operating and Financial Performance
Source: Company filings.
Q3 2017
Vs
($ in millions) 2015 2016 Q3 2016 Q3 2017 Q3 2016
Mill-Net Price ($/MSF) $153.70 $143.83 $144.34 $144.90 +0.4%
Wallboard Volume (MMSF) 2,199 2,560 634 644 +1.6%
Total Net Sales $422 $461 $115 $117 +1.7%
Operating Income $44 $87 $19 $20 +5.3%
EBITDA $125 $134 $30 $32 +6.7%
% Margin 29.7% 29.0% 26.6% 27.3% +2.6%
Depreciation and Amortization $51 $47 $12 $12 NM
Capital Expenditures $10 $12 $3 $6 +100.0%

15
Jay Bachmann
President, CEO
13 years of experience with the Company
Prior positions
– Chief Financial Officer, USA (Lafarge NA)
– Senior Vice President Finance - Investor Relations (Lafarge SA)
Dennis Schemm
Senior VP, CFO
Joined the Company in 2015 with over 20 years of industry experience
Prior positions
– Vice President of Global Finance for Armstrong Flooring (Armstrong Worldwide)
– Director of Global Financial Planning and Analysis at Gilbarco, a Danaher
Company
– Senior Financial Roles at Monsanto Company
Tim Power
Senior VP, General
Counsel
16 years of experience with the Company
Prior positions
– Vice President and Associate General Counsel (Lafarge NA)
– Assistant General Counsel (Lafarge NA)
Bruce Major
Senior VP,
Manufacturing and
Strategic Sourcing
Joined the Company in 2016 with 17 years in Gypsum Operations Management
Prior positions
– VP – Manufacturing, Lafarge Cement U.S.
– SVP – Manufacturing, Lafarge Gypsum Division
Experienced and Highly Aligned Management Team

Appendix

17
Non-GAAP Reconciliations
Reconciliation of Net Income to Adjusted EBITDA ($ in Thousands)
Source: Company filings.
(a) Represents expense recognized pursuant to the LTIP funded by LSF8, an affiliate of Lone Star.
September 30, 2017 September 30, 2016
Net Income 10,987$ 6,210$
Adjustments:
Other expense/(income), net (146) 5,900
Interest expense, net 2,988 3,146
Losses from equity method investment 204 291
Income tax expense 5,674 3,014
Depreciation and amortization 12,057 11,868
EBITDA—Non-GAAP Measure 31,764 30,429
Long Term Incentive Plan Funded by Lone Star (a) — —
Adjusted EBITDA—Non-GAAP Measure 31,764 30,429
Adjusted EBITDA Margin - Adjusted EBITDA as a percentage of net sales -
Non-GAAP Measure 27.3% 26.6%
For the Three Months Ended
(in thousands)

18
Non-GAAP Reconciliations (cont’d)
Reconciliation of Operating Income to Adjusted EBITDA ($ in Thousands)
Source: Company filings.
September 30, 2016 December 31, 2016 March 31, 2017 June 30, 2017 September 30, 2017
Operating Income - GAAP Measure $ 18,561 $ 22,801 $ 21,687 $ 21,620 $ 19,707
Depreciation and Amortization 11,868 10,990 11,286 12,474 12,057
EBITDA - Non-GAAP Measure $ 30,429 $ 33,791 $ 32,973 $ 34,094 $ 31,764
Long Term Incentive Plan funded by Lone Star - - - - -
Adjusted EBITDA - Non-GAAP Measure $ 30,429 $ 33,791 $ 32,973 $ 34,094 $ 31,764
Adjusted EBITDA Margin - Adjusted EBITDA as a
percentage of net sales - Non-GAAP Measure 26.6% 28.6% 27.3% 28.3% 27.3%
For the Quarter Ended