investor day – asia region lausanne, june 23,...
TRANSCRIPT

Investor Day – Asia Region Lausanne, June 23, 2010
Matteo PellegriniPresident, Asia RegionPhilip Morris International

2
Agenda
● Operating environment
● PMI strategic priorities in Asia
● Brand portfolio and innovations
● Key Asia markets: highlights
● Questions & Answers

3
Singapore
Korea
Philippines
Taiwan
Hong Kong
Thailand
Australia
Malaysia
Indonesia
China
Vietnam
India
Pakistan
Japan
Bangladesh
New Zealand
Asia accounts for 56% of the world’s populationAnd 60% of the world’s cigarette volume…
• Population : 3.8 billion
• Cigarette Volume: 3.4 trillion
Korea8%
Others15%
Japan20%
Philippines7%
Vietnam7%
Pakistan6%
India9%
Indonesia22%Bangladesh
6%
Cigarette Volume
Note: Cigarette volumes reflect 2009Source: Global Insights
: 1.2 trillion units (Excl. – China)
Operating Environment 2009

4
GDP Per Capita in 15 Key Markets
43.9
39.9
36.4
30.4
17.2 16.5
7.0
3.9 3.5 2.3 1.8 1.1 1.0 0.9 0.60
50
Aus
tralia
Japa
n
Sing
apor
e
Hon
g Ko
ng
Sout
h K
orea
Taiw
an
Mal
aysi
a
Thai
land
Chi
na
Indo
nesi
a
Philip
pine
s
Viet
nam
Indi
a
Pak
ista
n
Bang
lade
sh
($ 000)
Source: Global Insights
Asia: $ 4.0
USAEuropean Union Asia Pacific
US $ 46,300US $ 33,100US $ 4,000

5
2.0 2.3
(5.2)
2.0
(1.2)
4.1 3.8 4.05.1 4.7
(7)
0
7
2006 2007 2010 F
(7)
0
7
2.6 2.4
1.3
3.34.7
4.84.2
5.65.2
4.4
0
7
2006 2007 2008 2009 2010 F0
7
5.56.3 6.1
4.55.6
10.39.1
8.4 7.9 8.1
0
12
2006 2007 2008 2009 2010 F0
12
Japan Australia
Indonesia
GDP Growth and Unemployment Rates
GDP Growth RateUnemployment Rate Philippines
Source: Global Insights
5.33.8
0.9
4.27.1
8.0 7.4 7.5 7.37.3
0
12
2006 2007 2008 2009 2010 F0
12
(%)
(%) (%)
(%)
2008 2009

6
226224212193
173
2005 2006 2007 2008 2009
(billions units)
4,9415,505 5,648
6,185 6,528
2005 2006 2007 2008 2009
($ million)
Shipment Volume Net Revenues
Growth (%)32.6 11.4 2.6 9.5 5.51.15.89.411.621.7
Growth (%)
2005 - 2009 CAGR = 6.9% 2005 - 2009 CAGR = 7.2%
Asia Region Results
Source: PMI Financials

7
Asia Region Results
2,436
2,0571,8031,8471,801
2005 2006 2007 2008 2009
($ million)
Operating Companies Income
Growth (%)38.8 2.6 (2.4) 14.1 18.4
2005 - 2009 CAGR = 7.8%
Source: PMI Financials

8
1,873
1,590
0
2,000
Q1 2009 Q1 2010
Asia Region Q1, 2010 Results
56.863.2
0
100
Q1 2009 Q1 2010
Shipment Volume Net Revenues
Growth: +11.4% + 0.6% (excl. acquisitions)
+17.8 % +2.3 % (excl. curr & acq)
(billion units) ($ million)
Source: PMI Financials
724661
0
850
Q1 2009 Q1 2010
Operating Companies Income
($ million)
+9.5 % (2.0) % (excl. curr & acq)

9
PMI Regional Market Share
Note: PMI market share includes FTC contribution in the Philippines in Q1, 2010. Asia excludes PRC, North Korea and MyanmarSource: PMI estimates
16.8
19.221.1
0
25
2006 2007 2008 2009 2010 Q1
(%)PMFTCLakson

10
7.1
3.5 3.5
1.8 1.50.3
1.50.3 0.3 0.1
(0.2) (0.5)PH KR HK AU SG TW JP TH MY VN
2010 Q1 SoMPH KR HK AU SG TW JP TH MY VN ID PK
39.9 17.4 53.3 39.8 48.1 7.0 24.2 20.4 14.5 0.9 28.8 41.6
Share growth in the majority of markets in Q1
Impact from Business
Combination
Regional Market Share Changes in Q1, 2010
ID PK
Source: PMI estimates
11
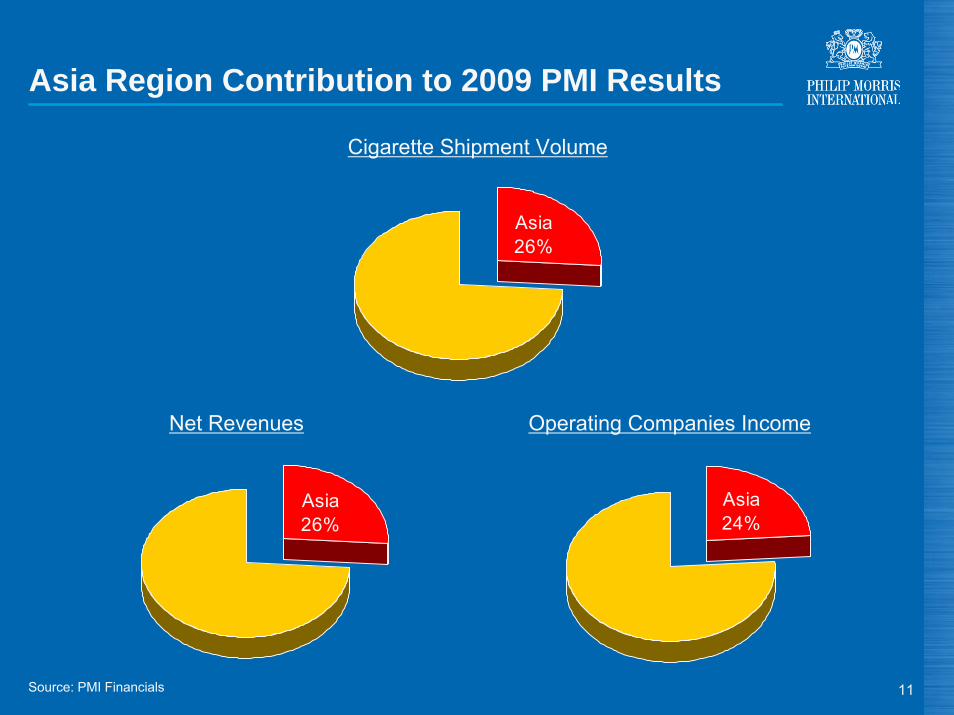
Asia24%
Asia26%
Asia Region Contribution to 2009 PMI Results
Asia26%
Cigarette Shipment Volume
Operating Companies IncomeNet Revenues
Source: PMI Financials

12
Strategic Priorities
● Marlboro and the new architecture
● Innovation pipeline

13
Strategic Priorities
● Marlboro and the new architecture
● Innovation pipeline
● Regulatory and fiscal environments

14
Strategic Priorities
● Marlboro and the new architecture
● Innovation pipeline
● Regulatory and fiscal environments
● Investing for growth:- Philippines
- India

15
Marlboro Architecture

16
Marlboro Black Menthol
(a) Includes the performance of Marlboro Black Menthol OneSource: A.C. Nielsen, Tobacco Institute of Japan and PMI estimates
Marlboro Black Menthol launched across Asia
0.2%
0.6%0.8%
1.3%
2.5%2.9%
Hong Kong
Macau Japan(a) Malaysia Phil. Indonesia
Marlboro Black Menthol Share of Market (%) Q1, 2010
17
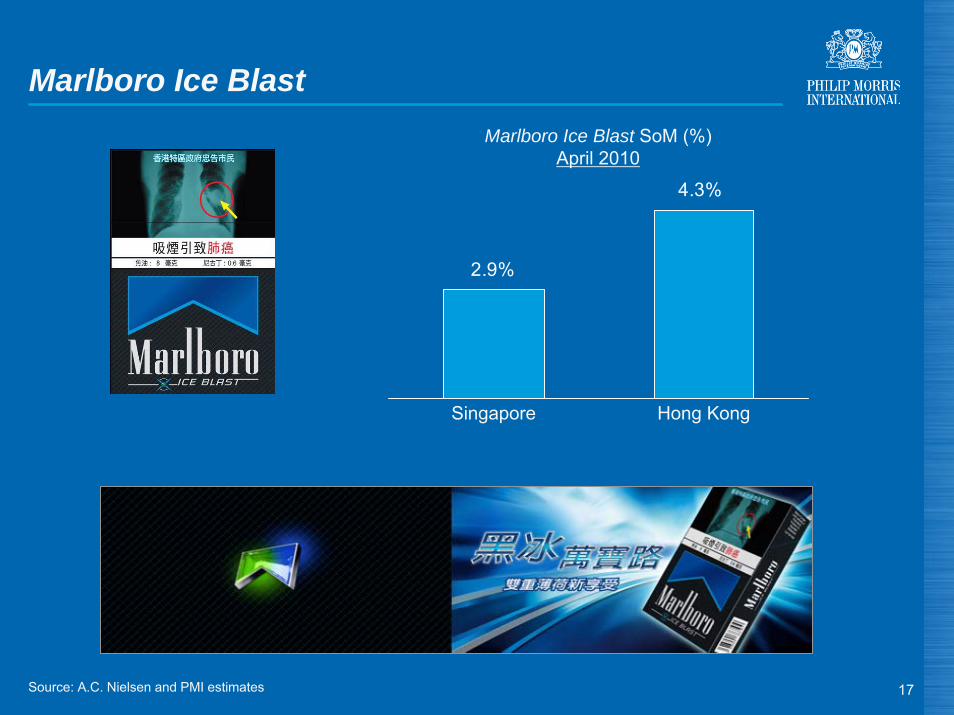
Marlboro Ice Blast
Source: A.C. Nielsen and PMI estimates
2.9%
4.3%
Marlboro Ice Blast SoM (%)April 2010
Hong KongSingapore

18
69.8
Marlboro Performance 2009
2.5
0.8
1.3
1.3
1.4
1.4
24.8
5.6
11.7
19.0
0 5 10 15 20 25 30 35
Others
Singapore
China
Hong Kong
Malaysia
Thailand
Korea
Indonesia
Philippines
Japan
Total Asia
(6.5)%
(14.8)%
+0.8%
+5.1%
+7.3%
+22.4%
(4.7)%
+9.2%
+87.7%
(16.6)%
+4.3%
(billion units) Shipment Volume Growth vs.2008
Source: PMI Financials

19
0.8
0.2
0.2
0.3
0.4
0.4
6.4
1.4
2.9
5.2
0 1 2 3 4 5 6 7
Others
Singapore
China
Hong Kong
Malaysia
Thailand
Korea
Indonesia
Philippines
Japan
Growth vs.Q1 2009
Total Asia 18.2
Shipment Volume
Marlboro Performance Q1, 2010
+16.2%
+1.7%
(1.0)%
+21.9%
+0.0%
+12.0%
+2.5%
+8.9%
+100%
(6.4)%
+7.4%
(billion units)
Source: PMI Financials

20
Japan
● Sizeable but declining market:- 25% smoking incidence- Average consumption of 20 cigarettes / day- Aging population
● Strong and balanced portfolio across the main price segments
● Continued innovation pipeline● Strong Marlboro share growth momentum● Pricing freedom key to increasing profitability

21
Japan – Industry Volume
327 321 314 302 294 286 274 261 249 236
2000 2001 2002 2003 2004 2005 2006 2007 2008 2009
(billions units)
Source: Tobacco Institute of Japan
2000-2009 CAGR = (3.6)%

22
Japan – Taxation and Pricing
● 40% excise tax increase unprecedented ● Significant market contraction anticipated ● Based on JT’s price submission to the Ministry of Finance,
significant unit margin increases expected for the industry

23
Japan – Taxation and Pricing
● 40% excise tax increase unprecedented ● Significant market contraction expected● Based on JT price submission to MOF, significant unit
margin increases expected for the industry● Ministry of Finance approved PMJ’s request to increase
prices in June:- Important step towards ultimately obtaining complete pricing
freedom in market- Decision not to implement due to competitive situation
● Key objective for PMJ is to unlock pricing potential:- Improve margins and profitability

24
Japan – Market Shares
Source: Tobacco Institute of Japan
BAT
PMI
JT
21.4 22.5 23.6 24 24.4 24.8 24.7 24.3 23.9 24 24.2
8.0 8.2 8.7 8.6 9.1 9.9 10.4 10.6 10.5 10.57.8
69.4 67.9 67.0 66.6 65.8 65.0 64.8 65.0 65.0 64.8
70.7
0
72
2000 2001 2002 2003 2004 2005 2006 2007 2008 2009 2010Q1
(%)

25
7.0
8.0
8.4
8.99.2
9.79.9 9.9
10.1
10.510.8
6
11
2000 2001 2002 2003 2004 2005 2006 2007 2008 2009 2010Q1
Japan – Marlboro
Marlboro Share of Market(%)
Source: Tobacco Institute of Japan
26
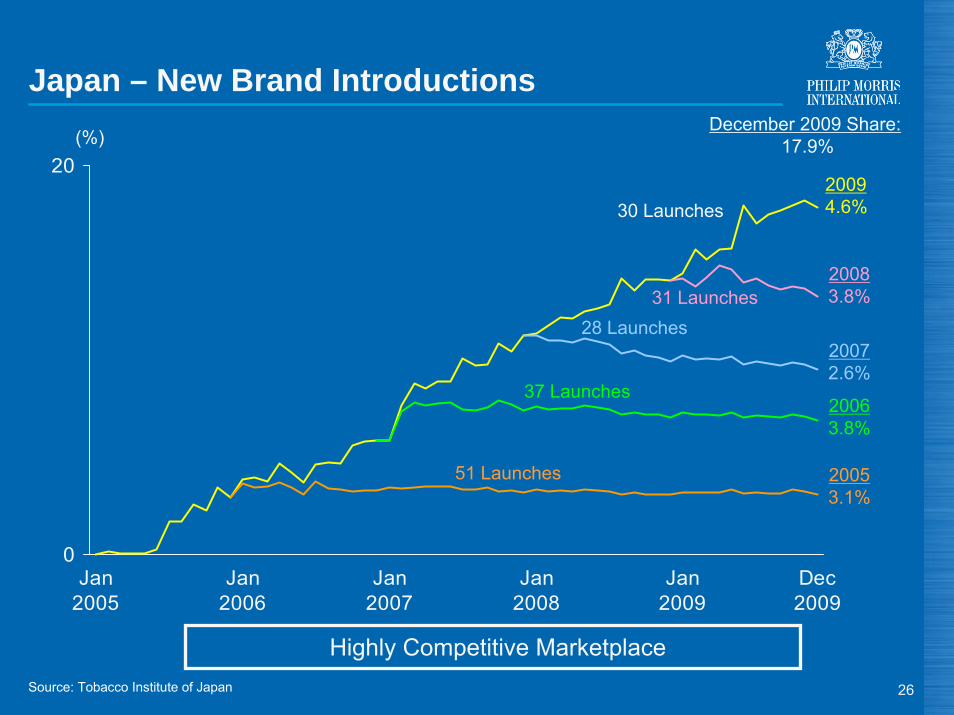
0
20
Jan2005
Jan2006
Jan2007
Jan2008
Jan2009
Dec2009
30 Launches
31 Launches28 Launches
37 Launches
51 Launches
20094.6%
20083.8%
20072.6%
20063.8%
20053.1%
December 2009 Share:17.9%
Highly Competitive Marketplace
(%)
Source: Tobacco Institute of Japan
Japan – New Brand Introductions

27
Japan – Recent PMJ Launches
Positive consumer response to PMI’s innovative product offerings
● PMJ launched attractive new offerings● Cumulative market share of PMI’s 2009 launches April
2010 YTD: 1.7%
Source: Tobacco Institute of Japan

28
Australia
● 25% excise tax increase effective April 30, 2010● Plain packaging initiative announced by government● Continue to engage government and relevant stakeholders

29
45.5 45.4 45.443.2
17.2 16.7 16.6 16.9
46.0
17.7
10
50
2006 2007 2008 2009 2010 Q1
Source: PwC Data Exchange
BAT
PMI
IMT
(%)
Australia – Market Shares
Business performing well
37.2 37.7 37.9 39.836.2

30
Australia – PMI Brand Shares
2.2
3.6
0.5 1.5
2.53.0
2.4 2.3
2.2 2.2
37.2 37.7 37.9 39.8
16.5 16.3 16.1 16.9
14.3 13.9 14.3
36.2
16.5
14.4 14.5
2006 2007 2008 2009 2010 Q1
(%)PMI
Marlboro
Longbeach
Peter Jackson
choice
Alpine
Z
2.4 2.5
2.2 2.22.2
Source: PwC Data Exchange

31
Indonesia
● Sampoerna continues to be the market leader● Strong and balanced portfolio:
- A Mild the leading franchise since Q1, 2009- Number of other strong local offerings
● Record Marlboro volume in 2009● Continued industry growth
Source: A.C. Nielsen and PMI Financials

32
Indonesia – Industry Volume
217229
237247
260
2005 2006 2007 2008 2009
(billion units)
2005-2009 CAGR = 4.6%
Source: PMI estimates

33
28.3 28.029.5 29.1 28.8
25.323.1
22.0 21.3 21.4
20.2 19.718.1
19.6 19.5
6.47.7 8.3 7.9 8.4
26.4
27.4
21.2
5.7
0
32
2005 2006 2007 2008 2009 2010 Q1
GudangGaram
BAT / Bentoel
Djarum
PMI / Sampoerna
(%)
Source: A.C. Nielsen
Indonesia – Market Shares

34
Indonesia – Price Segmentation
Low-price segment continues to grow Source: A.C. Nielsen
37.4 36.4 35.8
32.6
21.520.3
18.218.619.9
23.7
39.7
33.9
21.1
18.6
20.8
17.5
20.7
25.4
2005 2006 2007 2008 2009 2010 Q1
High
Premium
Mid
Low
(%)
22.5 22.9 23.221.7
23.8
23.8
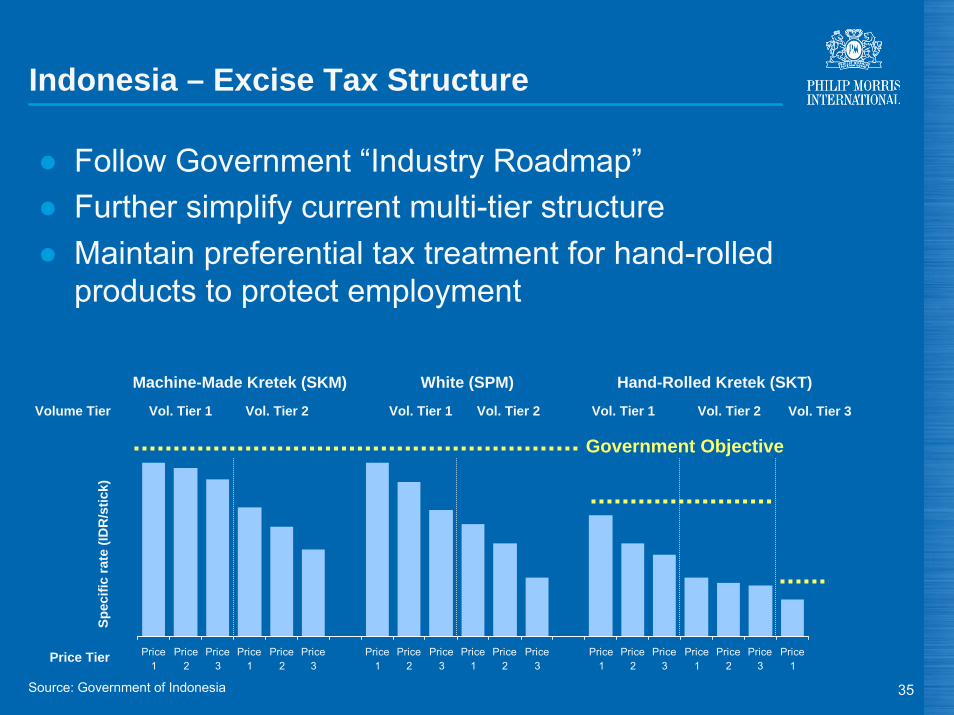
35
Indonesia – Excise Tax Structure
● Follow Government “Industry Roadmap”● Further simplify current multi-tier structure● Maintain preferential tax treatment for hand-rolled
products to protect employment
Price1
Price2
Price3
Price1
Price2
Price3
Price1
Price2
Price3
Price1
Price2
Price3
Price1
Price2
Price3
Price1
Price2
Price3
Price1
Vol. Tier 1 Vol. Tier 2 Vol. Tier 3Vol. Tier 1 Vol. Tier 2 Vol. Tier 1 Vol. Tier 2
Hand-Rolled Kretek (SKT)White (SPM)Machine-Made Kretek (SKM)
Spec
ific
rate
(ID
R/s
tick)
Volume Tier
Price Tier
Government Objective
Source: Government of Indonesia
36
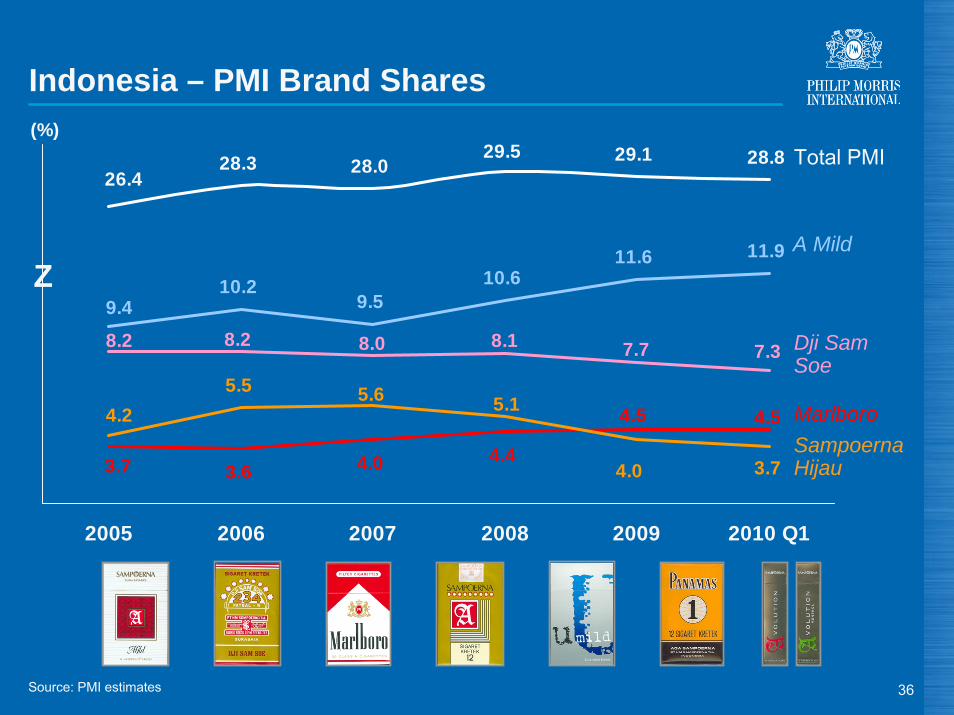
Indonesia – PMI Brand Shares
10.29.5
10.611.6 11.9
5.5
9.4
7.37.78.18.08.2 8.2
4.54.5
3.7 3.6 4.0 4.4 3.7
5.1
4.0
4.25.6
28.3 28.029.5 29.1 28.8
26.4
2005 2006 2007 2008 2009 2010 Q1
(%)Total PMI
Marlboro
A Mild
Dji Sam Soe
Sampoerna Hijau
Z
Source: PMI estimates

37
Premium
Indonesia – Recent Launches
Mid
Low

38
Korea
● Sizeable, uptrading and dynamic market● Tremendous growth momentum

39
Korea
● Sizeable, uptrading and dynamic market● Tremendous growth momentum● Strong and balanced portfolio:
- Marlboro: No.1 brand in Legal Age (min.19) to 24- Parliament: Fastest growing brand in the market- Virginia Slims: > 50% of above premium segment
Source: PMI Financials, General Consumer Tracking Study (GCTS) and Hankook Research

40
Korea
● Sizeable, uptrading and dynamic market● Tremendous growth momentum● Strong and balanced portfolio:
- Marlboro: No.1 brand in Legal Age (min.19) to 24- Parliament: Fastest growing brand in the market- Virginia Slims: > 50% of above premium segment
7.59.0
11.3
13.6
2006 2007 2008 2009
20%24%
21%
Source: PMI Financials, General Consumer Tracking Study (GCTS) and Hankook Research
Volume(billion units)

41
8.69.9
17.416.9 17.0 17.1
3.3 4.0 4.97.0
11.814.4
17.3
15.4
6.0
71.2 69.166.0
60.162.3
2006 2007 2008 2009 2010 Q1
KT&G
BAT
JTI
PMIZ
Source: Hankook Research
Korea – Market Shares
(%)

42
4.2
22.4
SoM LA (Min 19)-24Smoker share
5.9
4.2
3.0
1.92.0
7.0
0
8
2001 2002 2003 2004 2005 2006 2007 2008 2009 2010Q1
Source: Hankook Research and GCTS 2009
Korea – Marlboro
Marlboro Share of Market(%)
5.9
26.6
SoM LA (Min 19)-24Smoker share
2007
2009(%)
(%)

43
Korea – Parliament
Source: Hankook Research and GCTS 2009
Parliament Share of Market(%)(%)
(%)
1.95.0
SoM LA (Min 19)-24Smoker share
4.3
12.4
SoM LA (Min 19)-24Smoker share
2007
2009
5.7
0.1 0.2 0.5
1.9
4.3
0
7
2001 2002 2003 2004 2005 2006 2007 2008 2009 2010Q1

44
Korea – New Factory
● Support growth of portfolio● Regulatory requirement for
primary facility (tobacco processing) in Korea
● Factory to be fully operational in 2012

45
● World’s second most populous country:- 1.2 billion people
● 100+ billion unit cigarette industry● Joint venture with Godfrey Phillips India
- Provides platform for PMI to continue growing business in one ofthe major cigarette markets in the world
- Leverage each partner’s strengths in order to continue introducing new products to the market
Source: PMI estimates
India

46
India – Marlboro Gold Advance
Catering to local taste preferences

47
Philippines
● Continued population growth:- 90 million people
● 85 billion unit cigarette market in 2009● Completed new business structure:
- Announced on February 25, 2010- PMI management control and close cooperation with business
partner- Synergies- Complementary product portfolios
● PMFTC Inc. market leader with over 90% share of market
Source: PMI estimates

48
Philippines – Brand Board
PMFTC Others
Premium(27.6%)
Mid(17.8%)
Low(54.6%)
21.9%SoM
5.7%SoM
7.1%SoM
3.8%SoM
1.9%SoM
1.0%SoM
40.0%SoM
9.4%SoM
0.6%SoM
0.3%SoM
0.6%SoM
Source: PMI estimates for Q1,2010

49
Conclusion
● Economic outlook for Asia remains positive● Dynamic brands and strong portfolio via the new Marlboro
architecture and other portfolio innovations● Regulatory and fiscal regimes evolving rapidly and remain
a challenge● Business and organization well-positioned across the
region in order to continue growth momentum

Investor Day – Asia Region Lausanne, June 23, 2010
Questions & Answers

51
Forward-Looking and Cautionary Statements
This presentation and related discussion contain statements that, to the extent they do not relate strictly to historical or current facts, constitute “forward-looking statements” within the meaning of the Private Securities Litigation Reform Act of 1995. Such forward-looking statements are based on current plans, estimates and expectations, and are not guarantees of future performance. They are based on management’s expectations that involve a number of business risks and uncertainties, any of which could cause actual results to differ materially from those expressed in or implied by the forward-looking statements. PMI undertakes no obligation to publicly update or revise any forward-looking statements, except in the normal course of its public disclosureobligations. The risks and uncertainties relating to the forward-looking statements in this presentation include those described under Item 1A. “Risk Factors” in PMI’s Form 10-Q for the quarter ended March 31, 2010, filed with the Securities and Exchange Commission.

52
Glossary of Terms
● References to PMI volumes refer to shipment volume, unless otherwise stated
● Industry volume and market shares are from a number of internal and external sources
● Organic volume refers to volume excluding acquisitions● Net revenues exclude excise taxes● Operating Companies Income (“OCI”) is defined as operating
income before corporate expenses and amortization of intangibles.
● Reconciliations to U.S. GAAP measures are at the end of today’s web cast slides and are posted on our web site
53
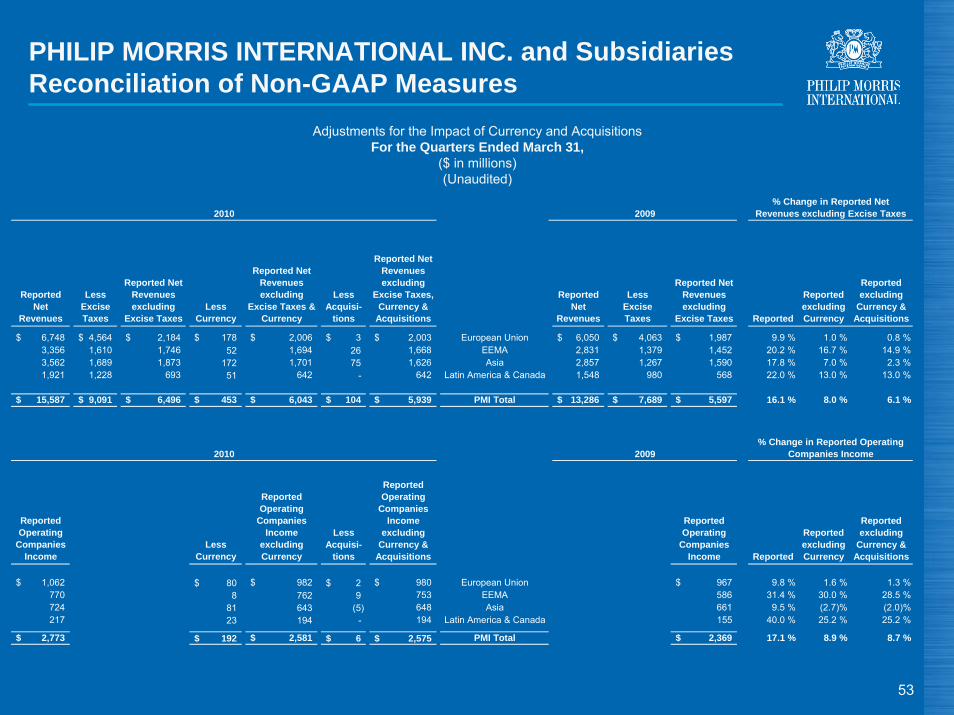
PHILIP MORRIS INTERNATIONAL INC. and SubsidiariesReconciliation of Non-GAAP Measures
Adjustments for the Impact of Currency and AcquisitionsFor the Quarters Ended March 31,
($ in millions)(Unaudited)
Reported Net
Revenues
LessExciseTaxes
Reported Net Revenues excluding
Excise Taxes Less
Currency
Reported Net Revenues excluding
Excise Taxes & Currency
LessAcquisi-
tions
Reported Net Revenues excluding
Excise Taxes, Currency &
Acquisitions
Reported Net
Revenues
LessExciseTaxes
Reported Net Revenues excluding
Excise Taxes
Reported
Reported excluding Currency
Reported excluding
Currency & Acquisitions
6,748$ 4,564$ 2,184$ 178$ 2,006$ 3$ 2,003$ European Union 6,050$ 4,063$ 1,987$ 9.9 % 1.0 % 0.8 %3,356 1,610 1,746 52 1,694 26 1,668 EEMA 2,831 1,379 1,452 20.2 % 16.7 % 14.9 %3,562 1,689 1,873 172 1,701 75 1,626 Asia 2,857 1,267 1,590 17.8 % 7.0 % 2.3 %1,921 1,228 693 51 642 - 642 Latin America & Canada 1,548 980 568 22.0 % 13.0 % 13.0 %
15,587$ 9,091$ 6,496$ 453$ 6,043$ 104$ 5,939$ PMI Total 13,286$ 7,689$ 5,597$ 16.1 % 8.0 % 6.1 %
Reported Operating
Companies Income
LessCurrency
Reported Operating
Companies Income
excluding Currency
LessAcquisi-
tions
Reported Operating
Companies Income
excluding Currency &
Acquisitions
Reported Operating
Companies Income
Reported
Reported excluding Currency
Reported excluding
Currency & Acquisitions
1,062$ 80$ 982$ 2$ 980$ European Union 967$ 9.8 % 1.6 % 1.3 %770 8 762 9 753 EEMA 586 31.4 % 30.0 % 28.5 %724 81 643 (5) 648 Asia 661 9.5 % (2.7)% (2.0)%217 23 194 - 194 Latin America & Canada 155 40.0 % 25.2 % 25.2 %
2,773$ 192$ 2,581$ 6$ 2,575$ PMI Total 2,369$ 17.1 % 8.9 % 8.7 %
2010 2009% Change in Reported Operating
Companies Income
2010 2009% Change in Reported Net
Revenues excluding Excise Taxes

54
Reported Operating
Companies Income
LessAsset
Impairment & Exit Costs
Adjusted Operating
Companies Income
LessCurrency
Adjusted Operating
Companies Income
excluding Currency
LessAcquisi-
tions
Adjusted Operating
Companies Income
excluding Currency &
Acquisitions
Reported Operating
Companies Income
LessAsset
Impairment & Exit Costs
Adjusted Operating
Companies Income Adjusted
Adjusted excluding Currency
Adjusted excluding
Currency & Acquisitions
1,062$ -$ 1,062$ 80$ 982$ 2$ 980$ European Union 967$ (1)$ 968$ 9.7 % 1.4 % 1.2 %770 - 770 8 762 9 753 EEMA 586 - 586 31.4 % 30.0 % 28.5 %724 - 724 81 643 (5) 648 Asia 661 - 661 9.5 % (2.7)% (2.0)%217 - 217 23 194 - 194 Latin America & Canada 155 - 155 40.0 % 25.2 % 25.2 %
2,773$ -$ 2,773$ 192$ 2,581$ 6$ 2,575$ PMI Total 2,369$ (1)$ 2,370$ 17.0 % 8.9 % 8.6 %
2010 2009% Change in Adjusted Operating
Companies Income
PHILIP MORRIS INTERNATIONAL INC. and SubsidiariesReconciliation of Non-GAAP Measures
Reconciliation of Reported Operating Companies Income to Adjusted Operating Companies Income, excluding Currency and AcquisitionsFor the Quarters Ended March 31,
($ in millions)(Unaudited)

55
2010 2009 % Change
Reported Diluted EPS 0.90$ 0.74$ 21.6%
Less:Asset impairment and exit costs - -
Adjusted Diluted EPS 0.90$ 0.74$ 21.6%
Less:Currency Impact 0.06
Adjusted Diluted EPS, excluding Currency 0.84$ 0.74$ 13.5%
PHILIP MORRIS INTERNATIONAL INC. and SubsidiariesReconciliation of Non-GAAP Measures
Reconciliation of Reported Diluted EPS to Adjusted Diluted EPS and Adjusted Diluted EPS, excluding CurrencyFor the Quarters Ended March 31,
(Unaudited)

56
Reconciliation of Operating Cash Flow to Free Cash Flow and Free Cash Flow, excluding CurrencyReconciliation of Operating Cash Flow to Operating Cash Flow, excluding Currency
For the Quarters Ended March 31,($ in millions)(Unaudited)
2010 2009 % Change
Net cash provided by operating activities(1) 1,974$ 1,427$ 38.3%
Less:Capital expenditures 150 145
Free cash flow 1,824$ 1,282$ 42.3%
Less:Currency impact 116
Free cash flow, excluding currenc
PHILIP MORRIS INTERNATIONAL INC. and SubsidiariesReconciliation of Non-GAAP Measures
(1) Operating cash flow
y 1,708$ 1,282$ 33.2%
2010 2009 % Change
Net cash provided by operating activities(1) 1,974$ 1,427$ 38.3%
Less:Currency impact 130
Net cash provided by operating activities, excluding currency 1,844$ 1,427$ 29.2%

57
Reported Operating
Companies Income
LessAsset
Impairment/Exit Costs and Other
Adjusted Operating
Companies Income
LessCurrency
Adjusted Operating
Companies Income
excluding Currency
LessAcquisi-
tions
Adjusted Operating
Companies Income
excluding Currency &
Acquisitions
Reported Operating
Companies Income
LessAsset
Impairment/Exit Costs and Other
Adjusted Operating
Companies Income Adjusted
Adjusted excluding Currency
Adjusted excluding
Currency & Acquisitions
4,506$ (29)$ 4,535$ (481)$ 5,016$ 40$ 4,976$ European Union 4,738$ (66)$ 4,804$ (5.6)% 4.4 % 3.6 %2,663 - 2,663 (893) 3,556 18 3,538 EEMA 3,119 (1) 3,120 (14.6)% 14.0 % 13.4 %2,436 - 2,436 146 2,290 - 2,290 Asia 2,057 (14) 2,071 17.6 % 10.6 % 10.6 %
666 (135) (1) 801 (162) 963 202 761 Latin America & Canada 520 (127) (2) 647 23.8 % 48.8 % 17.6 %
10,271$ (164)$ 10,435$ (1,390)$ 11,825$ 260$ 11,565$ PMI Total 10,434$ (208)$ 10,642$ (1.9)% 11.1 % 8.7 %
2009 2008% Change in Adjusted Operating
Companies Income
PHILIP MORRIS INTERNATIONAL INC. and SubsidiariesReconciliation of Non-GAAP Measures
Reconciliation of Reported Operating Companies Income to Adjusted Operating Companies Income, excluding Currency and Acquisitions For the Years Ended December 31,
($ in millions)(Unaudited)
(1) Represents 2009 Colombian investment and cooperation agreement charge(2) Represents 2008 equity loss from RBH legal settlement ($124 million) and asset impairment and exit costs ($3 million)

58
PHILIP MORRIS INTERNATIONAL INC. and SubsidiariesReconciliation of Non-GAAP Measures
Adjustments for Impact of Currency and AcquisitionsFor the Years Ended December 31,
($ in millions)(Unaudited)
Reported Net
Revenues
LessExciseTaxes
Reported Net
Revenues excluding
Excise Taxes
LessCurrency
Reported Net
Revenues excluding
Excise Taxes & Currency
LessAcquisi-
tions
Reported Net Revenues excluding
Excise Taxes, Currency &
Acquisitions
Reported Net
Revenues
LessExciseTaxes
Reported Net
Revenues excluding
Excise Taxes
Reported
Reported excluding Currency
Reported excluding
Currency & Acquisitions
28,550$ 19,509$ 9,041$ (856)$ 9,897$ 61$ 9,836$ European Union 30,265$ 20,577$ 9,688$ (6.7)% 2.2 % 1.5 %13,865 7,070 6,795 (1,373) 8,168 41 8,127 EEMA 14,817 7,313 7,504 (9.4)% 8.8 % 8.3 %12,413 5,885 6,528 (41) 6,569 - 6,569 Asia 12,222 6,037 6,185 5.5 % 6.2 % 6.2 %
7,252 4,581 2,671 (328) 2,999 462 2,537 Latin America & Canada 6,336 4,008 2,328 14.7 % 28.8 % 9.0 %
62,080$ 37,045$ 25,035$ (2,598)$ 27,633$ 564$ 27,069$ PMI Total 63,640$ 37,935$ 25,705$ (2.6)% 7.5 % 5.3 %
Reported Operating
Companies Income
LessCurrency
Reported Operating
Companies Income
excluding Currency
LessAcquisi-
tions
Reported Operating
Companies Income
excluding Currency &
Acquisitions
Reported Operating
Companies Income
Reported
Reported excluding Currency
Reported excluding
Currency & Acquisitions
4,506$ (481)$ 4,987$ 40$ 4,947$ European Union 4,738$ (4.9)% 5.3 % 4.4 %2,663 (893) 3,556 18 3,538 EEMA 3,119 (14.6)% 14.0 % 13.4 %2,436 146 2,290 - 2,290 Asia 2,057 18.4 % 11.3 % 11.3 %
666 (162) 828 202 626 Latin America & Canada 520 28.1 % 59.2 % 20.4 %
10,271$ (1,390)$ 11,661$ 260$ 11,401$ PMI Total 10,434$ (1.6)% 11.8 % 9.3 %
2009 2008% Change in Reported Net
Revenues excluding Excise Taxes
2009 2008% Change in Reported Operating
Companies Income

59
2009 2008 % Change
Reported Diluted EPS 3.24$ 3.31$ (2.1)%
Less:Colombian investment and cooperation agreement charge (0.04) - Asset impairment and exit costs (0.01) (0.02) Equity loss from RBH legal settlement - (0.06) Tax items - 0.08
Adjusted Diluted EPS 3.29$ 3.31$ (0.6)%
Less:Currency Impact (0.53)
Adjusted Diluted EPS, excluding Currency 3.82$ 3.31$ 15.4 %
PHILIP MORRIS INTERNATIONAL INC. and SubsidiariesReconciliation of Non-GAAP Measures
Reconciliation of Reported Diluted EPS to Adjusted Diluted EPS and Adjusted Diluted EPS, excluding CurrencyFor the Years Ended December 31,
(Unaudited)

60
Reconciliation of Reported Operating Companies Income to Adjusted Operating Companies Income, excluding Currency and AcquisitionsFor the Years Ended December 31,
($ in millions)(Unaudited)
Reported Operating
Companies Income
LessAsset
Impairment & Exit Costs and
other
Adjusted Operating
Companies Income
LessCurrency
Adjusted Operating
Companies Income
excluding Currency
LessAcquisi-
tions
Adjusted Operating
Companies Income
excluding Currency &
Acquisitions
Reported Operating
Companies Income
LessAsset
Impairment & Exit Costs and
other
Adjusted Operating
Companies Income Adjusted
Adjusted excluding Currency
Adjusted excluding
Currency & Acquisitions
4,738$ (66) 4,804$ 432$ 4,372$ 20$ 4,352$ European Union 4,195$ (137)$ 4,332$ 10.9% 0.9% 0.5%3,119 (1) 3,120 21 3,099 - 3,099 EEMA 2,431 (12) 2,443 27.7% 26.9% 26.9%2,057 (14) 2,071 32 2,039 5 2,034 Asia 1,803 (28) 1,831 13.1% 11.4% 11.1%
520 (127) (1) 647 (4) 651 100 551 Latin America & Canada 514 (18) 532 21.6% 22.4% 3.6%
10,434$ (208)$ 10,642$ 481$ 10,161$ 125$ 10,036$ PMI Total 8,943$ (195)$ 9,138$ 16.5% 11.2% 9.8%
2008 2007% Change in Adjusted Operating
Companies Income
PHILIP MORRIS INTERNATIONAL INC. and SubsidiariesReconciliation of Non-GAAP Measures
(1) Represents 2008 equity loss from RBH legal settlement ($124 million) and asset impairment and exit costs ($3 million)

61
Reported Net Revenues
LessExciseTaxes
Reported Net
Revenues excluding
Excise Taxes
LessCurrency
Reported Net Revenues excluding
Excise Taxes & Currency
LessAcquisi-
tions
Reported Net Revenues
excluding Excise Taxes, Currency & Acquisitions
Reported Net
Revenues
LessExciseTaxes
Reported Net Revenues excluding
Excise Taxes
Reported
Reported excluding Currency
Reported excluding
Currency & Acquisitions
30,265$ 20,577$ 9,688$ 899$ 8,789$ 26$ 8,763$ European Union 26,829$ 17,994$ 8,835$ 9.7% (0.5)% (0.8)%14,817 7,313 7,504 296 7,208 - 7,208 EEMA 12,166 5,820 6,346 18.2% 13.6% 13.6%12,222 6,037 6,185 140 6,045 46 5,999 Asia 11,097 5,449 5,648 9.5% 7.0% 6.2%6,336 4,008 2,328 47 2,281 157 2,124 Latin America & Canada 5,151 3,170 1,981 17.5% 15.1% 7.2%
63,640$ 37,935$ 25,705$ 1,382$ 24,323$ 229$ 24,094$ PMI Total 55,243$ 32,433$ 22,810$ 12.7% 6.6% 5.6%
Reported Operating
Companies Income
LessCurrency
Reported Operating
Companies Income
excluding Currency
LessAcquisi-
tions
Reported Operating
Companies Income
excluding Currency &
Acquisitions
Reported Operating
Companies Income
Reported
Reported excluding Currency
Reported excluding
Currency & Acquisitions
4,738$ 432$ 4,306$ 20$ 4,286$ European Union 4,195$ 12.9% 2.6% 2.2%3,119 21 3,098 - 3,098 EEMA 2,431 28.3% 27.4% 27.4%2,057 32 2,025 5 2,020 Asia 1,803 14.1% 12.3% 12.0%
520 (4) 524 100 424 Latin America & Canada 514 1.2% 1.9% (17.5)%
10,434$ 481$ 9,953$ 125$ 9,828$ PMI Total 8,943$ 16.7% 11.3% 9.9%
2008 2007% Change in Reported Net Revenues
excluding Excise Taxes
2008 2007% Change in Reported Operating
Companies Income
Adjustments for Impact of Currency and AcquisitionsFor the Years Ended December 31,
($ in millions)(Unaudited)
PHILIP MORRIS INTERNATIONAL INC. and SubsidiariesReconciliation of Non-GAAP Measures

62
Reported Operating
Companies Income
LessAsset
Impairment & Exit Costs and
Other
Adjusted Operating
Companies Income
LessCurrency
Adjusted Operating
Companies Income
excluding Currency
LessAcquisi-
tions
Adjusted Operating
Companies Income
excluding Currency & Acqusitions
Reported Operating
Companies Income
LessAsset
Impairment & Exit Costs and
Other
Adjusted Operating
Companies Income Adjusted
Adjusted excluding Currency
Adjusted excluding
Currency & Acquisitions
4,195$ (137)$ 4,332$ 424$ 3,908$ (1)$ 3,909$ European Union 3,500$ (165)$ 3,665$ 18.2% 6.6% 6.7%2,431 (12) 2,443 98 2,345 - 2,345 EEMA 2,080 (2) 2,082 17.3% 12.6% 12.6%1,803 (28) 1,831 (36) 1,867 11 1,856 Asia 1,847 (19) 1,866 (1.9)% 0.1% (0.5)%
514 (18) 532 - 532 (66) 598 Latin America & Canada 1,013 538 475 12.0% 12.0% 25.9%
8,943$ (195)$ 9,138$ 486$ 8,652$ (56)$ 8,708$ PMI Total 8,440$ 352$ 8,088$ 13.0% 7.0% 7.7%
2007 2006% Change in Adjusted Operating
Companies Income
PHILIP MORRIS INTERNATIONAL INC. and SubsidiariesReconciliation of Non-GAAP Measures
Reconciliation of Reported Operating Companies Income to Adjusted Operating Companies Income, excluding Currency and Acquisitions For the Years Ended December 31,
($ in millions)(Unaudited)

63
Reported Net Revenues
LessExciseTaxes
Reported Net
Revenues excluding
Excise Taxes
LessCurrency
Reported Net
Revenues excluding
Excise Taxes & Currency
LessAcquisi-
tions
Reported Net Revenues excluding
Excise Taxes, Currency &
Acquisitions
Reported Net
Revenues
LessExciseTaxes
Reported Net Revenues excluding
Excise Taxes
Reported
Reported excluding Currency
Reported excluding
Currency & Acquisitions
26,829$ 17,994$ 8,835$ 757$ 8,078$ -$ 8,078$ European Union 23,745$ 15,869$ 7,876$ 12.2% 2.6% 2.6%12,166 5,820 6,346 330 6,016 - 6,016 EEMA 10,012 4,387 5,625 12.8% 7.0% 7.0%11,097 5,449 5,648 76 5,572 118 5,454 Asia 10,139 4,634 5,505 2.6% 1.2% (0.9)%5,151 3,170 1,981 34 1,947 37 1,910 Latin America & Canada 4,406 2,643 1,763 12.4% 10.4% 8.3%
55,243$ 32,433$ 22,810$ 1,197$ 21,613$ 155$ 21,458$ PMI Total 48,302$ 27,533$ 20,769$ 9.8% 4.1% 3.3%
Reported Operating
Companies Income
LessCurrency
Reported Operating
Companies Income
excluding Currency
LessAcquisi-
tions
Reported Operating
Companies Income
excluding Currency &
Acquisitions
Reported Operating
Companies Income
Reported
Reported excluding Currency
Reported excluding
Currency & Acquisitions
4,195$ 424$ 3,771$ (1)$ 3,772$ European Union 3,500$ 19.9% 7.7% 7.8%2,431 98 2,333 - 2,333 EEMA 2,080 16.9% 12.2% 12.2%1,803 (36) 1,839 11 1,828 Asia 1,847 (2.4)% (0.4)% (1.0)%
514 - 514 (66) 580 Latin America & Canada 1,013 (49.3)% (49.3)% (42.7)%
8,943$ 486$ 8,457$ (56)$ 8,513$ PMI Total 8,440$ 6.0% 0.2% 0.9%
2007 2006% Change in Reported Net Revenues
excluding Excise Taxes
2007 2006% Change in Reported Operating
Companies Income
Adjustments for Impact of Currency and AcquisitionsFor the Years Ended December 31,
($ in millions)(Unaudited)
PHILIP MORRIS INTERNATIONAL INC. and SubsidiariesReconciliation of Non-GAAP Measures

64
Reported Net Revenues
LessExciseTaxes
Reported Net
Revenues excluding
Excise Taxes
LessCurrency
Reported Net
Revenues excluding
Excise Taxes & Currency
LessAcquisi-
tions
Reported Net Revenues excluding
Excise Taxes, Currency &
Acquisitions
Reported Net
Revenues
LessExciseTaxes
Reported Net Revenues excluding
Excise Taxes
Reported
Reported excluding Currency
Reported excluding
Currency & Acquisitions
23,745$ 15,869$ 7,876$ (152)$ 8,028$ -$ 8,028$ European Union 23,813$ 15,364$ 8,449$ (6.8)% (5.0)% (5.0)%10,012 4,387 5,625 (23) 5,648 - 5,648 EEMA 8,951 3,867 5,084 10.6% 11.1% 11.1%10,139 4,634 5,505 (179) 5,684 587 5,097 Asia 8,609 3,668 4,941 11.4% 15.0% 3.2%4,406 2,643 1,763 14 1,749 50 1,699 Latin America & Canada 3,943 2,400 1,543 14.3% 13.4% 10.1%
48,302$ 27,533$ 20,769$ (340)$ 21,109$ 637$ 20,472$ PMI Total 45,316$ 25,299$ 20,017$ 3.8% 5.5% 2.3%
Reported Operating
Companies Income
LessCurrency
Reported Operating
Companies Income
excluding Currency
LessAcquisi-
tions
Reported Operating
Companies Income
excluding Currency &
Acquisitions
Reported Operating
Companies Income
Reported
Reported excluding Currency
Reported excluding
Currency & Acquisitions
3,500$ 2$ 3,498$ -$ 3,498$ European Union 3,890$ (10.0)% (10.1)% (10.1)%2,080 10 2,070 - 2,070 EEMA 1,664 25.0% 24.4% 24.4%1,847 (189) 2,036 219 1,817 Asia 1,801 2.6% 13.0% 0.9%1,013 (5) 1,018 13 1,005 Latin America & Canada 465 100+% 100+% 100+%
8,440$ (182)$ 8,622$ 232$ 8,390$ PMI Total 7,820$ 7.9% 10.3% 7.3%
2006 2005% Change in Reported Net Revenues
excluding Excise Taxes
2006 2005% Change in Reported Operating
Companies Income
Adjustments for Impact of Currency and AcquisitionsFor the Years Ended December 31,
($ in millions)(Unaudited)
PHILIP MORRIS INTERNATIONAL INC. and SubsidiariesReconciliation of Non-GAAP Measures

65
Reported Net Revenues
LessExciseTaxes
Reported Net
Revenues excluding
Excise Taxes
LessCurrency
Reported Net
Revenues excluding
Excise Taxes & Currency
LessAcquisi-
tions
Reported Net Revenues excluding
Excise Taxes, Currency &
Acquisitions
Reported Net
Revenues
LessExciseTaxes
Reported Net Revenues excluding
Excise Taxes
Reported
Reported excluding Currency
Reported excluding
Currency & Acquisitions
23,813$ 15,364$ 8,449$ 355$ 8,094$ 10$ 8,084$ European Union 22,265$ 14,236$ 8,029$ 5.2% 0.8% 0.7%8,951 3,867 5,084 81 5,003 - 5,003 EEMA 7,510 2,953 4,557 11.6% 9.8% 9.8%8,609 3,668 4,941 90 4,851 666 4,185 Asia 6,586 2,860 3,726 32.6% 30.2% 12.3%3,943 2,400 1,543 45 1,498 73 1,425 Latin America & Canada 3,276 1,983 1,293 19.3% 15.9% 10.2%
45,316$ 25,299$ 20,017$ 571$ 19,446$ 749$ 18,697$ PMI Total 39,637$ 22,032$ 17,605$ 13.7% 10.5% 6.2%
Reported Operating
Companies Income
LessCurrency
Reported Operating
Companies Income
excluding Currency
LessAcquisi-
tions
Reported Operating
Companies Income
excluding Currency &
Acquisitions
Reported Operating
Companies Income
Reported
Reported excluding Currency
Reported excluding
Currency & Acquisitions
3,890$ 194$ 3,696$ 1$ 3,695$ European Union 3,350$ 16.1% 10.3% 10.3%1,664 30 1,634 - 1,634 EEMA 1,554 7.1% 5.1% 5.1%1,801 54 1,747 323 1,424 Asia 1,298 38.8% 34.6% 9.7%
465 24 441 9 432 Latin America & Canada 391 18.9% 12.8% 10.5%
7,820$ 302$ 7,518$ 333$ 7,185$ PMI Total 6,593$ 18.6% 14.0% 9.0%
2005 2004% Change in Reported Net Revenues
excluding Excise Taxes
2005 2004% Change in Reported Operating
Companies Income
Adjustments for Impact of Currency and AcquisitionsFor the Years Ended December 31,
($ in millions)(Unaudited)
PHILIP MORRIS INTERNATIONAL INC. and SubsidiariesReconciliation of Non-GAAP Measures

66
PHILIP MORRIS INTERNATIONAL INC. and SubsidiariesReconciliation of Non-GAAP Measures
Calculation of Total Debt to EBITDA and Net Debt to EBITDA Ratios($ in millions, except ratios)
(Unaudited)
For the Year EndedMarch 31, December 31,
2010 2009April ~ December January ~ March 12 months
2009 2010 rolling
Earnings before income taxes 7,081$ 2,492$ 9,573$ 9,243$ Interest expense, net 639 223 862 797 Depreciation and amortization 660 223 883 853 EBITDA 8,380$ 2,938$ 11,318$ 10,893$
March 31, December 31,2010 2009
Short-term borrowings 1,050$ 1,662$ Current portion of long-term debt 151 82 Long-term debt 14,809 13,672 Total Debt 16,010$ 15,416$ Less: Cash and cash equivalents 850 1,540 Net Debt 15,160$ 13,876$
RatiosTotal Debt to EBITDA 1.41 1.42 Net Debt to EBITDA 1.34 1.27

67
PHILIP MORRIS INTERNATIONAL INC. and SubsidiariesReconciliation of Non-GAAP Measures
Calculation of Total Debt to EBITDA and Net Debt to EBITDA Ratios($ in millions, except ratios)
(Unaudited)
March 31,2008
April ~ December January ~ March 12 months2007 2008 rolling
Earnings before income taxes 7,033$ 2,449$ 9,482$ Interest expense, net - 75 75 Depreciation and amortization 585 201 786 EBITDA 7,618$ 2,725$ 10,343$
March 31,2008
Short-term borrowings 793$ Current portion of long-term debt 104 Long-term debt 6,643 Total Debt 7,540$ Less: Cash and cash equivalents 1,231 Net Debt 6,309$
RatiosTotal Debt to EBITDA 0.73 Net Debt to EBITDA 0.61

68
2003 2007 2009
Reported Operating Income 6,195$ 8,894$ 10,040$
Add back:
Amortization of Intangibles & Corporate Expenses 91 49 231
Reported Operating Companies Income 6,286$ 8,943$ 10,271$
Add back:
Asset Impairment & Exit Costs and Other (45) 195 164
Adjusted Operating Companies Income 6,241$ 9,138$ 10,435$
Cigarette Shipment Volume 735.8 848.6 864.0
PHILIP MORRIS INTERNATIONAL INC. and SubsidiariesReconciliation of Non-GAAP Measures
Reconciliation of Reported Operating Income to Reported Operating Companies IncomeReconciliation of Reported Operating Companies Income to Adjusted Operating Companies Income
For the Years Ended December 31,($ in millions, except volume in billions)
(Unaudited)

Investor Day – Asia Region Lausanne, June 23, 2010