investor fact sheet - files.shareholder.comfiles.shareholder.com/downloads/alog/4803178872x0x... ·...
TRANSCRIPT
Innovative Solutions for Life
Analogic provides leading-edge healthcare and security technology solutions to advance the practice of medicine and save lives. We are recognized around the world for advanced imaging systems and technology that enable computed tomography (CT), ultrasound, digital mammography, and magnetic resonance imaging (MRI), as well as automated threat detection for aviation security. Our market-leading ultrasound systems, led by our flagship BK Ultrasound brand, used in procedure-driven markets such as urology and surgery, are sold to clinical practitioners around the world through our direct sales force.
Fiscal 2017 Performance Revenue $486 M
GAAP diluted EPS ($5.96)/share
Non-GAAP* diluted EPS $2.22/share
GAAP operating margin -14%
Non-GAAP* operating margin 7%
Operating cash flows $76 M, free cash flow¹ $67 M
Cash and Liquid Investments (Q1 FY 2018) $183 M
Quarterly Milestones (compared to Q1 FY 17)
Quarterly revenue $107 M
Gross margin 45%
GAAP operating margin 7% Non-GAAP operating margin 12%
GAAP diluted EPS $0.45 Non-GAAP diluted EPS $0.75
ConneCT Checkpoint CT system achieved ECAC Standard C2
Awared $4 M base contract by TSA for further development of ConneCT
I N V E S T O R F A C T S H E E T
Q1 Fiscal 2018 (ended October 31, 2017)
Snapshot
NASDAQ OMX ALOG
Long-term Debt None
Quarterly Dividend $0.10/share
Market Cap (intraday 12/14/17)
$1.05 B
Shares Outstanding (as of 12/14/17)
12.49 M
Fiscal Year End July 31
Indexes S&P SmallCap 600Russell 2000
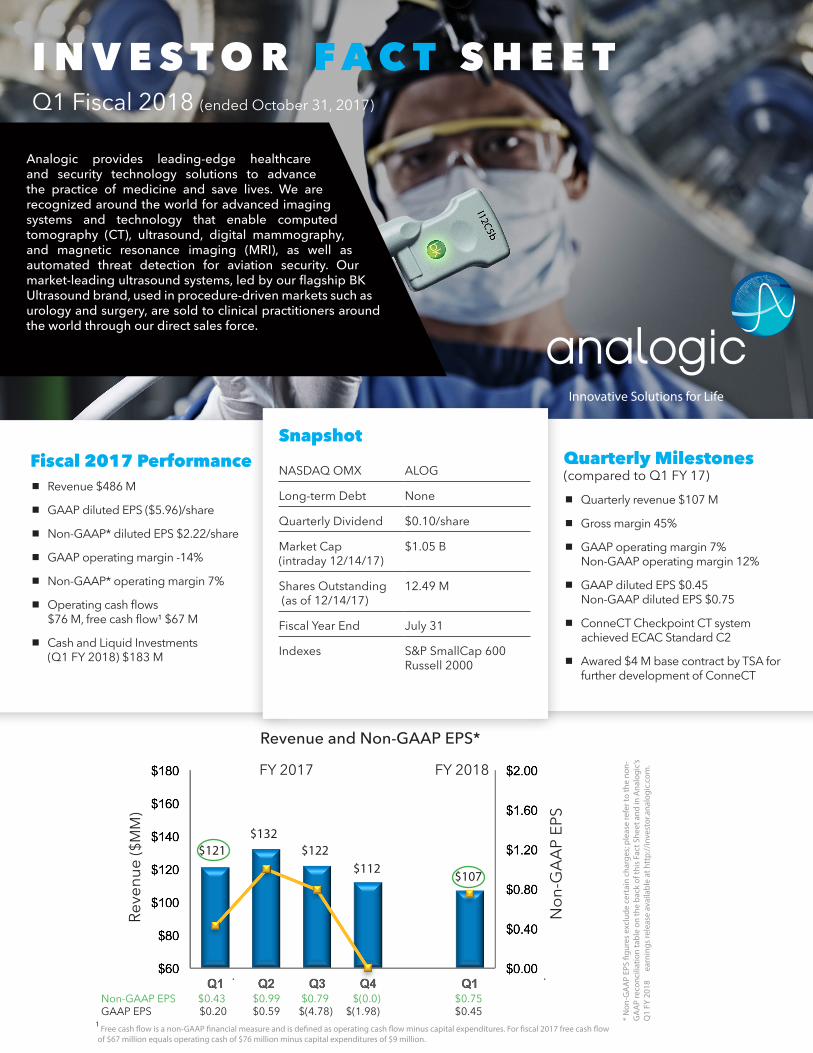
$121
FY 2017 FY 2018
$132$122
$112 $107
¹ Free cash flow is a non-GAAP financial measure and is defined as operating cash flow minus capital expenditures. For fiscal 2017 free cash flow of $67 million equals operating cash of $76 million minus capital expenditures of $9 million.
* N
on-G
AA
P EP
S fig
ures
exc
lude
cer
tain
cha
rges
; ple
ase
refe
r to
the
non-
GA
AP
reco
ncili
atio
n ta
ble
on th
e ba
ck o
f thi
s Fa
ct S
heet
and
in A
nalo
gic’s
Q
1 FY
201
8 e
arni
ngs
rele
ase
avai
labl
e at
htt
p://
inve
stor
.ana
logi
c.co
m.
Non-GAAP EPS $0.43 $0.99 $0.79 $(0.0) $0.75GAAP EPS $0.20 $0.59 $(4.78) $(1.98) $0.45
Reve
nue
($M
M)
Revenue and Non-GAAP EPS*
Non
-GAA
P EP
S

Analyst Coverage
CJS Securities, Inc. Lawrence Solow
Jefferies Anthony Petrone
Top Five Shareholders% TSO
BlackRock Inst. Trust Co. 12.1%
The Vanguard Group, Inc. 9.3%
Dimensional Fund Advisors, L.P. 7.6%
Advisory Research, Inc. 6.1%
Wells Capital Management Inc. 5.2%(as of September 30, 2017)
Senior ManagementFred Parks President and CEO
Michael BourqueSenior Vice President, CFO, and Treasurer
Investor Contact
Mark Namaroff Sr. Director of Investor Relations and Corporate Communications(978) 326-4058 [email protected]
Please visit http://investor.analogic.com for a copy of Analogic’s fiscal 2017 10K report.
Business Units Medical Imaging (57%* of revenue)In Medical Imaging, we are a leading designer and manufacturer of computed tomography (CT) systems and subsystems; magnetic resonance imaging (MRI) power systems; and Selenium-based direct digital 2D and 3D mammography detectors sold to OEMs around the world. Our subsystems are used in half of all the CT and MRI scanners installed worldwide.
Ultrasound (30%* of revenue)
Security and Detection (13%* of revenue)
Analogic Corporation - Headquarters USA8 Centennial Drive, Peabody, MA 01960978-326-4000analogic.com
We are a global market leader with over 40 years of innovation in procedure-driven ultrasound, branded BK Ultrasound. Our products are used mainly in the urology and surgery markets. Our ultrasound segment also manufactures and sells advanced ultrasound transducers and probes to medical OEMs.
Our security business designs and manufactures airport checked and checkpoint baggage screening systems and DNA analysis systems. Our checked baggage systems are sold through our OEM customers, L-3 Communications and Smiths Detection, to the Transportation Security Administration for installation in U.S airports and to international airport authorities for installation at airports outside of the U.S.
Note Regarding Forward-Looking Statements: In addition to historical information,
this document may contain forward-looking statements within the meaning of the
Private Securities Litigation Reform Act of 1995. Forward-looking statements are
subject to risks and uncertainties. Actual results may differ materially from those
indicated by such forward-looking statements as a result of various important
factors, including risks relating to product development and commercialization,
limited demand for the Company’s products, risks associated with competition,
uncertainties associated with regulatory agency approvals, competitive pricing
pressures, downturns in the economy, the risk of potential intellectual property
litigation, acquisition, related risks, and other factors discussed in our most recent
annual and quarterly reports filed with the Securities and Exchange Commission.
In addition, forward-looking statements represent the Company’s views as of the
date of this document. While the Company anticipates that subsequent events
and developments will cause the Company’s views to change, the Company
specifically disclaims any obligation to update these forward-looking statements.
These forward-looking statements should not be relied upon as representing the
Company’s views as of any date later than the date of this document.
Reconciliation of Certain Non-GAAP Financial Measures
Innovative Solutions for Life
*As of fiscal 2017
(In thousands, except per share data) Oct 31, 16 Jan 31, 17 Apr 30, 17 Jul 31, 17 Oct 31, 17
GAAP (Loss) Income From Operations $ 3,953 $9,450 $(64,603) $(15,565) $7,874
Share-based compensation expense 1,563 2,597 2,195 3,076 1,984
Non-routine other legal costs 4 12 8 251 577
Restructuring 32 267 2,080 4,787 535
Acquisition-related revenues and expenses 2,212 (6,065) (23) 1,668 1,462
Asset impairment charges – 10,423 73,051 1,036 –
Non-GAAP Income From Operations $ 7,764 $16,684 $12,708 ($4,748) $12,432
Percentage of Total Net Revenue 6% 13% 10% -4.2% 11.6%
GAAP Net Income (Loss) $2,531 $ 7,510 $(59,664) $(24,619) $5,659
Share-based compensation expense 1,066 1,791 1,453 2,111 1,885
Non-routine other legal costs 2 8 433 159 365
Restructuring 21 169 1,367 3,219 358
Acquisition-related revenues, expenses and loss 1,752 (3,500) 338 1,307 1,114
Asset impairment charges – 6,610 66,035 657 28
Valuation Allowance Tax Effect – – – 17,184 89
Non-GAAP Net Income $5,372 $12,588 $9,962 $18 $9,498
Percentage of Total Net Revenue 4% 10% 8% 0% 9%
GAAP Diluted EPS $0.20 $0.59 $(4.78) $(1.98) $0.45
Effect of Non-GAAP adjustments 0.23 0.40 5.57 1.98 0.30
Non-GAAP Diluted EPS $ 0.43 $ 0.99 $0.79 $0 $0.75
57%*
30%*
13%*