investor fact sheet tsx venture: bcf...q2 2016 earnings per share $0.29 first half 2016 price...
TRANSCRIPT

INVESTOR FACT SHEETTSX VENTURE: BCF
INVESTMENT HIGHLIGHTS
Q2 2016 earnings per share $0.29
First half 2016 price earnings ratio, annualized* 8.26 x
Q2 2016 Class A dividend declared $0.1995 per share
AT JUNE 30, 2016
First half return on equity, annualized** 12.01%
Debt equity ratio 16.2%
Class A share dividend cover ratio 2.5 x
Cumulative allowance for doubtful accounts $0.7 million
Net asset value per share $9.78
Class B share equity as a % of Class A share equity*** 59.8%
First half portfolio turnover rate 12.4 months
All currency in Canadian dollars.
*Based on $10.00 share issue price **Based on average month-end equity before financing costs ***Net of financing costs
WHY INVESTStable cash dividends
• Two-tier share structure guarantees dividend priority to public shareholders over private investors.
• Strong 2.5 x dividend coverage ratio provides significant security.
• Proven business model is designed to generate attractive returns for investors throughout the economic cycle.
• Niche market focus reduces overall risk, increases potential return on portfolio.
• Experienced, hands-on management team has demonstrated ability to successfully operate in a distressed market.
Security for your equity
• Priority given to Class A dividends extends to capital in the event of dissolution of the corporation.
• Shareholder value is safeguarded by limited use of leverage and 75% maximum loan-to-value ratio.
• Quarterly allowance for doubtful accounts cushions against loan losses.
• Short-term nature of loans (max. one-year) assures liquidity necessary to preserve capital.
• Steady portfolio turnover creates opportunity to re-price for risk.
• Corporate assets are restricted to cash and mortgages secured by real property.
SEPTEMBER 2016 | www.builderscapital.ca
BUSINESS OVERVIEW
Builders Capital provides short-term, course of construction financing to builders of residential wood-frame
construction projects in Western Canada. Our portfolio is strategically concentrated on properties located
in typically more liquid and less volatile urban markets and their surrounding areas.
Portfolio manager Builders Capital Management Corp. sources and services our mortgage loans, and directs
business operations. Extensive experience in all aspects of residential construction and in-depth, up-to-date
residential real estate industry knowledge ensure prudent mortgage underwriting decisions and efficient
management of any potential mortgage defaults. If required, we have the ability to complete and sell any
unfinished projects acquired through enforcement proceedings in a timely and cost-effective manner.
All investments are subject to rigorous underwriting review and comprehensive due diligence of underlying
assets, including detailed re-costing and assessment of each project’s completed value. Mortgages must
satisfy geographical, economic sector, term, borrower and loan-to-value criteria dictated by our Asset
Allocation Model.
SHARE STRUCTUREPublic Shareholders Come First
Builders Capital has two principal classes of shares, Class A Non-Voting Shares, held by the public,
and Class B Non-Voting Shares, held by management and private investors. This two-tier share structure
grants full dividend priority to the Class A Shares, providing exceptional security of both principal and
dividends to our public shareholders. The private B share equity, which exceeds 50% of the public float,
is always fully at risk ahead of the A share capital.
Under our share terms, Class A Non-Voting shareholders are entitled to receive annual dividends of 8%
in preference to all other shareholder distributions. Only after these dividends have been paid in full are
Class B Non-Voting shareholders entitled to receive any dividends.
SENIOR MANAGEMENTSandy L. LoutittPresident and CEO [email protected]
John Strangway, CPA, CAChief Financial Officer [email protected]
INVESTOR RELATIONSJohn Strangway Sandy Loutitt 403.685.9888
www.builderscapital.ca
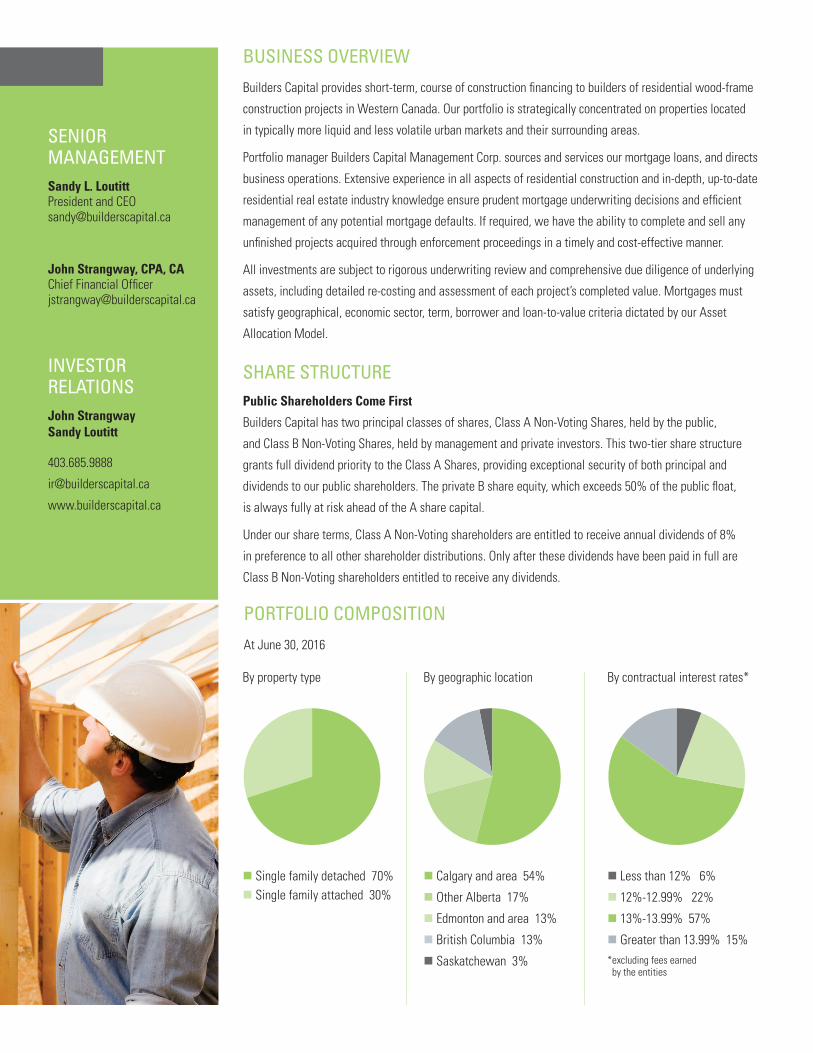
PORTFOLIO COMPOSITION
At June 30, 2016
By property type
Single family detached 70% Single family attached 30%
By geographic location
Calgary and area 54%
Other Alberta 17%
Edmonton and area 13%
British Columbia 13%
Saskatchewan 3%
By contractual interest rates*
Less than 12% 6%
12%-12.99% 22%
13%-13.99% 57%
Greater than 13.99% 15%* excluding fees earned by the entities