investor information february 2018 - oebfa.at relations/republic of... · investor information,...
TRANSCRIPT

Republic of Austria
Republic of Austria
Investor Information – April 2018
Austrian Treasury

Republic of Austria
Agenda
2
1. General Overview – Austria‘s favourable fundamentals 3
2. Funding Strategy Republic of Austria 26
Investor Information, April 2018

Republic of Austria
Euro-Zone (EU19)
Austria – Key Data and Facts
3
Austria Euro-Zone
Area (sq. km ‘000) 84 2.758
Population 2017 (Mio.) 8.8 341.0
Population growth
(2013 – 2017e, average
yearly change)
+0.9% +0.3%
GDP per capita 2017 (EUR) 41.970 32.700
Net financial assets
per private household as of
Q3 2017 (EUR)
118.276 108.726
1. Austria‘s favourable fundamentals
EU28
Source: Statistics Austria, Eurostat, OECD
Investor Information, April 2018

Republic of Austria
Austria – Key Data and Facts
4 1. Austria‘s favourable fundamentals
in % Austria Euro-Zone
Real GDP growth 2.9 3.2 2.2 2.4 2.3 2.0
Inflation (HICP) 2.2 2.0 1.9 1.5 1.5 1.6
Unemployment 5.5 5.2 5.0 9.1 8.5 7.9
Current Account Balance 2.2 2.9 3.7 3.0 3.0 3.0
Budget Balance (Maastricht) -0.7 -0.4 0.0 -1.1 -0.9 -0.8
Structural Budget Balance -0.1 -0.5 -0.5 -1.0 -1.1 -1.1
Debt to GDP 78.4 74.5 70.9 89.3 87.2 85.2
Year 2017 2018 2019 2017 2018 2019
Investor Information, April 2018
Source: Data on Austria: EC – Autumn Economic Forecast, November 2017 / WIFO, March 2018 / Federal Ministry of Finance, March 2018 / Statistics Austria, April 2018
Data on Euro-Zone: EC – Autumn Economic Forecast, November 2017 & Interim Winter Forecast, February 2018
Note: Structural budget balance Austria excludes additional expenditures on refugees and asylum seekers

Republic of Austria
EU-28 70%
EU- Others 10%
Africa 1%
America 10%
Asia 9%
Australia 1%
Top-10 Export Partners 2017
Country Share in %
Germany 30.1
USA 6.8
Italy 6.4
France 5.0
Switzerland 4.9
Czech Republic 3.7
Hungary 3.4
Poland 3.1
United Kingdom 2.8
China 2.6
Austria – GDP and external trade
5
Composition of Austrian GDP
2017
EUR 369.2 bn
Consumption 72%
Investments 25%
Net exports 3%
Exports 54%
Imports 51%
Eurozone: 52.2%
Europe: 79.3%
1. Austria‘s favourable fundamentals
Note: Totals might not add up due to rounding
Distribution of Austrian Exports
Investor Information, April 2018
Source: Statistics Austria (GDP as of February 2018, Exports as of March 2018)

Republic of Austria
Agriculture, forestry and fishing: 1.1%
Mining and quarrying;
manufacturing: 16.8%
Electricity; water supply; sewerage
and waste manage- ment: 2.6%
Construction: 5.8%
Wholesale and retail trade: 10.9%
Transportation: 4.9%
Accommodation and food service
activities: 4.8%
Information and communi-
cation: 3.1%
Financial and insurance
activities:3.7%
Real estate activities: 8.8%
Other administra- tive and support service activities:
8.6%
Public administra- tion: 4.5%
Education; human health and social
work activities:11.0%
Other service activities: 2.5%
Composition of the Austrian GDP -
Low exposure to financial sector (3.7% of GDP)
6
Source: Statistics Austria as of February 2018
1. Austria‘s favourable fundamentals Investor Information, April 2018

Republic of Austria
Credit Ratings Overview
7
Long Term Short Term Outlook
Moody‘s Aa1 P-1 Stable
Standard & Poors AA+ A-1+ Stable
Fitch AA+ F1+ Stable
DBRS AAA R-1 (high) Stable
• All rating reports available online at www.oebfa.at
1. Austria‘s favourable fundamentals Investor Information, April 2018

Republic of Austria
Austria: Leader in Sustainability
8
Sustainability Country Ranking1
Sustainalytics Ranked 5th out of 172 countries worldwide
oekom research Ranked 9th out of 57 countries worldwide
1) Reports available online at www.oebfa.at
2) Eurostat, February 2017 (no data available for Germany, Netherlands, Italy, Ireland, Greece)
3) Eurostat, Employment in the environmental goods and services sector; May 2017
4) Eurostat, Sustainable Development in the European Union 2016
1. Austria‘s favourable fundamentals
• Highest environmental protection
expenditure per capita 2 and highest
share of green jobs in the EU3
• Share of renewable energy sources (in
total gross final energy consumption) is
over 32%. That is twice
the EU average (16%) and puts Austria
in 4th place in Europe4
• Austria has the 2nd highest recycling
rate of waste in the EU4
• With over 20% of its agricultural area
utilised under organic farming, Austria
ranks 1st among all EU member states4
0
200
400
600
800
1.000
1.200
1.400
in EUR
Environmental protection expenditure per inhabitant2
Investor Information, April 2018

Republic of Austria
0
0,5
1
1,5
2
2,5
Rule of Law Control of Corruption Government Effectiveness
Regulatory Quality Voice and Accountability
Austria’s High Institutional Strength
Worldbank Governance Indicators
9
Note: Values range from -2.5 (weak) to +2.5 (strong) / data as of October 2017
1. Austria‘s favourable fundamentals
• Rule of Law:
ranked 10 out of 214 countries
worldwide
• Voice and Accountability:
ranked 15 out of 214 countries
worldwide
• Government Effectiveness:
ranked 18 out of 214 countries
worldwide
• Control of Corruption
ranked 19 out of 214 countries
worldwide
• Regulatory Quality
ranked 19 out of 214 countries
worldwide
Investor Information, April 2018

Republic of Austria
10
Austria’s Favourable Fiscal Position Government Debt Ratio and Budget Deficit on a clearly declining path
• Excluding liabilities of government-owned wind-down units, Austria‘s general government debt was 76.5% as of
GDP (Q3-2017)
1. Austria‘s favourable fundamentals Investor Information, April 2018
Forecast
-1,5
-5,3
-4,4
-2,6 -2,2
-2,0
-2,7
-1,0
-1,6
-0,7 -0,4
+0,0 +0,1 +0,2 +0,4 68,7
79,9
82,7 82,4 81,9
81,3
84,0 84,6
83,6
78,4 74,5
70,9
67,7
65,0
62,2
-6
-4
-2
0
2
4
6
55
60
65
70
75
80
85
2008 2009 2010 2011 2012 2013 2014 2015 2016 2017 2018 2019 2020 2021 2022
in % of GDP
Deficit / Surplus (rhs) Government Debt (lhs)
Source: Federal Ministry of Finance, March 2018 / Statistics Austria, April 2018

Republic of Austria
9,1
23,0
35,5
37,9
49,9
51,6
54,9
61,2
62,1
69,1
74,1
74,5
87,2
96,9
96,9
98,3
102,5
124,1
130,8
177,8
4,5
14,9
18,2
14,6
28,5
62,6
54,7
65,1
32,7
42,4
21,8
68,4
68,6
68,0
39,5
45,1
92,5
71,7
102,4
109,4
020406080100120140160180200
Estonia
Luxembourg
Latvia
Lithuania
Slovakia
Malta
Netherlands
Germany
Finland
Ireland
Slovenia
Austria
Euro area
France
Spain
Cyprus
Belgium
Portugal
Italy
Greece
2008
2018e
Euro area
% of GDP
24,3
33,3
35,5
36,6
39,1
53,0
71,5
77,4
81,6
85,3
108,4
239,1
13,0
28,3
33,3
37,8
13,2
46,3
71,0
39,6
60,7
49,9
72,8
184,6
04080120160200240
Bulgaria
Czech Republic
Denmark
Sweden
Romania
Poland
Hungary
Croatia
EU-28
United Kingdom
United States
Japan
2008
2018e
Non-euro area and others
% of GDP
Public Debt/GDP in Austria
Increase since 2008 substantially below Eurozone-average
11
Source: EC – Autumn Economic Forecast, November 2017 / Statistics Austria, February 2018 / Federal Ministry of Finance, March 2018
1. Austria‘s favourable fundamentals Investor Information, April 2018

Republic of Austria
0,0%
0,5%
1,0%
1,5%
2,0%
2,5%
3,0%
3,5%
4,0%
0
500
1000
1500
2000
2500
3000
3500
4000
4500
5000
5500
6000
6500
7000
7500
8000
199
0
199
1
199
2
199
3
199
4
199
5
199
6
199
7
199
8
199
9
200
0
200
1
200
2
200
3
200
4
200
5
200
6
200
7
200
8
200
9
201
0
201
1
201
2
201
3
201
4
201
5
201
6
201
7
201
8e
201
9e
in Mil EUR in % of GDP
in % of GDP 3.4%
in Mil EUR in % of GDP
1.5%
Interest payments 2018: Forecast as of March 2018, GDP: WIFO, March 2018
• Absolute level of interest payments relatively stable
• Relative to GDP interest payments are below 2% and well beneath peak levels in 1996
Federal government - Interest payments 1990-2019
12 1. Austria‘s favourable fundamentals Investor Information, April 2018

Republic of Austria
45
50
55
60
65
70
75
2006 2007 2008 2009 2010 2011 2012 2013 2014 2015 2016 2017
AT: % of GDP EA: % of GDP
Household Debt in % of GDP
80
85
90
95
100
105
110
2006 2007 2008 2009 2010 2011 2012 2013 2014 2015 2016 2017
AT: % of GDP EA: % of GDP
Corporate Debt1 in % of GDP
1 Short- and long-term loans, money and capital market
instruments.
Source: European Central Bank, Austrian National Bank, October 2017
Level of corporate and household indebtedness substantially below Euro-Zone average
Indebtedness of households and corporates
13 1. Austria‘s favourable fundamentals Investor Information, April 2018

Republic of Austria
0 50 100 150 200 250 300 350 400 450 500
Cyprus
Ireland
Luxembourg
Greece
Portugal
Netherlands
Belgium
Italy
Spain
France
Finland
Austria
Estonia
Malta
Germany
Slovenia
Slovakia
Latvia
Lithuania
Euro Area: Total debt in % of GDP
Government Debt
Corporate Debt
Household Debt
Total indebtedness of the real economy
1. Austria‘s favourable fundamentals 14
Level of total indebtedness in Austria relatively low
Source: ECB / ESRB, May 2017 (data as of Q4 2016)
Investor Information, April 2018

Republic of Austria
Government debt and household assets
15
High domestic wealth
• Growth in net financial assets of households exceeds increase in government debt
• GDP per capita is 38% higher than EU-average
• Sustainable current account surplus
Source: Statistics Austria, March 2018 / Austrian National Bank, April 2018
1. Austria‘s favourable fundamentals Investor Information, April 2018
0
2
4
6
8
10
12
14
16
18
20
0
100
200
300
400
500
600
700
2003 2004 2005 2006 2007 2008 2009 2010 2011 2012 2013 2014 2015 2016 2017
in % in bn EUR
Household financial assets (Gross) in bn EUR
Household financial assets (Net) in bn EUR
Government debt in bn EUR
Savings rate in % (rhs)

Republic of Austria
-3,0
-2,0
-1,0
0,0
1,0
2,0
3,0
4,0
5,0
2000 2001 2002 2003 2004 2005 2006 2007 2008 2009 2010 2011 2012 2013 2014 2015 2016 2017 2018 2019
Austria Euro area EU
% of GDP
Forecast
Austria’s strong competitive position
16
Source: EC – Autumn Economic Forecast, November 2017
1. Austria‘s favourable fundamentals
Current Account Balance
Austria’s sustainable current account surplus
reflects strong international competitiveness
Investor Information, April 2018

Republic of Austria
Netherlands
Germany
Japan
Austria
Belgium
Finland
Euro area
European Union
Italy
Ireland
France
Spain
United States
UK
Portugal
Greece
-8 -6 -4 -2 0 2 4 6 8 10
in % of GDP (average 2005 - 2018e)
Net lending (+) / net borrowing (-) of the nation in % of GDP
net capital import net capital export
1. Austria‘s favourable fundamentals
Source: European Commission (AMECO) as of May 2017
1) OeNB, April 2018
Austria is an International Net Lender
17
Furthermore Austria has a
positive net international investment position
(Q4 2017: 6.0% of GDP)1
Investor Information, April 2018

Republic of Austria
-4
-3
-2
-1
0
1
2
3
4
5
Slo
ve
nia
Belg
ium
Luxem
bo
urg
Germ
an
y
Lithuan
ia
Neth
erland
s
Fin
land
Malta
Irela
nd
Austr
ia
Euro
zone (
EU
-19)
Slo
va
kia
Po
rtugal
Itla
y
Gre
ece
Fra
nce
Spain
Latv
ia
Cypru
s
Esto
nia
Source: European Commission Ageing Report, May 2015 (baseline scenario)
Pursuing further structural pension reforms is one of the key goals of the federal government.
Total Age-related expenditure in the euro area (projected change in pp of GDP, 2013-2040)
1. Austria‘s favourable fundamentals
Age-related expenditure under control
18 Investor Information, April 2018

Republic of Austria
80
85
90
95
100
105
110
115
120 Austria
Belgium
Netherlands
France
Spain
Finland
EU-28
Germany
Italy
Portugal
Greece
Austria‘s population growth outperforms European average
19
Source: Eurostat, data extracted in April 2017
Population Projections (main scenario): Assumptions related to fertility, mortality, net international migration as well as the approximated values of life expectancy at birth
2015 = 100 in %
1. Austria‘s favourable fundamentals Investor Information, April 2018

Republic of Austria
0,20
0,25
0,30
0,35
0,40
0,45
0,50
Gini Coefficient
Source: OECD Income Distribution Database, no data for Japan and Russia available / Gini coefficient 2015 or latest available, November 2017
Austria’s low Gini coefficient indicates a relatively equal income distribution
1. Austria‘s favourable fundamentals
High Social Stability
20 Investor Information, April 2018

Republic of Austria
100
110
120
130
140
150
160
170
180
2007 2008 2009 2010 2011 2012 2013 2014 2015 2016
Ireland Austria NetherlandsSweden Germany BelgiumFinland France EU 19
in % of EU-28 average
Source: European Commission, Eurostat as of November 2017
1) in purchasing power standards
1. Austria‘s favourable fundamentals
Austria’s unemployment rate:
4th lowest in the Eurozone
Austria’s GDP per capita1:
4th highest in the EU
Austria’s favourable fundamentals
High GDP per capita and low unemployment
21
• GDP per capita since 2007 up
from 5th to 4th rank in the EU
• Unemployment rate nearly half of the
Eurozone-average
• 3rd lowest long-term unemployment
and 3rd lowest youth unemployment
rate in the Eurozone
Luxembourg: 267
Investor Information, April 2018
0
2
4
6
8
10
12
14
200
0
200
1
200
2
200
3
200
4
200
5
200
6
200
7
200
8
200
9
201
0
201
1
201
2
201
3
201
4
201
5
201
6
201
7
in %
Austria Euro area EU

Republic of Austria
1
1,5
2
2,5
3
3,5
4
2004 2005 2006 2007 2008 2009 2010 2011 2012 2013 2014 2015
in % of GDP
Finland
Austria
Germany
Belgium
OECD
France
Netherlands
EU-28
UK
Luxembourg
Source: OECD (2017), Gross domestic spending on R&D (indicator). doi: 10.1787/d8b068b4-en (Accessed on 24 November 2017)
1. Austria‘s favourable fundamentals
Strong Innovation Performance
Austria’s R&D expenditure above peers
22
Research and Development expenditure
Investor Information, April 2018

Republic of Austria
Source: MIP Scoreboard, European Commission as of November 2017
1. Austria‘s favourable fundamentals
EU Macroeconomic Imbalance Procedure
Austria with no major imbalances
23
External Imbalances Internal Imbalances New employment indicators
Current Account
Balance as % of GDP,
3 year average
Net International Investment
Position as % of GDP
Real Effective Exchange Rate (42 trading partners,
based on HICP/CPI), %
change (3 years)
Export Market
Shares, % change
(5 years)
Nominal ULC, % change (3 years)
Deflated House Price
Index (1-year % change)
Private Sector Credit Flow as % of
GDP, consolidated
Private Sector
Debt as % of GDP, consoli-dated
General Govern-
ment Sector
Debt as % of GDP
Unemployment Rate,
3 year average
Total Financial
Sector Liabilities (1-year % change)
Activity rate in % of total population
aged 15 - 64 (3 years change)
Long-term unemployment
rate in % of active population aged 15-74 (3 years
change)
Youth unemployment
rate in % of active
population aged 15-24 (3 years
change)
# of indicators
beyond threshold
Threshold -4/+6% -35% +/- 5% (EA)
+/- 11% (Non-EA)
-6% 9% (EA)
12% (Non-EA)
6% 14% 133% 60% 10% 16.5% -0.2 0.5 2.0
Belgium -0.3 51.2 -0.4 -2.3 -0.6 1.0 13.3 190.1 105.7 8.3 1.2 0.1 0.1 -3.6 2
Germany 8.1 54.4 -2.6 2.9 5.2 5.4 3.8 99.3 68.1 4.6 5.2 0.3 -0.6 -0.7 2
Luxembourg 5.0 34.7 -1.5 26.2 2.5 5.9 1.5 343.6 20.8 6.3 7.5 0.1 0.4 2.2 2
Denmark 8.4 54.8 -1.5 -4.2 3.4 4.2 -10.4 210.7 37.7 6.3 3.3 1.9 -0.4 -1.0 2
Austria 2.2 5.6 1.0 -4.0 5.8 7.2 3.2 124.0 83.6 5.8 -2.4 0.7 0.6 1.5 3
France -0.7 -15.7 -3.1 -2.4 1.4 1.0 6.2 146.9 96.5 10.3 4.3 0.7 0.2 -0.3 3
Netherlands 8.8 69.1 -2.3 0.1 -1.1 4.4 1.5 221.5 61.8 6.8 5.3 0.3 0.0 -2.4 3
Sweden 4.6 11.2 -9.2 -7.9 2.0 7.6 7.6 188.5 42.2 7.4 9.0 1.0 -0.1 -4.7 3
UK -5.5 -1.1 0.2 -0.1 3.1 5.5 5.8 168.1 88.3 5.4 9.8 0.9 -1.4 -7.7 3
Finland -1.2 -2.3 0.5 -14.1 2.1 -0.3 2.2 149.3 63.1 9.0 4.5 0.7 0.6 0.2 4
Ireland 5.5 -176.2 -6.6 59.8 -20.5 6.6 -19.0 278.1 72.8 9.5 *9,5 0.7 -3.6 -9.6 5
Investor Information, April 2018

Republic of Austria
0
0,5
1
1,5
2
2,5
3
3,5
Ire
land
Ma
lta
Lu
xe
mbo
urg
Cypru
s
Sw
itzerl
and
Belg
ium
Ne
therl
and
s
Spain
No
rwa
y
Sw
ede
n
Fra
nce
Germ
any
De
nm
ark
Lithu
ania
La
tvia
Ca
nad
a
Fin
land
Hu
nga
ry
Ita
ly
Austr
ia
Migration Factor Foreign Direct Investment Factor
Financial Factor Export factor
Austria: Least exposed to Brexit scenario
24
S&P‘s Brexit Sensitivity Index
Source: S&P, “Who has the most to lose from Brexit?” Brexit Sensitivity Index (June 9, 2016)
1. Austria‘s favourable fundamentals Investor Information, April 2018

Republic of Austria
• Diversified and competitive economy
• No major macroeconomic imbalances, low private sector indebtedness
• High level of innovation
- R&D expenditure 2017e: above 3% of GDP / among Top-10 worldwide1
• Strong exports and tourism
- 2nd most diversified export structure in the world (out of 217 countries)2
• 4th lowest unemployment in Eurozone
• Sustainable current account surplus
• Net capital exporting country and positive net international investment position
• High savings ratio / Top-10 savers worldwide3
• 4th richest country in the EU4
• 4th most peaceful country in the world (out of 163)5
• Very low vulnerability to climate change / ranked 3 out of 116 countries worldwide6
Austria
A Safe Haven Core-Eurozone Economy
25
1) Statistics Austria, March 2018 / Research and Development Expenditures in % of GDP, February 2018 (UNESCO)
2) UNCTAD Statistics, Concentration and diversification indices of merchandise exports, February 2018
3) World Bank Global Financial Inclusion Database, (% aged 15+) saved any money in the past year
4) 2017 GDP in Euro per capita, Eurostat, March 2018
5) Institute for Economics and Peace, Global Peace Index 2017
6) S&P, May 2014
1. Austria‘s favourable fundamentals Investor Information, April 2018
Republic of Austria
0
5
10
15
20
25
30
35
40
45
2009 2010 2011 2012 2013 2014 2015 2016 2017 2018e
in b
n E
UR
Redemptions
Net funding volume
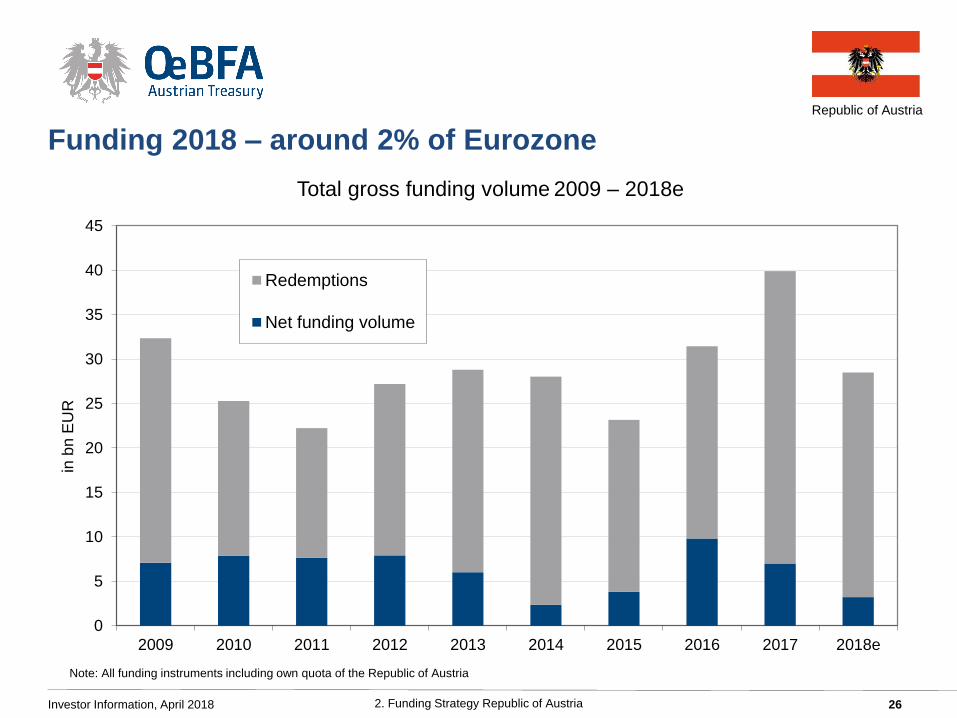
Funding 2018 – around 2% of Eurozone
26 2. Funding Strategy Republic of Austria Investor Information, April 2018
Total gross funding volume 2009 – 2018e
Note: All funding instruments including own quota of the Republic of Austria

Republic of Austria
Funding Outlook 2018
27 2. Funding Strategy Republic of Austria Investor Information, April 2018
Total issuance including all instruments (RAGB, T-bills, EMTN, loans):
2018: 27-30 bn EUR 2017: 39.9 bn EUR (updated forecast from Sept 7, 2017: 38–41bn EUR)
RAGB issuance 2018: 20–23 bn EUR RAGB issuance 2017: 24-26bn EUR (updated forecast from Sept 7, 2017)
outcome: 26.1 bn EUR
2018: one or two syndicated EUR issues
Total portfolio tenor (end-2018): 9.6-10.2 years (end-2017: 10.0 years)
Total portfolio interest fixing period (end-2018): 10.2-10.8 years (end-2017: 10.8 years)
As of April 11, 2018: around 45% of total funding programme completed

Republic of Austria
10.0 y
4.04%
2.47%
3.33
2.88 2.90
2.17
1.53
0.91
0.49 0.30
0.43
0,0
0,5
1,0
1,5
2,0
2,5
3,0
3,5
4,0
4,5
0
2
4
6
8
10
12
14
16
18
20
2009 2010 2011 2012 2013 2014 2015 2016 2017
in % in years
Total Annual Funding: Avg. Maturity Years (lhs) Federal Debt Portfolio: Avg. Maturity Years (lhs)
Federal Debt Portfolio: Avg. Effective Interest Rate % (rhs) Total Annual Funding: Avg. Yield % (rhs)
Key metrics of Federal Debt Portfolio 2009-2017
28 2. Funding Strategy Republic of Austria Investor Information, April 2018

Republic of Austria
29
Auction Calendar & Issuance 2018
• Volume and tenors are announced one week prior to the issue date at www.oebfa.at
• A re-opening of existing issues is regularly done in order to enhance liquidity.
2. Funding Strategy Republic of Austria
Announcement Issue date Value date
Jan 2 Jan 9 Jan 11 EUR 0.52 bn increase of 1.50% RAGB 2016-2047
EUR 0.86 bn increase of 0.50% RAGB 2017-2027
Jan 17 Jan 18 Jan 25 EUR 4.0 bn syndication of 0.75% RAGB 2018-2028
Jan 30 Feb 6 Feb 8 EUR 0.58 bn increase of 0.75% RAGB 2018-2028
EUR 0.83 bn increase of 0.00% RAGB 2016-2023
Feb 27 Mar 6 Mar 8 EUR 0.46 bn increase of 0.75% RAGB 2018-2028
EUR 0.69 bn increase of 0.00% RAGB 2017-2022
Apr 3 Apr 10 Apr 12 EUR 0.40 bn increase of 4.15% RAGB 2007-2037
EUR 0.75 bn increase of 0.75% RAGB 2018-2028
Apr 30 May 8 May 11
May 29 Jun 5 Jun 7
Jun 26 Jul 3 Jul 5
Jul 31 Aug 7
(reserve date)
Aug 9
Aug 28 Sep 4 Sep 6
Sept 25 Oct 2 Oct 4
Oct 30 Nov 6 Nov 8
Dec 4 Dec 11 Dec 13
Investor Information, April 2018
• The average tenor of the outstanding debt is 10.32 years (as of March 31, 2018).
Republic of Austria
Cornerstones of Funding Strategy
30 2. Funding Strategy Republic of Austria
• Diversity of funding sources (geographically and by instruments)
• Financial flexibility (e.g. to address specific investor demand)
• Capitalizing on scarcity value and strong fundamentals
• Secondary market liquidity
• Monthly auctions
• 21 RAGB primary dealers, 9 ATB dealers
• One of the lowest debt rollover ratios
• Conservative debt management strategy
• over 95% fixed rate
• less than 10% short term debt
• No foreign currency risk
• Well-balanced maturity profile
• Reliability, Transparency, stability-oriented approach
• Rigorous Investor Relations Programme
Investor Information, April 2018

Republic of Austria
Financing Instruments Republic of Austria
• Government bonds RAGB
• Debt issuance programme (DIP 144A)
• EMTN-Programme (Euro Medium Term Notes)
• Australian Dollar MTN-Programme – „Kangaroo Programme“
• Online retail savings product (bundesschatz.at)
• Loans and Schuldschein-Format
• Austrian Treasury Bills (ATB-Programme)
31 2. Funding Strategy Republic of Austria Investor Information, April 2018

Republic of Austria
Primary Dealer Panel Republic of Austria
32 2. Funding Strategy Republic of Austria
• Barclays Bank PLC
• BAWAG P.S.K. Bank für Arbeit und Wirtschaft und
Österreichische Postsparkasse AG
• BNP Paribas
• Citigroup Global Markets Limited
• Commerzbank AG
• Deutsche Bank Aktiengesellschaft
• Erste Group Bank AG
• Goldman Sachs International Bank
• HSBC France
• J.P. Morgan Securities plc
• Landesbank Baden-Württemberg
• Merrill Lynch International
• Morgan Stanley & Co. International plc
• Natixis
• NatWest Markets
• Nomura International plc
• Oberbank AG
• Raiffeisen Bank International AG
• Société Générale
• UniCredit Bank AG
• Volksbank Wien AG
• Bank of America Merrill Lynch International
Limited
• Barclays Bank PLC
• BAWAG P.S.K. Bank für Arbeit und Wirtschaft und
Österreichische Postsparkasse AG
• Citigroup Global Markets Limited
• Credit Suisse Securities (Europe) Limited
• Goldman Sachs International
• Raiffeisen Bank International AG
• UBS Limited
• UniCredit Bank AG
21 Primary Dealers for Austrian Government Bonds
9 Dealers for Austrian Treasury Bills
Investor Information, April 2018

Republic of Austria
• defined as short-term debt stock of the previous year plus maturing medium- and long-term debt in % of GDP - indicator for refinancing-risk
• Austria: very low refinancing-risk
• Conservative strategy
Source: S&P Global Sovereign Debt Report 2018, February 2018
Debt Rollover Ratio among lowest worldwide
33 2. Funding Strategy Republic of Austria Investor Information, April 2018
EU 19 2015 2016 2017 2018e
Italy 20,2 18,0 19,0 16,5
Belgium 16,3 15,9 16,2 14,6
Portugal 15,8 20,1 16,4 14,3
Spain 15,7 14,9 14,7 13,2
Greece 17,4 18,3 13,7 10,6
France 13,5 17,1 11,0 10,3
Netherlands 9,3 6,0 8,7 7,5
Finland 5,6 6,9 8,0 6,6
Ireland 6,9 4,9 5,1 6,0
Slovenia 6,1 9,0 6,7 5,4
Germany 6,2 6,1 5,2 5,3
Cyprus 11,4 13,2 3,9 5,3
Malta 6,1 7,9 6,5 5,2
Austria 5,4 6,2 6,1 5,2
Lithuania 4,5 4,3 3,0 5,1
Latvia 7,6 2,6 5,5 4,5
Slovakia 3,3 4,9 5,9 3,7
Luxembourg 0,0 0,0 0,4 1,2
Estonia 0,1 0,1 0,1 0,1
Average 9,0 9,3 8,2 7,4
Others 2015 2016 2017 2018e
Japan 75 70,2 65,6 58,1
USA 16,1 18,1 19,0 19,0
UK 6,9 14,8 7,6 6
Sweden 11,6 7,6 7,3 6,8
Norway 4,3 2,6 3,9 2,8
Turkey 4,1 3,4 3,0 3,0
Switzerland 2,3 2,5 1,9 2,1

Republic of Austria
Source: ECB, Austrian Treasury / data as of 31 March 2018
34
* Public Sector Puchase Programme of the Eurosystem (more details: PSPP Q&A on ECB website)
• Austria‘s capital key: 2.7%
• Weighted avg. maturity of holdings: 8.82 yrs
• Purchases will run at least until September 2018
2. Funding Strategy Republic of Austria
PSPP* holdings of RAGBs as % of outstanding stock
Investor Information, April 2018
0%
5%
10%
15%
20%
25%
30%
35%
Mar
20
15
Apr
20
15
May 2
01
5
Jun
201
5
Jul 20
15
Aug 2
01
5
Sep 2
01
5
Oct 20
15
No
v 2
01
5
De
c 2
01
5
Jan
201
6
Feb
20
16
Mar
20
16
Apr
20
16
May 2
01
6
Jun
201
6
Jul 20
16
Aug 2
01
6
Sep 2
01
6
Oct 20
16
No
v 2
01
6
De
c 2
01
6
Jan
201
7
Feb
20
17
Mar
20
17
Apr
20
17
May 2
01
7
Jun
201
7
Jul 20
17
Aug 2
01
7
Sep 2
01
7
Oct 20
17
No
v 2
01
7
De
c 2
01
7
Jan
201
8
Feb
20
18
Mar
20
18
Apr
20
18
May 2
01
8
Jun
201
8
Jul 20
18
Aug 2
01
8
Sep 2
01
8
0
10
20
30
40
50
in % EUR bn Estimated OeNB holdings of RAGBs % of RAGB stock - projected (rhs)

Republic of Austria
• Over 90% of debt held by investors domiciled in Europe
• Over 80% within the Eurozone1
Diversified investor base with Eurozone as home market (and strong overweight by Austrian investors)
Domestic Non-domestic
Prior to introduction of EUR around 70% (=ATS) 30%
After introduction of EUR around 80% (=EUR) 20%
Distribution by region2
Europe (incl. Austria) 87%
Americas 7%
Asia 3%
Middle East 2%
Africa 1%
Distribution by category2
Banks 38%
Asset managers 30%
Insurance & pension funds 16%
Central banks & int. org. 12%
Retail 3%
Others 1%
Overview: Investors in Austrian Government Bonds
35
Source: 1) IMF (CPIS) / Austrian National Bank
2) Austrian Treasury estimates: syndicated RAGB issues 2012-2018
2. Funding Strategy Republic of Austria Investor Information, April 2018

Republic of Austria
Austria’s stable Investor Base
36 2. Funding Strategy Republic of Austria
Investors by type and region (syndicated RAGB issues)*
Source: Austrian Treasury
* Primary market: 10-year maturities only (excluding PSPP purchases)
Investor Information, April 2018
00%
10%
20%
30%
40%
50%
60%
70%
80%
Central Banks &Official Institutions
Asset Managers Banks Insurance & PensionFunds
Retail Other
2012 2013 2014 2015 2016 2017 2018
00%
10%
20%
30%
40%
50%
60%
70%
80%
90%
Austria Europe excl. Austria Africa Asia Middle East America
2012 2013 2014 2015 2016 2017 2018

Republic of Austria
0
5
10
15
20
25
30
201
82
01
92
02
02
02
12
02
22
02
32
02
42
02
52
02
62
02
72
02
82
02
92
03
02
03
12
03
22
03
32
03
42
03
52
03
62
03
72
03
82
03
92
04
02
04
12
04
22
04
32
04
42
04
52
04
62
04
72
04
82
04
92
05
02
05
12
05
22
05
32
05
42
06
22
06
32
06
42
06
92
07
02
07
12
07
22
07
32
07
42
08
62
08
72
11
62
11
7in
bn
. E
UR
Redemptions as of 31.03.2018
Redemptions as of 31.12.2017
Conservative debt portfolio:
• over 10yrs average maturity
• over 95% fixed rate
• among the lowest rollover ratios
worldwide
2. Funding Strategy Republic of Austria
Debt Portfolio – Redemption Profile
Well Diversified
37 Investor Information, April 2018

Republic of Austria
10y Yields - Austria vs. Germany
38
Source: Bloomberg
2. Funding Strategy Republic of Austria Investor Information, April 2018
-0,5
0,0
0,5
1,0
1,5
2,0
2,5
3,0
3,5
4,0
4,5
5,0
01
.04
.08
01
.07
.08
01
.10
.08
01
.01
.09
01
.04
.09
01
.07
.09
01
.10
.09
01
.01
.10
01
.04
.10
01
.07
.10
01
.10
.10
01
.01
.11
01
.04
.11
01
.07
.11
01
.10
.11
01
.01
.12
01
.04
.12
01
.07
.12
01
.10
.12
01
.01
.13
01
.04
.13
01
.07
.13
01
.10
.13
01
.01
.14
01
.04
.14
01
.07
.14
01
.10
.14
01
.01
.15
01
.04
.15
01
.07
.15
01
.10
.15
01
.01
.16
01
.04
.16
01
.07
.16
01
.10
.16
01
.01
.17
01
.04
.17
01
.07
.17
01
.10
.17
01
.01
.18
01
.04
.18
Yield in %
10y Austria benchmark yield
10y Germany benchmark yield

Republic of Austria
• Strong credit fundamentals, diversified and competitive economy
• No major macroeconomic imbalances
• Sound financial policies (e.g. falling debt/GDP ratio)
• High institutional strength
• Low unemployment rate
• Strong exports and tourism
• Sustainable current account surplus
• Conservative funding strategy
• Net capital exporting country and positive net international investment position
Summary
39 Investor Information, April 2018

Republic of Austria
• www.oebfa.at (Austrian Treasury): auction calendar, debt portfolio, rating reports, etc.
• www.bundesschatz.at (Online retail savings product Republic of Austria)
• www.bmf.gv.at (Federal Ministry of Finance): details on the Austrian budget and Financial Stability Measures
• www.statistik.at (Statistics Austria)
• www.rechnungshof.gv.at/berichte/bundesrechnungsabschluss.html (Austrian Court of Audit): Reports on the Federal Financial Statements (in German only)
• www.oenb.at (Austrian National Bank)
• www.fiskalrat.at (Austrian Fiscal Advisory Council)
• http://ec.europa.eu/eurostat (Eurostat)
• http://europa.eu/efc/about-sub-committee_en (EFC Sub-Committee on EU Sovereign Debt Markets)
• www.oekb.at/en/capital-market/government-bonds/pages/default.aspx (OeKB / Austrian Government Bonds page)
Further Information
40 Investor Information, April 2018

Republic of Austria
Austrian Treasury
Austria – 1010 Vienna, Seilerstaette 24
Phone: (+43 1) 512 25 11- 0
Web: www.oebfa.at
Reuters: AFFA01…07 Bloomberg: RAGB, AUST
Managing Director
Markus Stix, [email protected]
Capital Markets Contact:
Christian Schreckeis, CFA (Head), [email protected], ext. 48
Martin Dymkowski, [email protected], ext. 46
Christoph Frömel, CFA, [email protected], ext. 44
Anja Tritremmel, CFA, [email protected], ext. 37
Money Markets Contact:
Günther Wahl (Head), [email protected], ext. 16
Sabine Denk, CFA, [email protected], ext. 14
Stefan Girsch, MA, FRM, [email protected], ext. 33
Pia Zivanovic-Amann, MBA, [email protected], ext. 47
Contact
41 Investor Information, April 2018