investor presentation · 2017-10-02 · 3 fy2017 key performance indicators review group to focus...
TRANSCRIPT

0www.maybank.com
Investor Presentation
Financial Results2Q FY2017 and 1H FY2017 ended 30 June 2017
30 August 2017
Humanising Financial Services

1
Table of Contents
Executive Summary 2
Results Overview 5
MFRS 9 Update 20
Liquidity Update 24
Prospects & Outlook 27
Appendix:
1. Financial Performance 30
2. Community Financial Services 40
3. Global Banking 45
4. Maybank Singapore 50
5. Maybank Indonesia 53
6. Other segments 57
7. Affiliates 62
Financial Results: 2Q FY2017 and 1H FY2017 ended 30 June 2017

2
Net profit surged
29.9% YoY for
1H FY2017
1H FY2017 OverviewNet income growth of 5.8% to RM11.4 billion, with net profit rising 29.9% to RM3.4 billion
• Net income growth of 5.8% YoY supported by growth in net fund based income of
10.9% YoY as Group loans grew 6.4% across home markets
• NIM improved by 13bps YoY to 2.41% from 2.28%, on the back of improved yields
for securities portfolio and cheaper funding source (Group CASA) growth of 10.4%
• PPOP growth of 5.0% YoY
• Net impairment losses reduced by 33.1% YoY
1
• Loan loss coverage (including regulatory reserve) of 92.6%
• Slower gross impaired loans formation of 4.3% QoQ, with Group GIL ratio at 2.53%
• Net credit charge off of 57 bps
Asset Quality
Indicators
• Strong Group LCR of 146% and lower Group LDR of 93.8% as at June 2017
• Total capital and CET1 ratios at 18.98%* and 13.56%* respectively as at June 2017
• Interim dividend of 23 sen per share
Maintained Robust
Liquidity and Capital
Positions
4
Strong PPOP growth
of 9.6% QoQ
(2Q’17 vs 1Q’17)
2 • PPOP growth was supported by improved net income growth of 4.6% QoQ and
lower overheads expenses
• Net income growth was supported by higher net fee based income of 15.9% QoQ
• Net profit was marginally down due to higher net impairment losses
3
Note:
*After proposed dividend and assumption of 85% reinvestment rate. Fully loaded Group CET1 capital ratio is at 13.37%.

3
FY2017 Key Performance Indicators ReviewGroup to focus on picking up momentum in key markets in 2H FY2017
Note:
* Normalised to exclude the effects for Singapore, Indonesia, Philippines, Greater China and Labuan(USD)
^ Restated following a BNM circular dated 21 June 2017 which excludes structured deposits
Key Performance IndicatorsFY2017
Guidance
1H FY2017 Achievement
Dec 2016 Mar 2017 Jun 2017 QoQ Annualised YoY
Headline KPI
Return on Equity 10%-11% - - - 9.7 -
Other Guidance
Group Loans Growth (reported)
(RM’ billion)6%-7% 485.7 486.1 480.1 (1.2)% (2.3)% 6.4%
Group Loans Growth (normalised)* - (0.4)% (1.3)% 4.4%
• Malaysia (RM’ billion) - 272.0 270.7 273.8 1.1% 1.3% 6.4%
• Singapore (SGD’ billion) - 38.9 39.1 38.5 (1.5)% (2.1)% 4.9%
• Indonesia (Rupiah’ trillion) - 124.7 122.6 123.1 0.3% (2.7)% 3.2%
Group Deposits Growth (reported)
(RM’ billion)6%-7% 517.1^ 508.1^ 511.7^ 0.7% (2.1)% 1.2%
Group Deposits Growth (normalised)* - 1.5% (1.3)% (0.6)%

4
Table of Contents
Executive Summary 2
Results Overview 5
MFRS 9 Update 20
Liquidity Update 24
Prospects & Outlook 27
Appendix:
1. Financial Performance 30
2. Community Financial Services 40
3. Global Banking 45
4. Maybank Singapore 50
5. Maybank Indonesia 53
6. Other segments 57
7. Affiliates 62
Financial Results: 2Q FY2017 and 1H FY2017 ended 30 June 2017

5
P&L Summary: 1H FY2017 Revenue and PPOP up 5.8% and 5.0% respectively, with net profit increasing 29.9% YoY on lower net impairment losses
More
details on RM million1H
FY2017
1H
FY2016YoY
2Q
FY2017
1Q
FY2017QoQ
2Q
FY2016YoY
s.7 Net fund based income * 8,261.4 7,447.2 10.9% 4,143.5 4,117.9 0.6% 3,653.6 13.4%
s.7/8/
31 Net fee based income * 3,102.5 3,290.5 (5.7)% 1,665.8 1,436.8 15.9% 1,692.3 (1.6)%
s.6/30 Net operating income 11,363.9 10,737.7 5.8% 5,809.2 5,554.7 4.6% 5,345.9 8.7%
s.10 Overhead expenses (5,597.5) (5,243.9) 6.7% (2,793.4) (2,804.0) (0.4)% (2,623.7) 6.5%
s.6 Pre-provisioning operating profit (PPOP)¹ 5,766.4 5,493.8 5.0% 3,015.8 2,750.6 9.6% 2,722.2 10.8%
Net impairment losses (1,378.5) (2,059.7) (33.1)% (835.7) (542.8) 54.0% (1,181.2) (29.2)%
Operating profit 4,387.9 3,434.2 27.8% 2,180.1 2,207.9 (1.3)% 1,541.0 41.5%
s.30 Profit before taxation and zakat (PBT) 4,493.6 3,515.3 27.8% 2,244.5 2,249.1 (0.2)% 1,584.0 41.7%
Profit attributable to equity holders of
the Bank (Net Profit)3,361.2 2,586.7 29.9% 1,658.4 1,702.8 (2.6)% 1,159.9 43.0%
EPS - Basic (sen) 32.8 26.4 24.1% 16.1 16.7 (4.0)% 11.8 36.2%
Note:
* From consolidated Group numbers, Insurance and Takaful accounts for 6.6% of net fund based income and 8.9% of net fee-based income
¹ Pre-provisioning operating profit (PPOP) is equivalent to operating profit before impairment losses

6
10,738
6,117
3,848
726 51 646
11,363
6,607
3,762
675 142
812
Total Group CommunityFinancial Services
Group CorporateBanking & Global
Markets
Group InvestmentBanking
Group AssetManagement
Group Insurance &Takaful
1H FY2016
1H FY2017
5,494
2,719 2,942
171 (5)
317
5,766
3,017 2,774
86 64
460
Total Group CommunityFinancial Services
Group CorporateBanking & Global
Markets
Group InvestmentBanking
Group AssetManagement
Group Insurance &Takaful
1H FY2016
1H FY2017
Group Global Banking
Franchise-Led Growth: 1H FY2017 (1/2)Growth in net income and PPOP, mainly driven by rise in Group Community Financial Services income
Net Operating Income
RM
million
RM
million
PPOP
Note:
Net income & PPOP for group includes expenditures of “Head Office & Others” of RM650.0 million for 1H FY2016 and RM634.1 million for 1H FY2017
+25.6%
+5.8%
+8.0% +>100% (2.2)% (7.1)%
(1.0)%
1H FY2016: 4,625 1H FY2017: 4,579
Group Global Banking (5.9)%
1H FY2016: 3,108 1H FY2017: 2,923
+45.4%
+5.0%
+11.0% +>100% (5.7)% (50.0)%

7
7,447
4,662
2,343
143 (3) 491
8,261
5,062
2,508
148 (4)556
Total Group CommunityFinancial Services
Group CorporateBanking & Global
Markets
Group InvestmentBanking
Group AssetManagement
Group Insurance &Takaful
1H FY2016
1H FY2017
Franchise-Led Growth: 1H FY2017 (2/2)Net fund based income rose 10.9% YoY, supported by growth in all business pillars
Note:
Net fund based income includes expenditures of “Head Office & Others” of RM188.6 million for 1H FY2016 and RM10.0 million for 1H FY2017.
Net fee based income includes expenditures of “Head Office & Others” of RM461.3 million for 1H FY2016 and RM624.1 million for 1H FY2017.
Net Fund Based Income
3,291
1,455 1,505
583
53 155
3,103
1,545 1,253
527
146 256
Total Group CommunityFinancial Services
Group CorporateBanking & Global
Markets
Group InvestmentBanking
Group AssetManagement
Group Insurance &Takaful
1H FY2016
1H FY2017
Net Fee Based Income
RM
million
RM
million
Group Global Banking
+13.2%
+10.9%
+8.6% +36.4% +7.1% +3.9%
6.9%
1H FY2016: 2,483 1H FY2017: 2,653
Group Global Banking (10.1)%
1H FY2016: 2,142 1H FY2017: 1,926
+65.0%
(5.7)%
+6.2% >100% (16.7)% (9.7)%

8
3,291 3,254
202
2,233
(2,399)
3,103 2,982
219
2,510
(2,609)
Total Other operating income Fee Income from IslamicOperations
Net Earned InsurancePremiums
Net Insurance Benefits &Claims Incurred, Net Fee& Commission Expensesand Life & Takaful Fund
Tax
1H FY2016
1H FY2017
RM
million
RM million 1H FY2016 1H FY2017 YoY
Commission, service charges and fees 1,772 1,768 (0.2)%
Investment & Trading Income 484 533 10.1%
Unrealised gain/ (losses) on securities 201 319 58.8%
Unrealised gain/ (losses) on derivatives 397 (12) (102.9)%
Foreign Exchange Profit 127 124 (2.2)%
Other Income 273 250 (8.5)%
Net Fee Based Income: 1H FY2017Lower net fee based income, arising mainly from unrealised losses on derivatives
(5.7)% (8.4)% 8.4% +12.4% +8.7%

9
2.43
2.31 2.31
2.27
2.41
FY2013 FY2014 FY2015 FY2016 1H FY2017
NIM Trend: 1H FY2017NIM improved 14 bps YTD to 2.41%
Net Interest Margin (%)
5-Year Trend

10
RM million1H
FY2017
1H
FY2016YoY
2Q
FY2017
1Q
FY2017QoQ
2Q
FY2016YoY
Personnel Costs 3,050.9 2,832.5 7.7% 1,543.9 1,507.0 2.5% 1,418.4 8.9%
Establishment Costs 941.9 941.2 0.1% 459.6 482.3 (4.7)% 465.4 (1.2)%
Marketing Expenses 245.1 275.2 (10.9)% 109.8 135.3 (18.8)% 135.2 (18.8)%
Administration & General (A&G)
Expenses 1,359.5 1,195.0 13.8% 680.1 679.4 0.1% 604.9 12.4%
Total 5,597.5 5,243.9 6.7% 2,793.4 2,804.0 (0.4)% 2,623.7 6.5%
%1H
FY2017
1H
FY2016YoY
2Q
FY2017
1Q
FY2017QoQ
2Q
FY2016YoY
Total Cost to Income ¹ 49.1 48.7 0.4 47.9 50.3 (2.4) 48.9 (1.0)
Group JAW Position (0.9) 5.0 2.2
Overheads: 1H FY2017Overheads growth of 6.7% YoY from higher personnel costs and A&G expenses; QoQ, overheads remained flat
Note:
¹ Total cost excludes amortisation of intangible assets for Maybank Indonesia and Maybank Kim Eng

11
+24.7%
44.9 44.7
Jun 16 Jun 17
187.2 197.1
71.4 78.0
Jun 16 Jun 17
451.1 480.1
Jun 16 Jun 17
Balance Sheet Management Group loans growth of 6.4% YoY supported by Group CASA growth of 10.4%
19.8 21.1
16.6 17.2
Jun 16 Jun 17
Community Financial Services Global Banking
95.6 93.5
23.5 29.3
Jun 16 Jun 17
257.3
36.7
119.3
RM
billion
SG
D b
illion
IDR
tri
llio
n
Gross Loans (YoY)
6.4% 4.9% 3.2% 6.4 %
RM
billion
Group Malaysia Singapore Indonesia
38.5
273.8123.1
10.4 13.4
Jun 16 Jun 17
170.4188.2
Jun 16 Jun 17
5.2%
RM
billion
RM
billion
SG
D b
illion
IDR
tri
llio
n
CASA (YoY)
+5.3%
+9.3%
117.2 123.2
Jun 16 Jun 17
10.4% 28.4% (0.4)%
+6.2%
+3.4%
(2.1)%

12
70%
64%
49%
37%30%
Gross ImpairedLoans
IA+CA Expectedcashflow ofimpairedborrowers
30% discounton expected
cashflow
50% disount inexpectedcashflow
59% discountin expected
cashflow
981.7
370.3
615.7 542.5
830.3
1,846.8
1,372.8
2QFY2016
3QFY2016
4QFY2016
1QFY2017
2QFY2017
1HFY2016
1HFY2017
Allowances for losses on loans
70.5%
74.8%
72.0% 71.2%70.1%*
Loan loss coverage
Allowance for losses on loans
Asset QualityGroup loan loss coverage of 70.1% and 92.6% (including regulatory reserve)
RM
million
Note:
*Loan loss coverage including Regulatory Reserve is 92.6%
Cashflow Coverage for Gross Impaired Loans
Covered by
borrowers’
expected
cashflow

13
8,5559,337
10,568
Dec 15 Mar 16 Jun 16
11,055 11,658 12,158
Dec 16 Mar 17 Jun 17
Asset QualityDespite uptick in Group GIL ratio to 2.53%, formation of impaired loans growth further slowed to 4.3% QoQ
Group GIL Ratio CompositionR
M m
illion
10.0% YTD
4.3% QoQ
RM
million
GIL Ratio Components Jun 2017 Mar 2017 Dec 2016 Sep 2016 Jun 2016
Non Performing Loans (NPL) 1.79% 1.77% 1.64% 1.35% 1.32%
Restructured & Rescheduled (R&R) 0.37% 0.33% 0.39% 0.52% 0.67%
Performing Loans Impaired Due to
Judgmental/ Obligatory Triggers (IPL)0.37% 0.30% 0.25% 0.35% 0.35%
GIL Ratio 2.53% 2.40% 2.28% 2.22% 2.34%
Slower QoQ growth in Group GIL volume from a year ago
5.4% QoQ
23.5% YTD
13.2% QoQ 9.1% QoQ

14
Jun 16 Sep 16 Dec 16 Mar 17 Jun 17
Gross Impaired Loans
Net Impaired Loans
1.38%0.98%
1.30%1.68%
2.29%
1.16%0.76%
1.07%1.37%
1.83%
Asset Quality by MarketStable QoQ asset quality trends in Malaysia and Indonesia but continued weakness in Singapore
3.99% 4.06%
4.36% 4.55% 4.42%
2.99% 2.86%
3.44% 3.54% 3.51%
Jun 16 Sep 16 Dec 16 Mar 17 Jun 17
2.23%2.14%
2.06% 2.13% 2.12%
1.78%1.63%
1.44% 1.51% 1.49%
Jun 16 Sep 16 Dec 16 Mar 17 Jun 17
Malaysia Singapore Indonesia

15
Asset Quality by Line of BusinessAsset quality weakness mainly in retail SME and corporate banking in Singapore and Indonesia
Mortgage Auto Finance Credit Cards
Retail SME Business Banking Corporate Banking
Consumer
Business
Note:
In Malaysia, industry GIL ratio for mortgage is 1.1%, 0.9% for auto finance, and 1.3% for credit cards. In Singapore, industry GIL figure is only available for mortgage, which was
0.5% as at June 2017.
In Indonesia, Business Banking includes Commercial, SME and Micro loans. Maybank Indonesia’s GIL ratios are mapped in accordance to its local regulatory reporting requirements
and does not include R&R.
0.60% 0.61% 0.57% 0.60% 0.60%
0.42% 0.44% 0.45%0.58% 0.60%
0.95%1.27% 1.51% 1.76%
2.22%
-3.00%
-2.00%
-1.00%
0.0 0%
1.0 0%
2.0 0%
3.0 0%
4.0 0%
0.0 0%
0.5 0%
1.0 0%
1.5 0%
2.0 0%
Jun 16 Sep 16 Dec 16 Mar 17 Jun 17
0.53% 0.55% 0.51% 0.53% 0.53%
0.29%0.38% 0.32% 0.34% 0.27%
1.51% 1.54%
1.32%1.23%
1.40%
Jun 16 Sep 16 Dec 16 Mar 17 Jun 17
0.80% 0.79% 0.72% 0.77% 0.80%
2.32%2.13%
2.26%2.08%
1.95%
2.56%2.41% 2.35%
2.48%2.67%
Jun 16 Sep 16 Dec 16 Mar 17 Jun 17
1.43%1.45%
1.70%
2.09% 2.39%
1.66%1.74%
1.57%
1.89%
2.18%1.92%2.08% 2.00% 2.06%
2.05%
Jun 16 Sep 16 Dec 16 Mar 17 Jun 17
11.25% 10.60%11.92% 12.49% 12.50%
1.69%2.34% 2.42% 2.66% 2.67%
1.40% 1.52% 1.77% 1.96% 1.93%
-2.00%
0.0 0%
2.0 0%
4.0 0%
6.0 0%
8.0 0%
10. 00%
12. 00%
0.0 0%
2.0 0%
4.0 0%
6.0 0%
8.0 0%
10. 00%
12. 00%
14. 00%
16. 00%
Jun 16 Sep 16 Dec 16 Mar 17 Jun 17
Malaysia Singapore Indonesia
13.67% 14.20%
10.51% 10.30%11.32%
2.53% 2.47%
1.85% 1.93% 1.97%2.24%1.21%
1.89%2.62%
4.06%
-2.00%
0.0 0%
2.0 0%
4.0 0%
6.0 0%
8.0 0%
10. 00%
12. 00%
0.0 0%
2.0 0%
4.0 0%
6.0 0%
8.0 0%
10. 00%
12. 00%
14. 00%
16. 00%
Jun 16 Sep 16 Dec 16 Mar 17 Jun 17

16
88% comes
from
supporting
upstream
Commodities Exposure: 30 June 2017Maybank Group’s exposure to direct and indirect oil and gas borrowers as well as other commodities
Notes:
• Group exposure is for three home markets
Malaysia, Singapore and Indonesia, based on
Group gross loans as at end June 2017.
• Agriculture includes rubber, oil palm and
cocoa sectors
• Metals and mining includes coal, lignite,
peat, metal ores, tin, iron, steel and non-
ferrous metal sectors
Agriculture
Maybank Group 1.80%
Malaysia 1.32%
Singapore 0.06%
Indonesia 0.42%
Metals & Mining
Maybank Group 1.44%
Malaysia 1.09%
Singapore 0.10%
Indonesia 0.25%
Oil & GasMaybank
GroupMalaysia Singapore Indonesia Others
Loan exposure 3.89% 2.31% 1.24% 0.16% 0.18%
Borrowers’ Status:Segmental Exposure:
Direct & Indirect Oil & Gas:
Borrowers with O&G related exposure
Other Sectors
Group exposure of 3.89% includes funded
and non-funded
34%
36%
6%
24%
Upstream
Supporting Upstream
Downstream
Supporting Downstream
Notes:
Supporting upstream includes services activities incidental to crude oil and natural gas extraction
including surveying. This includes providers of services/ activities related to O&G industry
Excluding non-funded, exposure is 3.47%
37%
4%
43%16%
Normal
Special Mention Account
Watchlist
GIL

17
13.99% 13.77% 13.56%
15.66% 15.41% 15.20%
19.29% 19.19% 18.98%
Dec 16 Jun 17 Jun 17
Total Capital Ratio Tier 1 Capital Ratio CET 1 Capital Ratio
Group
Bank
Strong Capital Position: 30 June 2017Total capital and CET1 ratios (assuming 85% dividend reinvestment rate) at 18.98% and 13.56% respectively
Before proposed
dividend
After proposed
dividend,
assuming 85%
reinvestment
rate 2017 2018Jan 2019
Onwards
Minimum Common Equity Tier
1 Capital4.5% 4.5% 4.5%
Minimum Tier 1 Capital 6.0% 6.0% 6.0%
Minimum Total Capital 8.0% 8.0% 8.0%
Capital Conservation Buffer
(Phase in)1.250% 1.875% 2.500%
Other Capital Buffers
D-SIB Buffer
Countercyclical Capital buffer
Regulatory Requirements
To be determined
0% - 2.5%
Note:
Based on 85% reinvestment rate under the DRP, the fully loaded CET1 Ratio would be at 13.37% (Group) and 12.79% (Bank) respectively.
15.88% 14.74% 14.43%
18.23% 17.09% 16.79%
19.43% 19.85% 19.55%
Dec 16 Jun 17 Jun 17
Total Capital Ratio Tier 1 Capital Ratio CET 1 Capital Ratio

18
61.0%
76.5% 74.9%79.9%
74.7% 71.9%78.5% 76.3% 78.1%
72.2%
Gross Dividend (sen) and Payout Ratio (%)
DividendSingle-tier interim dividend of 23 sen consisting of 5 sen cash portion and 18 sen electable portion
11
2832
22.524 24
20 23
8
44
32
36
33
3133 30
32
FY09 FY10 FY11 FP11 FY12 FY13 FY14 FY15 FY16 1H FY17
Final
Interim
* Actual Reinvestment Rate for Dividend Reinvestment Plan.
# The Net Dividend is 28.5 sen of which 15 sen is single-tier dividend.
• Maybank adopted the single-tier dividend regime with effect from FYE 31 Dec 2012
85.9%*
85.7%*
88.2%*85.9%*
88.5%*
91.1%*
86.1%*
88.6%*
#
82.6%*
8.0
55.0
60.0
36.0
65.0
53.557.0
84.0%*
DividendPayout Ratio
83.7%*
54.0
87.5%*
89.1%*
52.0
83.5%*

19
Table of Contents
Executive Summary 2
Results Overview 5
MFRS 9 Update 20
Liquidity Update 24
Prospects & Outlook 27
Appendix:
1. Financial Performance 30
2. Community Financial Services 40
3. Global Banking 45
4. Maybank Singapore 50
5. Maybank Indonesia 53
6. Other segments 57
7. Affiliates 62
Financial Results: 2Q FY2017 and 1H FY2017 ended 30 June 2017

20
MFRS 9 Preparation (1/3)Maybank Group’s implementation project timeline
Maybank Group has established a project team with the assistance from external consultants to plan and manage
the implementation of MFRS 9. This implementation project consists of three phases:
Completed Phases 1 and 2. Currently
undertaking parallel run of Phase 3.
Impact to the financial statements in the
areas of classification and measurement
for financial assets and impairment.
Classification and measurement
requirements will affect financial
statements presentation and disclosures.
Impairment requirements are expected to
result in higher impairment allowance
losses.
Initial findings from parallel run based on
actual June 2017 Group capital ratios
indicate potential reduction of between
60 bps and 90 bps for day 1 adjustment to
retained earnings on 1 January 2018.
If regulatory reserve can be utilised, the
net impact to Group capital ratios will be
mitigated.
Snapshot Progress Report:
This involves:
i) Parallel run and deployment of solution tools; and
ii) Reassessment of solution tools and conclusion
Phase 3:
Go live
Aims to:
i) Develop detailed implementation plan
ii) Determine accounting policies to be adopted by the Group and the Bank; and
iii) Identify optimal solutions for the Group and the Bank
Phase 2:
Build, test and deploy
Aims to:
i) Provide clear understanding of the new accounting requirements via training
ii) Perform gap and impact assessment
iii) Understand the interdependencies with other projects; and
iv) Develop MFRS 9 blue-print
Phase 1:
Impact assessment and solution development
Nov 2015 – Jul 2016Aug 2016 – Jun 2017 Jul 2017 - current
Note: Impact analysis is subject to further refinement on
methodology.

21
MFRS 9 Preparation (2/3)Key differences of impairment assessments under MFRS 9
*except for purchased or originated credit impaired assets.
• Impairment assessment is now based on expected credit loss model (ECL) instead of incurred loss model. ECL is an
estimate on losses expected from a credit event, such as a payment default.
• Banks will now have to assess if there has been a significant increase in credit risk since initial recognition for the
asset, taking into account relevant forward looking information. This assessment is applicable to the entire
exposure of the borrower, which includes drawn and undrawn commitments.
• To assess the impact of an undrawn commitment, a credit conversion factor (CCF) is applied. CCF is a modelled
assumption on the expected proportion of the undrawn exposure that will be drawn prior to a default occurring.
• Forward looking information includes macroeconomic conditions (e.g. unemployment rate, inflation, OPR, GDP, and
FX) and readily available information providing a fair idea about the borrower’s future circumstances, affecting its
creditworthiness. Forward looking assumptions are applied to probability of default (PD) and loss given default (LGD).
• 12-month ECL is the entire credit loss on a financial asset weighted by the probability that the loss will occur in the
next 12 months.
• Lifetime ECL is an ECL that results from all possible default events over the expected life of the financial assets. It is
estimated based on the present value of all cash shortfalls over the remaining expected life of the financial asset.
12-month ECL
Categories
ECL Recognition Lifetime ECL
Performing
(Initial recognition)*
Under Performing
(Assets with significant increase in
credit risk since initial recognition)*
Non Performing
(Credit impaired assets)
PerformingWatchlist and
Special Mention AccountsNPL, IPL, R&R
Maybank Group’s sub
classifications

22
MFRS 9 Preparation (3/3)Key differences between MFRS 9 and MFRS 139
1. Performing : 12-month ECL
Assessment
Done
Categories
1. Performing : 12-month Incurred Loss
Exposure at Default
(Drawn + Undrawn facility)
Outstanding Balance
(Drawn facility)
Forward looking assumptions applied
to Probability of Default (PD) &
Loss Given Default (LGD)
Incurred Loss PD & LGDProvisioning
Method
MFRS 9 MFRS 139
2. Non Performing :
2. Under Performing : Lifetime ECL
3. Non Performing :
Retail Lifetime ECL
PD = 100%
Non-Retail Impaired borrower
individually assessed
Retail Lifetime Incurred Loss
PD = 100%
Non-Retail Impaired borrower
individually assessed

23
Table of Contents
Executive Summary 2
Results Overview 5
MFRS 9 Update 20
Liquidity Update 24
Prospects & Outlook 27
Appendix:
1. Financial Performance 30
2. Community Financial Services 40
3. Global Banking 45
4. Maybank Singapore 50
5. Maybank Indonesia 53
6. Other segments 57
7. Affiliates 62
Financial Results: 2Q FY2017 and 1H FY2017 ended 30 June 2017

24
89.3% 91.6% 93.9% 95.7% 93.8%
33.7% 34.8%36.0%
37.4% 36.8%
32.3% 33.2%34.6% 35.7% 35.1%
25.0%
30.0%
35.0%
40.0%
45.0%
50.0%
Jun 16 Sep 16 Dec 16 Mar 17 Jun 17
LDR CASA CASA (without IA)
89.4%96.2% 91.5% 90.8% 90.9%
38.3% 40.3% 40.5% 41.2% 40.4%
36.0% 37.6% 38.0% 38.4% 37.6%20.0%
30.0%
40.0%
50.0%
60.0%
70.0%
80.0%
0.0%
10.0%
20.0%
30.0%
40.0%
50.0%
60.0%
70.0%
80.0%
90.0%
100.0%
Jun 16 Sep 16 Dec 16 Mar 17 Jun 17
LDR and CASA RatioImproved Group LDR ratio of 93.8% QoQ as deposits grew ahead of loans; CASA for Singapore and Indonesia improved
SingaporeIndonesia
Group Malaysia
104.8% 102.8% 104.5% 103.9% 102.4%
39.3% 38.1% 38.6% 37.0% 37.2%
90.3% 88.0% 88.9% 88.4% 86.7%
Jun 16 Sep 16 Dec 16 Mar 17 Jun 17
LDR (Bank Level)
81.3% 80.9%87.4%
92.4% 91.4%
23.0% 25.1% 28.1% 30.5% 31.7%
Jun 16 Sep 16 Dec 16 Mar 17 Jun 17Note:
LDR is based on gross loans over customer deposits. LDR excludes structured deposits as per BNM’s circular dated 21 June 2017 “Classification and Regulatory Treatment for
Structured Products under FSA 2013 and IFSA 2013”.
Group and Malaysia LDRs include investment accounts totaling RM27.79 billion for 30 June 2017, RM31.71 billion for 31 March 2017, RM31.54 billion for 31 Dec 2016, RM30.37
billion for 30 Sep 2016 and RM30.96 billion for 30 June 2016

25
Borrowings, 5%
Capital Instruments, 3%
Customer Funding, 75%
FI Deposits, 7%
Equity, 10%
USD, 37%
MYR, 30%
IDR, 9%
JPY, 8%
SGD, 6%
HKD, 5%
Others, 5%
Funding Composition and Utilisation: 30 June 2017Well-diversified funding sources with strong customer funding base and ample liquidity with Group LCR of 146%
Balance Sheet Management
RM685.2b RM56.0b
148136
152134
146
Jun 16 Sep 16 Dec 16 Mar 17 Jun 17
Group LCR (%)
BNM min
requirement
of 80%
Stock of high quality liquid assets
Net cash outflows over 30-day periodRatio
BNM Minimum
Requirement
Year LCR
1 Jan 2017 80%
1 Jan 2018 90%
1 Jan 2019 & thereafter 100%
Liquidity Coverage Ratio (LCR)
Funding Breakdown
Note:
Customer Funding comprises Deposits from Customers & Investment Accounts of Customers.
Securities comprises Financial Assets at FVTPL, Financial Investments AFS & Financial Investments HTM.
By maturity:
≤ 1 Year 26%
> 1 Year 74%
Borrowings and Capital
Instruments by CurrencyFrom Group’s Total Assets of RM752.1 billion
Funding Composition:
Customer Funding 68%
Equity 9%
Borrowings + Capital Instruments 7%
FI Deposits 6%
Asset Classes:
Loans, Advances & Financing 63%
Securities 20%
26
Table of Contents
Executive Summary 2
Results Overview 5
MFRS 9 Update 20
Liquidity Update 24
Prospects & Outlook 27
Appendix:
1. Financial Performance 30
2. Community Financial Services 40
3. Global Banking 45
4. Maybank Singapore 50
5. Maybank Indonesia 53
6. Other segments 57
7. Affiliates 62
Financial Results: 2Q FY2017 and 1H FY2017 ended 30 June 2017

27
Market Outlook2017 industry outlook for our home markets
Key Indicators Industry Outlook
Singapore
Malaysia
Indonesia
• GDP (f) 5.1% (2016: 4.2%)
• System loan (f) 5.4% for 2017
• OPR(f) 3.00% (2016: 3.00%)
• USD/MYR average (f) 4.35 (2016: 4.14)
• Inflation (f) 3.5-4.0% (2016: 2.1%)
• GDP (f) 3.0% (2016: 2.0%)
• System loan (f) 6-7%
• System deposit (f) 6-7%
• 3M SIBOR (f) 1.20% (2016: 0.97%)
• USD/SGD average 1.35 (2016: 1.38)
• Inflation (f) 0.9% (2016: -0.5%)
• GDP(f) 5.1% (2016: 5.0%)
• System loan (f): 10.2%
• System deposit (f): 10.0%
• Reference Rate (f) 4.75% (2016: 4.75%)
• USD/IDR average (f) 13,325 (2016: 13,330)
• Inflation average (f) 4.1% (2016: 3.5%)
• Loans growth to be supported by government
spend on infrastructure projects.
• Relative stability in local currency expected.
• Loan growth supported by better economic
outlook and loan demand.
• NIMs expected to remain stable or potentially
improve slightly.
• Asset quality for O&G support services sector will
continue to deteriorate if oil prices stay low.
• Loans growth in 2H 2017 to be supported by
ongoing expansion in the non-household sector.
• NIM expected to contract in 2H 2017 from
deposits competition.
• Asset quality and capital positions stable.

28
Managed cost growth to maintain CIR of < 50%
NIM management through disciplined pricing
and continued CASA growth
Continued management of asset quality ahead of MFRS 9 adoption in 2018
Maybank Performance OutlookGroup performance in 2H 2017
3
5
Top line growth supported by selective loans growth
and fee income contribution1
4
Growth for loan and deposit to be in line with industry growth2

29
Table of Contents
Executive Summary 2
Results Overview 5
MFRS 9 Update 20
Liquidity Update 24
Prospects & Outlook 27
Appendix:
1. Financial Performance 30
2. Community Financial Services 40
3. Global Banking 45
4. Maybank Singapore 50
5. Maybank Indonesia 53
6. Other segments 57
7. Affiliates 62
Financial Results: 2Q FY2017 and 1H FY2017 ended 30 June 2017

30
68.7%
9.7%
10.0%
11.6%
Malaysia Singapore Indonesia Others
57.5%19.1%
15.3%
8.1%
57.7%25.8%
8.3%8.2%
80.3%
6.1%
9.2%4.4%
62.2%15.7%
14.4%
7.7%
57.8%25.1%
8.2%
8.9%
International & Malaysia Portfolio Mix 1H FY2017
Overseas:
42.2%
1H FY2016
Net Operating Income Profit Before Tax
1H FY2017
Overseas:
37.8%
Overseas:
19.7%
Gross loans*
(Jan 16 – Jun 16)
Overseas:
42.3%
Overseas:
42.5%
Overseas:
31.3%
(Jan 17 – Jun 17)
RM3.52b
Note:
* Including Islamic loans sold to Cagamas and excludes unwinding of interest
RM451.1bRM10.74b
RM4.49b RM480.1bRM11.36b

31
1,437 1,430
131
1,254
(1,378)
1,666 1,552
88
1,256
(1,230)
Total Other operating income Fee Income from IslamicOperations
Net Earned InsurancePremiums
Net Insurance Benefits &Claims Incurred, Net Fee& Commission Expensesand Life & Takaful Fund
Tax
1Q FY2017
2Q FY2017
RM
million
RM million 1Q FY2017 2Q FY2017 QoQ
Commission, service charges and fees 860 908 5.6%
Investment & Trading Income 232 301 29.4%
Unrealised gain/ (losses) on securities 206 113 (45.1)%
Unrealised gain/ (losses) on derivatives (76) 65 >100%
Foreign Exchange Profit 76 48 (37.6)%
Other Income 132 118 (10.5)%
Net Fee Based Income: QoQ
+15.9% +8.5% (32.9)% +0.2% (10.8)%

32
Unaudited Income Statement for Insurance and Takaful Business
RM million1H
FY2017
1H
FY2016YoY
2Q
FY2017
1Q
FY2017QoQ
2Q
FY2016YoY
Net interest income 550.2 484.7 13.5% 299.1 251.1 19.1% 251.7 18.8%
Net earned premiums 2,509.7 2,233.2 12.4% 1,255.8 1,253.9 0.2% 1,064.6 18.0%
Other operating income 432.1 390.7 10.6% 172.3 259.8 (33.7)% 143.1 20.4%
Total operating income 3,491.9 3,108.5 12.3% 1,727.2 1,764.8 (2.1)% 1,459.3 18.4%
Net insurance benefits & claims
incurred, net fee & commission
expenses and life & takaful fund tax
(2,689.3) (2,474.4) 8.7% (1,265.3) (1,424.0) (11.1)% (1,108.5) 14.1%
Net operating income 802.6 634.1 26.6% 461.9 340.8 35.5% 350.8 31.7%
Overhead expenses (353.1) (328.4) 7.5% (186.8) (166.3) 12.3% (167.7) 11.4%
PPOP 449.5 305.7 47.0% 275.1 174.5 57.7% 183.1 50.3%
Net impairment losses (11.6) (33.4) (65.2)% (9.8) (1.8) >100% (14.0) (29.8)%
Operating profit 437.9 272.4 60.8% 265.3 172.6 53.6% 169.1 56.9%
RM million1H
FY2017
1H
FY2016YoY
2Q
FY2017
1Q
FY2017QoQ
2Q
FY2016YoY
Net insurance benefits & claims
incurred, net fee & commission
expenses and life & takaful fund tax
(2,689.3) (2,474.4) 8.7% (1,265.3) (1,424.0) (11.1)% (1,108.5) 14.1%
Less: intercompany elimination 80.7 74.9 7.7% 35.1 45.6 (22.9)% 32.9 6.9%
Total net insurance benefits & claims
incurred, net fee & commission
expenses and life & takaful fund tax
(2,608.6) (2,399.5) 8.7% (1,230.2) (1,378.4) (10.8)% (1,075.7) 14.4%
Reconciliation of net insurance benefits & claims incurred, net fee & commission expenses and life & takaful fund tax
33
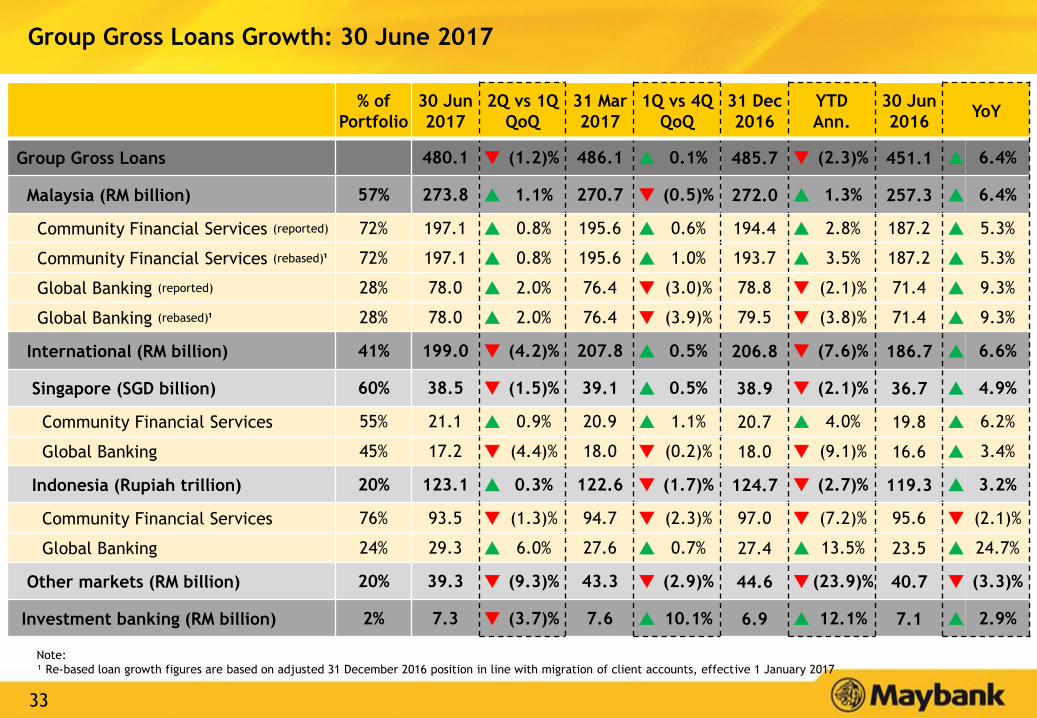
Group Gross Loans Growth: 30 June 2017
% of
Portfolio
30 Jun
2017
2Q vs 1Q
QoQ
31 Mar
2017
1Q vs 4Q
QoQ
31 Dec
2016
YTD
Ann.
30 Jun
2016YoY
Group Gross Loans 480.1 (1.2)% 486.1 0.1% 485.7 (2.3)% 451.1 6.4%
Malaysia (RM billion) 57% 273.8 1.1% 270.7 (0.5)% 272.0 1.3% 257.3 6.4%
Community Financial Services (reported) 72% 197.1 0.8% 195.6 0.6% 194.4 2.8% 187.2 5.3%
Community Financial Services (rebased)¹ 72% 197.1 0.8% 195.6 1.0% 193.7 3.5% 187.2 5.3%
Global Banking (reported) 28% 78.0 2.0% 76.4 (3.0)% 78.8 (2.1)% 71.4 9.3%
Global Banking (rebased)¹ 28% 78.0 2.0% 76.4 (3.9)% 79.5 (3.8)% 71.4 9.3%
International (RM billion) 41% 199.0 (4.2)% 207.8 0.5% 206.8 (7.6)% 186.7 6.6%
Singapore (SGD billion) 60% 38.5 (1.5)% 39.1 0.5% 38.9 (2.1)% 36.7 4.9%
Community Financial Services 55% 21.1 0.9% 20.9 1.1% 20.7 4.0% 19.8 6.2%
Global Banking 45% 17.2 (4.4)% 18.0 (0.2)% 18.0 (9.1)% 16.6 3.4%
Indonesia (Rupiah trillion) 20% 123.1 0.3% 122.6 (1.7)% 124.7 (2.7)% 119.3 3.2%
Community Financial Services 76% 93.5 (1.3)% 94.7 (2.3)% 97.0 (7.2)% 95.6 (2.1)%
Global Banking 24% 29.3 6.0% 27.6 0.7% 27.4 13.5% 23.5 24.7%
Other markets (RM billion) 20% 39.3 (9.3)% 43.3 (2.9)% 44.6 (23.9)% 40.7 (3.3)%
Investment banking (RM billion) 2% 7.3 (3.7)% 7.6 10.1% 6.9 12.1% 7.1 2.9%
Note:
¹ Re-based loan growth figures are based on adjusted 31 December 2016 position in line with migration of client accounts, effective 1 January 2017

34
RM billion% of
Portfolio
30 Jun
2017
2Q vs 1Q
QoQ
31 Mar
2017
1Q vs 4Q
QoQ
31 Dec
2016
YTD
Ann.
30 Jun
2016YoY
Community Financial Services (reported) 72% 197.1 0.8% 195.6 0.6% 194.4 2.8% 187.2 5.3%
Community Financial Services (rebased)¹ 72% 197.1 0.8% 195.6 1.0% 193.7 3.5% 187.2 5.3%
Consumer 58% 157.7 0.9% 156.3 0.6% 155.3 3.1% 149.3 5.7%
Total Mortgage 28% 77.6 1.8% 76.2 1.6% 75.0 7.0% 72.2 7.5%
Auto Finance 16% 44.6 0.9% 44.2 1.9% 43.4 5.7% 41.3 8.1%
Credit Cards 2% 6.6 2.2% 6.5 (4.3)% 6.7 (4.4)% 6.3 4.5%
Unit Trust 10% 26.2 (2.2)% 26.8 (2.7)% 27.6 (9.6)% 27.0 (2.6)%
Other Retail Loans 1% 2.6 3.1% 2.5 (2.7)% 2.6 0.6% 2.5 5.6%
Business Banking + SME (reported) 14% 39.4 0.2% 39.3 0.7% 39.1 1.7% 37.9 4.0%
Business Banking + SME (rebased)¹ 14% 39.4 0.2% 39.3 2.5% 38.4 5.3% 37.9 4.0%
SME (reported) 5% 13.8 4.2% 13.2 5.0% 12.6 18.9% 11.4 21.3%
SME (rebased)¹ 5% 13.8 4.2% 13.2 6.2% 12.4 21.4% 11.4 21.3%
Business Banking (reported) 9% 25.6 (1.9)% 26.1 (1.4)% 26.5 (6.4)% 26.6 (3.5)%
Business Banking (rebased)¹ 9% 25.6 (1.9)% 26.1 0.7% 25.9 (2.4)% 26.6 (3.5)%
Global Banking (Corporate) (reported) 28% 78.0 2.0% 76.4 (3.0)% 78.8 (2.1)% 71.4 9.3%
Global Banking (Corporate) (rebased)¹ 28% 78.0 2.0% 76.4 (3.9)% 79.5 (3.8)% 71.4 9.3%
Total Malaysia 273.8 1.1% 270.7 (0.5)% 272.0 1.3% 257.3 6.4%
Malaysia Loans Growth: 30 June 2017
Note:
¹ Re-based loan growth figures are based on adjusted 31 December 2016 position in line with migration of client accounts, effective 1 January 2017

35
Group Deposits Growth: 30 June 2017
% of
Portfolio
30 Jun
2017
2Q vs 1Q
QoQ
31 Mar
2017
1Q vs 4Q
QoQ
31 Dec
2016
YTD
Ann.
30 Jun
2016YoY
Group Gross Deposits 511.7 0.7% 508.1 (1.7)% 517.1 (2.1)% 505.6 1.2%
Malaysia (RM billion) 59% 304.9 1.0% 301.8 0.3% 300.9 2.7% 305.9 (0.3)%
Savings Deposits 13% 41.1 (0.3)% 41.2 6.4% 38.8 12.1% 42.0 (2.1)%
Current Accounts 27% 82.1 (1.3)% 83.2 0.0% 83.2 (2.5)% 75.2 9.2%
Fixed Deposits 52% 159.8 0.2% 159.5 (2.5)% 163.5 (4.6)% 173.6 (7.9)%
Others 7% 21.9 22.3% 17.9 15.9% 15.5 83.4% 15.2 44.8%
International 41% 208.8 0.3% 208.2 (4.4)% 217.7 (8.2)% 201.2 3.8%
Singapore (SGD billion) 63% 42.1 (0.5)% 42.3 (4.9)% 44.5 (10.7)% 45.1 (6.7)%
Savings Deposits 14% 5.8 (0.1)% 5.8 0.8% 5.7 1.4% 4.6 24.8%
Current Accounts 18% 7.6 6.6% 7.1 4.7% 6.8 23.2% 5.8 31.2%
Fixed Deposits 68% 28.8 (2.3)% 29.4 (7.9)% 32.0 (20.1)% 34.7 (17.2)%
Indonesia (Rupiah trillion) 19% 120.1 1.8% 118.0 (1.1)% 119.3 1.4% 114.4 5.0%
Savings Deposits 20% 24.5 (1.2)% 24.8 (3.1)% 25.6 (8.6)% 26.2 (6.6)%
Current Accounts 17% 20.2 7.0% 18.9 (7.5)% 20.4 (1.9)% 18.7 8.3%
Fixed Deposits 63% 75.4 1.5% 74.3 1.4% 73.3 5.8% 69.5 8.5%
Note:
• Deposits figures are restated following a BNM circular dated 21 June 2017 which excludes structured deposits

36
Key Operating Ratios
(%)1H
FY2017
1H
FY2016YoY
2Q
FY2017
1Q
FY2017QoQ
2Q
FY2016YoY
Return on Equity 9.7 8.3 1.4% 9.6 10.0 (0.4)% 7.5 2.1%
Net Interest Margin 2.41 2.28 13 bps 2.39 2.43 (4) bps 2.23 16 bps
Fee to Income Ratio 27.3 30.6 (3.3)% 28.7 25.9 2.8% 31.7 (3.0)%
Loans-to-Deposit Ratio 93.8 89.3 4.5% 93.8 95.7 (1.9)% 89.3 4.5%
Cost to Income Ratio1 49.1 48.7 0.4% 47.9 50.3 (2.4)% 48.9 (1.0)%
Asset Quality
Gross Impaired Loans Ratio 2.53 2.34 19 bps 2.53 2.40 13 bps 2.34 19 bps
Net Impaired Loans Ratio 1.73 1.72 1 bps 1.73 1.61 12 bps 1.72 1 bps
Loans Loss Coverage 70.1 70.5 (0.4)% 70.1 71.2 (1.1)% 70.5 (0.4)%
Net Charge off rate (bps) (57) (80) 23 bps (68) (45) (23) bps (85) 17 bps
Capital Adequacy (Group)2
CET1 Capital Ratio 13.56 13.59 (3) bps 13.56 13.02 54 bps 13.59 (3) bps
Total Capital Ratio 18.98 18.99 (1) bps 18.98 18.50 48 bps 18.99 (1) bps
Note:
¹ Total cost excludes amortisation of intangibles for Maybank Indonesia and Kim Eng.2 The capital ratios are adjusted based on the assumption of 85% reinvestment rate under the DRP for the period.

37
MFRS 9 Preparation (1/2)Credit loss provided under MFRS 9 standards (FOR ILLUSTRATION PURPOSES ONLY)
Under MFRS 9, there are three categories: Performing, Under Performing and Non Performing.
The ‘Performing’ category applies 12-mth expected credit loss (ECL). The ‘Under Performing’ and ‘Non Performing’
categories apply lifetime ECL.
Under the ‘Non Performing’ category, non-retail impaired borrowers are individually assessed. Shortfall will be provided
as individual allowance if exposure at default (EAD) > discounted cashflow.
Note: PD = Probability of Default. LGD = Loss Given Default. DF = Discount Factor.
: The example provided on this page is purely an illustration and does not reflect an actual situation to evaluate Maybank Group or its financial position
Timeline : Month 5 (PD1 x LGD x EAD1) / DF = ECL
(1.7% x 45% x RM8 mil) / 1.05
= RM58,286
Category : Performing
EAD : RM8 mil
Timeline : Month 7 [(PD1 x LGD x EAD1) / DF1 ] + [(PD2 x LGD x EAD2) / DF2 ] = ECL
[(1.7% x 45% x RM8 mil) / 1.05 ] + [(1.5% x 45% x RM5 mil) / 1.052 ]
= RM58,286 + RM30,612
= RM88,898
Category : Under Performing
(Status: Watchlist)
EAD : RM8 mil
Timeline : Month 9
Impaired borrower is individually assessedCategory : Non Performing
EAD : RM8 mil
Scenario: Corporate Borrower A has a drawn facility of RM10 million over a two year duration.
Assumptions:
PD1 = 1.7%
PD2 = 1.5%
LGD = 45%
EAD1 = RM8 mil
EAD2 = RM5 mil
DF = 5%

38
Timeline : Month 9
Impaired borrower is individually assessedCategory : Non Performing
Outstanding Balance : RM8 mil
MFRS 9 Preparation (2/2)Credit loss provided under MFRS 139 standards (FOR ILLUSTRATION PURPOSES ONLY)
Under MFRS 139, there are only two categories: Performing and Non Performing.
The ‘Performing’ category applies 12-mth incurred loss PD and LGD for performing, watchlist and special mention loans.
Under the ‘Non Performing’ category, non-retail impaired loans are individually assessed. Shortfall will be provided as
individual allowance if outstanding balance > discounted cashflow (DCF).
Note: PD = Probability of Default. LGD = Loss Given Default. DF = Discount Factor.
: The example provided on this page is purely an illustration and does not reflect an actual situation to evaluate Maybank Group or its financial position
Timeline : Month 5 (PD x LGD x outstanding balance) / DF = Incurred Loss
(1.5% x 40% x RM8 mil) / 1.05
= RM45,714
Category : Performing
Outstanding Balance : RM8 mil
Timeline : Month 7 (PD x LGD x outstanding balance) / DF = Incurred Loss
(1.5% x 40% x RM8 mil) / 1.05
= RM45,714
Category : Performing
(Status: Watchlist)
Outstanding Balance : RM8 mil
Scenario: Corporate Borrower A has a drawn facility of RM10 million over a two year duration.
Assumptions:
PD = 1.5%
LGD = 40%
DF = 5%

39
Table of Contents
Executive Summary 2
Results Overview 5
MFRS 9 Update 20
Liquidity Update 24
Prospects & Outlook 27
Appendix:
1. Financial Performance 30
2. Community Financial Services 40
3. Global Banking 45
4. Maybank Singapore 50
5. Maybank Indonesia 53
6. Other segments 57
7. Affiliates 62
Financial Results: 2Q FY2017 and 1H FY2017 ended 30 June 2017

40
Community Financial Services: Overview of Market Share for Malaysia
*** Total bank deposits inclusive of investment asset (“IA”)
^ Without IA. With IA, the market share as at June’17 for Total Core Retail Deposits,
Retail CASA, Retail Savings, Demand Deposits and Retail Fixed Deposits are 19.1%, 25.8%,
28.3%, 21.9% and 16.5% respectively (against MBB retail IA).
* Refers to housing, shophouse and other mortgage loans
** Credit cards market share refer to receivables for commercial
^^ Excluding non-financial transactions as per BNM guidelines
^^^ Industry numbers only available half yearly
Loans
Total consumer (Household) 17.4% 17.5% 17.6% 17.5% 17.5% # 2
Auto (Purchase of transport vehicles) 24.1% 24.7% 25.4% 25.8% 25.7% # 2
Total mortgage * 13.4% 13.3% 13.3% 13.3% 13.2% # 2
Credit cards ** 17.6% 17.7% 18.0% 17.9% 17.9% # 1
Unit trust 52.3% 52.4% 51.6% 51.8% 51.8% # 1
Deposits
Total deposits *** 18.6% 17.3% 17.9% 17.6% 17.9% # 1
Total core retail deposits ^ 18.4% 18.3% 17.9% 18.0% 17.6% # 2
Retail CASA ^ 24.8% 24.7% 24.6% 25.1% 24.9% # 1
Retail savings ^ 30.7% 30.3% 30.3% 28.3% 28.3% # 1
Demand deposits ^ 15.1% 15.4% 15.3% 19.7% 19.4% # 1
Retail fixed deposits ^ 15.2% 15.0% 14.5% 14.3% 13.9% # 2
Channels
Internet banking - Subscriber base 44.1% 43.5% 44.6% 44.3% 43.6% # 1
Mobile banking - Subscriber base 28.2% 30.2% 31.4% 32.0% 31.7% # 1
Internet banking - Transaction Volume 51.9% 51.8% 52.2% 56.6% 56.6% # 1
Mobile banking - Transaction Volume 62.2% 63.0% 59.3% 42.7% 43.5% # 1
Branch network 19.3% 19.3% 18.8% 18.8% 18.6% # 1
Mar-17Sep-16Market share Jun-16
Mar-17
vs
Jun-17
Market
positionDec-16 Jun-17
^^ ^^ ^^
^^^

41
Business Banking + SME loans grew by 4.0% YoY to RM39.4
billion led by SME growth of 21.3% YoY
Community Financial Services: Overview of Malaysia Loans Portfolio
177.8 186.5 191.8
7.27 7.38 7.47
Jun 16 Dec 16 Jun 17
TFA Product per customer
102.8 103.8 103.8
3.25 3.36 3.46
Jun 16 Dec 16 Jun 17
TFA Product per customer
37.9 39.1 39.4
0
10
20
30
40
50
60
Jun 16 Dec 16 Jun 17
149.3 155.3 157.7
020406080
100120140160180200
Jun 16 Dec 16 Jun 17
+5.7% YoY
Consumer loans grew 5.7% YoY to RM157.7 billion led by
mortgage and auto finance growth
Note:
• Customer classification: HNW (IA>RM3m, TFA>RM4m); Affluent (IA between RM250k to RM3m, TFA between RM1m to <RM4m)
• TFA: Total Financial Assets (Deposits, Investments, Financing & Protection).
+3.1% YTD Ann.
HNW and Affluent customer TFA grew 7.9% YoY to
RM191.8 billion
Mass customer cross sell ratio improved to 3.46x
+4.0% YoY
+1.7% YTD Ann.
RM
billion
+1.0% YoY
RM
billion
+ 7.9 % YoY
RM
billion
RM
billion
+5.6% YTD Ann.
Note:
• Business Banking and SME figures are before migration of accounts.

42
Community Financial Services: Overview of Malaysia Deposits Portfolio
215.8 214.0 208.0
0.0
50.0
100.0
150.0
200.0
250.0
Jun 16 Dec 16 Jun 17
(5.6)% YTD Ann.
133.6 136.8 137.4
0.020.040.060.080.0
100.0120.0140.0160.0180.0200.0
Jun 16 Dec 16 Jun 17
+2.8% YoY
+0.9 % YTD Ann.
Our deposit strategy focused on growing CASA, which has
improved our NIM.
Consumer deposits show positive growth of +2.8% YoY
mainly driven by strong growth in CASA at 6.7% YoY.
82.2 77.2 70.6
0
20
40
60
80
100
120
Jun 16 Dec 16 Jun 17
(14.1)% YoY
(17.2)% YTD Ann.
RM
billion
Total CFS deposits contracted by -3.6% YoY, due to
reduction in costly fixed deposits
Business Banking + SME deposits contracted by -14.1%
YoY
Consumer deposits grew +2.8% YoY
(3.6)% YoY
RM
billion
RM
billion
Note:
• Business Banking and SME deposits figures are before migration of accounts.

43
Community Financial Services: Overview of CFS Malaysia Asset Quality
Total GIL ratio for consumer financing portfolio remain
stable at 0.5%, lower than industry average of 1.1%.
Combined GIL ratio for Business Banking + SME showed
a slight increase to 8.8%, due to impairments from
Business Banking.
736.3 739.0792.1
0.5 0.5 0.5
Jun 16 Dec 16 Jun 17
GIL (RM'm) GIL (%)
3,931.1 4,134.3 4,257.7
2.1 2.1 2.2
Jun 16 Dec 16 Jun 17
GIL (RM'm) GIL (%)
3,194.83,395.2 3,465.7
8.5 8.7 8.8
Jun 16 Dec 16 Jun 17
GIL (RM'm) GIL for SME + BB (%)
Total CFS GIL relatively stable at 2.2%
Slight uptick in Business Banking + SME GIL
Consumer GIL remained stable at 0.5%
44
Table of Contents
Executive Summary 2
Results Overview 5
MFRS 9 Update 20
Liquidity Update 24
Prospects & Outlook 27
Appendix:
1. Financial Performance 30
2. Community Financial Services 40
3. Global Banking 45
4. Maybank Singapore 50
5. Maybank Indonesia 53
6. Other segments 57
7. Affiliates 62
Financial Results: 2Q FY2017 and 1H FY2017 ended 30 June 2017

45
11.6
23.2
36.6
11.7
27.9
39.2
11.2
28.0
38.8
Jun 17 Dec 16 Jun 16
RM billion
Note:
‘Term Loan’ now includes foreign currency denominated accounts, while ‘Trade
Finance and Others’, which previously included ‘Short Term Revolving Credit’, is now
combined with ‘Overdraft’.
Term Loan
Global Banking: Overview of Malaysia Corporate Banking Portfolio
Corporate Banking GIL ratio at 1.97% as at June 2017
Short Term
Revolving
Credit
Trade
Finance and
Others
+ 20.8% YoY
(3.3) % YoY
+6.0% YoY
25.3%25.5%
26.2%
25.1%24.7%
Jun 16 Sep 16 Dec 16 Mar 17 Jun 17
2.53% 2.47%
1.85% 1.93% 1.97%
Jun 16 Sep 16 Dec 16 Mar 17 Jun 17
Note: Market share of total trade products (On Balance Sheet items, Contingent
Liabilities and Others)
Trade Finance market share Total GB loans increased 9.3% YoY to RM78.0 billion

46
Group Securities Portfolio*:
38.2% Foreign Securities as at 1H FY2017
Group Securities Portfolio* grew 6.9% YoY
33% of GM PDS (Maybank Conventional Malaysia) rated
“AA” or above as at 1H FY2017
Global Banking: Overview of Group Global Markets Portfolio
1H FY20171H FY2016
21.1%
25.3%
28.3%
15.7%
9.6%
RM 139.0
billion
Government
Securities
- Domestic
Government
Securities
- Foreign
PDS/Corp
Bonds
- Domestic
PDS –
Foreign
Others
(NIDs, BA, etc)
25.5%
20.0%29.8%
18.2%
6.5%
RM 148.7
billion
Government
Securities
- Domestic
Government
Securities
- Foreign
PDS/Corp
Bonds
- Domestic
PDS –
Foreign
Others
(NIDs, BA, etc)
64.5 61.4 57.968.2 67.7
61.2 63.762.8
68.6 71.4
13.3 12.910.2
11.9 9.6
Jun 16 Sep 16 Dec 16 Mar 17 Jun 17
Govt. Securities PDS/Corp Bonds Others
+6.9%
RM
billion
139.0 138.0130.9
148.7
49.3%
19.1%
20.3%
1.9%
0.6% 8.8%
RM25.5
billion
A
<A
Commercial
Papers
Others
1H FY2016
AAA
AA
65.3%
16.1%
17.2%
0.3%
0.2%0.9%
RM24.8
billion
A
<ACommercial
Papers
Others
1H FY2017
AAA
AA
Note: * Group Securities Portfolio is inclusive of Financial assets designated upon initial
recognition (part of FVTPL)
148.7
Note: ‘Others’ category refers to Government Guaranteed bonds, partially Government
Guaranteed bonds and non rated bonds

47
Malaysia36%
Singapore26%
Thailand23%
Indonesia4%
Philippines2%
Hong Kong5%
Others4%
YTD June FY17 Brokerage Market Share by Country
1 Singapore & Vietnam’s YTD ranking data are not available.
Note: Maybank Kim Eng represents the combined business of Maybank IB and business segments under Maybank Kim Eng Holdings
Global Banking: Overview of Group Investment Banking Portfolio
Country RankMarket
Share
Trading Value
(USD’m)
Thailand 1 7.5% 22,260
Malaysia 2 10.9% 15,991
Philippines 9 4.2% 1,643
Indonesia >10 2.3% 2,947
Hong Kong Tier 2 0.7% 15,316
Singapore N/A1 3.9% 8,498
Vietnam N/A1 1.8% 876
1H FY2017 Fee-based Income for Malaysia
Brokerage Fees56.9%
Arranger Fees8.1%
Underwriting & Placement Fees3.1%
Advisory Fees11.8%
Agency/ Guarantee Fees
3.1%
Other Fee Income17.0%
1H FY2017 Total Income Breakdown by Country
RM674.7 mil
Total Income for Maybank Kim Eng
726.0
674.7
400.00
500.00
600.00
700.00
800.00
1H FY2016 1H FY2017
(7.1)%
RM
mil

48
Global Banking: Notable Deals for 1H FY2017

49
Table of Contents
Executive Summary 2
Results Overview 5
MFRS 9 Update 20
Liquidity Update 24
Prospects & Outlook 27
Appendix:
1. Financial Performance 30
2. Community Financial Services 40
3. Global Banking 45
4. Maybank Singapore 50
5. Maybank Indonesia 53
6. Other segments 57
7. Affiliates 62
Financial Results: 2Q FY2017 and 1H FY2017 ended 30 June 2017

50
Maybank Singapore: P&L Summary
(SGD mil) 1H FY2017 1H FY2016* YoY
Net Fund Based income 334.27 270.23 +23.7%
Net Fee Based income 161.42 132.75 +21.6%
Net income 495.68 402.98 +23.0%
Overhead expenses (185.55) (179.33) +3.5%
Operating profit 310.13 223.65 +38.7%
Profit before taxation 150.63 147.83 +1.9%
Net fund-based income rose 23.7%, due to net interest margin improvement and loan growth of 4.9%.
Fee-based income increased 21.6%, led by higher wealth management, credit related and treasury income.
Overhead expenses rose 3.5% arising from higher revenue-related spend.
Buoyed by a combination of broad-based revenue growth and disciplined cost management, operating profit expanded
38.7%.
PBT rose by a smaller pace of 1.9% to reach SGD 150.63 million as additional loan loss allowances were set aside, mainly
for oil & gas related exposure.
Note:
* 1H FY2016 figures are the restated numbers to align the Islamic banking income re-classification adjustments made effective 2017.

51
5.2 6.1 6.8
15.0 14.9 14.1
5.2 6.4 6.6
19.8 17.1 14.8
Jun 16 Dec 16 Jun 17
Consumer -Time Deposits
Consumer CASA
Business TimeDeposits
Business CASA
4.6 5.7 5.85.8 6.8 7.6
34.8 32.0 28.8
Jun 16 Dec 16 Jun 17
Time Deposits
Demand Deposits
Savings
7.9 8.4 8.1
4.2 4.9 4.6
4.0 4.2 3.7
6.0 6.3 6.5
9.4 9.7 10.1
1.7 1.8 1.93.4 3.5 3.4
Jun 16 Dec 16 Jun 17
Other(Consumer)
Car Loan
Housing Loan
Others(Corporate)
Non-Bankfinancial Inst
GeneralCommerce
Building &Const
Maybank Singapore loans rose 4.9% YoY
Diversified Loan Portfolio
38.9
Consumer
40%
Corporate
60%
0.4%-1.9%
4.5%6.4%
4.9%
-3.6% -5.0%
0.5%
5.8%
6.4%
-10.0%
10.0%
Jun 16 Sep 16 Dec 16 Mar 17 Jun 17
Maybank Singapore Growth Industry Growth
+4.9% YoY
Maybank Singapore: Overview of Loans and Deposits Portfolio
% YoY change
38.536.7
(6.7)% YoY
Consumer
51%
Corporate
49%
SG
D b
illion
Consumer deposits account for 51% of deposits
SG
D b
illion
CASA Ratio:
31.7%SG
D b
illion
Robust CASA growth of 28.4% YoY; CASA ratio also
improved to 31.7% in June 2017 from 23.0% a year ago
Lower consumer deposits at SGD21.4 billion from reduced FDs but
mitigated by CASA growth of 25.5% YoY
Higher business deposits at SGD20.9 billion as CASA grew 31.3% YoY
44.5 42.245.2

52
Table of Contents
Executive Summary 2
Results Overview 5
MFRS 9 Update 20
Liquidity Update 24
Prospects & Outlook 27
Appendix:
1. Financial Performance 30
2. Community Financial Services 40
3. Global Banking 45
4. Maybank Singapore 50
5. Maybank Indonesia 53
6. Other segments 57
7. Affiliates 62
Financial Results: 2Q FY2017 and 1H FY2017 ended 30 June 2017

53
Maybank Indonesia: P&L Summary
(IDR bil) 1H FY2017 1H FY2016* YoY 2Q FY2017 1Q FY2017 QoQ
Net Fund Based income 3,836 3,585 7.0% 1,936 1,900 1.9%
Net Fee Based income 1,457 1,334 9.2% 890 567 57.0%
Net income 5,292 4,919 7.6% 2,826 2,467 14.6%
Overhead expenses (3,064) (2,770) 10.6% (1,621) (1,444) 12.3%
Personnel (1,234) (1,199) 2.9% (622) (612) 1.7%
General and Administrative (1,830) (1,571) 16.5% (999) (832) 20.1%
Operating profit 2,228 2,149 3.7% 1,205 1,023 17.8%
Provisions Expenses (836) (991) (15.7)% (478) (358) 33.5%
Non Operating (Expense) / Income (11) 4 (>100)% (3) (8) (59.4)%
Profit Before Tax and Non-Controlling Interest 1,381 1,162 18.8% 724 657 10.2%
Tax and Non-Controlling Interest (383) (304) 26.0% (216) (167) 29.1%
Profit After Tax and Non-Controlling Interest 998 858 16.3% 508 490 3.7%
EPS - Basic (IDR) 14.74 12.67 16.3% 7.50 7.23 3.7%
Note:
* FY2016 figures restated to reflect Indonesia long form report for consistency.

54
22,790
240
23,030 20,324
171
20,495
New Used Total
Jun 16 Jun 17
437
527
145175
Jun 16 Jun 17
Revenue Profit Before Tax
Financing – stand aloneIDR billion
(10.8)%
(28.8)%
(11.0)%
+20.4% +21.9%
Asset Quality Unit Financing (unit)
Revenue and Profit Before Tax IDR billion
Maybank Indonesia: Overview of Maybank Finance Operations
+20.4%
0.36%0.34%
0.32% 0.33% 0.32%
0.44%0.42%
0.39%0.41%
0.39%
Jun 16 Sep 16 Dec 16 Mar 17 Jun 17
NPL Net NPL Gross
5,514
6,722
Jun 16 Jun 17

55
119
29
75
224
103
16
88
207
New Used Multipurpose Total
Jun 16 Jun 17
9371020
49 75
Jun 16 Jun 17
Revenue Profit Before Tax
Financing – stand aloneIDR billion
+8.8% +5.5%
Asset Quality Unit Financing (‘000 unit)
Revenue and Profit Before Tax IDR billion
+52.6%
1.18% 1.36% 1.25% 1.17% 1.24%
3.55%3.84%
3.32%2.96% 2.90%
Jun 16 Sep 16 Dec 16 Mar 17 Jun 17
NPL Net NPL Gross
5,243 5,531
Jun 16 Jun 17
(13.8)% (46.7)%
(7.7)%
+17.1%
Maybank Indonesia: Overview of WOM Finance Operations

56
Table of Contents
Executive Summary 2
Results Overview 5
MFRS 9 Update 20
Liquidity Update 24
Prospects & Outlook 27
Appendix:
1. Financial Performance 30
2. Community Financial Services 40
3. Global Banking 45
4. Maybank Singapore 50
5. Maybank Indonesia 53
6. Other segments 57
7. Affiliates 62
Financial Results: 2Q FY2017 and 1H FY2017 ended 30 June 2017

57
Maybank Islamic, 56.4%
Maybank Conventional,
Malaysia, 43.6%
Islamic Banking: Performance Overview
Group Islamic Banking Financial Performance
Maybank Islamic: Key Financial Ratios
Maybank Islamic: Total Gross Financing grew to RM154.5
billionRM million 1H FY2017 1H FY2016 YoY
Total Income 2,170.8 1,820.7 19.2%
Profit Before Tax 1,267.6 826.6 53.4%
Financing & Advances 165,004.6 144,466.2 14.2%
Deposits & Investment
Account:148,491.8 145,171.6 2.3%
Deposits from Customers 120,705.3 114,207.6 5.7%
Investment Account 27,786.6 30,964.0 (10.3)%
Key Financial Ratios 1H FY2017 1H FY2016
Net Profit Margin (YTD) 1.94% 1.85%
Total Capital Ratio (TCR) 17.77% 18.43%
Cost to Income Ratio (CIR) 36.32% 37.53%
Direct FDR1 96.4% 91.3%
Adjusted FDR with LTIF2 87.7% 84.5%
Maybank Islamic Contribution to Maybank Malaysia Loans
and Financing as at June 2017
Year Contribution
Jun 2016 53.1%
Sep 2016 53.2%
Dec 2016 54.5%
Mar 2017 54.9%
Jun 2017 56.4%
Note:
1) Direct Financing to Deposits Ratio (FDR) comprising gross financing against deposit
and Unrestricted Investment Account (exc. RPSIA assets and liabilities)
2) Adjusted FDR comprising adjusted financing against adjusted deposit (exc. RPSIA
assets and liabilities) including long term interbank funding (LTIF)
Cashline for retail has been reclassified from others to mortgage and term respectively
Group Islamic Banking’s performance has improved YoY, deriving from key markets in
Malaysia, Indonesia and Singapore
CFS:9% GB:20%
14%
7%
12%
24%
5%
16%

58
Maybank Islamic Market Share (Malaysia) as of June 2017
Maybank Islamic ranks No.1 by Asset Market Share
in Malaysia
Source: BNM monthly statistical bulletin and latest respective Bank’s Financial
Statements
MalaysiaAsset Market Share
Mar 17Rank
Maybank Islamic 30% 1
CIMB Islamic 12% 2
Public Islamic 9% 3
Source: Bloomberg
Sukuk League Table Ranking June 2017
Key Products Jun 17 Jun 16
Automobile Financing 44.7% 42.9%
Home 28.1% 28.0%
Term Financing 29.6% 29.9%
Source for industry numbers: BNM Monthly Statistical Bulletin
Islamic Banking: Market Share
Market Share by Product (Malaysia) as of June 2017
Source for industry numbers: BNM Monthly Statistical Bulletin
33.8% 33.9%34.4%
33.9% 33.9%
31.3%
30.3% 30.3%29.7% 29.5%
Jun 16 Sep 16 Dec 16 Mar 17 Jun 17
Financing Deposits & Investment Accounts
Market Share
(%)
Amount
(USD million)Issues
#5 Maybank 6.54% 2,151 49
Market Share
(%)
Amount
(USD million)Issues
#2 Maybank 22.66% 1,883 38
MYR Sukuk League Table
Ranking
Global Sukuk League Table
Ranking

59
8.0%
10.6%
12.1%
0.0% 5.0% 10.0% 15.0%
HL-MSIG Ins. & Tak.
Allianz Insurance
Etiqa Ins. & Tak.
7.6%
14.2%
14.8%
22.1%
0.0% 5.0% 10.0% 15.0% 20.0% 25.0%
Etiqa Ins. & Tak.
GE Ins. & Tak.
Prudential Ins. & Tak.
AIA Ins. & Tak.
304.5
472.4
1H FY2016 1H FY2017
Insurance and Takaful: Performance Overview
Total Assets (RM billion)
Gross Premium
Profit Before Tax (RM million)
Life / Family (New Business) Market Share
No. 4 in Life/Family
(New Business)
No. 1 in General
Insurance and
Takaful
General Insurance and Takaful Market Share
55.1% YoY
0 500 1,000 1,500 2,000 2,500 3,000 3,500
Total Life/Family & General
Total General
Misc
Personal Accident
MAT
Motor
Fire
Total Life/Family
Group Premium
Credit Premium
Regular Premium
Single Premium
RM Million
1H FY2017
1H FY2016
>100%
14.5%
23.5%
0.2%
21.5%
7.0%
8.3%
(1.7)%
(25.7)%
(15.6)%
(9.3)%
5.1%
32.6 31.9 33.1
Jun 16 Dec 16 Jun 17
1.5% YoY
Note :
PBT includes estimated transfer of RM48.8 million from Family Fund in 1H FY2017
Note: Market Share is for period Apr’16 – Mar’17 (Source: LIAM / ISM Statistics)

60
61,136.8 64,187.0
72,949.6 75,473.0
Dec 16 Jun 17
Gross Loans
CustomersDeposits
2,623.2 2,837.7
377.2
765.5
1H FY2016 1H FY2017
Revenue
PBT
Maybank Philippines: Performance Overview
Revenue increased by 8.2% YoY, led by higher net interest
income (NII).
Increase in NII contributed by higher interest income from
term loans.
PBT increased by 102.9% YoY driven by higher revenue,
coupled with lower overhead expenses and provisioning.
Gross loans rose by 10.0% YTD ann. driven by growth in term
loans.
Customer deposits rose by 6.9% YTD ann. supported by growth
in term deposit and saving account.
Gross impaired loans ratio improved to 2.32% due to lower
NPL.
+ 8.2% YoY
+>100% YoY
Revenue and PBT
Gross Loans and Deposits
Key Highlights
PESO
Mil
PESO
Mil
+10.0%*
+6.9%*
Key Ratios 1H FY2017 1H FY2016
Return on assets 1.55% 0.83%
Return on equity 13.56% 3.58%
Cost-to-income ratio 71.32% 72.33%
Loans to Deposit ratio 85.05% 92.44%
Gross Impaired Loans Ratio 2.32% 4.60%
No. of branches 74 80
Note: *Annualised growth

61
Table of Contents
Executive Summary 2
Results Overview 5
MFRS 9 Update 20
Liquidity Update 24
Prospects & Outlook 27
Appendix:
1. Financial Performance 30
2. Community Financial Services 40
3. Global Banking 45
4. Maybank Singapore 50
5. Maybank Indonesia 53
6. Other segments 57
7. Affiliates 62
Financial Results: 2Q FY2017 and 1H FY2017 ended 30 June 2017

62
943.7
1,252.0
103.5
265.8
1H FY2016 1H FY2017
Revenue
PBT
An Binh Bank: Performance Overview
Revenue increased by 32.7% YoY, mainly due to higher net
interest income and fee income.
PBT increased by 156.8% or VND162.3b YoY, mainly
contributed by higher revenue.
Gross loans expanded by 8.5.% YTD ann. mainly due to higher
retail lending.
Customer deposits increased by 13.8% YTD ann. mainly due to
growth in saving account.
Gross NPL ratio increased by 1.1%, mainly contributed by
higher NPL.
Key Ratios 1H FY2017 1H FY2016
Return on assets 0.70% 0.30%
Return on equity 9.10% 3.60%
Cost-to-income ratio 52.34% 54.86%
Loans to Deposit ratio 92.56% 91.58%
Gross NPL Ratio 2.60% 1.50%
VN
D B
ilVN
D B
il
+ 32.7 % YoY
+>100% YoY
49,555.2
51,665.0 52,227.5
55,818.5
Dec 16 Jun 17
Gross Loans
CustomersDeposits
+ 8.5 %*
+ 13.8% *
Gross Loans and Deposits
Revenue and PBTKey Highlights
Note: *Annualised growth

63
MCB Bank: Performance Overview
30.3 30.4
19.5 17.7
1H FY2016 1H FY2017
Revenue
PBT
+ 0.2 % YoY
(9.5)% YoY
384.0 432.5
776.0
891.2
Dec 16 Jun 17
Gross Loans
CustomersDeposits
+ 29.7 %*
+ 25.3%*
PKR B
ilPKR B
il
Key Ratios 1H FY2017 1H FY2016
Return on assets 2.31% 2.06%
Return on equity 22.82% 18.83%
Cost-to-income ratio 47.39% 38.88%
Loans to Deposit ratio 48.53% 50.35%
Gross NPL Ratio 5.20% 5.46%
Gross Loans and Deposits
Revenue increased marginally by 0.2% YoY, owing to better
Non-Interest Income (NOII).
Higher NOII was mainly attributed from gain on sale of
securities.
PBT decreased by 9.5% YoY, mainly attributed to higher
provisioning.
Gross loans increased by 25.3% YTD ann. arising from growth
in domestic loans and Islamic financing.
Customer deposits grew by 29.7% YTD ann. mainly led by
higher CASA growth.
Revenue and PBTKey Highlights
Note: *Annualised growth

64
Dato’ Amirul Feisal Wan Zahir
Group Chief Financial Officer
Contact: (6)03-2074 7703
Email: [email protected]
MALAYAN BANKING BERHAD
14th Floor, Menara Maybank
100, Jalan Tun Perak
50050 Kuala Lumpur, Malaysia
Tel : (6)03-2070 8833
www.maybank.com
Jeeva Arulampalam
Head, Group Investor Relations
Contact: (6)03-2074 8017
Email: [email protected]
Disclaimer. This presentation has been prepared by Malayan Banking Berhad (the “Company”) for information purposes only and does not purport to contain all the
information that may be required to evaluate the Company or its financial position. No representation or warranty, express or implied, is given by or on behalf of the
Company as to the accuracy or completeness of the information or opinions contained in this presentation.
The presentation does not constitute or form part of an offer, solicitation or invitation of any offer, to buy or subscribe for any securities, nor should it or any part of
it form the basis of, or be relied in any connection with, any contract, investment decision or commitment whatsoever.
The Company does not accept any liability whatsoever for any loss howsoever arising from any use of this presentation or their contents or otherwise arising in
connection therewith.
Investor Relations Contact
Humanising Financial Services