investor presentation
TRANSCRIPT

NYSE:TCTSX:TCM
Investor PresentationNovember 2014

2
Cautionary Statement
This document contains ‘‘forward-looking statements’’ within the meaning of the United States Private Securities Litigation Reform Act of 1995, Section 27A of theSecurities Act of 1933, as amended, Section 21E of the Securities Act of 1934, as amended and applicable Canadian securities legislation and are intended to becovered by the safe harbor provided by these regulations. These forward-looking statements can, in some cases, be identified by the use of such terms as "believe,""project," "expect," "anticipate," "estimate," "intend," "future," "opportunity," "plan," "may," "should," "will," "would," "will be," "will continue," "will likely result," andsimilar expressions. Our forward-looking statements may include, without limitation, statements with respect to: future financial or operating performance of theCompany or its subsidiaries and its projects; access to existing or future financing arrangements; future inventory, production, sales, payments from customers, cashcosts, capital expenditures and exploration expenditures; future earnings and operating results; expected concentrate and recovery grades; estimates of mineralreserves and resources, including estimated mine life and annual production; projected ramp-up at Mt. Milligan Mine, including expected achievement of designcapacities and whether additional crushing is needed; future concentrate shipment dates and sizes; future operating plans and goals; and future prices and marketconditions for molybdenum, copper, gold and silver.
Where we express an expectation or belief as to future events or results, such expectation or belief is expressed in good faith and believed to have a reasonablebasis. However, our forward-looking statements are based on current expectations and assumptions that are subject to risks and uncertainties which may causeactual results to differ materially from future results expressed, projected or implied by those forward-looking statements. Important factors that could cause actualresults and events to differ from those described in such forward-looking statements can be found in the section entitled ‘‘Risk Factors’’ in Thompson Creek’s AnnualReport on Form 10-K for the year ended December 31, 2013, Quarterly Reports on Form 10-Q and other documents filed on EDGAR at www.sec.gov and on SEDARat www.sedar.com. Although we have attempted to identify those material factors that could cause actual results or events to differ from those described in suchforward-looking statements, there may be other factors, currently unknown to us or deemed immaterial at the present time, that could cause results or events to differfrom those anticipated, estimated or intended. Many of these factors are beyond our ability to control or predict. Given these uncertainties, the reader is cautioned notto place undue reliance on our forward-looking statements. We undertake no obligation to update or revise publicly any forward-looking statements, whether as aresult of new information, future events, or otherwise, and investors should not assume that any lack of update to a previously issued forward-looking statementconstitutes a reaffirmation of that statement.

3
Company Overview NYSE: TC; TSX: TCM
Overview:Three operating mines and one processing facility.
Mt. Milligan Mine in B.C. (100% ownership)Thompson Creek Mine in Idaho (100% ownership)Endako Mine in B.C. (75% ownership)Langeloth metallurgical refinery in Pennsylvania (100% ownership)
Diversified into copper and gold with the start-up of the Mt. Milligan mine in B.C.
Achieved commercial production February 18, 201452.25% of life of mine gold production sold to Royal Gold
4
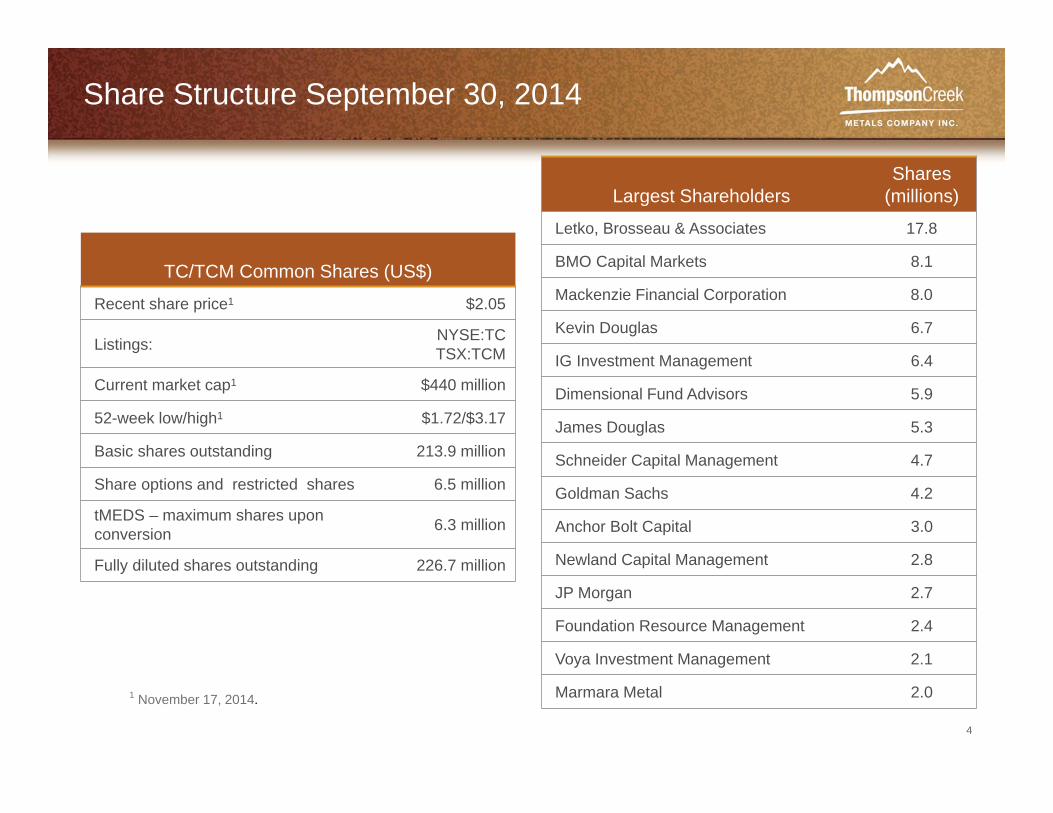
Share Structure September 30, 2014
TC/TCM Common Shares (US$)
Recent share price1 $2.05
Listings: NYSE:TC TSX:TCM
Current market cap1 $440 million
52-week low/high1 $1.72/$3.17
Basic shares outstanding 213.9 million
Share options and restricted shares 6.5 million
tMEDS – maximum shares upon conversion 6.3 million
Fully diluted shares outstanding 226.7 million
1 November 17, 2014.
Largest ShareholdersShares
(millions)
Letko, Brosseau & Associates 17.8
BMO Capital Markets 8.1
Mackenzie Financial Corporation 8.0
Kevin Douglas 6.7
IG Investment Management 6.4
Dimensional Fund Advisors 5.9
James Douglas 5.3
Schneider Capital Management 4.7
Goldman Sachs 4.2
Anchor Bolt Capital 3.0
Newland Capital Management 2.8
JP Morgan 2.7
Foundation Resource Management 2.4
Voya Investment Management 2.1
Marmara Metal 2.0

5
--
3
6
9
$1.50
$2.00
$2.50
$3.00
$3.50
Jan-14 Mar-14 May-14 Jul-14 Sep-14 Nov-14
Volume (m
illions)
Volume Share Price (NYSE)
50-Day Moving Average Share Price (TSX)
Share Price & Volume (YTD) Bond Trading Price (YTD)
Shares and Notes Trading Overview
Source: Bloomberg, FactSetNote: 50-Day moving average shown for NYSE share price1. NYSE share price shown in USD; TSX share price shown in CAD.
92.250
107.000
107.000
80
90
100
110
120
Jan-14 Mar-14 May-14 Jul-14 Sep-14 Nov-14
Bon
d Tr
adin
g Pr
ice
9.75% (Due 2017) 7.375% (Due 2018)
12.5% (Due 2019)
Feb. 20, 2014Commercial production declared at Mt. Milligan
(1)
(1)

6
Molybdenum Operations
Thompson Creek Mine, Challis, ID
Endako Mine, B.C.

7
Molybdenum Sales by Quarter Full Year 2013 – Q314
Sales [US$ in millions]
Mo Sales Volumes [millions of pounds]
$104.7$112.7
$85.7$97.7
$102.9
$126.3 $124.3
8.89.7
8.39.7 9.8 9.7
8.9
Avg Realized Mo Price/Lb. $13.03$10.45$10.11$10.30$11.60
Q213 Q313 Q413 Q114 Q214 Q314
$11.87
Q113
$13.94

8
Operating Statistics | ConsolidatedMolybdenum (Mo) Mines
8.5
22.8
6.6
21.9
$5.93
$6.36
$6.77
$6.23
1 Please refer to Appendix for non-GAAP reconciliation.
Q313 Q314 YTD13 YTD14 Q313 Q314 YTD13 YTD14
Mo Production(millions lbs)
Cash Costs1
(US$/lb)

9
Mt. Milligan – Cornerstone Asset

10
Mt. Milligan vs. North American Open Pit Mines in Junior / Intermediate Copper Companies
Source: Company filingsNote: Copper equivalent calculated using long-term prices of Au US$1,300/oz, Cu US$3.00/lb1. Measured and Indicated resources shown inclusive of Proven and Probable reserves.
Mt. Milligan’s resource is both large and higher grade compared to many similar mines

11
Mt. Milligan is a Large Scale and Low Cost Open Pit Mine
Source: Company filings, Wood MackenzieNote: Mt. Milligan, Pinto Valley, Minto production and cash costs based on company guidance; Gibraltar and Mineral Park estimates based on Wood
Mackenzie; Copper Mountain and Huckleberry production based on company guidance, cash costs based on BMO Research.
2014E By-Product Cash Costs (US$/lb)
2014E Cu Production (Mlbs)
Mt. Milligan compares favorably in 2014 with expected production increases andreducing costs from 2015 onwards as the ramp up continues
2014E Mt. Milligan By-Product Cash Costs (US$/lb)
12
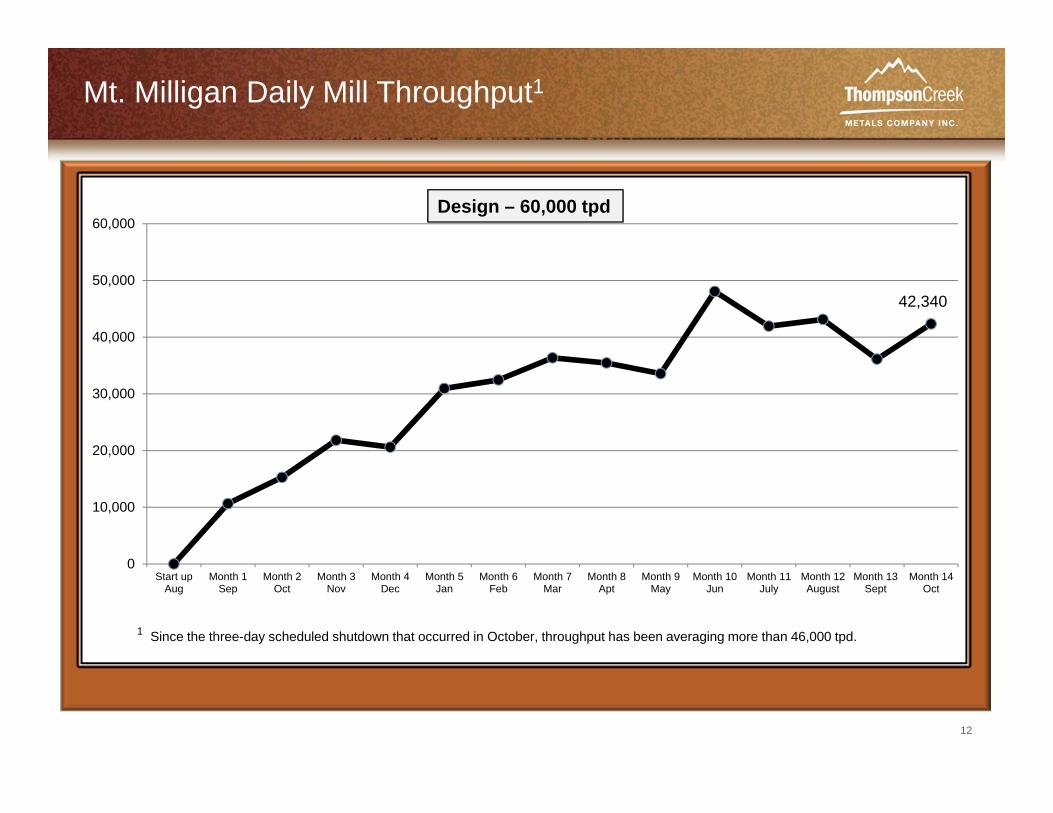
Mt. Milligan Daily Mill Throughput1
0
10,000
20,000
30,000
40,000
50,000
60,000
Start upAug
Month 1Sep
Month 2Oct
Month 3Nov
Month 4Dec
Month 5Jan
Month 6Feb
Month 7Mar
Month 8Apt
Month 9May
Month 10Jun
Month 11July
Month 12August
Month 13Sept
Month 14Oct
1 Since the three-day scheduled shutdown that occurred in October, throughput has been averaging more than 46,000 tpd.
42,340
Design – 60,000 tpd

13
Mt. Milligan Hourly Mill Throughput
0
500
1,000
1,500
2,000
2,500
Start upAug
Month 1Sep
Month 2Oct
Month 3Nov
Month 4Dec
Month 5Jan
Month 6Feb
Month 7Mar
Month 8Apr
Month 9May
Month 10Jun
Month 11July
Month 12Aug
Month 13Sept
Month 14Oct
2,041
Design – 2,715 tpoh

14
Mt. Milligan Hourly Mill Availability
0%
10%
20%
30%
40%
50%
60%
70%
80%
90%
100%
Start upAug
Month 1Sep
Month 2Oct
Month 3Nov
Month 4Dec
Month 5Jan
Month 6Feb
Month 7Mar
Month 8Apr
Month 9May
Month 10June
Month 11July
Month 12Aug
Month 13Sept
Month 14Oct
Design Availability – 92%
86.4%

15
Mt. Milligan Copper and Gold Recoveries
0%
10%
20%
30%
40%
50%
60%
70%
80%
90%
100%
Start upAug
Month 1Sep
Month 2Oct
Month 3Nov
Month 4Dec
Month 5Jan
Month 6Feb
Month 7Mar
Month 8Apr
Month 9May
Month 10Jun
Month 11July
Month 12Aug
Month 13Sept
Month 14Oct
Actual Gold Recovery Actual Copper Recovery
Design Gold Recovery 71% Design Copper Recovery 84%
75.9%
55.8%
16
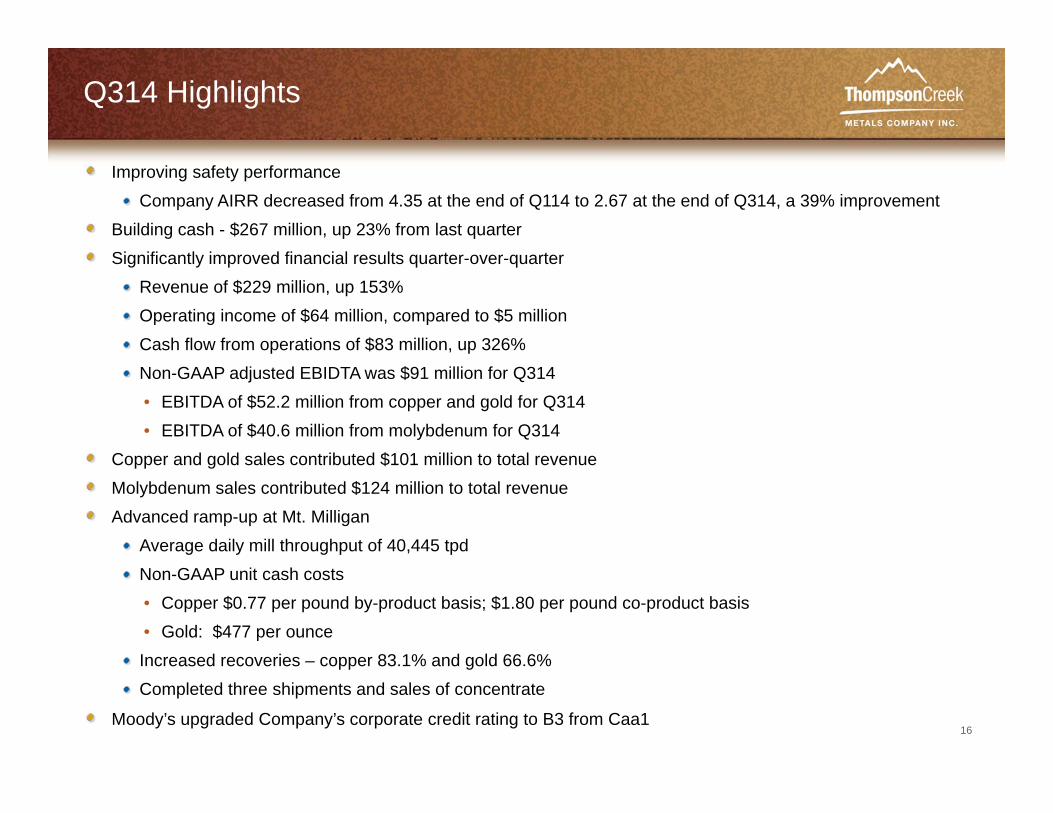
Q314 Highlights
Improving safety performanceCompany AIRR decreased from 4.35 at the end of Q114 to 2.67 at the end of Q314, a 39% improvement
Building cash - $267 million, up 23% from last quarterSignificantly improved financial results quarter-over-quarter
Revenue of $229 million, up 153%Operating income of $64 million, compared to $5 millionCash flow from operations of $83 million, up 326%Non-GAAP adjusted EBIDTA was $91 million for Q314 • EBITDA of $52.2 million from copper and gold for Q314• EBITDA of $40.6 million from molybdenum for Q314
Copper and gold sales contributed $101 million to total revenueMolybdenum sales contributed $124 million to total revenueAdvanced ramp-up at Mt. Milligan
Average daily mill throughput of 40,445 tpdNon-GAAP unit cash costs• Copper $0.77 per pound by-product basis; $1.80 per pound co-product basis• Gold: $477 per ounceIncreased recoveries – copper 83.1% and gold 66.6%Completed three shipments and sales of concentrate
Moody’s upgraded Company’s corporate credit rating to B3 from Caa1

17
Selected Financial Results
(8)
(29)
4
22
38
-$50
-$30
-$10
$10
$30
$50
$70
Q313 Q413 Q114 Q214 Q314
Non-GAAP Adjusted Net Income(loss)
91
117
161
248
229
$0
$50
$100
$150
$200
$250
$300
Q313 Q413 Q114 Q214 Q314
Revenues
5
(214)
13
57 64
-$250
-$200
-$150
-$100
-$50
$0
$50
$100
$150
Q313 Q413 Q114 Q214 Q314
Operating Income (loss)
20
(35)
16
51
83
-$50
-$30
-$10
$10
$30
$50
$70
$90
$110
$130
$150
Q313 Q413 Q114 Q214 Q314
Operating Cash Flow
YTD14 = $639 YTD13 = $317
YTD14 = $134 YTD13 = $39
YTD14 = $150YTD13 = $80
YTD14 = $65 YTD13 = $24
[millions US$, except per share data]
1
1 Please refer to Appendix for GAAP net income and reconciliation.
YTD14 = $0.29YTD13 = $0.14
($0.04)
($0.17)
$0.02
$0.10 $0.17
($0.20)
($0.10)
$0.00
$0.10
$0.20
Q313 Q413 Q114 Q214 Q314
Adjusted Net income (loss) Per Diluted Share

18
Operating Statistics | YTD 2014Copper (Cu)
1 Please refer to Appendix for non-GAAP reconciliation.
Q313 Q413 Q114 Q214 Q314 YTD 2014
Cu Ore Grade 0.25% 0.31% 0.29% 0.27% 0.25% 0.27%
Cu Recovery 67.6% 80.2% 79.2% 80.4% 83.1% 80.9%
1.0
9.4
14.2
16.0 16.3
0
2.8
10.8
21.9
16.5
0.0
5.0
10.0
15.0
20.0
25.0
Q313 Q413 Q114 Q214 Q314
Cu-Payable Production (millions lbs)Cu-Sales (millions lbs)
$11.77
$7.33
$2.48
$0.33$0.77
$0.00
$2.00
$4.00
$6.00
$8.00
$10.00
$12.00
$14.00
Q313 Q413 Q114 Q214 Q314
Cu-Cash cost ($/payable lb produced) By-Product
YTD14 Production = 46,545YTD14 Sales = 49,214
YTD14 Cash Cost = $1.14
1

19
Operating Statistics | YTD 2014Gold (Au)
1 Please refer to Appendix for non-GAAP reconciliation.
1,997
17,952
39,24337,030
60,366
0
5,541
23,874
51,983
57,974
0
10,000
20,000
30,000
40,000
50,000
60,000
70,000
Q313 Q413 Q114 Q214 Q314
Au-Payable Production (oz)Au-Sales (oz)
$2,082
$1,385
$606$538 $477
$0
$500
$1,000
$1,500
$2,000
$2,500
Q313 Q413 Q114 Q214 Q314
Au-Cash cost ($/payable oz produced) Co-Product
Q313 Q413 Q114 Q214 Q314 YTD 2014
Au Ore Grade (g/tonne) 0.45 0.56 0.72 0.52 0.79 0.67
Au Recovery 48.0% 57.4% 59.0% 65.1% 66.6% 63.9%
YTD14 Production = 136,639YTD14 Sales = 133,831
YTD14 Cash Cost = $530
1

20
Copper (Cu) and Gold (Au) Sales
1 Please refer to Appendix for non-GAAP reconciliation.
10.8
21.916.5
49.2
Q114 Q214 Q314
Cu Sales(millions lbs)
Average Realized Price1
(US$/lb)
133,831
Q114 Q214 Q314
57,974
Au Sales(oz)
Average Realized Price1
(US$/oz)
51,983
23,87430
65
46
140
Q114 Q214 Q314
24
54 55
134
Q114 Q214 Q314
$1,025$1,047
$952
$1,002
Q114 Q214 Q314
Cu Revenue(millions US$)
Au Revenue(millions US$)
$3.01
$3.20
$3.02$3.10
Q114 Q214 Q314
YTD14YTD14 YTD14
YTD14YTD14
YTD14

21
Financial SummaryNon-GAAP Adjusted EBITDA1
31 32
7
(4)
39
91 91
Q113 Q213 Q313 Q413 Q114 Q214 Q314
[millions of US$]
1 Please refer to Appendix for non-GAAP reconciliation.
YTD14 = $221 YTD13 = $70

22
Q3 2014 YTD 2014
Cash Flow from Operations 83.0 149.9
Cash (used) in Investing Activities (22.8) (88.2)
Cash (used) in Financing Activities (6.6) (26.2)
Effect of Exchange Rate Changes on Cash (3.1) (2.8)
Increase (Decrease) in Cash and Cash Equivalents 50.5 32.7
Cash and Cash Equivalents, beginning of period 216.1 233.9
Cash and Cash Equivalents, end of period 266.6 266.6
Summary of Statement of Cash Flows
[millions of US$]

23
2014 Production and Cash Cost Guidance
Current 2014Estimate
Previous 2014Estimate
(10K filed 2/20/14)
Mt. Milligan Copper and Gold1
Concentrate production (000’s wet tonnes)(000’s dry tonnes)
135 – 150125 – 140
135 – 150125 – 140
Copper payable production (000’s lb) 65,000 – 75,000 65,000 – 75,000
Gold payable production (000’s oz) 185 – 195 165 – 175
Unit cash cost – By-product ($/payable lb copper production) 2,3 1.00 – 1.50 1.55 – 1.70
Molybdenum (000’s lb): 4
TC Mine 15,000 – 17,000 14,000 – 16,000
Endako Mine (75%) 9,000 – 10,000 10,000 – 12,000
Total molybdenum production (000’s lb) 24,000 – 27,000 24,000 – 28,000
Cash Cost ($/lb produced): TC Mine 4.50 – 5.25 4.75 – 5.75
Endako Mine3 10.50 – 12.00 9.00 – 10.50
Total molybdenum cash cost ($/lb produced) 6.75 – 7.75 6.50 – 7.75 1 For Mt. Milligan, guidance assumes that we will consistently achieve approximately 80% of design capacity by year-end 2014.2 Copper by-product unit cash cost is calculated using payable production and deducts a gold by-product credit, which is determined based on expected revenue from payable
gold production assuming a gold price of approximately $831 per ounce, which is adjusted to take into account the contractual price of $435 per ounce under the Gold StreamArrangement. See “Non-GAAP Financial Measures” for the definition and reconciliation of these non-GAAP measures.
3 Estimates for cash costs assume a foreign exchange rate of US$1.00 = C$1.09.4 Molybdenum production pounds represented are molybdenum oxide and high performance molybdenum disulfide (“HPM”) from our share of production from the mines but
exclude molybdenum processed from purchased product.

24
2014 Cash Capital Expenditure Guidance
Current 2014Estimate1,2
Previous 2014 Estimate1,2
(10K filed 2/20/14)
Mt. Milligan Permanent OperationsResidence 25 20
Mt. Milligan Operations 35 30
Operations (millions US$, excludes Mt. Milligan)
5 10
TOTAL3 65 60
1 Canadian to US foreign exchange rate for 2014 assumes C$1.00 = US$1.09.2 Plus or minus 10%.3 Excludes approximately $22 million of accruals related to the Mt. Milligan Mine as of December 31, 2013, which will be paid in 2014.
[millions of US$]
25
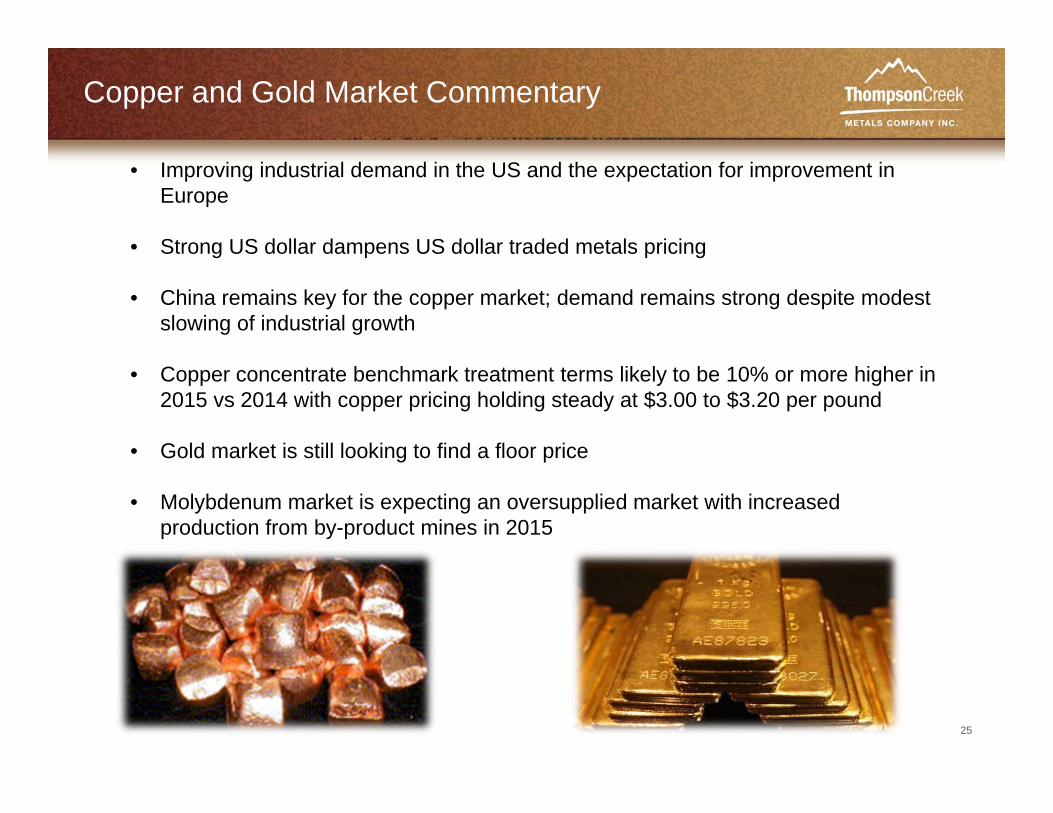
Copper and Gold Market Commentary
• Improving industrial demand in the US and the expectation for improvement in Europe
• Strong US dollar dampens US dollar traded metals pricing
• China remains key for the copper market; demand remains strong despite modest slowing of industrial growth
• Copper concentrate benchmark treatment terms likely to be 10% or more higher in 2015 vs 2014 with copper pricing holding steady at $3.00 to $3.20 per pound
• Gold market is still looking to find a floor price
• Molybdenum market is expecting an oversupplied market with increased production from by-product mines in 2015

26
Key Messages
Achieved strong financial performance for the quarterContinue to advance Mt. Milligan ramp-up
Expect to consistently achieve approximately 80% of mill throughput design capacity by year-end 2014Continue to evaluate the need for secondary crushing
January 2015 expect to announce:Q4 and full year 2014 operating resultsDecision on secondary crushing at Mt. Milligan2015 production and cost guidanceUpdated Mt. Milligan mineral resource and mineral reserve estimates

27
NYSE:TC TSX:TCM
Thompson Creek Metals Companywww.thompsoncreekmetals.com
Pamela SollyDirector, Investor Relations
and Corporate Responsibility
Phone (303) 762-3526 Email [email protected]

28
Appendix

29
Operating Statistics | Thompson Creek MineMolybdenum (Mo) Mines
5.7
16.1
4.1
14.8
$4.30
$4.54 $4.54
$4.09
1 Please refer to Appendix for non-GAAP reconciliation.
Q313 Q314 YTD13 YTD14 Q313 Q314 YTD13 YTD14
Mo Production(millions lbs)
Cash Costs1
(US $/lb)

30
Operating Statistics | Endako MineMolybdenum (Mo) Mines
2.8
6.7
2.5
7.1
$9.23
$10.74 $10.42
$10.71
1 Please refer to Appendix for non-GAAP reconciliation.
Q313 Q314 YTD13 YTD14 Q313 Q314 YTD13 YTD14
Mo Production (75%)(millions lbs)
Cash Costs1
(US $/lb)
Q313 Q413 Q114 Q214 Q314Average daily mill throughput 100% (000's tonnes) 49 49 43 46 55Grade (% molybdenum) 0.048 0.044 0.045 0.045 0.041Recovery (%) 79.2 79.2 76.7 76.2 73.2

31
Non-GAAP EDITDA Reconciliation
Q314 Q214 Q114 Q413 Q313 Q213 Q113
Net income (loss) (11.1) 61.6 (39.1) (210.5) 13.8 (19.2) 0.9
Interest income/expense 22.5 23.2 23.5 23.1 0.3 (0.2) (0.1)
Tax expense (benefit) (4.8) 14.5 (15.0) (66.4) 4.2 2.0 (3.2)
DD&A 1 22.7 33.0 22.6 13.4 11.6 14.2 12.7
Accretion 0.9 0.9 0.9 0.4 0.6 0.6 0.8
Asset impairments ‐ ‐ ‐ 194.9 0.8 ‐ ‐
(Gain) loss on foreign exchange 60.3 (42.3) 46.5 40.8 (24.2) 34.8 19.4
Non‐GAAP EBITDA 90.5 90.9 39.4 (4.3) 7.1 32.2 30.5
1 Certain prior year reclassifications were made to DD&A to conform with current year presentation.

32
Non-GAAP ReconciliationAdjusted Net Income (Loss)
Three Months Ended Nine Months EndedSeptember 30,
2014September 30,
2013September 30,
2014September 30,
2013
Net income (loss) $ (11.1) $ 13.8 $ 11.4 $ (4.5)Add (Deduct):Fixed asset impairment — 0.8 — 0.8 Tax benefit of fixed asset impairment — (0.3) — (0.3)
(Gain) loss on foreign exchange 1 59.7 (23.8) 63.9 30.4Tax expense (benefit) on foreign exchange (gain) loss (10.3) 1.9 (10.7) (2.2)
Non-GAAP adjusted net income (loss) $ 38.3 $ (7.6) $ 64.6 $ 24.2
Net income (loss) per shareBasic $ (0.05) $ 0.08 $ 0.06 $ (0.03)Diluted $ (0.05) $ 0.06 $ 0.05 $ (0.03)
Adjusted net income (loss) per shareBasic $ 0.18 $ (0.04) $ 0.35 $ 0.14Diluted $ 0.17 $ (0.04) $ 0.29 $ 0.14
Weighted-average shares (millions)Basic 213.9 171.5 186.8 170.9Diluted 220.4 216.5 220.1 216.4
1 Included $0.6 million foreign exchange gains for the three and nine months ended September 30, 2014, respectively, and $0.4 millionforeign exchange losses for the three and nine months ended September 30, 2013, respectively, presented in income and mining taxexpense (benefit) on the Condensed Consolidated Statements of Operations.
(US$ in million, except shares and per share amounts)

33
Non-GAAP ReconciliationCopper-Gold Operations Non-GAAP Cash Cost
Three Months Ended September 30,
Nine Months Ended September 30,
2014 2013 2014 2013
Direct mining costs 1 $ 48.8 $ — $ 138.2 $ —Truck and rail transportation and warehousing costs 3.8 — 10.0 —
Costs reflected in inventory and operations costs $ 52.6 — $ 148.2 —Refining and treatment costs 4.4 — 12.9 —Ocean freight and insurance costs 1.1 — 4.6 —
Direct costs reflected in revenue and selling and marketing costs $ 5.5 — $ 7.5 —Non-GAAP cash costs $ 58.1 $ — $ 165.7 $ —Reconciliation to amounts reported (US$ in millions)
Direct costs $ (5.5) — $ (17.5) —Changes in inventory (4.5) — 14.0 —Silver by-product credits 2 (1.1) — (3.4) —Non cash costs and other 0.4 — 1.1 —
Copper-Gold segment US GAAP operating expenses $ 47.4 $ — $ 159.9 $ —
1 Mining, milling and on-site general and administration costs. Mining includes all stripping costs but excludes costs capitalized related to the construction of the tailings dam. Stripping costs that provide access to mineral reserves that will be produced infuture periods are expensed as incurred under US GAAP.
2 Silver sales are reflected as a credit to operating costs.
(US$ in millions)Non-GAAP Cash Cost
34
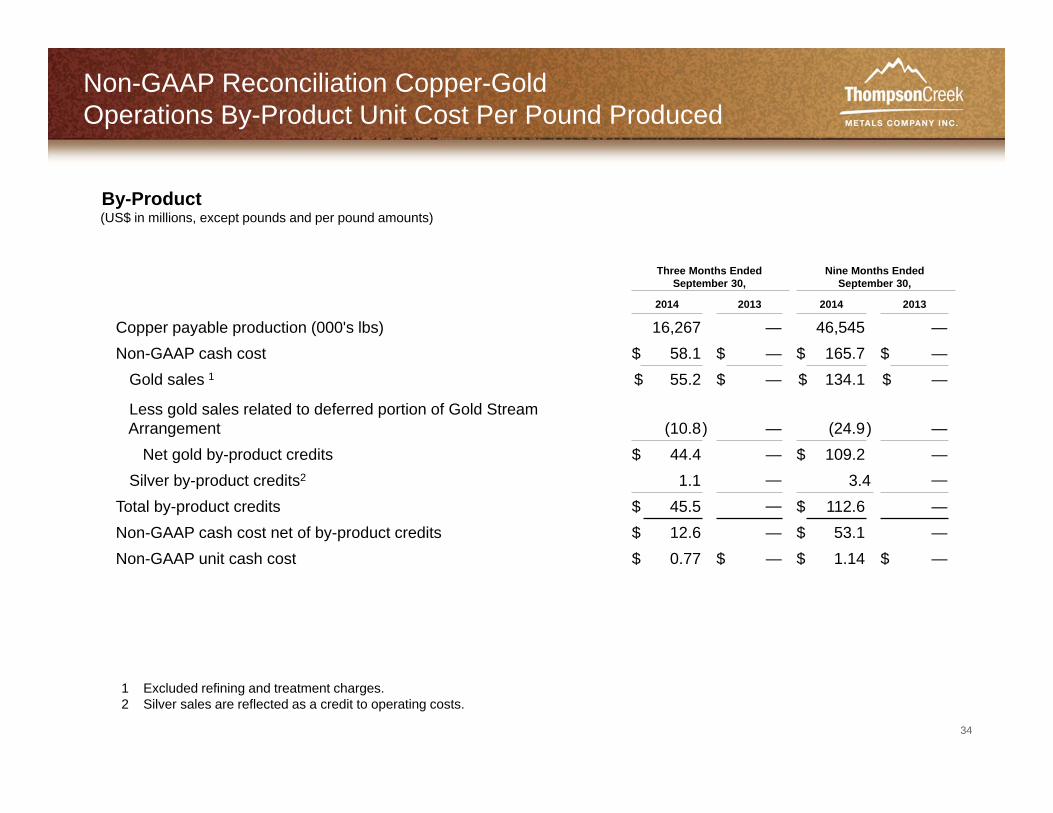
By-Product
Three Months Ended September 30,
Nine Months Ended September 30,
2014 2013 2014 2013
Copper payable production (000's lbs) 16,267 — 46,545 —Non-GAAP cash cost $ 58.1 $ — $ 165.7 $ —
Gold sales 1 $ 55.2 $ — $ 134.1 $ —
Less gold sales related to deferred portion of Gold Stream Arrangement (10.8) — (24.9) —
Net gold by-product credits $ 44.4 — $ 109.2 —Silver by-product credits2 1.1 — 3.4 —
Total by-product credits $ 45.5 — $ 112.6 —Non-GAAP cash cost net of by-product credits $ 12.6 — $ 53.1 —Non-GAAP unit cash cost $ 0.77 $ — $ 1.14 $ —
(US$ in millions, except pounds and per pound amounts)
Non-GAAP Reconciliation Copper-GoldOperations By-Product Unit Cost Per Pound Produced
1 Excluded refining and treatment charges.2 Silver sales are reflected as a credit to operating costs.

35
Co- Product(US$ in millions, except pounds, ounces and per unit amounts)
Non-GAAP ReconciliationCopper-Gold Operations Co-Product Costs
Three Months Ended September 30,
Nine Months Ended September 30,
2014 2013 2014 2013
Copper payable production (000’s lbs) 16,267 — 46,545 —Gold payable production in Cu eq. (000’s lbs) 1 15,976 — 36,541 —Payable production (000’s lbs) 32,243 — 83,086 —
Non-GAAP cash cost allocated to Copper $ 29.3 $ — $ 92.8 $ —Non-GAAP unit cash cost per lb $ 1.80 $ — $ 2.00 $ —
Non-GAAP cash cost allocated to Gold $ 28.8 $ — $ 72.9 $ —Gold payable production (ounces) 60,366 — 136,639 —Non-GAAP unit cash cost per ounce $ 477 $ — $ 530 $ —
1 Gold has been converted from payable ounces to thousands of copper equivalent pounds by using the gold production for the periods presented,using a gold price of $840 and $842 per ounce for the three and nine months ended September 30, 2014, respectively (adjusted for the Royal Goldprice of $435 per ounce) and a copper price of $3.17 and $3.15 per pound for the three and nine months ended September 30, 2014, respectively.

36
Average Realized Sales Prices
Non-GAAP ReconciliationCopper-Gold Operations Average Realized Sales Prices
Three Months Ended September 30,
Nine Months Ended September 30,
2014 2013 2014 2013
Average realized sales price for CopperPayable pounds of copper sold (000's lb) 16,482 — 49,214 —Copper sales, net $ 45.7 $ — $ 140.3 $ —Refining and treatment costs 4.2 — 12.3 —Copper sales, gross $ 49.9 $ — $ 152.6 $ —
Average realized sales price per payable pound for sold1 $ 3.02 $ — $ 3.10 $ —Average realized sales price for GoldPayable ounces of gold sold under the Gold Stream Arrangement 29,965 — 69,329 —TCM share of payable ounces of gold sold to MTM Customers 28,009 — 64,502 —Payable ounces of gold sold 57,974 — 133,831 —Gold sales related to cash portion of Gold Stream Arrangement $ 13.0 $ — $ 30.2 $ —Gold sales related to deferred portion of Gold Stream Arrangement 10.8 — 24.9 —Gold sales under Gold Stream Arrangement 23.8 — 55.1 —TCM share of gold sales to MTM Customers 31.2 — 78.4 —Gold sales, net 55.0 — 133.5 —Refining and treatment charges 0.2 — 0.6 —Gold sales, gross $ 55.2 $ — $ 134.1 $ —Average realized sales price related to cash portion of Gold Stream Arrangement $ 435 $ — $ 435 $ —Average realized sales price related to deferred portion of Gold Stream Arrangement $ 359 $ — $ 359 $ —Average realized sales price per payable ounce sold under Gold Stream Arrangement $ 794 $ — $ 794 $ —
Average realized sales price per payable ounce sold for TCM share 1 $ 1,121 $ — $ 1,225 $ —Average realized sales price per payable ounce sold (1) $ 952 $ — $ 1,002 $ —
1 The average realized sales price per payable pound of copper sold and payable ounces of gold sold is impacted by any final volume andpricing adjustments and mark-to-market adjustments for shipments made in prior periods.
(US$ in millions, except pounds, ounces and per unit amounts)

37
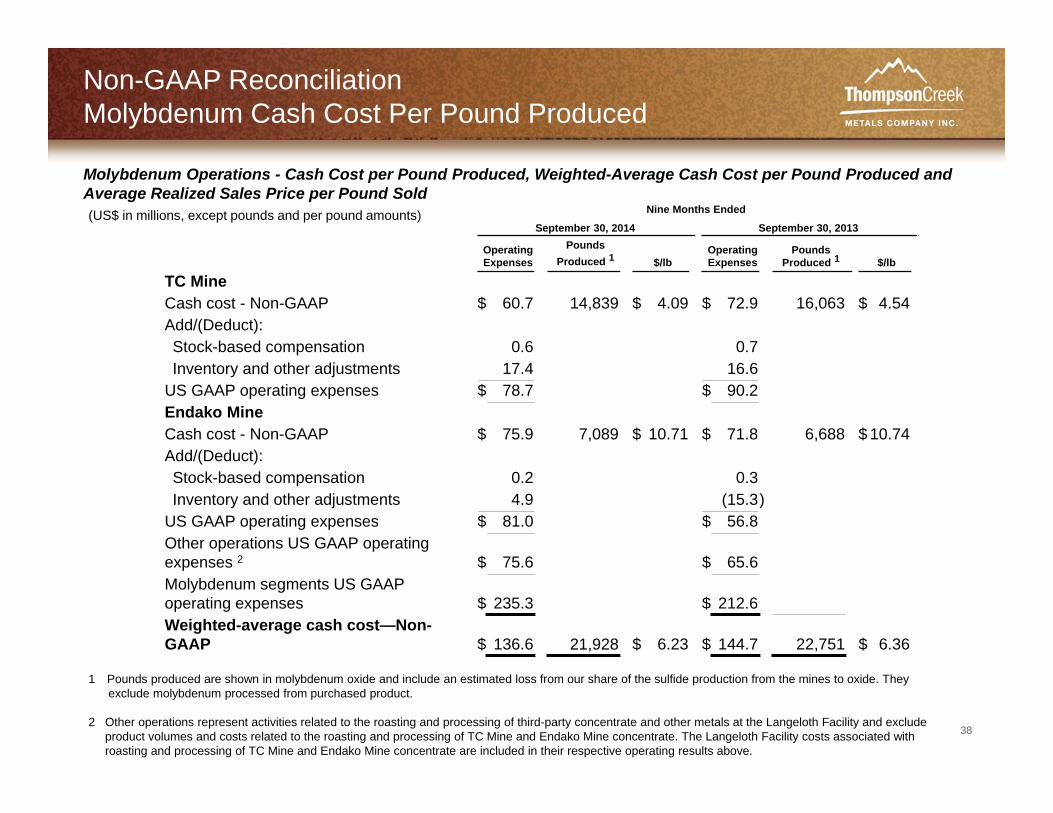
Molybdenum Operations - Cash Cost per Pound Produced, Weighted-Average Cash Cost per Pound Produced and Average Realized Sales Price per Pound Sold
Three Months EndedSeptember 30, 2014 September 30, 2013
OperatingExpenses
PoundsProduced 1 $/lb
OperatingExpenses
PoundsProduced 1 $/lb
TC MineCash cost - Non-GAAP $ 18.5 4,073 $ 4.54 $ 24.6 5,716 $ 4.30Add/(Deduct):Stock-based compensation 0.2 0.2Inventory and other adjustments 2.2 6.6
US GAAP operating expenses $ 20.9 $ 31.4Endako MineCash cost - Non-GAAP $ 25.9 2,487 $ 10.42 $ 26.0 2,820 $ 9.23Add/(Deduct):Stock-based compensation 0.2 0.1Inventory and other adjustments 5.3 (6.4)
US GAAP operating expenses $ 31.4 $ 19.7Other operations US GAAP operating expenses 2 $ 33.7 $ 15.8Molybdenum segments US GAAP operating expenses $ 86.0 $ 66.9
Weighted-average cash cost—Non-GAAP $ 44.4 6,560 $ 6.77 $ 50.6 8,536 $ 5.93
(US$ in millions, except pounds and per pound amounts)
Non-GAAP ReconciliationMolybdenum Cash Cost Per Pound Produced
1 Pounds produced are shown in molybdenum oxide and include an estimated loss from our share of the sulfide production from the mines to oxide. They exclude molybdenum processed from purchased product.
2 Other operations represent activities related to the roasting and processing of third-party concentrate and other metals at the Langeloth Facility and excludeproduct volumes and costs related to the roasting and processing of TC Mine and Endako Mine concentrate. The Langeloth Facility costs associated with roasting and processing of TC Mine and Endako Mine concentrate are included in their respective operating results above.
38
Nine Months Ended
September 30, 2014 September 30, 2013
OperatingExpenses
PoundsProduced 1 $/lb
OperatingExpenses
PoundsProduced 1 $/lb
TC MineCash cost - Non-GAAP $ 60.7 14,839 $ 4.09 $ 72.9 16,063 $ 4.54Add/(Deduct):Stock-based compensation 0.6 0.7Inventory and other adjustments 17.4 16.6
US GAAP operating expenses $ 78.7 $ 90.2Endako MineCash cost - Non-GAAP $ 75.9 7,089 $ 10.71 $ 71.8 6,688 $ 10.74Add/(Deduct):Stock-based compensation 0.2 0.3Inventory and other adjustments 4.9 (15.3)
US GAAP operating expenses $ 81.0 $ 56.8Other operations US GAAP operating expenses 2 $ 75.6 $ 65.6Molybdenum segments US GAAP operating expenses $ 235.3 $ 212.6Weighted-average cash cost—Non-GAAP $ 136.6 21,928 $ 6.23 $ 144.7 22,751 $ 6.36
Molybdenum Operations - Cash Cost per Pound Produced, Weighted-Average Cash Cost per Pound Produced and Average Realized Sales Price per Pound Sold(US$ in millions, except pounds and per pound amounts)
1 Pounds produced are shown in molybdenum oxide and include an estimated loss from our share of the sulfide production from the mines to oxide. They exclude molybdenum processed from purchased product.
2 Other operations represent activities related to the roasting and processing of third-party concentrate and other metals at the Langeloth Facility and excludeproduct volumes and costs related to the roasting and processing of TC Mine and Endako Mine concentrate. The Langeloth Facility costs associated with roasting and processing of TC Mine and Endako Mine concentrate are included in their respective operating results above.
Non-GAAP ReconciliationMolybdenum Cash Cost Per Pound Produced