investor presentation - apr 2020...(2) gaia segmentation and market size study 2018 our addressable...
TRANSCRIPT


This presentation includes forward-looking statements that involve numerous assumptions, risks and uncertainties. These include,
but are not limited to, general business conditions, historical losses, competition, changing consumer preferences, subscriber costs
and retention rates, acquisitions, and other risks and uncertainties. Actual results may differ materially from those expressed in
these forward-looking statements due to such risks and uncertainties, including those factors detailed under the caption “Risk
Factors” and elsewhere in the documents we file from time to time in our filings with the Securities and Exchange Commission,
including our reports on Form 10-K and Form 10-Q. Gaia assumes no obligation to publicly update or revise any forward-
looking statements. Research results discussed today are based on information that the Company considered reliable at the
time the study was conducted, but the Company does not represent the results are accurate or complete and they should not be
relied on as such. The information, opinions, estimates and forecasts presented are as of the date thereof and are subject to
change without prior notification.
Disclosure

• Global video subscription service (SVOD) @ $11.99/month (Ad Free)
• Network of niche channels for an underserved subscriber base with 8,000+ original
programs and curated videos
• 90+% of content is exclusive to Gaia including worldwide rights
• $299 Live Access annual membership launched in June 2019
1
TARGET DEMOGRAPHIC
Consumption across channels 50% Female / 50% Male
28-60 years old $75k+ HH income
What is Gaia
Yoga Transformation Seeking Truth Alternative Healing

OUR VISION
Empower the evolution of consciousness
OUR MISSION
Create a transformational network to empower a global conscious community
2

Created by Membersfor Members
• We hire predominately from our member base
• We publish content that doesn’t see the light of day in mainstream, advertiser-driven media
• We are a self-sustaining enterprise investing in media with a wholly independent voice
3

(1) Digital TV Research June 2019(2) Gaia Segmentation and Market Size study 2018
Our Addressable Market is Tremendous
4
531MGlobal SVOD households by 2024(1)
366MWilling to pay a subscription & interested
in at least one Gaia topic = 69%(2)
26MGaia Target = 7%(2)

• International rights for 90% of content viewed
• Expand by adding languages without need for foreign operations
• Live in Spanish, German and French, including native language titles
• Gaia international members: now 25% / 4y 50% / 8y 60-65%
• Members in 185 countries today
5
We Are Poised for International Expansion

6
• 80+% of viewership on Gaia original content
• Full in-house production capabilities
• No dependence on outside studios
• Cost per hour: Gaia $20K(Netflix $10+M)
UnrivaledOriginalContent

Strategic partnerships that drive brand awareness and reach:
7
Cross‐Platform Partnerships

8
Our MembersSay It Best

• 150,000 sf. ft (Boulder, CO)
• 12 landscaped acres
• Live streaming theater with300 in person capacity
• Powerful recruiting tool
• Full-service cafeteria and onsite gym
• ~$30 million, owned by Gaia
9
Walking the Walk

10
$1.0M
$3.3M
2014 2019
HISTORICAL COST BASIS OF CONTENT LIBRARY
$11.5
$18.8
$27.1
$38.2 $39.9
2016 2017 2018 2019 1Q 2020
($ in millions at end of each quarter)
Third party valuation as of Dec ‘17:
$55 million
Content Investment With a High ROI
Lifetime gross profit:
$13.1 million
CONTENT PUBLISHED IN 2013
(Gross profit in millions for these titles for indicated year)
Cost to produce:
$2.2 million
MEMBERS(1) ANNUAL REVENUES (2)
11
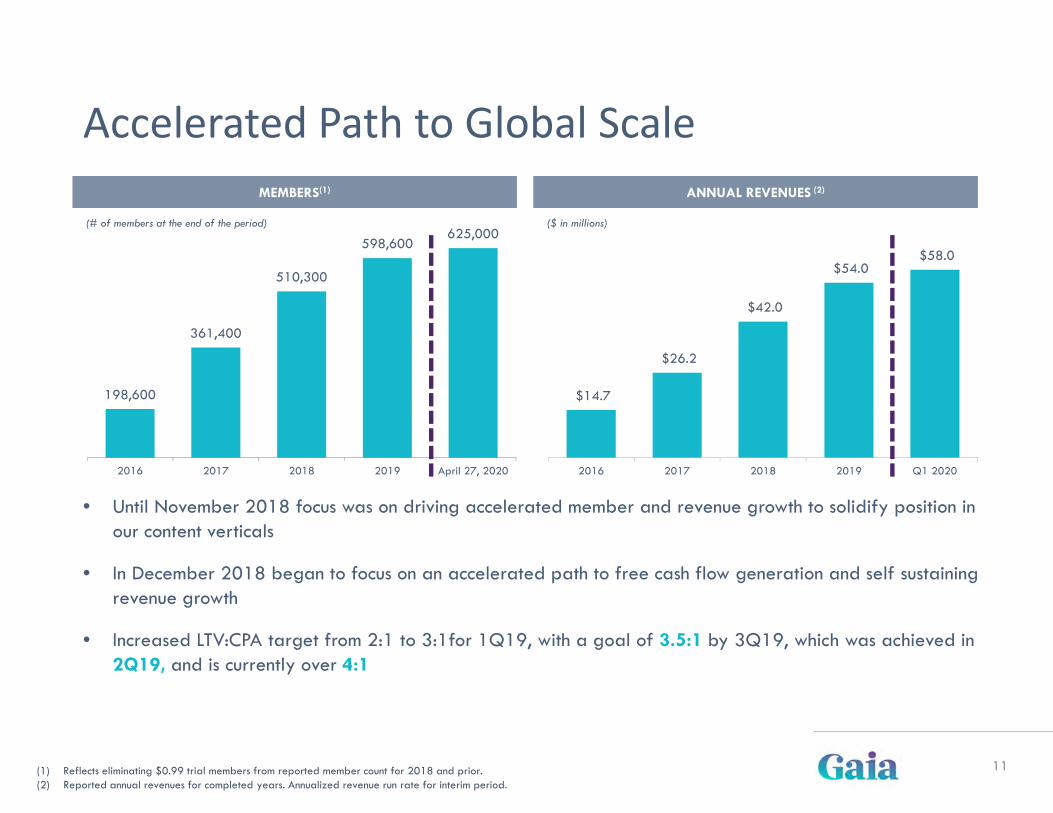
$14.7
$26.2
$42.0
$54.0 $58.0
2016 2017 2018 2019 Q1 2020
($ in millions)
198,600
361,400
510,300
598,600625,000
2016 2017 2018 2019 April 27, 2020
(# of members at the end of the period)
(1) Reflects eliminating $0.99 trial members from reported member count for 2018 and prior.(2) Reported annual revenues for completed years. Annualized revenue run rate for interim period.
• Until November 2018 focus was on driving accelerated member and revenue growth to solidify position in our content verticals
• In December 2018 began to focus on an accelerated path to free cash flow generation and self sustaining revenue growth
• Increased LTV:CPA target from 2:1 to 3:1for 1Q19, with a goal of 3.5:1 by 3Q19, which was achieved in 2Q19, and is currently over 4:1
Accelerated Path to Global Scale

CUSTOMER ACQUISITION SPEND MONTHLY REVENUE PER MEMBER
12
• In December 2018, set the goal of EBITDA profitability in 4Q19 (which was achieved) and free cash
flow generation beginning in 3Q20
• Primarily driver has been focusing on increasing efficiency of spending on customer acquisition and cash
conversion cycle. Today we recoup 65% of our spending on customer acquisition within 30 days of the
expense being incurred.
• We also focused on increasing average revenue per member and significantly increasing gross profit
per employee (cost efficiency metric) as part of this transition
$11.6
$7.5 $7.6
2018 2019 2020
(Quarterly average, $ in millions)
$7.78 $7.95
$8.04
2018 2019 2020
(Monthly average for the period)
Sustainable Growth TransitionGROSS PROFIT PER EMPLOYEE
$270
$339
$382
2018 2019 2020
(Average for the period, $ in thousands)

13
FY 2018(1)
Q1 2019 Q2 2019 Q3 2019 Q4 2019 Q1 2020
Gross Profit(% Margin)
87.3% 87.2% 86.4% 86.8% 86.9% 86.9%
Total Operating Expenses (% of Revenue)
174.0% 138.9% 119.0% 104.8% 104.4% 109.4%
Customer Acquisition Expenses(% of Revenue)
110.3% 68.4% 56.6% 49.3% 50.4% 52.2%
Other Operating Expenses (% of Revenue)
63.7% 70.5% 62.4% 55.5% 54.0% 57.2%
Operating Profit (Loss)(% of Revenue)
(81.2)% (51.4)% (34.4)% (30.3)% (19.0)% (24.6)%
EBITDA(2)
(% of Revenue)(66.3)% (29.1)% (12.4)% (6.8)% 2.7% 1.2%
(1) Reflects discontinued operations for historical periods as disclosed in Q1 2019 Form 10-Q(2) Earnings before interest, taxes, depreciation, amortization and share based compensation
Income Statement Trend

14
MAR 31, 2020 ESTIMATED VALUE
Cash $ 10,019,000 Building and Land, net 22,493,000 $ 30,000,000Media Library, net^ 28,337,000 60,000,000Member Base - 605,100 members* - 181,500,000Net Operating Losses (Full VA)+ - 23,000,000Website and Other Assets 26,725,000 Goodwill 17,289,000
Total Assets $104,863,000
Liabilities $ 11,550,000 Deferred Revenue 10,677,000Building Mortgage, net 16,717,000Equity 65,919,000
Total Liabilities and Equity $104,863,000
Shares Outstanding 18,758,943
^ Estimated fair value based on prior appraisal plus investments made since December 2017* Not capitalized on Gaia’s balance sheet, value estimated using current lifetime value of $300 per member+Gross NOL’s of $105 million federal and $28 million state
Balance Sheet