investor presentation - asm international 21, 2016 | asm proprietary information | 3 investment...
TRANSCRIPT

April 24, 2015
ASM proprietary information © 2016 ASM
INVESTOR PRESENTATION Q1 2016 RESULTS April 21, 2016

April 21, 2016 | ASM proprietary information | 2
CAUTIONARY NOTE REGARDING FORWARD-LOOKING STATEMENTS
Cautionary Note Regarding Forward-Looking Statements: All matters discussed in this
press release, except for any historical data, are forward-looking statements. Forward-
looking statements involve risks and uncertainties that could cause actual results to differ
materially from those in the forward-looking statements. These include, but are not limited
to, economic conditions and trends in the semiconductor industry generally and the timing
of the industry cycles specifically, currency fluctuations, corporate transactions, financing
and liquidity matters, the success of restructurings, the timing of significant orders, market
acceptance of new products, competitive factors, litigation involving intellectual property,
shareholder and other issues, commercial and economic disruption due to natural
disasters, terrorist activity, armed conflict or political instability, epidemics and other risks
indicated in the Company's reports and financial statements. The Company assumes no
obligation nor intends to update or revise any forward-looking statements to reflect future
developments or circumstances.
April 21, 2016 | ASM proprietary information | 3
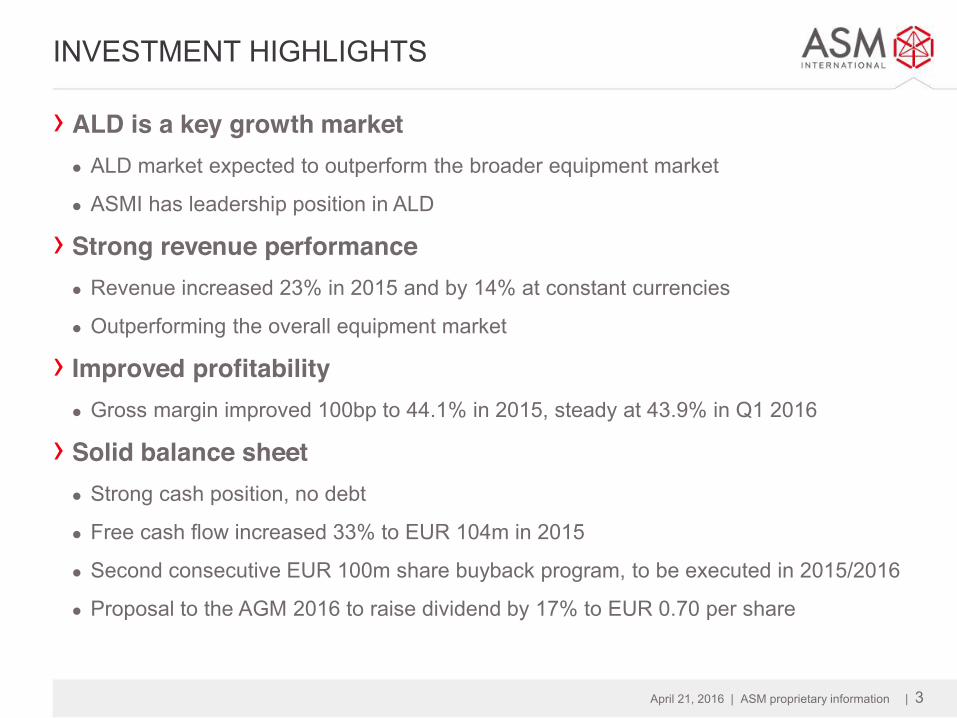
INVESTMENT HIGHLIGHTS
› ALD is a key growth market z ALD market expected to outperform the broader equipment market
z ASMI has leadership position in ALD
› Strong revenue performance z Revenue increased 23% in 2015 and by 14% at constant currencies
z Outperforming the overall equipment market
› Improved profitability z Gross margin improved 100bp to 44.1% in 2015, steady at 43.9% in Q1 2016
› Solid balance sheet z Strong cash position, no debt
z Free cash flow increased 33% to EUR 104m in 2015
z Second consecutive EUR 100m share buyback program, to be executed in 2015/2016
z Proposal to the AGM 2016 to raise dividend by 17% to EUR 0.70 per share
April 21, 2016 | ASM proprietary information | 4
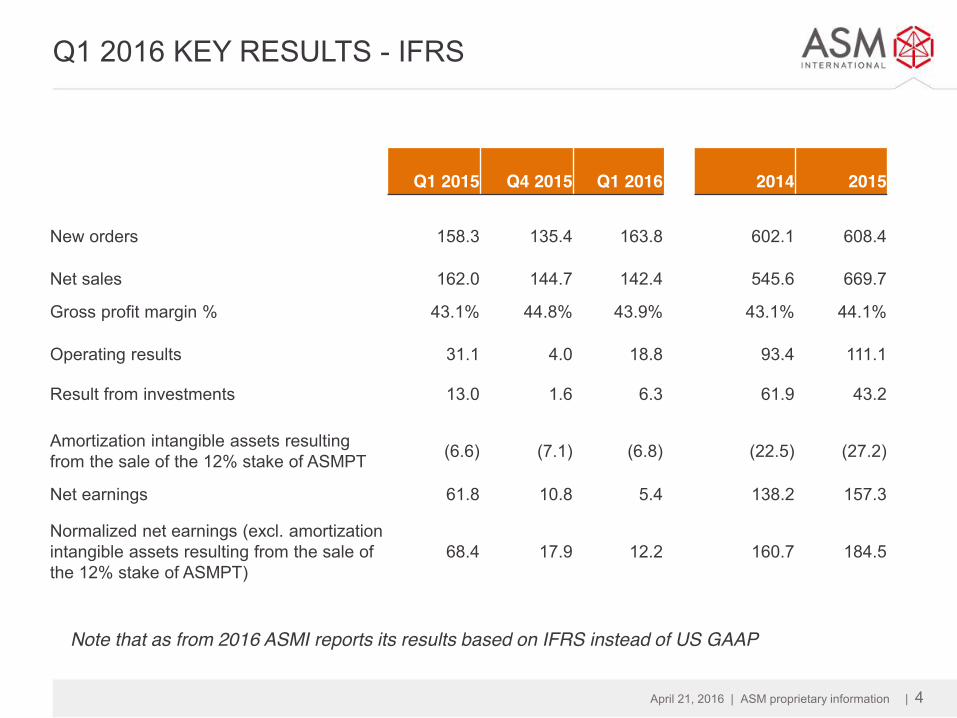
Q1 2016 KEY RESULTS - IFRS
Q1 2015
Q4 2015
Q1 2016
2014
2015
New orders
158.3
135.4
163.8 602.1
608.4
Net sales
162.0
144.7
142.4 545.6
669.7
Gross profit margin % 43.1% 44.8% 43.9% 43.1% 44.1% Operating results
31.1 4.0
18.8 93.4
111.1
Result from investments 13.0 1.6 6.3 61.9 43.2
Amortization intangible assets resulting from the sale of the 12% stake of ASMPT (6.6) (7.1) (6.8) (22.5) (27.2)
Net earnings 61.8 10.8 5.4 138.2 157.3
Normalized net earnings (excl. amortization intangible assets resulting from the sale of the 12% stake of ASMPT)
68.4 17.9 12.2 160.7 184.5
Note that as from 2016 ASMI reports its results based on IFRS instead of US GAAP
April 21, 2016 | ASM proprietary information | 5
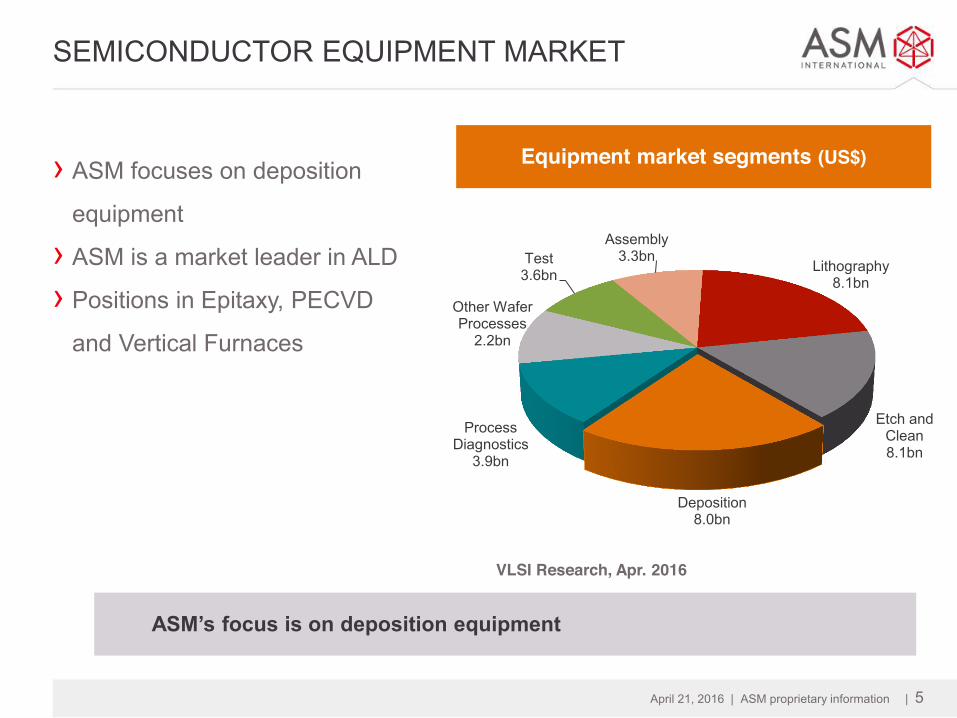
SEMICONDUCTOR EQUIPMENT MARKET
› ASM focuses on deposition
equipment
› ASM is a market leader in ALD
› Positions in Epitaxy, PECVD
and Vertical Furnaces
Lithography 8.1bn
Etch and Clean 8.1bn
Deposition 8.0bn
Process Diagnostics
3.9bn
Other Wafer Processes
2.2bn
Test 3.6bn
Assembly 3.3bn
VLSI Research, Apr. 2016
Equipment market segments (US$)
ASM’s focus is on deposition equipment

April 21, 2016 | ASM proprietary information | 6
+5.0% +7.6% +6.8% -2.0%
-7.7%
+16.3% -1.3%
EQUIPMENT MARKET OUTLOOK
› Gartner forecasts WFE
spending to decrease by 2% in 2016, followed by 7% increase
in 2017 › Investment in leading edge
equipment remains the key
driver
Gartner, Apr 2016
Gartner forecasts a slightly lower Wafer Fab Equipment market in 2016
Wafer Fab Equipment spending
0
5
10
15
20
25
30
35
40
45
2013 2014 2015 2016 2017 2018 2019

April 21, 2016 | ASM proprietary information | 7
SEMICONDUCTOR MARKET DRIVERS
-6 -4 -2 0 2 4 6
SmartphoneSSD
IndustrialAutomotiveWearablesUltramobile
Consumer ex. WearablesTraditional Phone
Traditional PCOther
2016 semiconductor market growth contribution by electronic application
79%
50%
31%
29%
12%
10%
-1%
-22%
-64%
-25%
Gartner, Dec 2015
Share of growth in 2016
US$bn
April 21, 2016 | ASM proprietary information | 8
0
5
10
15
20
25
30
35
40
2014 2015 2016 2017 2018 2019
7nm and below
10nm
14nm
22nm
32nm
45nm
65nm and above
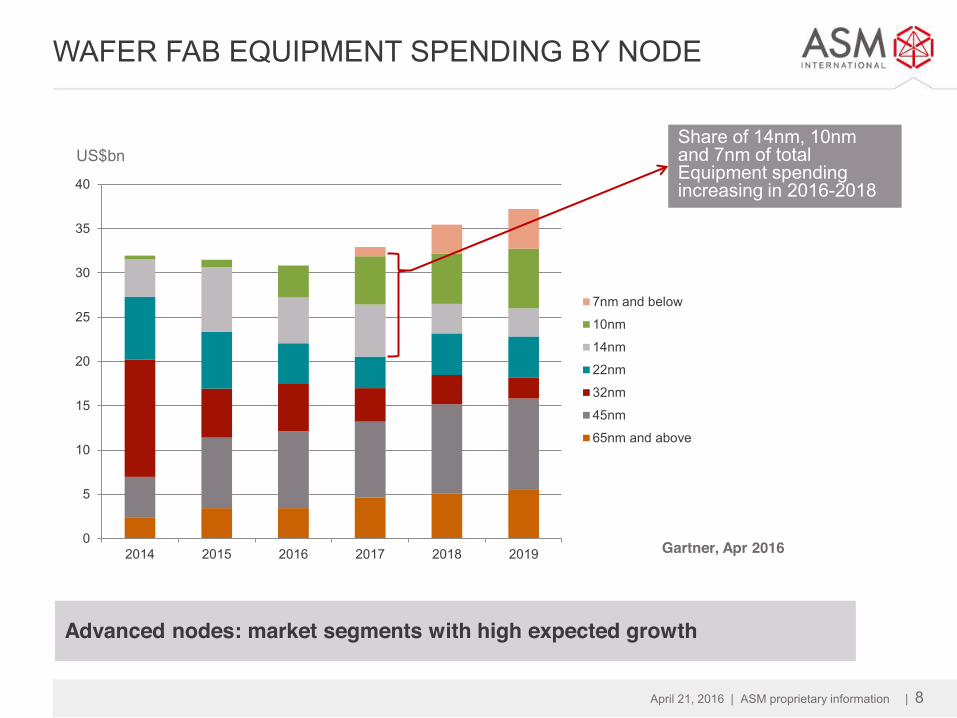
WAFER FAB EQUIPMENT SPENDING BY NODE
Advanced nodes: market segments with high expected growth
Gartner, Apr 2016
Share of 14nm, 10nm and 7nm of total Equipment spending increasing in 2016-2018
US$bn
April 21, 2016 | ASM proprietary information | 9
ALD IS AN ENABLING TECHNOLOGY
› ALD technology is a key enabler of Moore’s Law z Strengths of Atomic Layer Deposition: high-precision deposition of smooth and
conformal ultra-thin films, even on high aspect ratio structures
z Device scaling, new materials and 3D architectures increase demand for ALD
› ASMI has leading positions in ALD z Leadership positions in ALD for high-k metal gate applications as well as in ALD for
spacer defined multiple patterning and for new applications
z ALD business accounted for clearly more than half of ASM’s equipment revenue in
2015
› Strong market outlook ALD z Drivers are further deployment of ALD in volume manufacturing, new applications and
additional process steps
z ALD market expected to outperform the broader semiconductor equipment market

April 21, 2016 | ASM proprietary information | 10
ESTIMATED ALD MARKET GROWTH
Source: Gartner, VLSI, ASMI, February 2016
0
200
400
600
800
1,000
1,200
1,400
2014 2018
US$m
› ALD market approximately doubling in three to four
years, compared to 2014 › Key growth areas are
patterning layers, high-k/
metal gate, liners and spacers, and other applications
ALD market single wafer / mini-batch

April 21, 2016 | ASM proprietary information | 11
COMPETITIVE ADVANTAGES
› Focused player, differentiated technologies
› Track record of innovation
› Global network, streamlined operations
› Leadership in ALD z Developing ALD technology since 1999
z Leading market share in ALD
› Close cooperation with the leading IC manufacturers
› Strong IP portfolio
April 21, 2016 | ASM proprietary information | 12
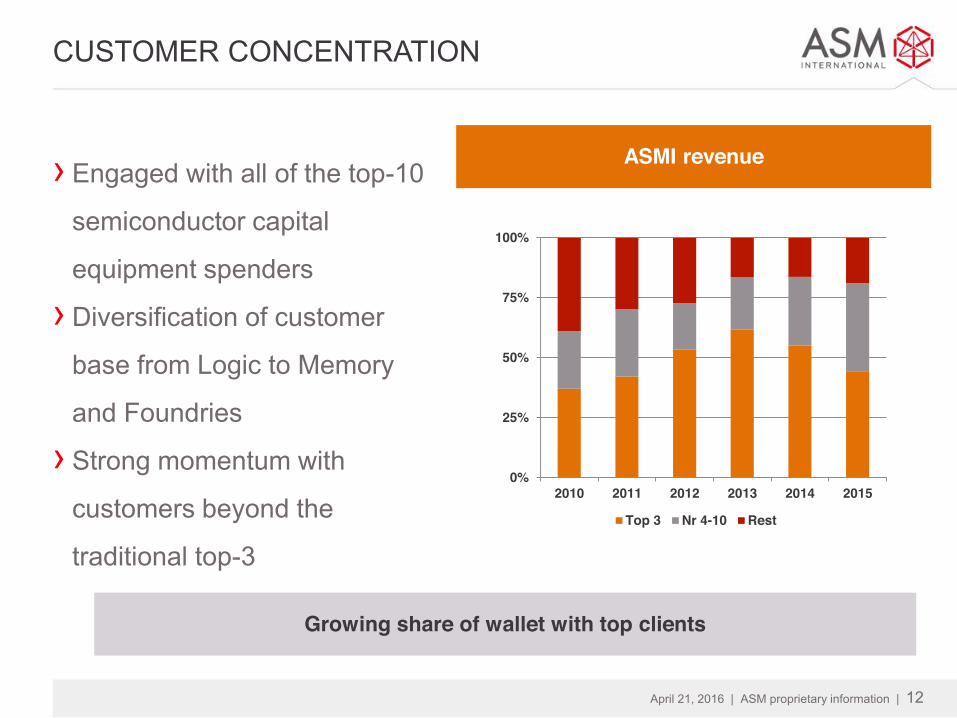
CUSTOMER CONCENTRATION
› Engaged with all of the top-10
semiconductor capital
equipment spenders
› Diversification of customer
base from Logic to Memory
and Foundries
› Strong momentum with
customers beyond the
traditional top-3
ASMI revenue
Growing share of wallet with top clients
0%
25%
50%
75%
100%
2010 2011 2012 2013 2014 2015
Top 3 Nr 4-10 Rest
April 21, 2016 | ASM proprietary information | 13
HIGHLIGHTS
› Strong momentum ALD z ALD further established as mainstream enabling technology
z Bookings and revenue continued to be driven by ALD
› 2016 started with healthy order momentum z Revenue in Q1 decreased 2% sequentially, but order intake increased 21%
z Gross margin relatively stable at 43.9%, EBIT margin at 13.2%
› Shareholder remuneration z Started a second consecutive EUR 100m share buyback program last November,
completed for approximately 42% by the end of March 2016
z Returned EUR 116m in share buybacks and dividend in 2015 (2014: EUR 61m)
z Proposal to increase dividends by 17% to EUR 0.70 per share AGM 2016
› Intel’s Preferred Quality Supplier award z On March 10, 2016, ASMI was awarded as one of 26 companies with Intel’s
Preferred Quality Supplier (PQS) award for performance in 2015
April 21, 2016 | ASM proprietary information | 14
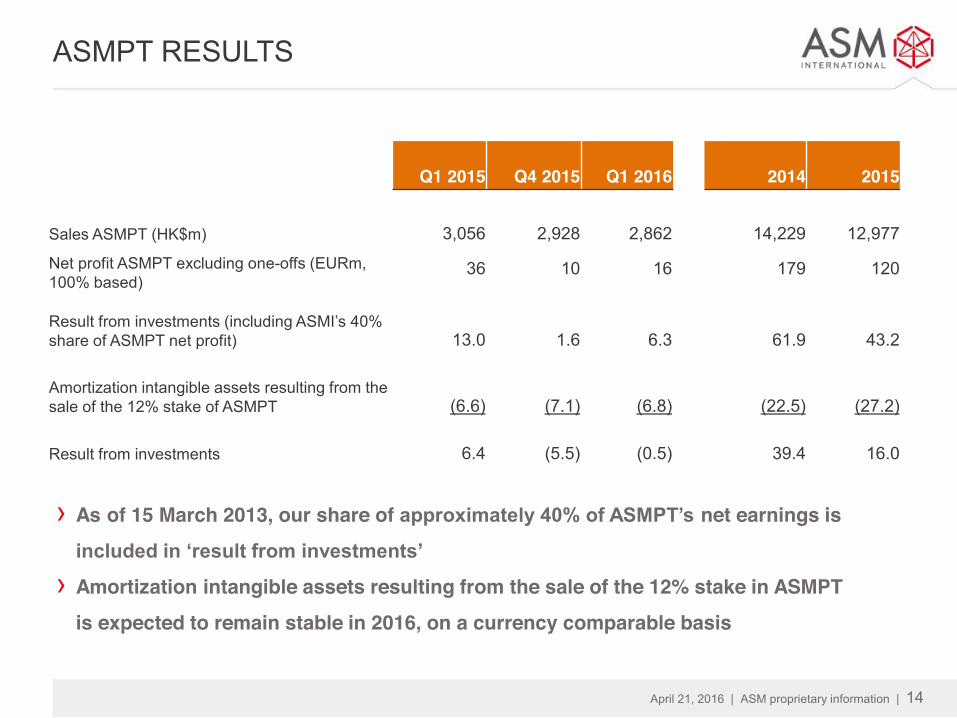
ASMPT RESULTS
› As of 15 March 2013, our share of approximately 40% of ASMPT’s net earnings is included in ‘result from investments’
› Amortization intangible assets resulting from the sale of the 12% stake in ASMPT is expected to remain stable in 2016, on a currency comparable basis
Q1 2015
Q4 2015
Q1 2016
2014
2015
Sales ASMPT (HK$m) 3,056 2,928
2,862 14,229 12,977
Net profit ASMPT excluding one-offs (EURm, 100% based)
36 10 16 179 120
Result from investments (including ASMI’s 40% share of ASMPT net profit) 13.0 1.6 6.3 61.9 43.2
Amortization intangible assets resulting from the sale of the 12% stake of ASMPT (6.6) (7.1) (6.8) (22.5) (27.2)
Result from investments 6.4 (5.5) (0.5) 39.4 16.0
April 21, 2016 | ASM proprietary information | 15
FINANCIAL OVERVIEW - IFRS
April 21, 2016 | ASM proprietary information | 16
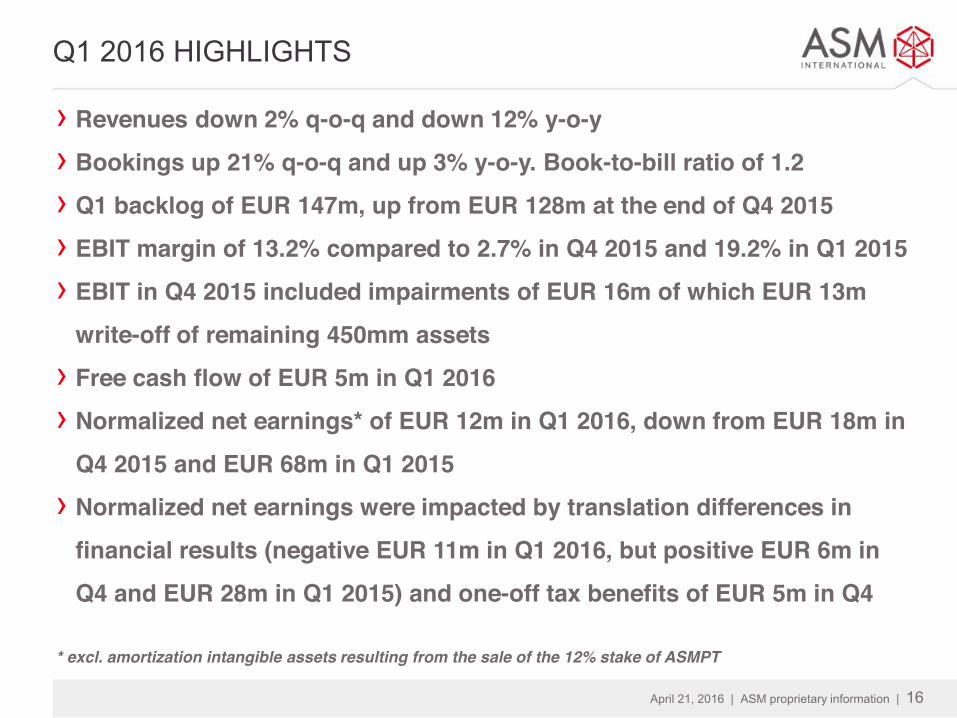
Q1 2016 HIGHLIGHTS
› Revenues down 2% q-o-q and down 12% y-o-y
› Bookings up 21% q-o-q and up 3% y-o-y. Book-to-bill ratio of 1.2 › Q1 backlog of EUR 147m, up from EUR 128m at the end of Q4 2015 › EBIT margin of 13.2% compared to 2.7% in Q4 2015 and 19.2% in Q1 2015 › EBIT in Q4 2015 included impairments of EUR 16m of which EUR 13m
write-off of remaining 450mm assets › Free cash flow of EUR 5m in Q1 2016 › Normalized net earnings* of EUR 12m in Q1 2016, down from EUR 18m in
Q4 2015 and EUR 68m in Q1 2015 › Normalized net earnings were impacted by translation differences in
financial results (negative EUR 11m in Q1 2016, but positive EUR 6m in
Q4 and EUR 28m in Q1 2015) and one-off tax benefits of EUR 5m in Q4
* excl. amortization intangible assets resulting from the sale of the 12% stake of ASMPT

April 21, 2016 | ASM proprietary information | 17
FINANCIAL OUTLOOK
Based upon the current backlog and our current visibility:
For Q2 we expect sales between €130-€140 million, while we expect an order
intake of €145-€165 million, both on a currency comparable level.
Based upon the current visibility, we expect a much stronger second half as
compared to the first half of 2016.

April 21, 2016 | ASM proprietary information | 18
NET EARNINGS Q1 – IFRS
EUR million Q1 2015
Q4 2015
Q1 2016
Q1 2016 vs Q4 2015
Q1 2016 vs Q1 2015
New orders 158.3 135.4 163.8 21% 3% Backlog 190.2 127.8 146.8 15% (23)% Book-to-bill 1.0 0.9 1.2 Net sales 162.0 144.7 142.4 (2)% (12)%
Gross profit 69.6 64.8 62.5 (4)% (11)%
Gross profit margin % 43.1% 44.8% 43.9%
Selling, general and administrative expenses (21.3) (23.0) (22.5) (2)% 6% Research and development expenses (17.5) (36.9) (20.8) (44)% 19%
Restructuring expenses - (0.9) (0.5) n/a n/a
Operating result 31.1 4.0 18.8 14.8 (12.3)
Operating margin % 19.2% 2.7% 13.2%
Financing costs 28.1 5.8 (11.2) (17.0) (39.3)
Income tax (3.8) 6.5 (1.7) (8.2) 2.1
Result from investments 13.0 1.6 6.3 4.7 (6.8) Amortization intangible assets resulting from the sale of the 12% stake of ASMPT (6.6) (7.1) (6.8) 0.2 (0.2)
Net earnings 61.8 10.8 5.4 (5.5) (56.5)
Normalized net earnings (excl. amortization intangible assets resulting from the sale of the 12% stake of ASMPT) 68.4 17.9 12.2 (5.7) (56.3)
Normalized net earnings per share, diluted €1.08 €0.28 €0.20 €(0.08) €(0.88)

April 21, 2016 | ASM proprietary information | 19
R&D EXPENDITURE
EUR million
Q1 2015
Q4 2015
Q1 2016
R&D expenditure (20.4) (25.0) (23.8)
Capitalized development expenditure 6.2 5.4 7.1
Amortization capitalized development expenditure (3.3) (1.2) (4.1)
Impairment capitalized development expenditure - (16.2) -
R&D expenses (17.5) (36.9) (20.8)
› Impairment capitalized development expenditure in Q4 2015 included EUR 13m for the write off of the
remaining 450mm assets
› Amortization capitalized development expenditure in Q4 2015 included a harmonization of EUR 2.5m which
decreased the amortization amount
April 21, 2016 | ASM proprietary information | 20
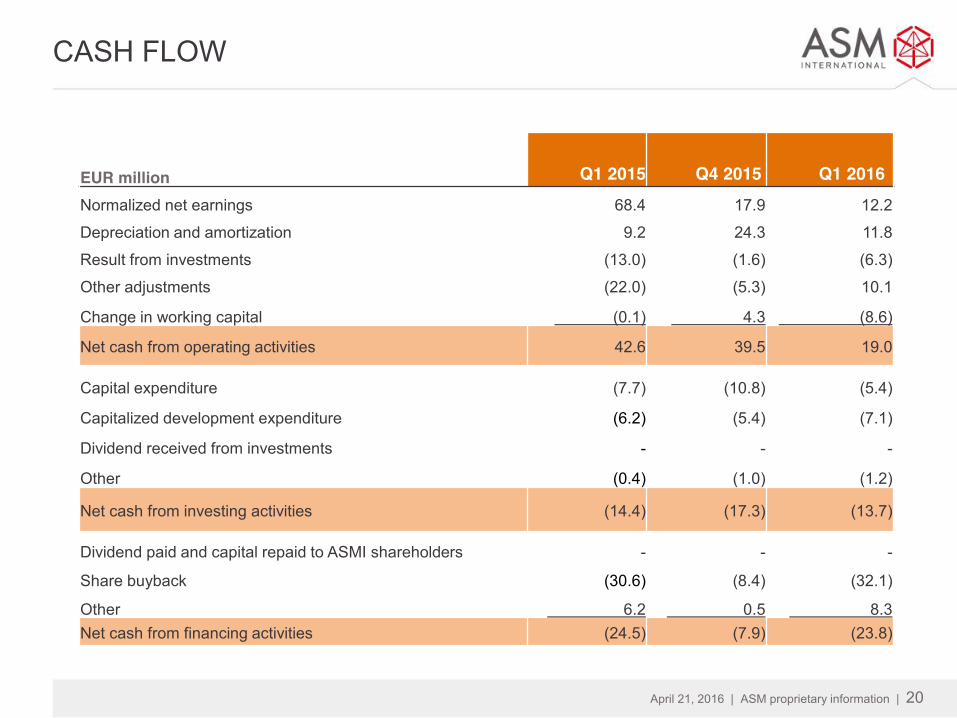
CASH FLOW
EUR million
Q1 2015
Q4 2015
Q1 2016
Normalized net earnings 68.4 17.9 12.2
Depreciation and amortization 9.2 24.3 11.8
Result from investments (13.0) (1.6) (6.3)
Other adjustments (22.0) (5.3) 10.1
Change in working capital (0.1) 4.3 (8.6)
Net cash from operating activities 42.6 39.5 19.0
Capital expenditure (7.7) (10.8) (5.4)
Capitalized development expenditure (6.2) (5.4) (7.1)
Dividend received from investments - - -
Other (0.4) (1.0) (1.2)
Net cash from investing activities (14.4) (17.3) (13.7)
Dividend paid and capital repaid to ASMI shareholders - - -
Share buyback (30.6) (8.4) (32.1)
Other 6.2 0.5 8.3 Net cash from financing activities (24.5) (7.9) (23.8)

April 21, 2016 | ASM proprietary information | 21
BALANCE SHEET
EUR million Dec 31, 2015 Mar 31, 2016
Cash and cash equivalents 447 416
Accounts receivable 90 100
Inventories 114 109
Other current assets 19 22
Investments and associates 1,181 1,134
Property, plant and equipment 92 91
Capitalized development costs 73 75
Other non-current assets 60 62
Total Assets 2,076 2,010
Accounts payable 54 59
Short-term debt - -
Other current liabilities 61 59
Long-term debt - -
Other non-current liabilities 13 13
Equity 1,948 1,880
Total Liabilities and Equity 2,076 2,010

April 21, 2016 | ASM proprietary information | 22
WORKING CAPITAL
EUR million Days
40
60
80
100
120
140
Q1 Q2 Q3 Q4 Q1 Q2 Q3 Q4 Q1 Q2 Q3 Q4 Q1 Q2 Q3 Q4 Q1
12 13 14 15 16
Days of working capital
0
50
100
150
200
250
Q1 Q2 Q3 Q4 Q1 Q2 Q3 Q4 Q1 Q2 Q3 Q4 Q1 Q2 Q3 Q4 Q1
12 13 14 15 16
Working capital Quarterly sales
April 21, 2016 | ASM proprietary information | 23
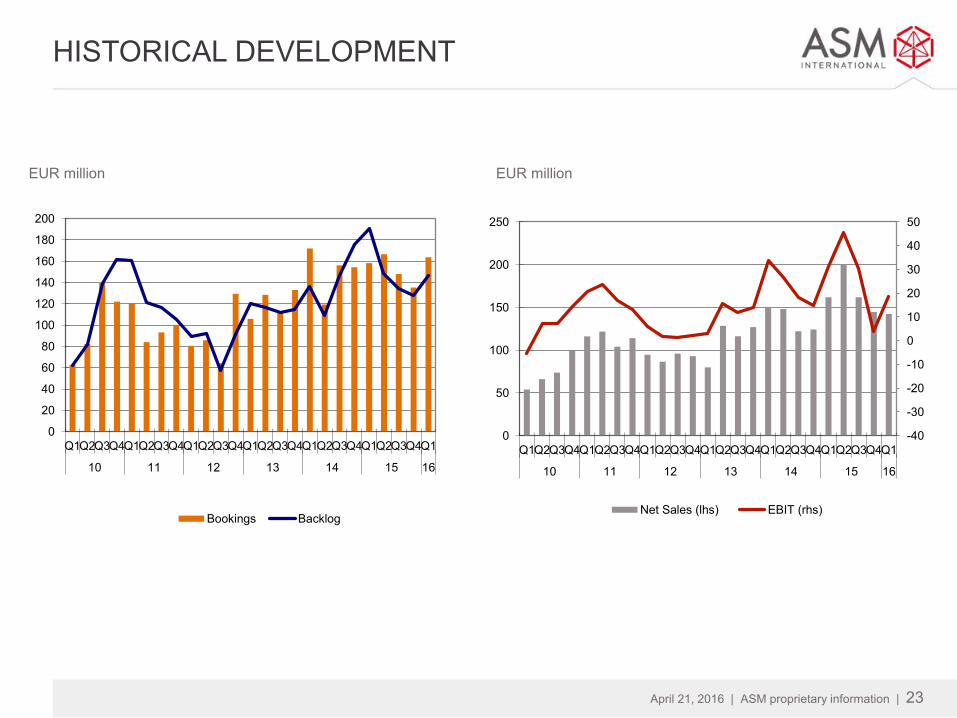
HISTORICAL DEVELOPMENT
EUR million EUR million
-40
-30
-20
-10
0
10
20
30
40
50
0
50
100
150
200
250
Q1Q2Q3Q4Q1Q2Q3Q4Q1Q2Q3Q4Q1Q2Q3Q4Q1Q2Q3Q4Q1Q2Q3Q4Q1
10 11 12 13 14 15 16
Net Sales (lhs) EBIT (rhs)
0
20
40
60
80
100
120
140
160
180
200
Q1Q2Q3Q4Q1Q2Q3Q4Q1Q2Q3Q4Q1Q2Q3Q4Q1Q2Q3Q4Q1Q2Q3Q4Q1
10 11 12 13 14 15 16
Bookings Backlog

April 21, 2016 | ASM proprietary information | 24
CHANGE TO IFRS REPORTING IN 2016
› On Febuary 23, 2016, ASMI announced that as of 2016 it will report results based on IFRS instead of US GAAP.
› The main difference is in R&D expenses. Under IFRS R&D costs are expensed as incurred, while under IFRS those development costs that meet certain criteria are capitalized. Amortization and impairment, if applicable, of capitalized development costs is included in the R&D expenses.
› In 2015, R&D expenses amounted to EUR 90m under IFRS and EUR 95m under US GAAP. The difference in R&D expenses is also the main explanation for the difference between the operating and net result in 2015 under IFRS and US GAAP.
› Excluding the impairment of the remaining 450mm assets (EUR 3m under US GAAP and EUR 13m under IFRS) the R&D expenses in 2015 amounted to EUR 92 million under US GAAP and EUR 77 million under IFRS.
› During 2016 comparable results based on US GAAP will be presented, as from 2017 only results based on IFRS will be reported.
› More information can be found in the Q4 2015 and Q1 2016 earnings report, the Statutory annual report 2015, and on our website www.asm.com.

April 21, 2016 | ASM proprietary information | 25
COMPARABLE RESULTS US GAAP
EUR million Q1 2015
Q4 2015
Q1 2016
Q1 2016 vs Q4 2015
Q1 2016 vs Q1 2015
Net sales 162.0 144.7 142.4 (2)% (12)%
Gross profit 70.1 64.8 62.4 (4)% (11)%
Gross profit margin % 43.3% 44.8% 43.8%
Selling, general and administrative expenses (21.3) (23.0) (22.5) (2)% 6% Research and development expenses (20.4) (28.3) (23.8) (16)% 17%
Restructuring expenses - (0.9) (0.5) n/a n/a
Operating result 28.5 12.5 15.6 3.1 (12.9)
Operating margin % 17.6% 8.7% 11.0%
Financing costs 28.1 5.7 (11.3) (17.0) (39.4)
Income tax (3.3) 5.0 (1.2) (6.2) 2.1
Result from investments 13.4 2.2 6.3 4.1 (7.1) Amortization intangible assets resulting from the sale of the 12% stake of ASMPT (6.6) (7.1) (6.8) 0.3 (0.2)
Net earnings 60.0 18.4 2.6 (15.8) (57.4)
Normalized net earnings (excl. amortization intangible assets resulting from the sale of the 12% stake of ASMPT) 66.6 25.4 9.4 (16.0) (57.2)
Normalized net earnings per share, diluted €1.03 €0.40 €0.16 €(0.24) €(0.87)

April 21, 2016 | ASM proprietary information | 26