investor presentation - asm international · 2015-03-16 · ›q4 backlog of eur 176m, up from eur...
TRANSCRIPT

March 5, 2015
ASM proprietary information © 2015 ASM
INVESTOR PRESENTATIONQ4 2014 RESULTS

March 5, 2015 | ASM proprietary information | 2
SAFE HARBOR STATEMENTS
Safe Harbor Statement under the U.S. Private Securities Litigation Reform Act of 1995: All
matters discussed in this business and strategy update, except for any historical data, are
forward-looking statements. Forward-looking statements involve risks and uncertainties that
could cause actual results to differ materially from those in the forward-looking statements.
These include, but are not limited to, economic conditions and trends in the semiconductor
industry generally and the timing of the industry cycles specifically, currency fluctuations,
corporate transactions, financing and liquidity matters, the success of restructurings, the timing
of significant orders, market acceptance of new products, competitive factors, litigation involving
intellectual property, shareholder and other issues, commercial and economic disruption due to
natural disasters, terrorist activity, armed conflict or political instability, epidemics and other
risks indicated in the Company's filings from time to time with the U.S. Securities and Exchange
Commission, including, but not limited to, the Company’s reports on Form 20-F and Form 6-K.
The company assumes no obligation to update or revise any forward-looking statements to
reflect future developments or circumstances.

March 5, 2015 | ASM proprietary information | 3
INVESTMENT HIGHLIGHTS
› ALD is a key growth market ALD market expected to outperform the broader equipment market
ASMI has leadership positions in ALD and PEALD
› Strong revenue performance Revenue increased by 21% in 2014 to a record high level for Front-end
Outperforming the overall equipment market
› Improved profitability Gross margin increased to 43.1% in 2014 compared to 39.0% in 2013
› Solid balance sheet Strong cash position, no debts
Operating cash flow of EUR 118m in 2014
Share buyback program of up to EUR 100m in 2014-2015 timeframe
Proposal to the AGM 2015 to raise dividend by 20% to EUR 0.60 per share

March 5, 2015 | ASM proprietary information | 4
Q4 2014 KEY RESULTS
Q4 2013 Q3 2014 Q4 2014Pro-forma
2013 2014
New orders 133.1 156.2 154.4 479.6 602.1
Net sales 126.9 122.2 124.3 452.0 545.6
Gross profit margin % 39.3% 43.2% 43.0% 39.0% 43.1%
Operating result 15.8 17.2 13.4 44.7 90.5
Result from investments (excl. amortization and fair value purchase price allocation) 1.5 30.7 8.9 20.9 61.1
Remeasurement gain, realized gain on sale of ASMPT shares, amortization and fair value adjustments
(343.2) (5.7) (6.0) 1,006.4 (22.5)
Net earnings (334.0) 54.6 21.0 1,051.9 137.3Normalized net earnings (excl. remeasurement gain, realized gain on sale of ASMPT shares, amortization and fair value adjustments)
9.3 60.2 26.9 45.5 159.8

March 5, 2015 | ASM proprietary information | 5
SEMICONDUCTOR EQUIPMENT MARKET
› ASM focuses on deposition
equipment
› ASM is the market leader in ALD
and PEALD
› Positions in Epitaxy, PECVD
and Vertical Furnaces
Lithography9.0bn
Etch and Clean7.7bn
Deposition7.9bn
Process Diagnostics
4.9bn
Other Wafer Processes
2.6bn
Test3.8bn
Assembly3.7bn
VLSI Research, Feb. 2015
Equipment market segments (US$)
ASM’s focus is on deposition equipment
March 5, 2015 | ASM proprietary information | 6
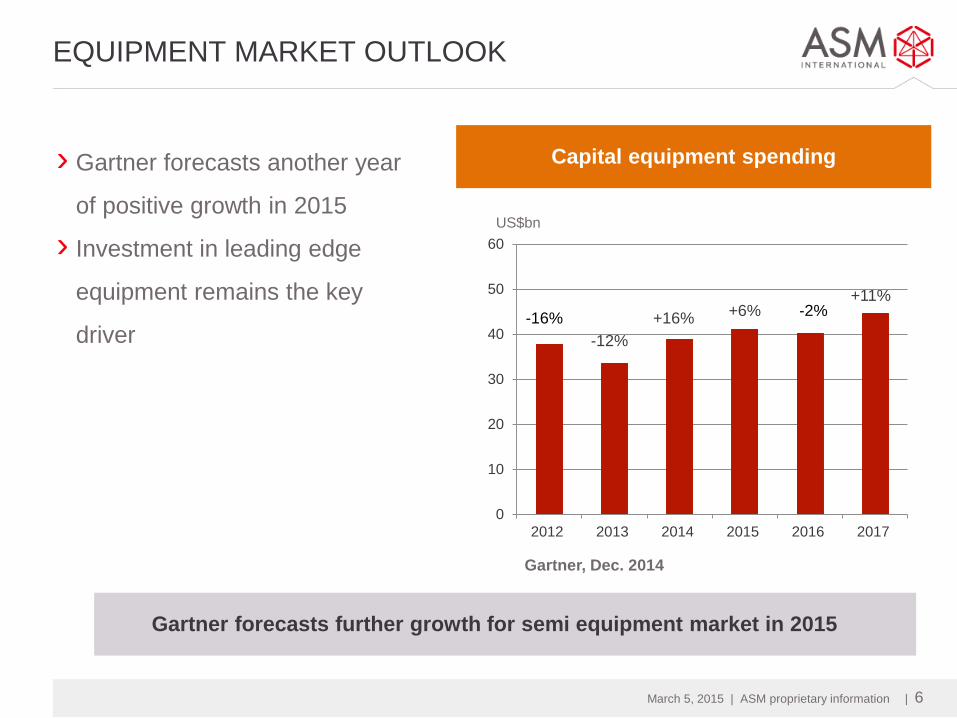
-2%+6%+11%
+16%-12%
-16%
0
10
20
30
40
50
60
2012 2013 2014 2015 2016 2017
US$bn
EQUIPMENT MARKET OUTLOOK
Gartner forecasts further growth for semi equipment market in 2015
› Gartner forecasts another year
of positive growth in 2015
› Investment in leading edge
equipment remains the key
driver
Capital equipment spending
Gartner, Dec. 2014

March 5, 2015 | ASM proprietary information | 7
SEMICONDUCTOR MARKET
SEMICONDUCTOR SALES BY KEY APPLICATION
0
20
40
60
80
100
120
140
160
2012 2013 2014 2015 2016 2017 2018
US$bn
Smartphone, Premium
Smartphone, Basic/Utility
Mobile Phone, Traditional
Hybrid PC/Tablet
Tablet
PC, Ultramobile Clamshell
PC, Traditional Notebook
PC, Desk-based
Semiconductor growth drivers are mobile devicesPerformance per Watt becoming key metric factor in chip design
Gartner, Dec. 2014

March 5, 2015 | ASM proprietary information | 8
0
5
10
15
20
25
30
35
40
45
2012 2013 2014 2015 2016 2017 2018
Wafer Fab Equipment by Node
7 nm and below10 nm14 nm22 nm32 nm45 nm65nm & above
WAFER FAB EQUIPMENT SPENDING BY NODE
Gartner, Dec. 2014
Share of 22nm, 14nm and 10nm of total Equipment spending increasing in 2015-2017
Key customer ALD and PEALD penetrations in 22nm, 14nm and 10nm: market segments with high expected growth
US$bn
March 5, 2015 | ASM proprietary information | 9
ALD IS AN ENABLING TECHNOLOGY
› ALD technology is a key enabler of Moore’s Law Strengths of Atomic Layer Deposition: high-precision deposition of smooth and
conformal ultra-thin films, even on high aspect ratio structures
Device scaling, new materials and 3D architectures increases demand for ALD and
PEALD
› ASMI has leading positions in ALD ASMI is the leader in thermal ALD for high-k metal gate applications
Major positions in plasma-enhanced ALD (PEALD) for spacer defined multiple
patterning in the Memory market and for new applications
› Strong market outlook ALD Drivers are further deployment of ALD and PEALD in volume manufacturing, new
applications and additional process steps
ALD market expected to outperform the broader semiconductor equipment market

March 5, 2015 | ASM proprietary information | 10
COMPETITIVE ADVANTAGES
› Focused player, differentiated technologies
› Track record of innovation
› Global network, streamlined operations
› Leadership in ALD Developing ALD technology since 1999
Largest player in both single wafer ALD and PEALD
› Close cooperation with the leading IC manufacturers
› Strong IP portfolio

March 5, 2015 | ASM proprietary information | 11
CUSTOMER CONCENTRATION
› Engaged with all top capex
customers
› Diversification of customer
base from Logic to Memory
and Foundries
› Weight of Asia growing
ASMI revenue
Growing share of wallet with top clients
0%
25%
50%
75%
100%
2009 2010 2011 2012 2013 2014
Top 3 Nr 4-10 Rest

March 5, 2015 | ASM proprietary information | 12
HIGHLIGHTS
› Strong momentum ALD and PEALD ALD and PEALD further established as mainstream enabling technologies
Bookings and revenue in 2014 driven by ALD and PEALD
› Record results in 2014 Revenue grew 21%, bookings increased 26%
Gross margin at 43.1%, EBIT margin at 16.6%
› Shareholder remuneration Share buyback program of up to EUR 100m announced in October 2014
Proposal to increase dividends by 20% to EUR 0.60 per share AGM 2015
› Further actions to structurally improve performance Continued cost focus

March 5, 2015 | ASM proprietary information | 13
ASMPT RESULTS
Q4 2013 Q3 2014 Q4 2014 2013 2014
Sales ASMPT (HK$m) 2,764 4,852 3,446 10,841 14,229
Net profit ASMPT (EURm, 100% based) 5 77 23 52 152
Result from investments (including ASMI’s 40% share of ASMPT net profit) 1.5 30.7 8.9 20.9 61.1
Remeasurement gain, realized gain on sale of ASMPT shares, amortization and fair value adjustments (343.2) (5.7) (6.0) 1,006.4 (22.5)
Result from investments (341.7) (25.0) (2.9) 1,027.3 38.6
As of 15 March 2013, our 40% share of ASMPT’s net earnings is included in ‘result from investments’

March 5, 2015 | ASM proprietary information | 14
FINANCIAL OVERVIEW

March 5, 2015 | ASM proprietary information | 15
Q4 2014 HIGHLIGHTS
› Revenues up 2% q-o-q and down 2% y-o-y
› Bookings down 1% q-o-q and up 16% y-o-y
› Book-to-bill ratio of 1.2
› Q4 backlog of EUR 176m, up from EUR 147m in Q3 2014
› EBIT margin of 10.8% compared to 14.1% in Q3 2014 and 12.5% in Q4
2013
› Cash flow from operations of EUR 11m in Q4
› Normalized net earnings* of EUR 26.9m, down from EUR 60.2m in Q3
2014 and up from EUR 9.3m in Q4 2013
* excl. re-measurement gain, realized gain on sale of ASMPT shares, amortization and fair value adjustments

March 5, 2015 | ASM proprietary information | 16
FINANCIAL OUTLOOK
Based upon the current backlog and our current visibility:
For Q1 we expect sales between €150 and €160 million. For Q2 we
expect a double digit sales increase as compared to Q1. For the
second half of 2015 the current visibility is limited. The Q1 order intake
is expected to be in the range of €145-165 million.

March 5, 2015 | ASM proprietary information | 17
NET EARNINGS Q4
EUR million Q4 2013 Q3 2014 Q4 2014Q4 2014 vs
Q3 2014Q4 2014 vs
Q4 2013
New orders 133.1 156.2 154.4 (1)% 16%Backlog 114.8 146.9 176.1 20% 53%Book-to-bill 1.0 1.3 1.2Net sales 126.9 122.2 124.3 2% (2)%
Gross profit 49.9 52.9 53.5 1% 7%
Gross profit margin % 39.3% 43.2% 43.0%
Selling, general and administrative expenses (18.6) (19.9) (21.5) 8% 16%Research and development expenses 15.0) (15.7) (18.5) 18% 23%
Restructuring expenses (0.5) - - n/a n/a
Operating result 15.8 17.2 13.4 (3.8) (2.4)
Operating margin % 12.5% 14.1% 10.8%
Result from investments 1.5 30.7 8.9 (21.8) 7.4
Remeasurement gain, realized gain on sale of ASMPT shares, amortization and fair value adjustments (343.2) (5.7) (6.0) (0.3) 337.2
Net earnings (334.0) 54.6 21.0 (33.6) 355.0
Normalized net earnings (excl. remeasurement gain, realized gain on sale of ASMPT shares, amortization and fair value adjustments) 9.3 60.2 26.9 (33.3) 17.6
Normalized net earnings per share, diluted €0.14 €0.93 €0.42 €(0.51) €0.28Normalized net earnings excl. results from investments 7.8 29.5 18.0 (11.5) 10.2

March 5, 2015 | ASM proprietary information | 18
NET EARNINGS 2014
EUR millionPro-forma
2013 20142014 vs
2013
New orders 479.6 602.1 26%Backlog 114.8 176.1 53%Book-to-bill 1.1 1.1Net sales 452.0 545.6 21%
Gross profit 176.2 235.0 33%
Gross profit margin % 39.0% 43.1%
Selling, general and administrative expenses (70.7) (80.5) 14%Research and development expenses (58.3) (63.9) 10%
Restructuring expenses (2.5) (0.1) n/a
Operating result 44.7 90.5 45.8
Operating margin % 9.9% 16.6%
Result from investments 20.9 61.1 40.2
Remeasurement gain, realized gain on sale of ASMPT shares, amortization and fair value adjustments 1,006.4 (22.5) (1,028.9)
Net earnings 1,051.9 137.3 (914.6)
Normalized net earnings (excl. remeasurement gain, realized gain on sale of ASMPT shares, amortization and fair value adjustments) 45.5 159.8 (114.3)
Normalized net earnings per share, diluted €0.71 €2.49 €1.78Normalized net earnings excl. results from investments 24.6 98.7 74.1

March 5, 2015 | ASM proprietary information | 19
CASH FLOW
EUR million Q4 2013 Q3 2014 Q4 2014
Net earnings (334.0) 54.6 21.0
Depreciation and amortization 5.7 5.3 5.8
PPA amortization and adjustments 343.2 5.7 6.0
Result from investments (1.5) (30.7) (8.9)
Other adjustments 5.4 (14.8) (2.2)
Change in working capital (6.1) 2.6 (10.6)
Net cash from operating activities 12.8 22.6 11.0
Net cash from investing activities (7.6) (9.9) (15.4)
Dividend paid and capital repaid to ASMI shareholders (0.1) (4.1) -
Share buyback - - (29.3)
Dividend received from investments - 12.5 -
Other 4.6 0.1 1.7 Net cash from financing activities 4.7 8.5 (27.6)

March 5, 2015 | ASM proprietary information | 20
BALANCE SHEET
EUR millionDec 31, 2013 Dec 31, 2014
Cash and cash equivalents 312 386
Accounts receivable 83 82
Inventories 105 124
Other current assets 18 27
Investments and associates 944 1,092
Property, plant and equipment 57 79
Other non-current assets 33 38
Total Assets 1,551 1,827
Accounts payable 45 61
Short-term debt - -
Other current liabilities 57 74
Long-term debt - -
Other non-current liabilities 3 2
Shareholders' equity 1,447 1,690
Total Liabilities and Equity 1,551 1,827

March 5, 2015 | ASM proprietary information | 21
WORKING CAPITAL
EUR million Days
40
50
60
70
80
90
100
110
120
130
140
Q1 Q2 Q3 Q4 Q1 Q2 Q3 Q4 Q1 Q2 Q3 Q4 Q1 Q2 Q3 Q4
11 12 13 14
Days of working capital
0
20
40
60
80
100
120
140
160
Q1 Q2 Q3 Q4 Q1 Q2 Q3 Q4 Q1 Q2 Q3 Q4 Q1 Q2 Q3 Q4
11 12 13 14
Working capital Quarterly sales

March 5, 2015 | ASM proprietary information | 22
BOOKINGS AND BACKLOG
EUR million
020406080
100120140160180200
Q1 Q2 Q3 Q4 Q1 Q2 Q3 Q4 Q1 Q2 Q3 Q4 Q1 Q2 Q3 Q4 Q1 Q2 Q3 Q4 Q1 Q2 Q3 Q4
09 10 11 12 13 14
Bookings Backlog

March 5, 2015 | ASM proprietary information | 23
HISTORICAL DEVELOPMENT
40-
30-
20-
10-
-
10
20
30
40
0
20
40
60
80
100
120
140
160
Q1 Q2 Q3 Q4 Q1 Q2 Q3 Q4 Q1 Q2 Q3 Q4 Q1 Q2 Q3 Q4 Q1 Q2 Q3 Q4 Q1 Q2 Q3 Q4
09 10 11 12 13 14
Net Sales (lhs) EBIT (rhs)
EUR million

March 5, 2015 | ASM proprietary information | 24