investor presentation - capital product partners
TRANSCRIPT

Investor Presentation
www.capitalpplp.com
December, 2014

Disclosures
This presentation contains forward-looking statements (as defined in Section 21E of the Securities Exchange Act of 1934, as amended) which reflect CPLP’s management’s current assumptions and expectations with respect to expected future events and performance. The statements in this presentation that are not historical facts, including our expectations regarding employment of our vessels, redelivery dates and charter rates, fleet growth (including the proposed drop down transaction with our sponsor), demand, newbuilding deliveries and slippage as well as market and charter rate expectations and expectations regarding our quarterly distributions, amortization payments, ability to pursue growth opportunities and grow our distributions and annual distribution guidance may be forward-looking statements (as such term is defined in Section 21E of the Securities Exchange Act of 1934, as amended). These forward-looking statements involve risks and uncertainties that could cause actual results to be materially different from those expressed or implied in the forward-looking statements.
Factors that could cause actual results to be materially different include those set forth in the “Risk Factors” section of our annual report on Form 20-F filed with the U.S. Securities and Exchange Commission. Unless required by law, we expressly disclaim any obligation to update or revise any of these forward-looking statements, whether because of future events, new information, a change in our views or expectations, to conform them to actual results or otherwise. We assume no responsibility for the accuracy and completeness of the forward-looking statements. We make no prediction or statement about the performance of our units.
For more information about the Partnership, please visit our website: www.capitalpplp.com
i 1
CPLP: Safely Powering Ahead
2
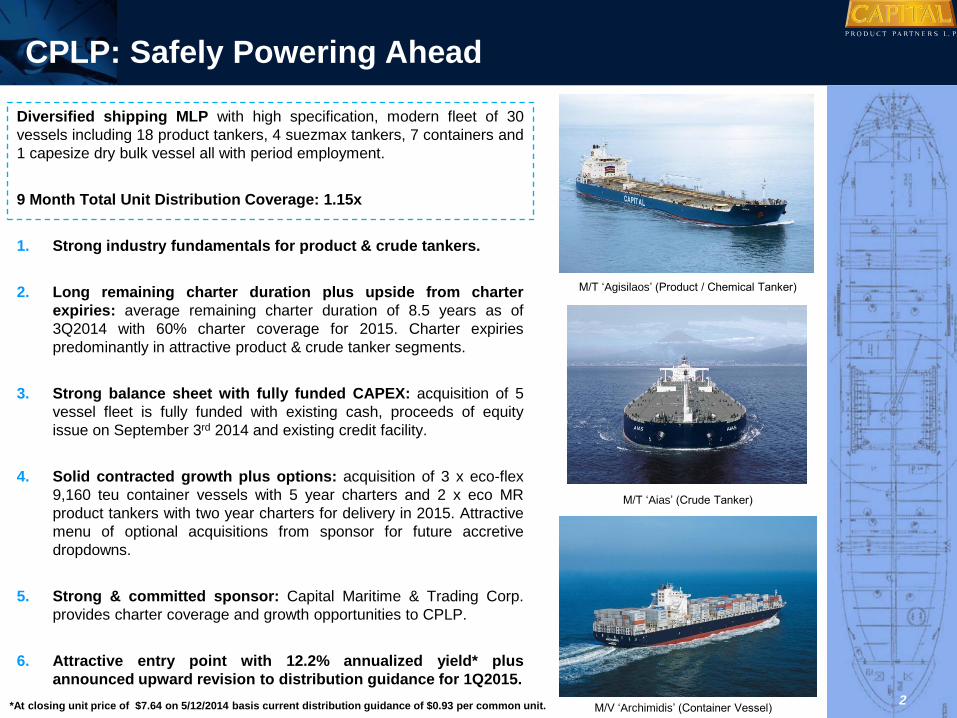
Diversified shipping MLP with high specification, modern fleet of 30
vessels including 18 product tankers, 4 suezmax tankers, 7 containers and
1 capesize dry bulk vessel all with period employment.
9 Month Total Unit Distribution Coverage: 1.15x
1. Strong industry fundamentals for product & crude tankers.
2. Long remaining charter duration plus upside from charter
expiries: average remaining charter duration of 8.5 years as of
3Q2014 with 60% charter coverage for 2015. Charter expiries
predominantly in attractive product & crude tanker segments.
3. Strong balance sheet with fully funded CAPEX: acquisition of 5
vessel fleet is fully funded with existing cash, proceeds of equity
issue on September 3rd 2014 and existing credit facility.
4. Solid contracted growth plus options: acquisition of 3 x eco-flex
9,160 teu container vessels with 5 year charters and 2 x eco MR
product tankers with two year charters for delivery in 2015. Attractive
menu of optional acquisitions from sponsor for future accretive
dropdowns.
5. Strong & committed sponsor: Capital Maritime & Trading Corp.
provides charter coverage and growth opportunities to CPLP.
6. Attractive entry point with 12.2% annualized yield* plus
announced upward revision to distribution guidance for 1Q2015.
*At closing unit price of $7.64 on 5/12/2014 basis current distribution guidance of $0.93 per common unit.
M/T ‘Agisilaos’ (Product / Chemical Tanker)
M/T ‘Aias’ (Crude Tanker)
M/V ‘Archimidis’ (Container Vessel)

R79
G129
B189
R192
G80
B77
R155
G187
B89
R128
G100
B162
R75
G172
B198
R247
G150
B70
R0
G154
B255
Bullets
R0
G32
B96
Agenda
Text
Color Palette
R38
G77
B130
Headers
R221
G221
B221
Modern, High Specification Fleet
30 Vessels - 2.1mm DWT (~41k TEUs) 6.5 Years Weighted Average Fleet Age1
Fleet List & Charterers
Vessel Name DWT / TEU Charterer Year Built Type Of Vessel ATLANTAS 36,760
2006, S. Korea Ice Class 1A IMO II/III Chemical/ Product
AKTORAS 36,759 2006, S. Korea Ice Class 1A IMO II/III Chemical/ Product
AIOLOS 36,725 2007, S. Korea Ice Class 1A IMO II/III Chemical/ Product
AIAS 150,393
2008, Japan Crude Oil Suezmax
AMOUREUX 149,993 2008, Japan Crude Oil Suezmax
AMORE MIO II 159,982 2001, S. Korea Crude Oil Suezmax
ARISTOTELIS 51,604 2013, S. Korea ECO IMO II/III Chem./Prod.
ASSOS 47,872 2006, S. Korea Ice Class 1A IMO II/III Chemical/ Product
ATROTOS 47,786 2007, S. Korea Ice Class 1A IMO II/III Chemical/ Product
AXIOS 47,872 2007, S. Korea Ice Class 1A IMO II/III Chemical/ Product
AVAX 47,834 2007, S. Korea Ice Class 1A IMO II/III Chemical/ Product
APOSTOLOS 47,782 2007, S. Korea Ice Class 1A IMO II/III Chemical/ Product
ANEMOS I 47,782 2007, S. Korea Ice Class 1A IMO II/III Chemical/ Product
AKERAIOS 47,781 2007, S. Korea Ice Class 1A IMO II/III Chemical/ Product
AGISILAOS 36,760 2006, S. Korea Ice Class 1A IMO II/III Chemical/ Product
ARIONAS 36,725 2006, S. Korea Ice Class 1A IMO II/III Chemical/ Product
ALEXANDROS II 51,258
2008, S. Korea IMO II/III Chem./Prod.
2008, S. Korea IMO II/III Chem./Prod. ARISTOTELIS II 51,226
ARIS II 51,218 2008, S. Korea IMO II/III Chem./Prod.
ALKIVIADIS 36,721 2006, S. Korea Ice Class 1A IMO II/III Chemical/ Product
MILTIADIS M II 162,397 2006, S. Korea Crude Oil Suezmax
AYRTON II 51,260 2009, S. Korea IMO II/III Chem./Prod.
CAPE AGAMEMNON 179,221 2010, S. Korea Capesize Dry Cargo
AGAMEMNON 7,943
2007, S. Korea Container Carrier
ARCHIMIDIS 7,943 2006, S. Korea Container Carrier
HYUNDAI PREMIUM 5,023
2013, S. Korea Container Carrier
HYUNDAI PARAMOUNT 5,023 2013, S. Korea Container Carrier
HYUNDAI PRIVILEGE 5,023 2013, S. Korea Container Carrier
HYUNDAI PRESTIGE 5,023 2013, S. Korea Container Carrier
HYUNDAI PLATINUM 5,023 2013, S. Korea Container Carrier
3
Fleet Profile by Vessel Type
184
7
1
2.1mm DWT
41,001 TEUs
Fleet Age1
9.6 Years
6.5 Years
1 Industry average age data from Clarksons as of 30th September 2014 weighted for the composition of the CPLP fleet.

R79
G129
B189
R192
G80
B77
R155
G187
B89
R128
G100
B162
R75
G172
B198
R247
G150
B70
R0
G154
B255
Bullets
R0
G32
B96
Agenda
Text
Color Palette
R38
G77
B130
Headers
R221
G221
B221
Diversified Across Different Shipping Segments
13 Ice Class 1A IMO II/III Chemical/Product Tankers
5 IMO II/III Chemical/Product Tankers
Average Fleet Age Of 8.3 Years
49% Of 2013A Revenues
42% Of 9 Months Ending 30/09/2014 Revenues
4
MR2 & MR1 Product Tankers
Suezmax Crude Tankers
Container Vessels
Capesize Drybulk Carrier
4 Crude Oil Suezmax Tankers
Average Fleet Age Of 6.6 Years
18% Of 2013A Revenues
17% Of 9 Months Ending 30/09/2014 Revenues
1 Capesize Drybulk Carrier
Average Fleet Age Of 4.0 Years
6% Of 2013A Revenues
5% Of 9 Months Ending 30/09/2014 Revenues
7 Post-Panamax Container Vessels
Average Fleet Age Of 3.6 Years
27% Of 2013A Revenues
36% Of 9 Months Ending 30/09/2014 Revenues
42%
FY13 Revenue:
$84mm Q1-Q3 2014
Revenue: $60mm
18%
17%
FY13 Revenue:
$32mm Q1-Q3 2014
Revenue: $24mm
27%
36%
FY13 Revenue:
$46mm Q1-Q3 2014
Revenue: $52mm
6% 5%
FY13 Revenue:
$9mm Q1-Q4 2014
Revenue: $7mm
Our acquisition criteria is based on the merits of each individual vessel transaction and how
accretive it will be to CPLP
49%

1A. Changing Trade Patterns Favoring Tankers
Fast growing crude oil demand from
Asia, particularly China and India,
driving suezmax demand.
Continued growth on long-haul crude
trade routes from the Atlantic to the
Far East, which replace shorter haul,
traditional routes.
Voyage fixtures from West Africa to
the East have reached 100 YTD,
compared to a low of 17 in 2005.
Asian demand growth offsetting
decreasing crude oil imports to the
U.S.
World oil demand is set to grow by
0.7 and 1.2 mb/d in 2014 and 2015,
respectively, according to the IEA.
Overall, suezmax dwt demand is
projected to expand by 4.1% in 2015,
up from 2.3% in 2014.
Muted fleet growth to add support to
the market. Fleet is forecast to
contract by 0.3% in 2015.
Source: IEA, Clarksons
0.0
1.0
2.0
3.0
4.0
5.0
6.0
2004 2005 2006 2007 2008 2009 2010 2011 2012 2013 2014
Seaborne Crude Oil Imports (Mb/d)
China
India
5
0
20
40
60
80
100
120
Nu
mb
er
of
Fixt
ure
s Suezmax Voyage Fixtures WAF-East

1B. …Leading to Strong Recovery for Suezmax Tankers
Suezmax T/C Rates
– 10 Year Average
1-Year Rate $31,928
3-Year Rate $29,928
Suezmax spot earnings YTD have
increased by 65% compared to FY
2013.
Negative fleet growth and increased
crude movements from the Atlantic
basin to Europe and Asia have
boosted rates.
Chinese crude imports reached 6.7
mb/d in September, the second
highest monthly average on record.
Fleet has contracted by 0.1% YTD.
Period market rates increasing in
response to the firming spot rate
environment.
Three-year period rates at the highest
level since August 2010.
Suezmax tanker orderbook through
2017 corresponding to 12.8% of
current fleet, the lowest in percentage
terms since 1997.
Increased slippage at 65% (YTD
2014).
Source: IEA, Clarksons
$14,000
$16,000
$18,000
$20,000
$22,000
$24,000
$26,000
$28,000
$30,000
$32,000
$34,000$/Day 1 & 3 Year Suezmax T/C Rates
1 Year Suezmax T/C Rate
3 Year Suezmax T/C Rate
0%
5%
10%
15%
20%
25%
30%
35%
40%
45%
50%
0
5
10
15
20
25
30
2004 2005 2006 2007 2008 2009 2010 2011 2012 2013 2014
Dwt (m) Suezmax Tankers Orderbook
Orderbook (Million DWT)
% of Fleet
6

1C. U.S. Product Exports & Refinery Capacity Dislocation Benefiting
Product Tankers
Increased U.S. oil production has seen
product exports rise significantly,
increasing ton/miles for product tankers.
U.S. product exports now standing at 3.6
mb/d compared to 0.96 mb/d in 2004.
Rising U.S. crude oil production expected
to further increase product export
volumes. Production is projected to reach
9.4 mb/d in 2015, the highest annual
average since 1972.
Favorable structural changes in the
refinery market:
2.18 mb/d refinery capacity removals
in OECD countries in 2012-2014 YTD.
2.9 mb/d of new refinery capacity
coming on line in the East in 2015-
2017 (MEG, India, China).
Record U.S. product exports along with
the widening refinery dislocation are
driving MR product tanker spot rates at
multi-year highs.
MR spot average earnings currently at the
highest level since October 2008.
Source: EIA, IEA, Clarksons
7
4,500
6,500
8,500
10,500
12,500
14,500
16,500
18,500
20,500
22,500$/ Day MR Spot Earnings
500
750
1,000
1,250
1,500
1,750
2,000
2,250
2,500
2,750
3,000
3,250
3,500
3,750U.S. Exports of Total Petroleum Products (kbpd)

1D. …Leading to Strengthening Product Period Market
T/C Rates 10-Year
Average
1-Year T/C
MR Rate $18,926
3-Year T/C
MR Rate $18,004
The MR period product tanker market
has strengthened considerably over the
last two years.
One- and three-year time charter rates
reached five year highs in March 2014
and presently remain at firm levels.
Solid period activity:
160 fixtures YTD
251 fixtures in 2013
188 fixtures in 2012
Sustained recovery in the MR spot
market is expected to support period
rates and activity going forward.
Orderbook (2014-2018) for MR tankers at
19.0% of total fleet.
New building contracts have declined
sharply, as most shipyards have
exhausted their capacity through 2016.
66 orders placed YTD compared to 261 in
2013.
2015 product tanker dwt supply
projected at 4.5% vs. demand of 3.5%.
Slippage amounting to 17% (YTD 2014).
Source: Clarksons
0%
5%
10%
15%
20%
25%
30%
35%
40%
45%
50%
0
100
200
300
400
500
600
700
2004 2005 2006 2007 2008 2009 2010 2011 2012 2013 2014
Nu
mb
er
of
Ve
sse
ls
MR Tankers Orderbook
Orderbook
% of Fleet
$11,000
$12,000
$13,000
$14,000
$15,000
$16,000
$17,000$/Day 1 & 3 Year MR2 Time Charter Rates vs. CPLP MR2 Average T/C Rate
1 Yr T/C MR2 Rate
3 Yr T/C MR2 Rate
CPLP MR2 Average T/C Rate
8

2. Strong Charter Coverage With Attractive Rates and
Profit Share Arrangements
Weighted Average Remaining Charter Duration: 8.5 Years as of End 3Q2014
Charter Profile
Commentary
Solid Product &
Suezmax Tanker Period
Market:
Three-Year MR and
Suezmax Time Charter
(TC) Period Rates
Currently Estimated at
ca. $15,000-$15,500 per
day and $26,000-$28,000
per day respectively.
CPLP Positioned to
Capitalize on Improving
Product Tanker Rates
CPLP has Staggered the
Charters of Many of its
Product and Crude
Tankers on 1-Year Time
Contracts, in Order to
Take Advantage of the
Improving Fundamentals
of the Product and Crude
Tanker Industries.
Rates Expiry of Current Charters
1 Bareboat
9
Vessel type
Product tanker
Crude tanker
Crude tanker
Product tanker
Crude tanker
Product tanker
Product tanker
Crude tanker
Product tanker
Product tanker
Product tanker
Product tanker
Containership
Product tanker
Product tanker
Product tanker
Product tanker
Containership
Product tanker
Product tanker
Product tanker
Product tanker
Product tanker
Product tanker
Dry Bulk
Containership
Containership
Containership
Containership
Containership
Gross
Rate
$14,250
$17,000
$24,000
$14,950
$24,000
$14,850
$14,850
$28,000
$14,750
$14,750
$17,000
$14,750
$34,000
$14,125
$14,750
$15,350
$14,250
$34,000
$7,0001
$6,7501
$6,2501
$13,5001
$6,2501
$6,2501
$42,200
$29,350
$29,350
$29,350
$29,350
$29,350
Profit
Share
Jan-14 Sep-14 Jun-15 Feb-16 Nov-16 Jul-17 Apr-18 Dec-18 Sep-19 May-20
Arionas
Amore Mio II
Aias
Akeraios
Amoureux
Apostolos
Anemos I
Miltiadis M II
Atrotos
Assos
Aristotelis
Axios
Agamemnon
Alkiviadis
Avax
Ayrton II
Agisilaos
Archimidis
Aktoras
Atlantas
Alexandros II
Aiolos
Aristotelis II
Aris II
Cape Agamemnon
Hyundai Prestige
Hyundai Premium
Hyundai Paramount
Hyundai Privilege
Hyundai Platinum

3A. Strong Balance Sheet
10
($ in Thousands)
As of
September 30, 2014
As of
December 31, 2013
ASSETS
Total Current Assets 170,037 73,732
Total Fixed Assets 1,200,935 1,176,819
Other Non-Current Assets 137,861 151,221
Total Assets $1,508,833 $1,401,772
LIABILITIES AND PARTNERS’ CAPITAL
Total Current Liabilities $44,964 $38,928
Total Long-Term Liabilities 577,228 581,418
Total Partners’ Capital 886,641 781,426
Total Liabilities and Partners’ Capital $1,508,833 $1,401,772
Net Debt / Capitalization: 26.7%

3B. Fully Funded CAPEX
Acquisition of 5 vessel fleet for total consideration of $311.5 million from
Capital Maritime & Trading Corp. to be funded by:
– Cash on balance sheet.
– Equity issue of September 3rd 2014 with net proceeds to the Partnership of
$113.5 million.
– Existing $225 million ING credit facility already in place with $150 million
undrawn amount.
Committed Vessels
Vessel
Name Type Capacity
Scheduled
Delivery Yard
Acquisition
Price Charterer
Gross Rate
(per day) Duration
Akadimos Eco-Flex, Wide
Beam 9,160 TEU Jun-15 Daewoo $81.5m CMA-CGM $39,250 5 Years
Adonis Eco-Flex, Wide
Beam 9,160 TEU Aug-15 Daewoo $81.5m CMA-CGM $39,250 5 Years
Anaxagoras Eco-Flex, Wide
Beam 9,160 TEU Nov-15 Daewoo $81.5m CMA-CGM $39,250 5 Years
Active
Eco IMO II/III
Chem/Product
Tanker
50,000 DWT Mar-15 Samsung $33.5m CMTC
(backstop)
$17,000 +
P/S* 2 Years
Amadeus
Eco IMO II/III
Chem/Product
Tanker
50,000 DWT Jun-15 Samsung $33.5m CMTC
(backstop)
$17,000 +
P/S* 2 Years
11

4. Healthy Growth Opportunities
Optional Vessels (CPLP Holds Right Of First Refusal)
Vessel Name Type Capacity Scheduled Delivery Yard
Amor
Eco IMO II/III
Chemical/Product
Tanker
50,000 Dwt Sep-2015 Samsung
50,000 Dwt Jan-2016 Samsung Athlos
Alkaios 50,000 Dwt Apr-2016 Samsung
Anikitos 50,000 Dwt Jul-2016 Samsung
Archon 50,000 Dwt Oct-2016 Samsung
Amfitrion 50,000 Dwt Dec-2016 Samsung
CMTC Remaining NB Program & Recent Acquisitions
Vessel Name Type Capacity Scheduled Delivery Yard
Miltiadis Junior
ECO Crude Tanker
320,000 Dwt Jun-2014 SWS
Apollonas 300,000 Dwt Nov-2015 Daewoo
300,000 Dwt Mar -2016 Daewoo Atromitos
Access to healthy growth opportunities through the sponsor’s extensive
newbuilding program.
Further acquisition opportunities from open market and sponsor’s joint venture
with a third party with 5 x 9,000teu newbuildings. 12

5. Strong Sponsor Committed To The Partnership
CMTC underlines its support to the partnership:
– CMTC and Mr. Marinakis, our Chairman, control 19.6% of the Partnership’s
common units.
– CMTC converted 4,048,484 Class B preferred units into an equivalent
number of common units to further align its interest with common
unitholders.
– CMTC waived its right to receive quarterly incentive distributions between
$0.2425 and $0.25, after the IDR reset was approved by a substantial
majority of the Partnership's limited partners represented at the AGM.
– CMTC continues to provide charter coverage for a number of CPLP’s
vessels at favorable rates and/or when period demand is limited.
CMTC is a profitable, diversified shipping company and enjoys a strong
balance sheet with low leverage of less than 25%.
13

6. Sustainable Distribution With Strong Growth Potential
9 Month 2014 Total Unit Coverage: 1.15x
Solid growth in revenues from improving product & crude tanker
fundamentals.
High average remaining charter duration for our fleet.
The majority of product tankers and all CPLP’s Suezmax vessels come
off charters in 2015.
Strong balance sheet with fully funded CAPEX allowing for further
growth.
Contracted immediate growth with 5 vessel fleet. Furthermore,
substantial dropdown capacity from sponsor with more than $550
million in potential dropdown assets.
Strong sponsor committed to the partnership.
Announced upward revision to distribution guidance in 1Q2015:
14
Management Commentary At 3Q2014 Earnings Release:“…we believe that
the Partnership has entered into a new growth phase, which we expect
will provide the basis for reviewing the Partnership's annual distribution
guidance with an eye toward an upward revision in the first quarter 2015,
concurrent with the expected timing of the first of five agreed vessel
acquisitions from Capital Maritime.“
M/T ‘Agisilaos’ (Product / Chemical Tanker)
M/T ‘Aias’ (Crude Tanker)
M/V ‘Archimidis’ (Container Vessel)

APPENDIX

Statements of Comprehensive Income / (Loss)
For the Three- Month Period
Ended
September 30, 2014
For the Three- Month Period
Ended
September 30, 2013
Revenues $29,156 $29,084
Revenues – related party 19,015 13,658
Total Revenues 48,171 42,742
Expenses:
Voyage expenses 1,226 1,371
Voyage expenses – related party 82 68
Vessel operating expenses 12,165 9,467
Vessel operating expenses – related party 3,031 4,442
General and administrative expenses 1,876 2,120
Depreciation & amortization 14,374 13,221
Operating income 15,417 12,053
Non operating income
Gain from bargain purchase - 24,781
Total non operating income - 24,781
Other income (expense), net
Interest expense and finance cost (4,903) (3,973)
Other income 755 331
Total other expense, net (4,148) (3,642)
Partnership’s net income $11,269 $33,192
($ In Thousands)
16

Operating Surplus For Calculation Of Unit Distribution
($ In Thousands)
For the Three-Month
Period Ended
September 30, 2014
For the Three-Month
Period Ended
June 30, 2014
Net income $11,269 $7,816
Adjustments to net income
Depreciation and amortization 14,703 14,579
Deferred revenue 3,818 4,457
OPERATING SURPLUS PRIOR TO
CLASS B PREFERRED UNITS
DISTRIBUTION
$29,790 $26,852
Class B preferred units distribution (3,040) (3,970)
ADJUSTED OPERATING SURPLUS 26,750 22,882
(Increase) on recommended reserves (2,058) (1,828)
AVAILABLE CASH $24,692 $21,054
Common Unit Coverage: 1.1x 17

Period Employment Update
Name DWT Built Gross Rate (Per Day)
Charterer Earliest Charter
Expiry
M/T Miltiadis M II 162,397 2006 Increase by $4,815 April 2015
M/T Alkiviadis 36,721 2006 $14,125 September 2015
M/T Avax 47,834 2007 $14,750 August 2015
M/T Agisilaos 36,760 2006 $14,250 August 2015
Extended the charter of the M/T Miltiadis M II to PEMEX for 6 months at an increased
rate.
Established a new time charter relationship with CSSA S.A., a fully owned subsidiary
of Total S.A.
Chartered the M/T Avax and the M/T Agisilaos to CMTC for one year.
18

Capital Product Partners L.P.