investor presentation: expanding the value chain
TRANSCRIPT

TIDEWATER MIDSTREAM & INFRASTRUCTURE LTD
: TWM
Pipestone Gas Plant Acheson Rail Terminal
Pioneer Pipeline
Prince George Refinery
Brazeau River Complex
Investor Presentation: Expanding the Value Chain
October 2019
Acquisition of Prince George Refinery

2
IMPORTANT – YOU MUST READ THE FOLLOWING BEFORE CONTINUING: The information contained in this document has been prepared by Tidewater Midstream and Infrastructure Ltd. ("Tidewater" or the "Corporation") and contains confidential information pertaining to the business, operations and assets of the Corporation. The information contained in this document (a) is provided as at the date hereof and is subject to change without notice, (b) does not purport to contain all the information that may be necessary or desirable to fully and accurately evaluate an investment in the Corporation, and (c) is not to be considered as a recommendation by the Corporation that any person make an investment in the Corporation. An investment in the securities of the Corporation is speculative and involves a number of risks that should be considered by a prospective investor. This document is confidential and is being provided to you solely for your information and may not be reproduced, in whole or in part, in any form or forwarded or further distributed to any other person. Any forwarding, distribution or reproduction of this document in whole or in part is unauthorized. This presentation is not, and under no circumstances is to be construed as, a prospectus, or advertisement or a public offering of securities of the Corporation. Prospective investors should not assume that this document is complete and should conduct their own analysis and investigation of the Corporation and consult with their own financial, legal, tax and other business advisors before investing in the Corporation. By accepting and reviewing this document, you acknowledge and agree (i) to maintain the confidentiality of this document and the information contained herein, (ii) to protect such information in the same manner you protect your own confidential information, which shall be at least a reasonable standard of care and (iii) to not utilize any of the information contained herein except to assist with your evaluation of a potential investment in the Corporation. The information presented herein was prepared or obtained by the Corporation. Nothing contained herein is, or should be relied on as, a promise or representation as to the future performance of the Corporation.
CAUTIONARY NOTE REGARDING FORWARD-LOOKING INFORMATION AND FORWARD-LOOKING STATEMENTS: In the interests of providing Tidewater shareholders and potential investors with information regarding Tidewater, including management’s assessment of future plans and operations relating to the Corporation, this document contains certain statements and information that are forward-looking statements or information within the meaning of applicable securities legislation, and which are collectively referred to herein as "forward-looking statements". The use of any of the words "anticipate", "continue", "estimate", "expect", "may", "will", "project", "should", "believe", "plan", "intend" and similar expressions are intended to identify forward-looking statements. Forward-looking statements are often, but not always, identified by such words. These statements involve known and unknown risks, assumptions, uncertainties and other factors that may cause actual results or events to differ materially from those anticipated in such statements. Forward-looking statements in this document include, but are not limited to statements and tables (collectively "statements") with respect to: success of projects, including the Pipestone Sour Gas Plant, TransAlta Pipeline project and expansion of crude oil infrastructure; potential expansion of Phase II Pipestone project; the potential to interconnect Montney and Deep Basin core areas, including the Brazeau River Complex; acquisition (the "Acquisition") of the Prince George Refinery ("PGR") in British Columbia; terms of PGR Acquisition; ability of the Corporation to increase its existing credit facility for the purchase of the PGR; potential benefits from top tier crack spreads stemming from local supply shortfall in the Prince George market; viability and characterization of take-or-pay agreements and related counterparty risks; timing of PGR Acquisition; Tidewater entering into a 5-year take-or-pay agreement with an investment grade counterparty prior to closing of the PGR Acquisition; ability of PGR to see a cost advantage as a result of discount of local Canadian crude supply; continued demand for supply from PGR; rank of PGR's crack spreads in North America; integration of PGR Acquisition into Tidewater's existing corporate strategy; impact of PGR Acquisition on Tidewater's pro forma corporate Adjusted EBITDA (as defined under "USE OF NON-GAAP MEASURES" below); target dividend payout ratio; ability to increase the amount and tenor of take-or-pay contracts supporting Adjusted EBITDA; debt repayment based on successful completion of projects and anticipated cash flow; ability of Tidewater to reduce exposure to commodity price volatility by hedging the Prince George crack spread; benefits generated from an integrated processing and infrastructure network; projected Adjusted EBITDA levels for 2019 and 2020 as a result of the Acquisition; the percentage breakdown of contribution to Adjusted EBITDA in 2020 as a result of the Acquisition; projections regarding future delivery of crude oil to end markets, impact of crude oil infrastructure business to net income and Adjusted EBITDA in 2019 and 2020; plans to explore various market access opportunities including storage, terminals and pipelines; future growth of Tidewater's crude oil infrastructure business and expectations regarding longer term agreements with existing and new customers; projected plans and benefits of Tidewater's crude oil and refined products infrastructure business including with respect to future earnings and incremental Adjusted EBITDA; subsequent acquisitions and strategies for acquisitions, capital projects and expenditures; strategic initiatives; anticipated producer activity and industry trends; and anticipated performance.
Readers are cautioned not to place undue reliance on forward-looking statements, as there can be no assurance that the plans, intentions or expectations upon which they are based will occur. By their nature, forward-looking statements involve numerous assumptions, as well as known and unknown risks and uncertainties, both general and specific, that contribute to the possibility that the predictions, forecasts, projections and other forward-looking statements will not occur and which may cause Tidewater’s actual performance and financial results in future periods to differ materially from any estimates or projections of future performance or results expressed or implied by the forward-looking statements. These assumptions, risks and uncertainties include, among other things: that receipt of third party, regulatory, environmental and governmental approvals and consents relating to the PGR Acquisition and Tidewater's other capital projects can be obtained on the necessary terms and in a timely manner; completion of the PGR Acquisition; completion of the subscription receipt offering; Tidewater’s ability to successfully implement strategic initiatives and whether such initiatives yield the expected benefits; future operating results and the success of Tidewater's operations; fluctuations in the supply and demand for natural gas, natural gas liquids ("NGLs"), and iso-octane; assumptions regarding, and fluctuations of, future natural gas, crude oil and NGL prices; oil and gas industry expectation and development activity levels and the geographic region of such activity; anticipated timelines and budgets being met in respect of Tidewater's projects and operations; activities of producers, competitors and others; the weather; assumptions around construction schedules and costs, including the availability and cost of materials and service providers; assumptions regarding, and potential changes in, the amount of operating costs to be incurred; fluctuations in currency, exchange and interest rates; assumptions regarding, and risks relating to, viability of counterparties and take-or-pay arrangements; that counterparties will comply with contracts in a timely manner; ability of Tidewater to formalize agreements with counterparties; changes in the credit-worthiness of counterparties; credit risks; marketing margins; unexpected cost increases, potential disruption or unexpected technical difficulties in developing new facilities or projects and constructing or modifying processing facilities; that there are no unforeseen material costs relating to the
Disclaimers

3
facilities which are not recoverable from customers; Tidewater’s ability to generate sufficient cash flow from operations to meet its current and future obligations; distributable cash flow and net cash provided by operating activities consistent with expectations; Tidewater’s ability to access external sources of debt and equity capital on satisfactory terms; availability of capital to fund future capital requirements relating to existing assets and projects; Tidewater's future debt levels and the ability of the Corporation to repay its debt when due; assumption that any third-party projects relating to Tidewater's growth projects will be sanctioned and completed as expected; the amount of future liabilities relating to lawsuits and environmental incidents and the availability of coverage under Tidewater's insurance policies, if any; Tidewater's ability to obtain and retain qualified staff, equipment, services, supplies and personnel in a timely and cost-effective manner; ability of Tidewater to successfully market its products; that any required commercial agreements can be negotiated and completed; changes in laws or regulations or the interpretations of such laws or regulations; the regulatory environment and decisions, and First Nations and landowner consultation requirements; political and economic conditions and general economic and industry trends; stock market volatility; the ability to secure land and water, including obtaining and maintaining land access rights; activities of other facility owners, including access to third-party facilities; competition for, among other things, business, capital, acquisition opportunities, requests for proposals and materials; environmental risks and hazards, including risks inherently in the transportation of NGLs which may create liabilities to Tidewater in excess of Tidewater's insurance coverage, if any; failure of third parties' reviews, reports and projections to be accurate, including those in respect to the Acquisition; actions by joint venture partners or other partners which hold interests in Tidewater's assets; adverse claims made in respect of Tidewater's properties or assets; technology and security risks, including cybersecurity; potential losses from any disruption in production; failure to realize the anticipated benefits of acquisitions; and other assumptions, risks and uncertainties described from time to time in the reports and filings made with securities regulatory authorities by Tidewater.
Readers are cautioned that the foregoing list of important factors is not exhaustive. The forward-looking statements contained in this document are made as of the date of this document or the dates specifically referenced herein. For additional information, please refer to Tidewater’s public filings available on SEDAR at www.sedar.com. All forward-looking statements contained in this document are expressly qualified by this cautionary statement.
CAUTIONARY NOTE REGARDING FUTURE-ORIENTED FINANCIAL INFORMATION: To the extent any forward-looking statement in this presentation constitutes “future-oriented financial information” or “financial outlooks” within the meaning of applicable securities legislation, such information is being provided for the purpose of providing information about management's current expectations and goals relating to the future of Tidewater and the reader is cautioned that this information may not be appropriate for any other purpose and the reader should not place undue reliance on such future-oriented financial information and financial outlooks. Future-oriented financial information and financial outlooks, as with forward-looking statements generally, are, without limitation, based on the assumptions and subject to the risks set out above under the heading “Cautionary Note Regarding Forward-Looking Information and Forward-Looking Statements”, among others. The Company’s actual financial position and results of operations may differ materially from management’s current expectations and, as a result, the Company’s financial position may differ materially from what is provided in this presentation. Such information is presented for illustrative purposes only and may not be an indication of the Company’s actual financial position or results of operations.Any financial outlook or future-oriented financial information, as defined by applicable securities legislation, including IRR projections, and Adjusted EBITDA forecasts, has been approved by management of Tidewater as of October 3, 2019.
USE OF NON-GAAP MEASURES: This presentation refers to "Adjusted EBITDA", which does not have any standardized meaning prescribed by generally accepted accounting principles in Canada ("GAAP"). Adjusted EBITDA is calculated as income or loss before interest, taxes, depreciation and amortization, share based compensation, unrealized gains/losses on derivative contracts, non-cash items, transaction costs and other items considered non-recurring in nature. Management utilizes Adjusted EBITDA to set objectives and as a key performance indicator of the Corporation’s success. In addition to its use by Management, Tidewater also believes Adjusted EBITDA is a measure widely used by securities analysts, investors and others to evaluate the financial performance of the Corporation and other companies in the midstream industry. Investors should be cautioned that Adjusted EBITDA should not be construed as alternatives to earnings, cash flow from operating activities or other measures of financial results determined in accordance with GAAP as an indicator of the Corporation’s performance and may not be comparable to companies with similar calculations.
For more information with respect to financial measures which have not been defined by GAAP, including reconciliations to the closest comparable GAAP measure, see the "Non-GAAP Measures" section of Tidewater’s most recent MD&A which is available on SEDAR.
THIRD PARTY INFORMATION: This presentation includes market and industry data which was obtained from various publicly available sources and other sources believed by the Corporation to be true. Although the Corporation believes it to be reliable, the Corporation has not independently verified any of the data from third-party sources referred to in this presentation, or analyzed or verified the underlying reports relied upon or referred to by such sources, or ascertained the underlying assumptions relied upon by such sources. The Corporation does not make any representation as to the accuracy of such information.
Disclaimers

44
ACQUISITION STRUCTURE & HIGHLIGHTS
TransactionOverview
▪ Acquisition Price: Acquisition of Prince George Refinery for a base transaction price of $215 million
▪ Working Capital: Additional ~$62 million payable for current and long term inventory at market pricing
▪ Offtake Agreement: 5-year volume commitment with Husky for refined product volumes which includes
take-or-pay like provisions relating to committed customer volumes, and price review and protection
mechanisms applicable to the Prince George rack price calculation and the customer’s rack price discount
▪ Contingency Payments: Adj. EBITDA exceeding $100 million in 2020 or 2021 will be shared on a 50/50
basis with Husky up to a maximum of $30 million per year
FinancialHighlights
▪ Acquiring a highly profitable refinery at attractive purchase price metrics of 2.9x EV/ 2020E Adj. EBITDA (1)
▪ Funded through a 3 year, $100 million term loan and a $250 million increase to TWM’s credit facility
▪ PGR is expected to generate $75 million of 2020E Adj. EBITDA(1) providing material accretion to TWM
▪ Acquisition strengthens Tidewater’s balance sheet, delevers TWM to under 4.0x Net Debt to Adj. EBITDA
on 2020 basis and under 3.5x on a 2020 exit basis
▪ Following the acquisition of PGR, ~75% of 2020E Adj. EBITDA will be comprised of take-or-pay, area
dedication or volume commitments & ~50% will be derived from investment grade counterparties
Timing ▪ Transaction is expected to close by year-end
1) Management forecast of $75 million of PGR 2020E Adj. EBITDA, takes into account historical performance, long term operating views, volatility, variability and cyclicality associated with the refinery
Prince George Refinery

55
Prince George RefinerySTRATEGIC RATIONALE
World Class Light Oil Refinery,Located in a Highly Profitable Market
▪ Acquisition of 1 of 2 refineries in B.C.; provides exposure to Prince George market, a highly profitable
market with high barriers to entry and a material supply shortfall (net short ~150.0 mbbl/d)(1)(2)
▪ Refinery receives robust crack spreads resulting from strong-supply demand fundamentals
▪ Offtake agreement with Husky allows for certainty of volume sales at competitive prices in the context of
the Prince George regional market
▪ One of few assets in Western Canada that can take advantage of low carbon intensity incentives as the
complex actively blends ethanol and biodiesel
Value Chain Enhancement & Platform for Future Growth
▪ Direct value chain addition as Tidewater’s Pipestone Gas Plant produces the ideal feedstock for the
Prince George Refinery at 15,000 bbls/d of 45° API crude/condensate
▪ PGR’s largest customers are already 2 of the largest customers at Tidewater’s Pipestone Gas Plant
▪ Capture incremental margins driven by operational synergies from Tidewater’s existing integrated
infrastructure and logistics portfolio (i.e. Pipestone Complex, rail)
▪ Significant upside with small capital projects/blending opportunities with 6-24 month payouts.
▪ Incl. 1 mmbbl of crude & refined product storage, TWM will consider leasing on long term contracts
▪ Larger midstream peers continue to expand their downstream presence/infrastructure (Keyera – iso-
octane, IPL/Pembina – PDH/PP, Gibson – Moose Jaw Refinery, Parkland – Burnaby Refinery)
1) Refinery capacity per Canadian Association of Petroleum Producers 2018 Crude Oil Forecast, Markets and Transportation; Excludes Husky Lloydminster and Gibson Moose Jaw asphalt plants2) Regional demand per Statistics Canada 2017 refined petroleum product sales

6
ACQUISITION OF PRINCE GEORGE REFINERY (“PGR”) FROM HUSKY ENERGY FOR $215 MILLION
Expanding the Value Chain
A Diversified Midstream Company with an Expanding Value Chain, Supported by Long Term Contracts
Acquire and Build High Quality, Strategically Located, Contracted
Infrastructure
Pro forma ~75% of Adj. EBITDA Derived From ToP, Area Dedication,
Long Term Commitments (1)
Pro Forma Acquisition ~50% of Adj. EBITDA From Investment Grade
Counterparties (2)
Long Term Leverage Target of2.5x - 3.0x Debt/ Adj. EBITDA (3)
1
2
3
4
1) Pro forma contracted 2020E Adj. EBITDA includes take-or-pay agreements, area dedications and PGR Offtake Agreement as defined herein2) Assumes 100% of PGR Adj. EBITDA is under Husky Offtake Agreement which includes take-or-pay like provisions relating to committed customer volumes, and price review and protection
mechanisms applicable to the Prince George rack price calculation and the customer’s rack price discount3) Net debt is calculated as bank debt plus notes payable, less cash. Includes convertible debenture offering which closed August 8, 2019 after giving effect to the offering and acquisition as
disclosed in the final prospectus filed on SEDAR
EDMONTON
VALHALLA
TAYLOR
PRINCE GEORGE
PIPESTONEGAS PLANT
BRC
RAM RIVER
PEMBINAWESTERN PIPELINESYSTEM
TC ENERGYNGTL
DEEP BASIN CORE AREA
MONTNEYCORE AREA
PRINCE GEORGE
REFINERY
PREEP
FSEEPVEEP
ACHESONTRANSALTA
EDMONTONCORE AREA
TIDEWATERPIONEER PIPELINE
PRINCE GEORGE REFINERY
TIDEWATER - CORE FACILITY
TIDEWATER - OTHER FACILITY
TIDEWATER OWNED PIPELINE
3RD PARTY PIPELINE
RAIL CONNECTIVITY
TRANSALTA SUNDANCE/KEEPHILLS
• ALLIANCE (GAS)• PEMBINA (Crude, Condensate, NGL’s)

7
50%
11%2%
37%
78%
18%
4%
13%
51%
36%
20%
80%
60%
40% 38%
25%
37%
PGR SIGNIFICANTLY IMPROVES TWM’S DIVERSITY, CONTRACTEDNESS AND COUNTERPARTY MIX
Pro Forma Adj. EBITDA Make-up
Stand Alone Pro Forma PGRHighlights
20
20
E A
dj.
EB
ITD
A b
yD
ivis
ion
20
20
E A
dj.
EB
ITD
A b
y C
on
trac
t Ty
pe
20
20
E A
dj.
EB
ITD
A b
y C
ou
nte
rpar
ty
▪ PGR is expected to be a material contributor to corporate Adj. EBITDA
▪ Material cash flow to contribute to deleveraging efforts and funding of growth projects
▪ Internal marketing team will work on optimizing commercial operations
▪ Transaction materially improves 2020E volume contractedness
▪ Pro forma acquisition ~ 75% of projected total 2020E Adj. EBITDA is under long term commitments (4)
▪ Pro forma company derives ~50% of total 2020E Adj. EBITDA from investment grade counterparties
Gathering, Processing and Transport NGL Marketing and Extraction Other PGR
ToP Adj. EBITDA and/or LT Commitments(2) Non-ToP or Long Term Commitments PGR - Committed Adj. EBITDA(3)
Investment Grade Non- Investment Grade PGR – Investment Grade
1) Management forecast of $75 million of PGR 2020E Adj. EBITDA, takes into account historical performance, long term operating views, volatility, variability and cyclicality associated with the refinery2) ToP Adj. EBITDA includes take-or-pay contracts as well as area dedications3) Assumes 100% of PGR Adj. EBITDA is under Husky Offtake Agreement, which includes take-or-pay like provisions relating to committed customer volumes, and price review and protection mechanisms applicable to the Prince George
rack price calculation and the customer’s rack price discount4) Pro forma contracted 2020E Adj. EBITDA includes take-or-pay agreements, area dedications and PGR Offtake Agreement
(1)
(1)
(1)
(2)

8
▪ Becoming one of the largest players in natural gas storage in Western Canada
▪ Investment grade counterparties on long term contracts at Brazeau River and Pipestone gas storage facilities
▪ Diversified market access by way of connectivity and strategically owned pipeline assets
▪ Pioneer Pipeline (TransAlta 15 year ToP)
▪ Connectivity and access to major export pipeline systems (TCPL, Alliance)
▪ >1.0 Bcf/d processing capacity
▪ 200 Bcf of natural gas storage
▪ >4,000 kms of pipelines (gross)
▪ >30,000 bbls/d of NGL processing capabilities at BRC and Pipestone
▪ 3 ethane extraction plants in the greater Edmonton area
▪ 12,000 bbls/d refining capacity
▪ >1.0 mmbbl of refined product and crude oil storage
▪ 150 railcar facility at Edmonton
1
2
Natural Gas Natural Gas Liquids Crude and Condensate
Integrated marketing, logistics, producer and end-market relationships that enhance value for producers and manage commodity risk for Tidewater
▪ Strategically owned liquids extraction and fractionation assets
▪ Fractionation facility at BRC built at industry leading cost and timeline
▪ Connectivity to key markets in SK, AB and BC
▪ Owned infrastructure and marketing capabilities drive pricing uplift for producers
▪ Propane, ethane premiums with long-term relationship with refiners and rail experience
▪ Butane premiums through blending opportunities (investment grade offtaker)
1
2
▪ PGR offers immediate optionality for existing TWM customers
▪ Direct link to 45° API crude/condensate at Pipestone Complex
▪ 5-year investment grade offtake agreement
▪ Direct end market access to pipe and rail
▪ TWM logistics and marketing capabilities to provide connectivity from Pipestone to PGR and North American finished product markets
1
2
3
Integrated Value ChainPGR IS AN ACCRETIVE ADDITION TO TWM’S NATURAL GAS, NGL, AND CRUDE OIL VALUE CHAINS

9
Prince George Refinery
GRANDE PRAIRIEPRINCE GEORGE
TAYLOR
BC AB
▪ On September 23, 2019 , Tidewater announced the start up of its Pipestone Gas Plant with plans to ramp the facility to 100 MMcf/d of processing by year end
▪ Adding PGR to existing infrastructure portfolio provide existing Pipestone customers with optionality on ~15.0 mbbl/d of Pipestone crude/condensate
▪ The refinery in turn benefits from additional input options, as two existing customers of the Pipestone complex provide over 50% of the facility feedstock
Crude is transported from Taylor to Prince George, B.C. on a contracted basis through Pembina’s Western
Pipeline system
45° API crude/condensate processed at the Pipestone Gas Plant is the ideal
feedstock for the Prince George Refinery
Prince George Refinery
Pipestone Complex
EXPANDING THE PIPESTONE VALUE CHAIN

10
June 2, 2015 ($180 mm)
▪ 63% WI in Brazeau River Complex and blending facility
DEMONSTRATED ABILITY TO EFFECTIVELY INTEGRATE AND ENHANCE THE VALUE OF ACQUIRED ASSETS
History of Successful Acquisitions & Development
February 2, 2016 ($94 mm)
▪ Deep Basin / Central AB gas processing facilities and infrastructure (490 MMcf/d)
May 5, 2016 ($11 mm)
▪ Infrastructure, pipeline right of ways and gas storage facility within Pipestone area
November 16, 2016 ($15 mm)
▪ 50% WI in gas gathering pipelines directly connected to the BRC
December 19, 2016 ($30 mm)
▪ Remaining 37% WI in BRC, 60% WI in 105 km of gas gathering pipelines and remaining 50% WI in gas storage reservoirs
August 15, 2017 ($51 mm)
▪ Deep Basin, Montney and Wapiti Pipeline acquisitions of gas plant and related infrastructure
A B December 6, 2017 ($195 mm)
▪ Agreement with TransAlta to construct Pipeline network connected to BRC
C
B
October 2018 ($220 mm)(1)
▪ Receive regulatory approval to construct Pipestone Gas Plant (Pipestone Phase I); subsequent sale of co-gen facility for $85 million
1) Net of $85 million proceeds from sale of co-gen facility
▪ Expansion of 40 MMcf/d of additional deep cut processing capacity
▪ Added 10.0 mbbl/d Fractionation Facility on-time and on-budget
▪ Extended average take-or-pay agreements by an additional 2 years and increased volume commitment
▪ Expanded area dedication through additional pipelines
▪ TWM’s 50% WI Pioneer Pipeline connects BRC to TransAlta’s Keephills and Sundance generating stations
▪ Signed 15-year take-or-pay agreement with TransAlta at market rate tolls
▪ Completed 4 months ahead of schedule
▪ Initial capacity of 130 MMcf/d gross capacity with expansion capability
▪ Commissioned Phase 1, with full ramp up expected by year end 2019
▪ Acquired and expanded gas storage and connected the facility to both Alliance and TC Energy (NGTL)
▪ Acquired raw gas compression (30 MMcf/d), condensate handling (5.4 mbbl/d) and associated water disposal battery in 2019
▪ Phase II Pipestone project expansion awaiting FID
BRAZEAU RIVER COMPLEX PIPESTONE COMPLEX PIONEER PIPELINEA B C
A July 23, 2019 ($30 mm)
▪ Acquired 100% W.I. in 30 MMcf/d raw gas compression and 5,400 bbls/d condensate handling battery from Pipestone Energy
September 2019
▪ Announced commissioning of the Pipestone gas plant
▪ Volumes expected to increase to 100 MMcf/d by year end
B
B
A

11
▪ Pipestone began processing sour gas on September 15, 2019 and processing approximately 30 MMcf/d during start-up phase
▪ Expect full ramp up to at or near capacity by year end
▪ Constructed on time and on budget
▪ Approximately $210 million capital cost and online Q3 2019
▪ 100% contracted with firm commitments
▪ Average contract life of 8.5 years on a ToP basis for 90% of the
facility design capacity
▪ Executed processing agreement with a second investment grade counterparty
▪ Plan to connect to Tidewater infrastructure/egress hub which provides three
natural gas egress options in TCPL, Alliance and natural gas storage
▪ Announced acquisition of Pipestone Energy’s East Battery for $30 million
▪ Pipestone Energy extension of current ToP from 5 to 10 years
▪ 10-year, 20 MMcf/d ToP commitment for proposed Pipestone Plant 2 project
▪ 10-year area dedication to liquids handling expansion project
▪ Completed 24km, 30 inch natural gas pipeline connecting the Pipestone Gas Plant to the Pipestone Gas Storage Facility
▪ Connected to both Alliance and TCPL
▪ The Pipestone Gas Storage Facility is now fully contracted with investment
grade counterparties over an average 6-year term
▪ Executed storage agreements with multiple investment grade counterparties
▪ Tidewater has significant support for future gas processing and liquids handling expansions at Pipestone
Montney Core Area | OverviewSTRATEGICALLY POSITIONED TO OFFER MONTNEY CUSTOMERS PROCESSING, EGRESS, AND STORAGE
Montney Processing Facilities & Pipelines
PIPESTONE
Goodfare
ValhallaKnopcik
Parkland
Cypress
RR 17:RR 18:RR 19:
.
..Tidewater Plants:
Tidewater:Pembina:Alliance:
Rail:
NGTL:Westcoast:
Coastal Gas Link:
PRINCE GEORGE
REFINERY

12
Montney Core Area | Pipestone Gas PlantFLAGSHIP 100 MMCF/D GAS PROCESSING PLANT, COMPLETED ON TIME AND ON BUDGET
Land LegendCrown - Advantage
Crown - CNRL
Crown - Encana
Crown - Husky
Crown - Kelt
Crown - Pipestone Energy
Well Legend
Well – Producing Wells
Pipeline Legend
Pipelines - Alliance
Pipelines - NGTL
Pipelines – Pembina Operated
Pipelines – Tidewater Pipestone Pipeline

13
▪ Pioneer Pipeline physically connects Tidewater’s largest gas processing complex (BRC) to a large new demand source in TransAlta’s Sundance and Keephills power plants and is anchored by a 15-year ToP
▪ Construction was complete four months ahead of schedule with first gas transported in late May 2019
▪ Ability for expansion to greater than 400 MMcf/d
▪ Ability to connect Montney producers to new end market and avoid TC Energy restrictions
▪ TransAlta now owns a 50% working interest
▪ East Duvernay activity continues to increase around Tidewater’s Deep Basin assets, with large investment grade entities in addition to some well capitalized private companies like Vesta, Artis and Kiwetinohk Resources Corp (former 7Gen team) becoming increasingly active
▪ In March 2018, Tidewater announced a 5-year 17.2 net Bcf volume commitment with an investment grade counter party at Ram River
▪ In August 2018, Tidewater signed an agreement for an incremental 18 MMcf/d on a 5-year ToP with the volumes declining approximately 30% per year at Ram River
▪ The Brazeau River Fractionation facility is fully contracted for the first time in Tidewater’s history including signed agreements with two new investment grade counter parties
▪ BRC egress includes natural gas storage facilities currently capable of injecting approximately 40MMcf/d of natural gas and offering producers improved natural gas pricing option
Deep Basin Core Area | OverviewACTIVITY CONTINUES TO INCREASE AROUND TIDEWATER’S DEEP BASIN ASSETS
Deep Basin Processing Facilities & Pipelines
Brazeau River (“BRC”)
Keephills
Sundance
Ram River
Gilby
Sylvan Lake
Paddle River
Alder Flats
Louis Bull
Bonnie Glen
Acheson
Villeneuve
Fort Sask
RR 17:RR 18:RR 19:
Deanne
.
.
.Tidewater Plants:
TransAlta Power Plants:
Tidewater:NGTL:
Alliance:Rail:
Pioneer Pipeline

14
–
$100,000
$200,000
$300,000
$400,000
$ P
er
Dia
mete
r-In
ch-M
ile Pioneer Other Projects
Comparative Natural Gas Pipeline Construction Costs(1)
1) Regulatory filings and public disclosure
Well Legend
Well – Rig Released Last 12 Months
Pipeline Legend
Pipelines - Alliance
Pipelines - NGTL
Pipelines – TWM Pioneer
Deep Basin Core Area | Pioneer PipelineCONNECTS TIDEWATER’S LARGEST GAS PROCESSING COMPLEX TO A LARGE NEW DEMAND SOURCE
15
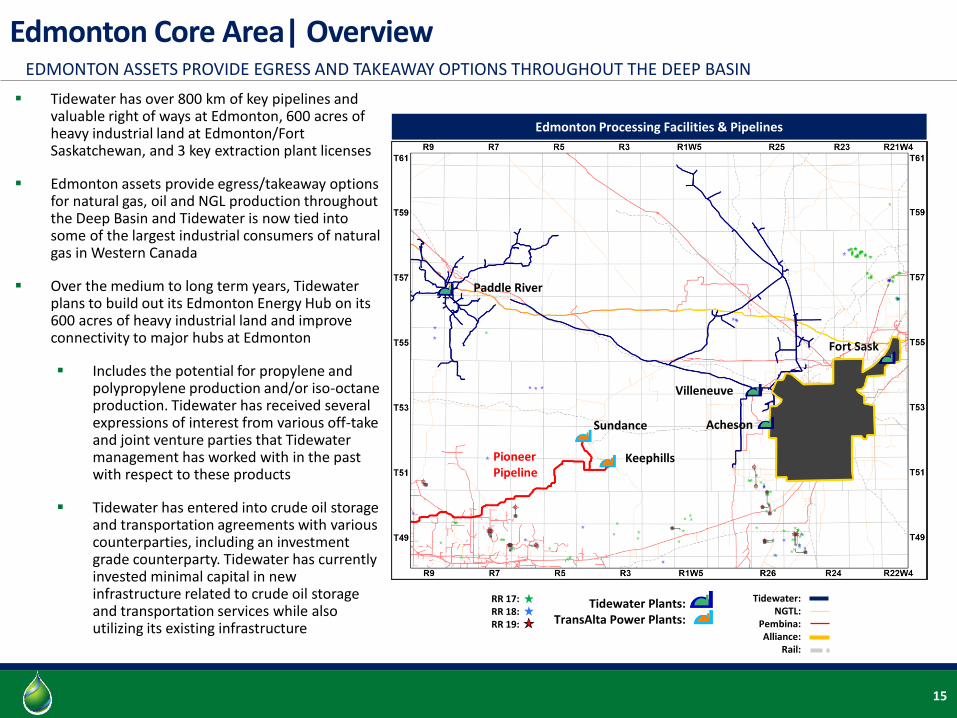
▪ Tidewater has over 800 km of key pipelines and valuable right of ways at Edmonton, 600 acres of heavy industrial land at Edmonton/Fort Saskatchewan, and 3 key extraction plant licenses
▪ Edmonton assets provide egress/takeaway options for natural gas, oil and NGL production throughout the Deep Basin and Tidewater is now tied into some of the largest industrial consumers of natural gas in Western Canada
▪ Over the medium to long term years, Tidewater plans to build out its Edmonton Energy Hub on its 600 acres of heavy industrial land and improve connectivity to major hubs at Edmonton
▪ Includes the potential for propylene and polypropylene production and/or iso-octane production. Tidewater has received several expressions of interest from various off-take and joint venture parties that Tidewater management has worked with in the past with respect to these products
▪ Tidewater has entered into crude oil storage and transportation agreements with various counterparties, including an investment grade counterparty. Tidewater has currently invested minimal capital in new infrastructure related to crude oil storage and transportation services while also utilizing its existing infrastructure
Edmonton Core Area| OverviewEDMONTON ASSETS PROVIDE EGRESS AND TAKEAWAY OPTIONS THROUGHOUT THE DEEP BASIN
Edmonton Processing Facilities & Pipelines
RR 17:RR 18:RR 19:
.
.
.Tidewater Plants:
TransAlta Power Plants:
Tidewater:NGTL:
Pembina:Alliance:
Rail:
Pioneer Pipeline
Keephills
Sundance
Paddle River
Acheson
Villeneuve
Fort Sask

16
-
0.5x
1.0x
1.5x
2.0x
2.5x
3.0x
3.5x
4.0x
4.5x
-
$ 100
$ 200
$ 300
$ 400
$ 500
$ 600
$ 700
$ 800
$ 900
2015A 2016A 2017A 2018A 2019E 2020E Proforma
YE N
et D
eb
t / NTM
Ad
j. EBITD
A
YE
Ne
t D
eb
t ($
mm
)
YE Net Debt YE Net Debt / NTM Adj. EBITDA
-
$0.10
$0.20
$0.30
$0.40
$0.50
$0.60
$0.70
-
$ 50
$ 100
$ 150
$ 200
$ 250
2015A 2016A 2017A 2018A 2019E 2020E Proforma
Ad
j. EBITD
A ($
/ sha
re)N
et
Inco
me
& A
dj.
EBIT
DA
($
mm
)
Net Income Adj. EBITDA Adj. EBITDA per share
ANNUAL NET INCOME, ADJUSTED EBITDA & YEAR END NET DEBT FOR TWM (1)
Acquisition Overview
1) See page 28 for 2019 and 2020 assumptions.2) See Non-GAAP Measures and Forward Looking Information3) 2019E Adj. EBITDA excludes contribution from PGR during the calendar year. 2019E YE net debt gives effect to the PGR acquisition.4) Fully diluted shares as reported by Tidewater at YE for historical periods. 2019E+ fully diluted share count calculated using the treasury method and September 30, 2019 share price5) Also includes Reserve Dedication and Volume Commitments % of Adj. EBITDA
(2)(3) (2)(3)(4)
(2)(3)
77% 5-Yr Adj. EBITDA CAGR (2020E)
34% 5-Yr Adj. EBITDA per Share CAGR (2020E)
~3.5x 2020E YE Net Debt / NTM Adj. EBITDA
TOP5 Adj. EBITDA 87% 71% 65% 58% 60% 75%
IG Counterparty
Adj. EBITDA0% 9% 13% 15% 20% 49%
(2)(3)
( )

17
▪ Low Carbon Initiatives / Accomplishments
▪ The Prince George Refinery is one of the only assets in Western Canada that can utilize
renewables (canola oil, biodiesel, and ethanol utilized at facility to help reduce carbon
footprint along with several other green initiatives)
▪ The Pioneer Pipeline increases the amount of natural gas TransAlta co-fires at its Sundance and
Keephills generating stations to facilitate the reduction of carbon emissions and costs
▪ Pipestone Complex built to be a top tier performer and will outperform industry benchmarks
▪ Health, Safety & Environment
▪ Tidewater policies set an expectation that everyone must share the responsibility to work
safely to meet or exceed laws and regulations
▪ Tidewater takes preventative measures to minimize the likelihood of incidents and operational
downtime while safeguarding employees, the environment, and communities in which it
operates (zero lost time injuries and zero major incidents in 2018)
▪ Pipestone Complex Construction included >1.5 million man hours with zero lost time injuries
▪ Tidewater executive compensation aligned with safety performance
▪ Community Engagement
▪ Tidewater believes the communities in which we live and
operate should be positively impacted
▪ Our reputation of a respected and valued corporate citizen is
paramount and Tidewater takes extra steps to ensure its
investments add value to society
▪ Tidewater is involved in several community cleanups, local
sports sponsorships, community arts support, community
colleges, and local non-profit organizations
▪ Donations and sponsorships of >$160k since start of 2018
Corporate & Operations UpdateCORPORATE RESPONSIBILITY

18
Pro Forma Tidewater Corporate Profile
Stock Symbol TSX: TWM
Common Shares Outstanding ~335 million
Insider Ownership (Fully Diluted) ~6.0%
Market Capitalization (1) $365 million
Pro Forma Net Debt (2) $810 million
Enterprise Value (3) $1,175 million
Midstream Processing Capacity (gross/net) Length of Pipelines (gross/net)
>1.5 Bcf/day / >1 Bcf/day>4,000 km / >3,000 km
Replacement Value of Assets >$2.6 billion
Annual Dividend $0.04/sh.
Current Yield (4) ~3.7%
1) The market capitalization is calculated by multiplying the Corporation’s share price as at October 1, 2019 by the number of common shares outstanding. 2) Estimated net debt at December 31, 2019 calculated as bank debt plus notes payable and convertibles debentures less cash and assumes additional debt incurred at the closing date of approximately $288 million 3) Enterprise Value is calculated as market capitalization plus net debt and is a measure of the Corporation’s total value. Enterprise value is not a standard measure under GAAP.4) Current yield is calculated as annual dividends divided by current share price as at October 1, 2019. Current yield is not a standard measure under GAAP.
PRO FORMA ACQUISITION OF PRINCE GEORGE REFINERY

Appendix – Prince George Refinery Overview
19

20
Acquisition of a highly profitable light oil refinery located in Prince George, B.C.
▪ One of two refineries in British Columbia; PGR has been operated by Husky for over 50 years
▪ Part of a larger non-core disposition package that includes over 500+ retail and service stations
Prince George RefinerySNAPSHOT OF FACILITY HIGHLIGHTS
Storage Capacity (1)
>1.0 mmbbl
Refined Product Yield>45% Diesel
>40% Gasoline
Management estimates 2020E
Adj. EBITDA$75 million (3)
2018A Adj. EBITDA~ $100 million (2)
Pipeline, rail, and truck connectivity
Feedstock~85% BC Light Oil
~15% Boundary Lake
Nelson Complexity 9.1
Nameplate Capacity12.0 mbbl/d
Source: Data as provided by vendor1) Includes crude and refined product2) As per historical information provided by the vendor3) Management forecast of $75 million of PGR Adj. EBITDA, takes into account historical performance, long term operating views, volatility, variability and cyclicality associated with the refinery

21
ENHANCING THE VALUE OF PGR WITHIN TIDEWATER
Retention ofHigh Performing Operating Team
OfftakePartnership
OperationalSynergies
Asset Optimization
Strong plan in place to ensure PGR’s smooth integration and enhanced go-forward operations
▪ Highly visible synergies resulting from existing asset ownership and liquids processing at Pipestone and strong
producer relationships who are current suppliers of PGR crude
▪ Leverage existing CBR assets to deliver margin improvement on crude inputs and refined product sales
▪ Retention of a highly experienced team with an average of 18 years of experience at the refinery(1)
▪ Demonstrated track record of operational excellence has led to robust Adj. EBITDA generation
▪ Tidewater will retain key Husky management and operations staff located in Prince George
▪ Offtake Agreement provides for 5-year volume commitment with Husky reflecting certain ToP characteristics
which includes ToP like provisions relating to committed customer volumes, and price review and protection
mechanisms applicable to the Prince George rack price calculation and the customer’s rack price discount
▪ Allows for certainty of volume sales at competitive prices in the context of the Prince George regional market
▪ Retain flexibility to mobilize refined products to higher priced markets under specific circumstances
▪ Multiple near term optimization opportunities to increase production and storage capacity
▪ Attractive project economics ranging from 1 to 3-year payouts(2)
1) As per data provided by vendor2) Management estimates based on vendor provided data
Prince George Refinery

22
Prince George Refinery| Refined Product Dynamics
PGR's refined product rack prices are consistently amongst the highest in Western Canada and significantly higher than key North American benchmarks
SOLE REFINERY IN NICHE INTERIOR B.C. REGION
1) Refinery capacity per Canadian Association of Petroleum Producers 2018 Crude Oil Forecast, Markets and Transportation; Excludes Husky Lloydminster and Gibson Moose Jaw asphalt plants2) North West Redwater Partnership ("NWRP")3) Management estimates as per data provided by vendor4) Prairies include Alberta, Saskatchewan and Manitoba5) Regional demand per Statistics Canada 2017 refined petroleum product sales6) Source: Management estimates as per data provided by vendor; Based on 2018 market consumption of ~4.5 mmbbl (~720 million litres) of refined product in the Prince George orbit
▪ Localized refined product demand in the Prince George market is higher than available refined product supply from PGR
▪ PGR supplies ~80% of the regional demand (3)
▪ Incremental imports from Imperial Oil account for the balance via a
terminalling agreement at PGR (up to 2.5 mbbl/d)
▪ Supply shortfall supports attractive refined product pricing in the long term
▪ Demand driven by major local industries (forestry, mining and O&G)
▪ Dynamic leads to rack prices being amongst the highest in N.A.
▪ Additional refined product supply into the Prince George market faces logistical and economic challenges given transport costs and lack of offloading facilities
Import Volume
~2 mbbl/d
~10 mbbl/d
PGR Supply
PGR Refined Product Market (6)
Western Canadian Refined Product Flows
Imported volumes are supplied by Imperial, and are offloaded at the Prince George Refinery for distribution

23
-$45
-$40
-$35
-$30
-$25
-$20
-$15
-$10
-$5
$0
2017 2018 2019 2020 2021 2022 2023
US
$/b
bl
WTI
Edmonton Light
WTI Forward
Edmonton Light ForwardActual Forecast
Monthly Average Price Differentials to Brent(3)
Prince George Refinery| Crude Input DynamicsFAVOURABLY POSITIONED IN DISCOUNTED WESTERN CANADIAN CRUDE MARKET
1) The most common Canadian light crude benchmark MSW is referred to as Edmonton Light herein2) Source: National Energy Board3) Source: Bloomberg 4) Public source research
▪ PGR is favourably positioned as a buyer of light Western Canadian crude oil(1) which has historically traded at varying discounts to global and North American benchmarks
▪ Recent market egress constraints have caused Edmonton Light discounts to widen dramatically in the last 15 months
▪ PGR’s strong crude supply cost advantage is expected to continue until new export pipelines are built
▪ Enbridge Line 3 Replacement, Keystone XL and the TMX Expansion
▪ Inputs are transported to PGR via a 3rd party pipeline from Taylor B.C.
▪ Crude can also be sourced via rail (up to 12.0 mbbl/d offloading) and
truck (typically used in unexpected outages)
Western Canada Crude Oil Pipelines(2)
Excess Supply
2,679 Mbbl/d
555 Mbbl/d
282 Mbbl/d264 Mbbl/d107 Mbbl/d
5,688 Mbbl/d
0
1,000
2,000
3,000
4,000
5,000
6,000
2016A 2017A 2018E 2019E 2020E 2021E 2022E 2023E 2024E 2025E 2026E 2027E 2028E 2029E 2030E
Kinder Morgan Trans Mountain Expansion
TransCanada Keystone XL
Enbridge L3R
Rangeland and Mi lk River
Enbridge Express
Kinder Morgan Trans Mountain
TransCanada Keystone
Enbridge Mainline
CAPP Supply Forecast
Western Canada Pipeline Takeaway Capacity(4)

24
$40.23 $40.34 $41.26
$35.62
$40.15
$59.42
$51.34
$0
$10
$20
$30
$40
$50
$60
$70
2013 2014 2015 2016 2017 2018 2019
East Coast 2-1-1 Mid-Continent 2-1-1 Gulf Coast 2-1-1 Rockies 3-2-1 West Coast 3-2-1 Edmonton 2-1-1 Prince George 2-1-1
$65.00
to$60.00
~$44.00
2020
Prince George 2-1-1 Forecast
Prince George 2-1-1 (TWM Model)
CRACK SPREADS AMONGST THE HIGHEST IN NORTH AMERICA
Prince George Refinery| Margin Maximization
PGR’s crack spreads expected to continue to rank amongst the highest in North America
1) As per data provided by vendor2) Source: U.S. cracks per Bloomberg (CME; Net Energy); Edmonton and Prince George cracks per Husky. Edmonton 2-1-1 crack spread calculated as (regular gasoline @ Edmonton + ULSD @ Edmonton)/2 less Edmonton Light;
Prince George 2-1-1 crack spread calculated as (regular gasoline @ PGR + ULSD @ PGR)/2 less PGR Crude3) As per vendor provided third party research on forward pricing4) LCFS adjusted crack spread
▪ The combination of discounted regional crude prices and strong refined product pricing results in Western Canada consistently having some of the highest crack spreads in North America
▪ PGR's crack spreads have been even higher than Edmonton's since 2015, in part the result of favourable local B.C. crude supply & demand dynamics
▪ In 2020, the International Maritime Organization (IMO) will require the global shipping industry to lower sulfur content in bunker fuel from 3.5% to 0.5%
▪ As a result, North American diesel demand is forecast to increase by 5-7% in the near/medium term (nearly 3x historical annual demand growth) (1)
▪ TWM expects the IMO 2020 sulfur regulations will significantly increase pricing for global transportation fuels broadly (such as ULSD)
▪ This stands to benefit PGR, as the refinery produces ULSD and sells into a market which is net short (or find new export markets)
Historical North American Crack Spreads (2)
Implied TWM crack spread based on $75mm management estimated
EBITDA
Forecast
(3)
(4)

25
Prince George Refinery| A Focus on ContractingREADILY AVAILABLE FEEDSTOCK & 5-YEAR CONTRACT FOR OFFTAKE SECURED
Feedstock for the facility is entirely supplied from over 40.0 mbbl/d (1) of existing light oil production from NEBC & Alberta
▪ Historical feedstock mix of 85-95% light oil and 5-15% Boundary Lake oil(2)
▪ Pipestone Gas Plant liquids output of 45° API oil/condensate is optimally suited to be used as refinery feedstock
▪ Suppliers of over 50% of current PGR feedstock are anchor tenants at Tidewater’s Pipestone gas plant
▪ Amenable to sign long-term feedstock supply agreements
▪ Remainder of feedstock volumes currently acquired under 30 day evergreen exchange agreements
Historical Feedstock Supply(2)
0
3
6
9
12
15
Jan-16 Apr-16 Jul-16 Oct-16 Jan-17 Apr-17 Jul-17 Oct-17 Jan-18 Apr-18 Jul-18 Oct-18
mb
bl/
d
Boundary Lake (23 Suppliers) Other BC Light (30 Suppliers) Producer B Producer A
Turnaround Operational Outage
Western Pipeline Outage
Enbridge T-South Pipeline
Explosion
Source: Data as provided by vendor1) Management estimates2) As per data provided by vendor
Offtake Agreement has been secured through a 5-year volume commitment with Husky
▪ 90% of produced volumes are covered by commitments that include ToP like provisions relating to committed customer volumes
▪ Sales price linked to Prince George Rack postings for gasoline and diesel include price review and protection mechanisms applicable to the Prince George rack price calculation and the customer’s rack price discount
▪ Husky owns one of the largest networks of gas stations in B.C. and is also a large marketer to industrial customers in the Prince George area
▪ Network of 500+ petroleum outlets in Western Canada in addition to a large marketing business targeting industrial customers(2)
▪ ~25% of refined product is sold at Husky retail locations with remainder sold via exchange agreements to other retailers per the Offtake Agreement(2)
▪ Agreement allows Tidewater the flexibility to bring in additional volumes through the facility to market to optimally priced markets
▪ The offtake agreement will be assigned to a potential purchaser of the retail network

26
STRONG ADJ. EBITDA GENERATION DRIVEN BY OPERATIONAL EXCELLENCE
Prince George Refinery| Historical Operations
1) Source: Husky actuals, forecasts per management estimates 2) As per historical information provided by the vendor3) Husky completed a plant wide turnaround in 2019. Estimate incorporates historical operations provided by the vendor from January – August 2019 and Tidewater management estimates from September 2019 – December 2019.
▪ PGR’s strong mechanical and operational availability has led to high utilization rates outside of planned downtime
▪ Utilization has contributed to strong Adj. EBITDA generation
▪ Average of over 85% utilization over the past 6 years
▪ PGR is currently under a 3-year turnaround schedule
▪ Turnaround successfully completed in 2019; no further
planned downtime until next schedule turnaround in 2022
▪ Integrity upgrades and improved processes completed in 2019
turnaround could lead to a long term shift to turnarounds
every 4 years
▪ Go-forward 2020, Tidewater is modeling Adj. EBITDA of $75
million for corporate budgeting purposes
▪ Tidewater also intends on protecting this base Adj. EBITDA
with business interruption insurance
▪ 2017 Adj. EBITDA impacted by a light straight run drum
replacement in April 2017, and a leak in heat exchange bundles
in December 2017
0%
20%
40%
60%
80%
100%
120%
-
3,000
6,000
9,000
12,000
15,000
18,000
Utilizatio
n (%
)
Cru
de
Th
rou
ghpu
t (b
bl/d
)
Crude Throughput Utilization Rate
Planned Turnaround
PGR Historical Crude Throughput & Utilization(1)
PGR Historical Adj. EBITDA & PGR 2-1-1 Cracks(2)
$0
$10
$20
$30
$40
$50
$60
$70
$80
$0.0
$5.0
$10.0
$15.0
$20.0
$25.0
$30.0
$35.0
$40.0
Cra
ck Spre
ad ($
/bb
l)Ad
j. E
BIT
DA
($
mm
)
Adj. EBITDA 2-1-1 Crack
Planned Turnaround
Forecasted
Forecasted
2017 Adj. EBITDA of $56.7 million (2)
2018 Adj. EBITDA of approx. $100.0 million (2)
2019 Adj. EBITDA of $90 million (3)

27
Date Announced
Transaction EV (US$MM) $215 $1,000 $358 $35,102 $8,100 $435 $1,849 $1,460 $675 $5,877 $845 $271
Buyer
Target
Type Asset Asset Asset Corporate Dropdown Asset Corporate Asset Asset Corporate Asset Asset
TEV / EBITDA (x) 2.9x 4.0x 4.2x 8.8x 8.1x 3.5x 8.6x 6.3x 6.6x 7.7x 5.6x 5.4x
Proxy Discount Rate(3) 35% 25% 24% 11% 12% 29% 12% 16% 15% 13% 18% 19%
Additional Assets n.a.Logistics and
StorageRail and Storage
Multiple
MidstreamFuel Distribution
Multiple
Midstream
Multiple
MidstreamFuel Stations n.a. Logistics Assets
Multiple
Midstreamn.a.
Geography B.C. California Washington California U.S. Wisconsin Texas B.C. S.W. USA S.W. USA Canada Wyoming
Nelson Complexity 9.1 16.1 5.4 n.a. n.a. 8.9 n.a. 9.1 9.5 n.a. n.a. 11.0
2.9x
4.0x 4.2x
8.8x
8.1x
3.5x
8.6x
6.3x6.6x
7.7x
5.6x5.4x
TBD Jun-19 Nov-18 Apr-18 Nov-17 Aug-17 Aug-17 Apr-17 Jan-17 Nov-16 Oct-16 Jun-16
PRECEDENT REFINERY ACQUISITIONS
Average 6.3x
(1)
Prince George Refinery
Source: S&P Global Market Intelligence, public disclosures, NBF estimates1) Listed in CAD$, excludes potential contingent payments, inventory and other deal costs2) As per management estimates taking into account historical performance and long term operating views as well as volatility, variability and cyclicality associated with refineries 3) Proxy unlevered discount rate calculated as inverse of TEV /EBITDA multiple
(2)
Attractive purchase metrics compare favourably to precedent refinery transactions in North America

28
Forecast Assumptions
Corporate & Operations Update
1
2019 & 2020 Forecast Assumptions (1)
▪ Assumes average historical throughput and operating costs with the addition of the Pipestone Gas Plant, Pioneer Pipeline and crude oil infrastructure.
▪ Contribution to net income for the Pipestone Gas Plant is expected to be approximately $25 - $30 million based on plant throughput of approximately 100 MMcf/d of contracted volume at market rates. Estimated annual operating costs are based on plants of similar size with sour gas processing capability and similar NGL handling capability. Adjusted EBITDA contribution is expected to be approximately $30 - $35 million after adding back depreciation and finance costs based on a 60-year useful life.
▪ Contribution to net income for the Pioneer Pipeline is expected to be approximately $8 - $9 million based on throughput of approximately 130 MMcf/d of contracted volume at market rate transportation tolls. Estimated annual operating costs for the pipeline are based on other pipelines within Tidewater’s currently owned infrastructure of similar size and throughput capacity. Adjusted EBITDA contribution is expected to be approximately $10 million after adding back depreciation and finance costs based on a 60-year useful life and 50% working interest.
▪ Expected net income from crude oil infrastructure assumes terminaling and marketing fees generated from 15 to 20 rail cars per day at a capacity of approximately 550 bbls per car as well as fees generated from existing crude oil storage and pipeline connections.
▪ Q4 2019 Adjusted EBITDA is expected to range from $30 million to $32.5 million ($120 million to $130 million annualized). Forecasted 2020 Adjusted EBITDA is calculated by multiplying fourth quarter 2019 Adjusted EBITDA by four. Tidewater’s business is highly-contracted with a strong network of customers of which are backed by take-or-pay contracts, long-term fee for service agreements and reserve dedications. It is expected that the Company’s volumes, market rates, operating costs, G&A and depreciation will remain consistent with Q4 2019 in 2020.
▪ Management forecast of $75 million of PGR Adj. EBITDA takes into account historical performance, long term operating views, volatility, variability and cyclicality associated with the refinery
1) See Non-GAAP Measures and Forward Looking Information