investor presentation for the year ended ... - prism johnson
TRANSCRIPT

www.prismjohnson.in
1
Investor PresentationFor The Year Ended March 2021
AMONGST INDIA’S LEADING INTEGRATED BUILDING MATERIALS COMPANY
19 May 2021

Prism Johnson: An Integrated Building Materials Company
www.prismjohnson.in 2
Pri
sm C
emen
t
• Capacity: 5.6 mtpa at SatnaCluster in Central India
• Products:
• Ordinary Portland Cement (OPC)
• Portland Pozzalana Cement (PPC): Champion
• Premium PPC Products: Champion Plus and Duratech
• Regional presence catering mainly to Eastern UP, Bihar and Madhya Pradesh
H&
R J
oh
nso
n
• Capacity: 60 mn m2 of own and JV capacity across 11 locations in India
• Products:
• Tiles: Ceramic, Vitrified and Industrial
• Sanitary ware & Faucets
• Engineering Marbles & Quartz
• Construction Chemicals
• Pan India presence, catering to the aspirational and affordable consumption segment and industrial segment
Pri
sm R
MC
• Capacity: 10.5 mn m3
• Products:
• Ready-mixed Concrete
• Aggregates
• Manufactured Sand
• Pan India presence, catering mainly to urban real estate and infrastructure
www.prismjohnson.in 3
Executive Summary

40 44
18
FY19 FY20 FY21
Cash Conversion Cycle*
Executive Summary: Consolidated (Ex RQBE) FY21 Financial Performance Snapshot
www.prismjohnson.in 4
₹53,261 mnFY21 Revenue
8.5% YoY Decline in Revenue due to impact of COVID-19 led lockdowns
and curbs in FY21
EBITDA Margin increased by 290 bps in FY21 led by
cost rationalisation initiatives; HRJ EBITDA
margin at 8.7% (+490 bps)
13.2%FY21 EBITDA Margin
Operating Cash Flow (Pre-Capex and Investments)
grew from ₹ 3,970 million in FY20 to ₹ 9,301 million in
FY21
₹7,023 mnFY21 EBITDA
EBITDA Margin Expansion & Efficient Working Capital
Management led to ROCE#
Expansion from 13.2% in FY20 to 18.2% in FY21
16.9% YoY EBITDA growth led by strong growth across
divisions in H2 FY21; Cement EBITDA / ton grew
8.2% YoY to INR 962
Efficient Working Capital Management
18,642
12,343
Mar-20 Mar-21
Strengthening Balance Sheet
Significant improvement in Net Debt levels (₹ mn)
18.2%FY21 ROCE
FY21 Revenue Mix
* Cash Conversion Cycle = Inventory Days + Debtor Days – Creditor Days# FY21 ROCE is based on EBIT including Other Income
Cement49%
HRJ34%
RMC17%
₹ 9,301 mnOperating Cash Flow

Executive Summary: Division-Wise FY21 Performance Summary
www.prismjohnson.in 5
Cement• Cement & Clinker sales volume improved from 5.72 mn tons in FY20 to 5.82 mn tons in FY21 (1.7% growth)
• Share of premium products in total sales volume continued to increase; Increased from 22.3% of total cement volume in FY20 to 27.7% in FY21
• EBITDA per ton grew 8.2% from ₹889 in FY20 to ₹962 in FY21, primarily driven by cost rationalization measures
H&R Johnson• Tiles sales volume grew at 8.5% from 44.8 mn m2 to 48.6 mn m2, despite impact of COVID-19 during the year
• Substantial reduction in fixed costs and working capital during FY21
• Volume growth coupled with sustainable cost rationalization initiatives led to significant EBITDA growth; EBITDA margin expanded 490 bps to 8.7% in FY21; Q4 FY21 EBITDA margin was 12.6% (+1,120 bps YoY)
• Improvement in the product mix and expansion of distribution network continues to be the key focus area
RMC• Revenue declined 35.8% YoY from ₹14,139 mn in to ₹9,079 mn in FY21 due to severe impact of COVID-19 in metro
and Tier-1 cities during the year
• EBITDA declined from ₹229 mn in FY20 to ₹(169) mn in FY21 due to sharp decline in revenue; EBITDA margins during Q2 to Q4 FY21 expanded 270 bps YoY due to management’s increased focus on controlling operating costs
• Focus continues on improving plant utilization levels, increase in value added products and enhance revenue from the Individual House Builder (IHB) segment

Executive Summary: Q4 FY21 Business Update
www.prismjohnson.in 6
Strong volume growth in cement and HRJ divisions
• Cement: As economic activity continued to pick-up further, the company experienced demand recovery; cement volumes grew 26.7% YoY to 1.90 mn tons in Q4 FY21
• HRJ: Tiles sales volume grew 55.4% YoY in Q4 FY21 led by a revival in real estate and construction sectors
• RMC: Revenues continued to show an improving trend on monthly basis as economic activity improves in tier 1 and metro cities; Q4 FY21 revenue at ₹3,316 mn (- 6.2% YoY) yet to reach pre COVID-19 levels
Significant EBITDA margin expansion in HRJ and RMC
divisions
• Cement: Q4 FY21 EBITDA per ton was ₹875 as compared to ₹1,016 in Q4 FY20, mainly due to increase in raw material costs per ton
• HRJ: Higher volumes and better product mix along with sustainable operating leverage led to 1,120 bps YoY improvement in EBITDA margin to 12.6% in Q4 FY21; HRJ reported highest ever quarterly EBITDA of ₹772 mn
• RMC: Q4 FY21 EBITDA was ₹198 mn as compared to ₹20 mn in Q4 FY20; EBITDA margin came at 6.0% (+540 bps YoY)
Continued focus to increase ROCE and reduce
debt
• Efficient working capital management and superior operational performance led to healthy operating cash flow generation (pre-capex and investments) of INR 3,636 mn in Q4 FY21 (Consolidated Ex RQBE)
• Strengthened balance sheet as Consolidated (ex RQBE) Net Debt reduced from INR 14,884 mn in Q3 FY21 to INR 12,343 mn in Q4 FY21
Key ESG Initiatives
• Commissioned 10 MW of solar power capacity during Q4 FY21 thereby taking the total solar power installed at the cement plant at Satna, Madhya Pradesh to 22.5 MW
• Commissioned 12.4 MW of WHRS during March 2021; total installed WHRS capacity now stands at 22.4 MW at Satna, Madhya Pradesh

www.prismjohnson.in 7
Prism Cement
Prism Cement: Prominent Cement Player in Central India
www.prismjohnson.in 8
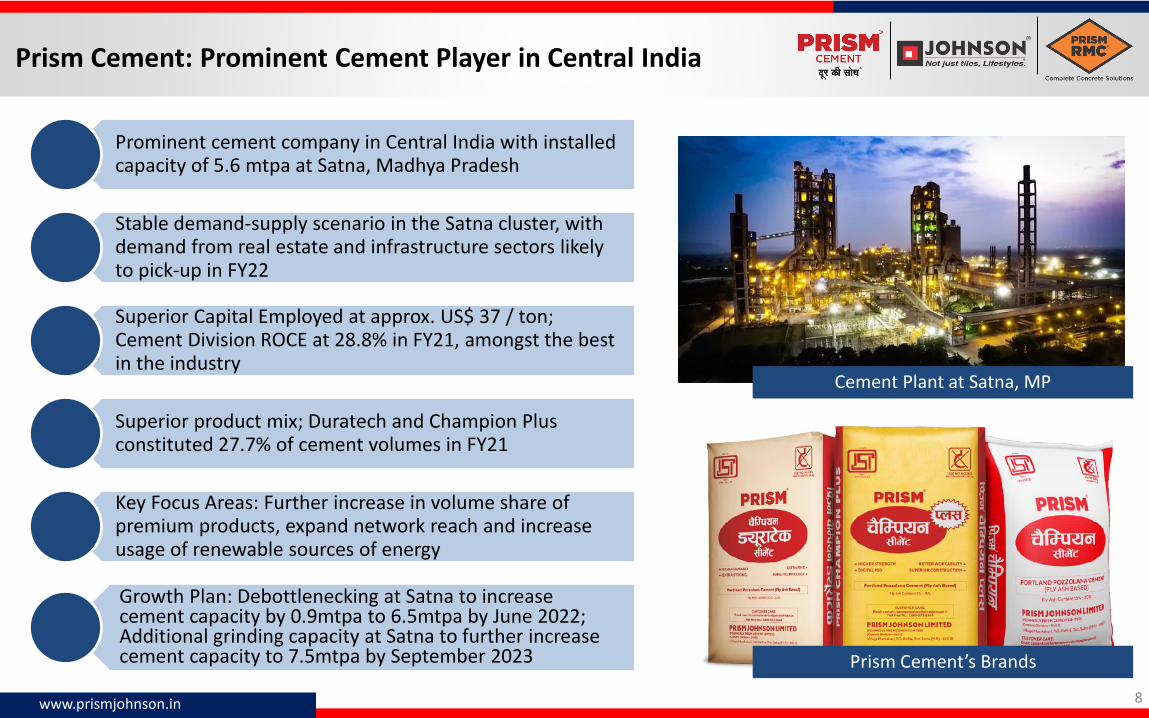
Prominent cement company in Central India with installed capacity of 5.6 mtpa at Satna, Madhya Pradesh
Stable demand-supply scenario in the Satna cluster, with demand from real estate and infrastructure sectors likely to pick-up in FY22
Superior Capital Employed at approx. US$ 37 / ton; Cement Division ROCE at 28.8% in FY21, amongst the best in the industry
Superior product mix; Duratech and Champion Plus constituted 27.7% of cement volumes in FY21
Key Focus Areas: Further increase in volume share of premium products, expand network reach and increase usage of renewable sources of energy
Growth Plan: Debottlenecking at Satna to increase cement capacity by 0.9mtpa to 6.5mtpa by June 2022; Additional grinding capacity at Satna to further increase cement capacity to 7.5mtpa by September 2023
Cement Plant at Satna, MP
Prism Cement’s Brands

Prism Cement: Strong Operating & Financial Metrics in FY21
www.prismjohnson.in 9
1,1
11
61
5 75
3 1,0
16
88
91,1
16
1,0
12
91
8
87
5
96
2
Q1 Q2 Q3 Q4 FY
EBITDA per ton (₹)
FY20 FY21
3,5
51
3,8
96
3,7
04
3,4
07
3,6
27
3,4
83
3,5
06
3,4
47
*
3,4
82
*
3,4
82
*
Q1 Q2 Q3 Q4 FY
Cost per ton (₹)
FY20 FY21
• 8.2% growth in FY21 EBITDA per ton led by cost rationalization initiatives and higher volume of premium products
• Cement production grew 1.7% to 5.82 mt, despite impact of COVID-19 led nationwide lockdown in Q1FY21
• 22.4 MW of WHRS commissioned in FY21 in phases (10MW in November 2020 and 12.4 MW in March 2021)
• Commissioned 10.0 MW of solar power in Q4 FY21 taking total solar power capacity installed at Satna to 22.5 MW
• Prism Cement has started selling cement ex-depot basis wherein most of the customers bear the outward freight cost from the depot to their location. While this has no impact on the reported EBITDA per ton, this led to a decline of ₹115 per ton in both gross realization and outward freight cost in Q4 FY21 and a decline of ₹109 for FY21.
₹ per ton FY20 FY21 % YoY
Power & Fuel 1,227 1,108 (9.7%)
Freight & Forwarding 976 894* (8.4%)
Raw Material 531 691 30.1%
Employee Cost 278 270 (2.6%)
Other Costs 615 519 (15.6%)
Total Cost 3,627 3,482* (4.0%)

Prism Cement: Strong Volume Growth in Q4
www.prismjohnson.in 10
1.56
1.191.38
1.50
1.201.31
1.42
1.90
Q1 Q2 Q3 Q4
Cement & Clinker Sales Volume (mn tons)
FY20 FY21
19.2%
23.1% 23.7% 23.4%22.3%
26.2%27.5% 27.6%
28.9%27.7%
Q1 Q2 Q3 Q4 FY
Premium Products %
FY20 FY21
Eastern Uttar Pradesh
53%Madhya Pradesh
25%
Bihar22%
FY21 Regional Sales Breakup
Trade75%
Non Trade25%
FY21 Sales Volume - Trade vs. Non Trade
Cement and clinker sales volume increased from 5.72
mt in FY20 to 5.82 mt in FY21 (+1.7% ) despite
COVID-19 led decline in volumes in Q1 FY21

Prism Cement: Key Operating Metrics
www.prismjohnson.in 11
406 391 391 382 384
FY17 FY18 FY19 FY20 FY21
Lead Distance (kms)
63
%
60
%
50
%
43
%
39
%
37
%
40
%
50
%
57
%
61
%
FY17 FY18 FY19 FY20 FY21
Rail-Road Mix (%)
Rail Road
73 73 73 7471
FY17 FY18 FY19 FY20 FY21
Power Consumption (Kwh per ton of cement)
Petcoke45%
Coal55%
FY21 Fuel Mix (%)

www.prismjohnson.in 12
H & R Johnson Division

www.prismjohnson.in 13
H&
R J
oh
nso
n
Tiles
Bathroom
Kitchen
Marble & Quartz
Wide product range: tiles,
sanitaryware & faucets, quartz & engineering marbles and construction
chemicals
Long Standing History of Tile
Manufacturing in India; Operating
Since 1958
11 Tile Manufacturing
plants (Including JVs) spread across
India, with total capacity of 60
mn m2
Two Faucet Manufacturing
Plants, at Samba (J&K) and Baddi
(HP)
19 Experience Centres: Large format centres displaying HRJ’s
wide product range
Wide Distribution
Network
HRJ: Amongst the Leading Ceramics Companies in India

HRJ (Consolidated): Better Operating PerformanceLed by Strong Volume Growth and Sustainable Cost Optimization
www.prismjohnson.in 14
4,675 4,633 4,6784,239
1,865
4,8955,423
6,142
Q1 Q2 Q3 Q4
Revenue (₹ mn)
FY20 FY21
211 195 23357
(422)
524
769 772
Q1 Q2 Q3 Q4
EBITDA (₹ mn)
FY20 FY21
• FY21 EBITDA margin expanded 490 bps YoY to 8.7% due to higher sustainable cost rationalisation initiatives taken by the Company
• Substantial reduction in fixed costs and working capital during FY21
• Improving product mix and expanding of distribution network continues to be focus area
• Revenue from sanitary ware & bath fittings grew 11.9% YoY in FY21
• Tile exports revenue grew 54.1% YoY in FY21
Key Metrics FY20 FY21 % Change
Tiles Volume (MSM) 44.8 48.6 8.5%
Revenue (₹ mn) 18,226 18,325 0.5%
EBITDA (₹ mn) 690 1,590 130.5%
EBITDA Margin (%) 3.8% 8.7% +490bps

www.prismjohnson.in 15
HRJ: Business Opportunities Complementary to Domestic Tiles Business; Leveraging Brand & Distribution Network
1,529 1,6181,760
1,970
FY18 FY19 FY20 FY21
Bathroom Segment
Revenue (₹ mn)
1,3471,548 1,558
1,332
FY18 FY19 FY20 FY21
Ardex Endura
Revenue (₹ mn)
464 5301,194
1,840213
774
1,167
1,041
677
1,304
2,361
2,881
FY18 FY19 FY20 FY21
Exports Revenue
Engineering Marbles &Quartz (₹ mn)
Tiles (₹ mn)
Key Products: Sanitaryware , faucets and bath fittings
Strong growth potential; Healthy industry structure; Brand and after sales service play a key role
Channel expansion, secondary demand generations and plumbers connect program to drive demand in the medium term
JV with Ardex, Germany (50% Stake); R&D driven business
Key Products: Tile fixing adhesives, added industrial flooring and grouts
Pan India presence with Plants in Bengaluru, Baroda, Durgapur, Pune, Nellore, Bhiwadi and Allahabad
Solid growth potential as many countries implemented anti-dumping duty for exports from China
Export opportunities to open up especially to USA, Europe and China

www.prismjohnson.in 16
HRJ: Update on Scheme of Arrangement & Amalgamation
•Composite Scheme of Arrangement and Amalgamation amongst Prism Johnson Limited (PJL), H. & R. Johnson (India) TBK Limited, Milano Bathroom Fittings Private Limited, Silica CeramicaPrivate Limited, TBK Rangoli Tile Bath Kitchen Private Limited, TBK Venkataramiah Tile Bath Kitchen Private Limited, TBK Samiyaz Tile Bath Kitchen Private Limited and their respective shareholders and creditors (Scheme)
•All companies involved in the proposed restructuring, directly or through subsidiary, are wholly owned subsidiaries of PJL. No cash consideration was involved & no shares have been issued.
Scheme Details
•Received approval from the Hon’ble National Company Law Tribunal (NCLT), Hyderabad vide its order dated April 28, 2021
•Appointed Date: April 1, 2018; Scheme Effective Date: May 11, 2021Status & Key Dates
•Simplification of group structure under a common management; Elimination of multiple operating companies' structure
•Consolidation of business to lead to better, efficient and economical cost management, pooling & optimum utilization of resources amongst others
Key Benefits
•No change in shareholding pattern of the Company
•This being a common control transaction, it does not have any material impact in the consolidated results of the Company.
•Prior period standalone financials have been restated to give effect to the Scheme from the appointed date.
Other Information

Experience Center and Product Branding
www.prismjohnson.in
Pune Experience Centre Products Range under Germ-free Product Portfolio
17

www.prismjohnson.in 18
Ready Mix Concrete Division

www.prismjohnson.in
19
RMC (India) Division
Pan India presence with
96 plants in 44 locations
Second largest player in the RMC sector
Backward integration: Six quarries
(aggregates & manufactured sand plants)
Three technical labs that are
NABL accredited
Strong ROCE potential given low
capex needs and high asset
turnover
Strong revenue growth
potential in the long term
RMC Plant
Transit Mixer

RMC (India): Special Products
www.prismjohnson.in 20
Dyecrete® comprises an eye catching array of concrete that are suitable for a wide variety of architectural and decorative applications
Elitecrete™ is a light weight concrete with densities varying from 800 to 1800 kg/m3
Repaircrete™ is a ready to use wet micro concrete (M40 & M60) for structural strengthening & retrofitting. It eases concreting in areas with limited accessibility.
FRCcrete® is fibre reinforced concrete, which increases its structural integrity; used in heavy traffic wearing surfaces such as warehouses, container yards, railway platforms, industrial floors, etc.
Perviouscrete™ is rain water harvesting concrete; it permits rain and storm water run offs to percolate through it, rather than flood surrounding areas or storm water drains
www.prismjohnson.in

RMC (India): Revenue Improvement QoQ; Strong Margin Recovery Led by Tight Cost Controls
www.prismjohnson.in 21
3,7043,457 3,442 3,535
729
2,113
2,9203,316
Q1 Q2 Q3 Q4
Revenue (₹ mn)
FY20 FY21
9045 75
20
(500)
5092
198
Q1 Q2 Q3 Q4
EBITDA (₹ mn)
FY20 FY21
•Revenue improvement quarter on quarter led by part recovery of construction activities in metro and tier 1 cities
• Cost rationalisation initiatives led to strong EBITDA growth despite decline in revenues; Q4 FY21 EBITDA margin expanded 540 bps YoY to 6.0% in Q4 FY21
• Focus on improving plant utilization levels, increasing sales of value added products and IHB segment
Key Metrics FY20 FY21 % Change
Revenue (₹ mn) 14,139 9,079 (35.8%)
EBITDA (₹ mn) 229 (169) n/m
EBITDA Margin (%) 1.6% (1.9%)
www.prismjohnson.in

www.prismjohnson.in 22
Insurance

www.prismjohnson.in
23
Products launched during Q4 FY21 include Group Premier Personal Accident Insurance and Saral Suraksha Bima - RahejaQBE General Insurance (Standard Personal Accident Insurance)
RQBE added 213 partners during Q4 FY21 taking the count of total partners to 2,690, including Agents, Brokers, POSP,IMF, MISP and Web Aggregators.
Q4 FY21 Financial Highlights:
Gross Written Premium: ₹1,036.4 mn, growth of 57% over Q4 FY20
Profit / (Loss) Before Tax: ₹(269.8) mn as compared to ₹(268.5) mn in Q4 FY20
FY21 Financial Highlights:
Gross Written Premium: ₹2,961.6 mn, growth of 65% over FY20
Profit / (Loss) After Tax: ₹ (838.1) mn as compared to ₹ (621.1) mn in FY20
Combined Ratio stands at 149% (vs. 152% in FY20)
Capital infusion of ₹1.5 bn in FY21 (including share premium)
Well capitalized with solvency ratio of 3.66x against regulatory minimum of 1.50x
AUM of ₹6.95 bn as on March 31, 2021
Sale of RQBE: Awaiting regulatory approvals
Raheja QBE General Insurance (RQBE)

www.prismjohnson.in 24
ESG Initiatives & Awards

www.prismjohnson.in25
Management Driving Several ESG & CSR Initiatives Continuous Efforts for Improved Sustainability
Energy Efficiency• 22.4MW of WHRS commissioned during FY21 (Includes the 12.4MW commissioned in March 2021)• 10.0MW solar power commissioned during FY21 (taking the total solar power installed at Satna to 22.5MW)
Water Conservation • New Phytoridal Water Treatment constructed at Satna, Madhya Pradesh• Pond de-silting and bore shaft in Malgaon and Sharman Dongari Pond at Satna, Madhya Pradesh• Embankment of river near Jabla Baba at Satna, Madhya Pradesh
Social Engagement • Skill Development – Provided livelihood trainings (stitching, bag making, agarbatti & cotton wick making) to
persons in association with NRLM Rampur Baghelan• Sports & Education – Renovation of a Government School at Mankahari, Hinauta and Bamhauri;
enhancement of basic sports facilities at Mankahari• Health & Hygiene – Medical treatment and medicines distributed to patients, Sponsored cataract surgeries,
ambulance facility provided to villagers
Prism Johnson is committed towards achievement and maintenance of highest standards of Environment, Health and Safety issues at all its plants and offices.

26
Waste Heat Recovery System (WHRS) Site: Commissioned 12.4 MW in Q4FY21 (Total 22.4 Commissioned During FY21)
AQC-1 Boiler
Steam Turbine Generator Control Room

27
CSR Initiatives During Q4 FY21
Sponsored Cataract Surgeries Distributed Nutritious Food
De-silting & bore shaft at Malgaon Pond Embankment of River

www.prismjohnson.in28
Awards & Recognitions
Prism Cement (Satna Plant) received an award for outstanding achievements in Safety Excellence
Prism Cement (Satna Plant) was declared a winner of the Gold Award in cement sector for Outstanding Achievement in Occupational Health & Safety Management
www.prismjohnson.in 29
Consolidated Financial Highlights

Consolidated Financials (Ex RQBE):EBITDA Growth Led by Sustainable Cost Rationalization Initiatives
www.prismjohnson.in 30
6,6
63
4,2
39
3,5
35
14
,43
7
6,1
96
5,4
23
2,9
20
14
,53
9
8,2
76
6,1
42
3,3
16
17
,73
5
Cement HRJ RMC Consolidated
Consolidated Revenue Ex RQBE (₹ mn)
Q4 FY20 Q3 FY21 Q4 FY21
1,5
30
57
20
1,6
07
1,3
03
76
9
92
2,1
63
1,6
64
77
2
19
8
2,6
33
Cement HRJ RMC Consolidated
Consolidated EBITDA Ex RQBE (₹ mn)
Q4 FY20 Q3 FY21 Q4 FY21
₹ mn FY20 FY21 % Change
Revenue 58,205 53,261 (8.5%)
- Cement 25,840 25,857 0.1%
- HRJ 18,226 18,325 0.5%
- RMC 14,139 9,079 (35.8%)
EBITDA 6,008 7,023 16.9%
- Cement 5,089 5,602 10.1%
- HRJ 690 1,590 130.5%
- RMC 229 (169) (173.7%)
EBITDA Margin 10.3% 13.2%
- Cement 19.7% 21.7%
- HRJ 3.8% 8.7%
- RMC 1.6% (1.9%)

31
4347
40
43 44 41
45 47
63
4044
18
FY19 FY20 FY21
Working Capital Days
Inventory Debtors Creditors Working Capital
Note: ROCE calculation is based on EBIT including other income
15.5%13.2%
18.2%
FY19 FY20 FY21
ROCE %
www.prismjohnson.in
EBITDA Margin Improvement & Efficient Working Capital Management led to ROCE Expansion
Consolidated (Ex RQBE) Financial Summary: Significant ROCE Expansion
Prior period financials have been restated to give effect to the Composite Scheme of Arrangement and Amalgamation from the appointed date. Please refer to Slide 16 for more details.

Strengthening Balance Sheet: Continued Focus to Reduce Net Debt
www.prismjohnson.in 32
Significant reduction in Consolidated Net Debt (Ex-RQBE) during FY21 in line with the past five years trend
Improvement in Net Debt / Equity led by efficient working capital management and better operational performance
Consolidated Net Debt (Ex-RQBE) to EBITDA declined to 1.8x
20,87719,081 19,527
18,562 18,642
12,343
2.1 1.9 1.9 1.6 1.70.9
6.45.4
4.4
3.0 3.1
1.8
-1.00.01.02.03.04.05.06.07.08.09.0
3,0005,0007,0009,000
11,00013,00015,00017,00019,00021,000
FY16 FY17 FY18 FY19 FY20 FY21
Consolidated Net Debt Ex RQBE (₹ mn)
Consolidated Net Debt Consolidated Net Debt / Equity
Consolidated Net Debt / EBITDA
7,661
5,866
1,795
OriginalRepaymentObligation
Repaid /Prepaid /
Refinanced
RepaymentObligation ason March 31,
2021
Repayment Obligations (₹ mn)
FY22
Prior period financials have been restated to give effect to the Composite Scheme of Arrangement and Amalgamation from the appointed date. Please refer to Slide 16 for more details.

Capacity Expansion Plan & Capex Outlook
www.prismjohnson.in 33
• Debottlenecking at Satna, Madhya Pradesh to increase cement production capacity by 0.9 mn tons by June 2022 for total capex of around ₹1.39 bn
• Further plan to increase Grinding Capacity at Satna, Madhya Pradesh by approx. 1.0 mn tons by September 2023 for total capex of around ₹2.50 bn
• Cement production capacity to increase to 7.5 mn tons post this expansion
Prism Cement:
Cement Capacity
• Greenfield tile capacity expansion of 2.5 mn m2 at Panhagarh, West Bengal by January 2023 for incremental capex of ₹550 mn
• Tile capacity expansion of 6.0 mn m2 at JV entities by March 2023 for an estimated capex of ₹700 mn
• Tile production capacity to increase to 68 mn m2 post this expansion
HRJ:
Tile Production Capacity
• FY22E capex for standalone entity likely to be around ₹4.0-5.0 bn; primarily to be met through internal accruals FY22E Capex Outlook

www.prismjohnson.in 34
Standalone Financial Highlights

Standalone Financial Summary: Strong Margin Expansion & Profit Growth in FY21, Despite Impact of COVID-19
www.prismjohnson.in 35
Particulars (₹ mn) Q4 FY20 Q3 FY21 Q4 FY21 % QoQ % YoY FY20 FY21 % YoY
Revenue from Operations* 13,720 13,755 16,890 22.8% 23.1% 55,786 50,352 (9.7%)
- Cement 6,663 6,196 8,276 33.6% 24.2% 25,840 25,857 0.1%
- HRJ 3,669 4,741 5,395 13.8% 47.1% 16,341 15,731 (3.7%)
- RMC 3,535 2,920 3,316 13.6% (6.2%) 14,139 9,079 (35.8%)
- Inter segment revenue (146) (103) (98) (4.4%) (33.1%) (534) (316) (40.9%)
EBITDA (Pre-Exceptional) 1,431 1,857 2,402 29.4% 67.9% 5,194 6,161 18.6%
EBITDA Margin % 10.4% 13.5% 14.2% 9.3% 12.2%
Depreciation & Amortisation 612 549 754 37.4% 23.1% 2,138 2,526 18.1%
Other Income 74 66 122 84.0% 63.7% 270 362 34.1%
EBIT (Pre-Exceptional) 893 1,374 1,769 28.8% 98.2% 3,326 3,997 20.2%
Finance Cost 560 453 439 (3.1%) (21.6%) 2,290 1,912 (16.5%)
Exceptional Items 103 120 (253) n/m n/m 103 48 (53.7%)
Current + Deferred Tax 323 188 (149) n/m n/m 680 38 (94.4%)
Net Profit (93) 614 1,733 182.5% n/m 253 2,000 691.6%
Net Profit Margin % (0.7%) 4.5% 10.3% 0.5% 4.0%
Net Debt 16,745 12,926 10,399 (19.5%) (37.9%) 16,745 10,399 (37.9%)Prior period financials have been restated to give effect to the Composite Scheme of Arrangement and Amalgamation from the appointed date. Please refer to Slide 16 for more details.

www.prismjohnson.in 36
Management & Board Structure

37
Management Profile: Experienced Management (1/2)
www.prismjohnson.in
Mr. Vijay Aggarwal
Managing Director
Educational Background: B. Tech (Elec.) from IIT, Delhi and PGDM from IIM, Ahmedabad
Tenure in Company: ~23 years
Past work experience: SBI Capital Markets
Other Board Memberships include: Exide Life Insurance Co, Aptech, Ardex Endura (India), Raheja QBE General Insurance Co.

38
www.prismjohnson.in
Mr. Vivek K. Agnihotri Executive Director & CEO - Cement
• MBA from FMS, University of Delhi
• Tenure in Company: Nearly six years
• Past experience includes Ambuja Cements and ACC
Mr. Sarat ChandakExecutive Director & CEO - HRJ
• B.SC (Hons), and MBA from University of Pune
• Tenure in Company: Over two years
• Past experience includes Kajaria Ceramics and RAK Ceramics
Mr. Atul DesaiExecutive Director & CEO – RMC
• B.E. (Chemical) from Gujarat University and MBA (Marketing) from South Gujarat University
• Tenure in Company: Nearly five years
• Past experience includes Reliance Cement, AmbujaCement and GSFC
Mrs. Aneeta KulkarniCompany Secretary
• Company Secretary, LLB, PGDAM (NMIMS) and FIII (Fellow of Insurance Institute of India)
• Tenure in Company: Over 25 years
• Past experience includes New India Assurance, Thirumalai Chemicals and Vijayshree Chemicals
Mr. Manish Bhatia Chief Financial Officer
• Chartered Accountant
• Tenure in Company: Nearly four years
• Past experience includes Apollo Tyres and Essar Steel
Mr. Rajnish SachetiGroup President Legal & Indirect Taxes
• Company Secretary
• Tenure in Company: Over 23 years
• Past experience includes Grasim Industries
Management Profile: Experienced Management (2/2)

www.prismjohnson.in 39
Market Data
Market Information
www.prismjohnson.in 40
144.10
0
300
600
900
1,200
1,500
0
30
60
90
120
150
Ap
r20
May
20
Jun
20
Jul2
0
Au
g20
Sep
20
Oct
20
No
v20
Dec
20
Jan
21
Feb
21
Mar
21
Ap
r21
May
21
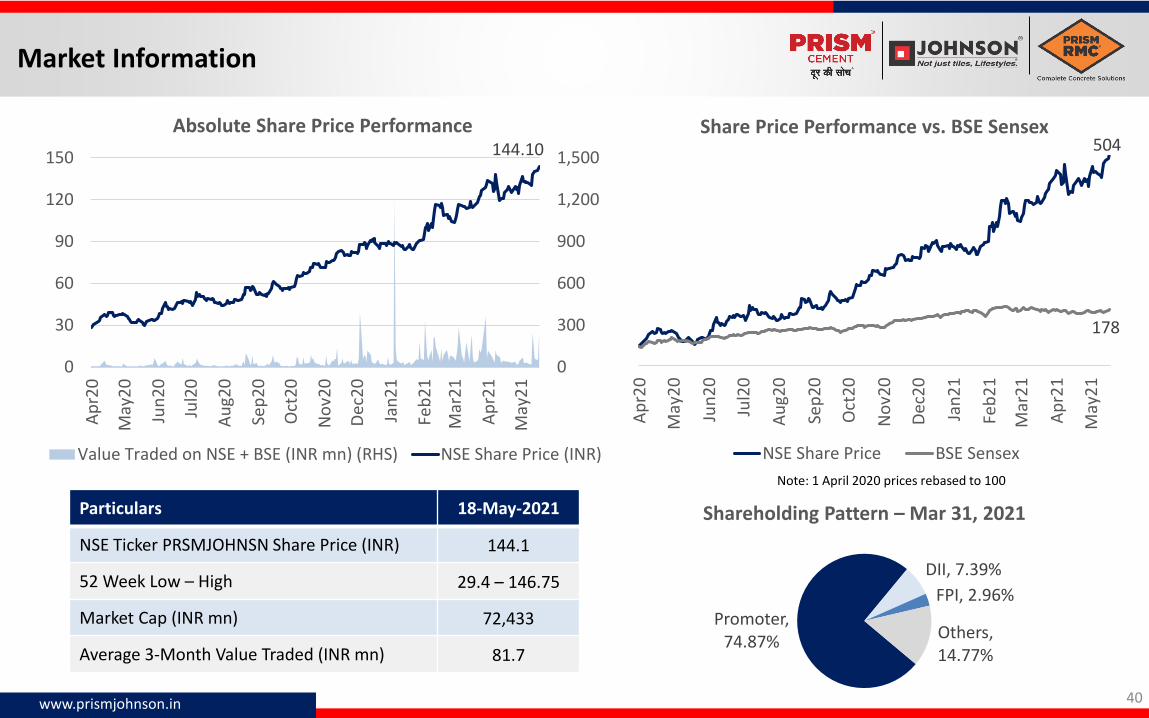
Absolute Share Price Performance
Value Traded on NSE + BSE (INR mn) (RHS) NSE Share Price (INR)
Note: 1 April 2020 prices rebased to 100
Particulars 18-May-2021
NSE Ticker PRSMJOHNSN Share Price (INR) 144.1
52 Week Low – High 29.4 – 146.75
Market Cap (INR mn) 72,433
Average 3-Month Value Traded (INR mn) 81.7
Promoter, 74.87%
DII, 7.39%
FPI, 2.96%
Others, 14.77%
Shareholding Pattern – Mar 31, 2021
504
178
Ap
r20
May
20
Jun
20
Jul2
0
Au
g20
Sep
20
Oct
20
No
v20
Dec
20
Jan
21
Feb
21
Mar
21
Ap
r21
May
21
Share Price Performance vs. BSE Sensex
NSE Share Price BSE Sensex

About PRISM JOHNSON LIMITED
www.prismjohnson.in 41
PRISM JOHNSON LIMITED is one of India’s leading integrated Building Materials’ Company, with a wide range of products from cement, ready-mixed concrete, tiles and bathroom products.
Prism CementPrism Cement manufactures Cement with the brand name 'Champion' and premium quality grade of cement under ‘ChampionPlus’ and ‘DURATECH’ brand. It caters mainly to markets of Eastern UP, MP and Bihar, with an average lead distance of 384 kmsin FY21 for cement from its plant at Satna, MP. Prism Cement has a wide distribution network of around 4,000 dealers servicedfrom ~160 stock points.
H & R Johnson (India)Established in 1958, H & R Johnson (India) is the pioneer of ceramic tiles in India. HRJ offers end-to-end solutions of Tiles,Sanitaryware, Bath Fittings and Engineered Marble & Quartz. All the products are sold under 4 strong brands, viz. Johnson,Johnson Marbonite, Johnson Porselano and Johnson Endura. In ceramic / vitrified tiles, HRJ along with its Joint Ventures andsubsidiaries has a capacity of 60 million m2 per annum spread across 11 manufacturing plants across the country which is oneof the largest in India.
RMC (India)RMC (India) is one of India’s leading ready-mixed concrete manufacturers. RMC currently operates 96 ready-mixed concreteplants in 44 cities/towns across the country. RMC has ventured into the Aggregates business and operates large quarries andcrushers. At present, RMC has 6 quarries across the country. RMC has been at the forefront in setting high standards for plantand machinery, production, safety standards, quality systems and product services in the ready-mixed concrete industry.

About PRISM JOHNSON LIMITED
www.prismjohnson.in 42
PRISM JOHNSON LIMITED is committed to creating long-term sustainable shareholder value through successfulimplementation of its growth plans. The company’s investor relations mission is to maintain an ongoing awareness of itsperformance among shareholders and financial community.
For additional information, please contact:
Nupur AgarwalTel: +91-96194-79812 | +91-22-6675 4142-46Email: [email protected]: www.prismjohnson.in
Address:“Rahejas”, Main Avenue, V. P. Road,Santacruz (W), Mumbai—400 054
Safe HarborCertain statements in this release concerning our future growth prospects are forward-looking statements which involve a number of risks and uncertainties that could cause actual results to differ materially from those in such forward-looking statements. The company does not undertake to update any forward-looking statement that may be made from time to time by or on behalf of the company.