investor presentation - hiltonir.hiltonworldwide.com/.../investor-presentation-june-2016.pdf ·...
TRANSCRIPT

INVESTOR PRESENTATION JUNE 2016
© 2016 Hilton Worldwide Confidential and Proprietary
Disclaimer
This presentation contains forward-looking statements within the meaning of Section 27A of the Securities Act of 1933, as amended, and Section 21E of the Securities
Exchange Act of 1934, as amended. These statements include, but are not limited to, statements related to our expectations regarding the performance of our
business, our financial results, our liquidity and capital resources, the proposed spin-offs and other non-historical statements. You can identify these forward-looking
statements by the use of words such as “outlook,” “believes,” “expects,” “potential,” “continues,” “may,” “will,” “should,” “could,” “seeks,” “approximately,” “projects,”
“predicts,” “intends,” “plans,” “estimates,” “anticipates” or the negative version of these words or other comparable words. Such forward-looking statements are subject
to various risks and uncertainties, including, among others, risks inherent to the hospitality, lodging real estate and timeshare industries, risks related to financing
transactions expected to be consummated in connection with the spin-offs, macroeconomic factors beyond our control, competition for hotel guests, management and
franchise agreements and timeshare sales, risks related to doing business with third-party hotel owners, our significant investments in owned and leased real estate,
performance of our information technology systems, growth of reservation channels outside of our system, risks of doing business outside of the United States and
our indebtedness, as well as those described under the section entitled “Risk Factors” in Hilton Worldwide Holdings Inc.’s Annual Report on Form 10-K for the year
ended December 31, 2015, as such factors may be updated from time to time in our periodic filings with the SEC, which are accessible on the SEC’s website at
www.sec.gov. Accordingly, there are or will be important factors that could cause actual outcomes or results to differ materially from those indicated in these
statements. These factors should not be construed as exhaustive and should be read in conjunction with the other cautionary statements that are included in this
presentation and in our filings with the SEC. We undertake no obligation to publicly update or review any forward-looking statement, whether as a result of new
information, future developments or otherwise, except as required by law.
This presentation includes certain non-GAAP financial measures, including Adjusted earnings before interest expense, taxes, depreciation and amortization (“Adj.
EBITDA”), Adj. EBITDA Margin, Net Debt and Net Debt / Adj. EBITDA. Non-GAAP financial measures Adj. EBITDA, Adj. EBITDA Margin, Net Debt and Net Debt /
Adj. EBITDA should be considered only as supplemental to, and not as superior to, financial measures prepared in accordance with U.S. GAAP. Please refer to the
Appendix and footnotes of this presentation for a reconciliation of the historial non-GAAP financial measures included in this presentation to the most directly
comparable financial measures prepared in accordance with U.S. GAAP. In addition, this presentation includes projected Pro Forma Adjusted EBITDA and Pro Forma
net leverage ratio information as of and for the year ending December 31, 2016 for each of Hilton, the Planned Lodging REIT and Hilton Grand Vacations.
Reconciliations of projected Pro Forma Adjusted EBITDA and Pro Forma net leverage ratio to measures calculated in accordance with GAAP are not available without
unreasonable effort due to the unavailability of certain information needed to calculate certain reconciling items, including interest expense and income tax expense.
Slides in this presentation include certain Adj. EBITDA amounts that are used only for illustrative purposes to present illustrative Adj. EBITDA amounts by applying
assumptions to existing room pipeline and timeshare interval inventory, average homeowners’ association (“HOA”) management, resort operations and other fees,
increases of in-place rates and increases in RevPAR, as applicable, in each case based on twelve months ended (“LTM”) 3/31/2016 information. These amounts do
not represent projections of future results and may not be realized. Value information on such slides that is derived from such illustrative Adj. EBITDA amounts is
indicative only, based upon a number of assumptions, and does not reflect actual valuation. Please review carefully the detailed footnotes in this presentation.
We have disclosed more details about the proposed spin-offs in registration statements with the SEC, as they may be amended from time to time, including financial
and other details. The transactions are subject to a number of conditions, including, among others, the declaration of effectiveness of the Form 10 Registration
Statements filed with the SEC, and other customary matters. The spin-offs are expected to be completed by year-end but there can be no assurance regarding the
ultimate timing of the spin-offs or that either or both of the spin-offs will ultimately occur.
1 2
© 2016 Hilton Worldwide Confidential and Proprietary
Luxury
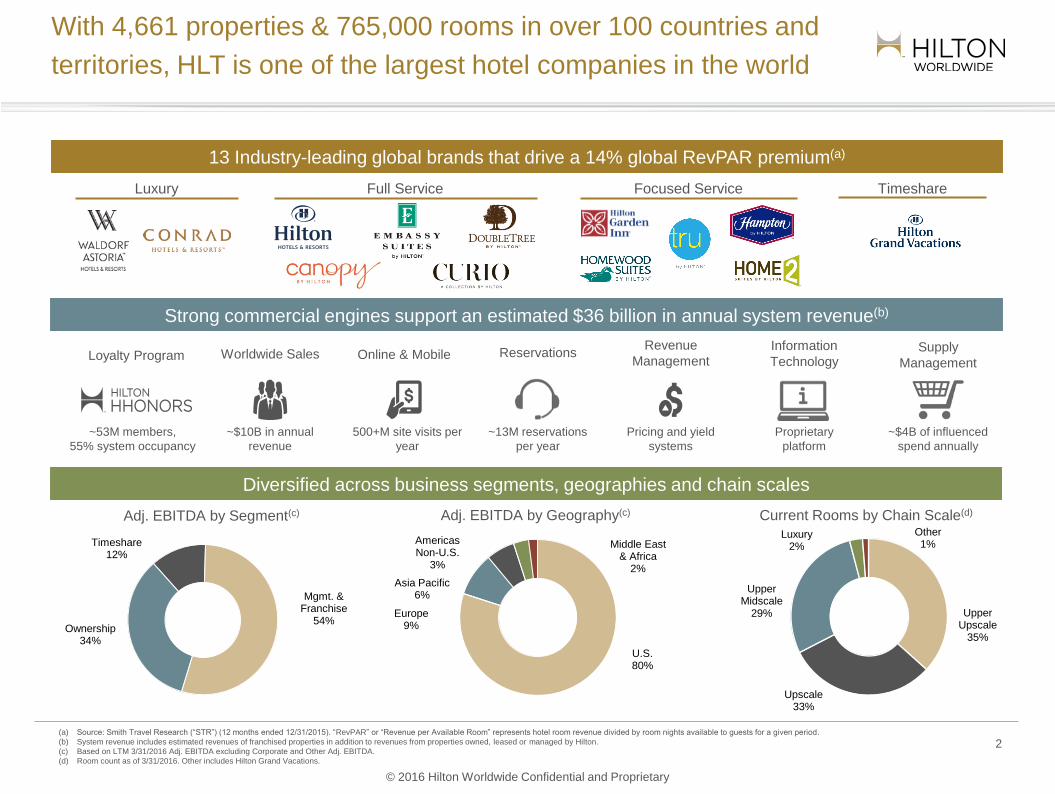
13 Industry-leading global brands that drive a 14% global RevPAR premium(a)
Full Service TimeshareFocused Service
~53M members,
55% system occupancy
Loyalty Program Online & Mobile
500+M site visits per
year
Revenue
Management
Pricing and yield
systems
Worldwide Sales
~$10B in annual
revenue
Reservations
~13M reservations
per year
Supply
Management
~$4B of influenced
spend annually
Information
Technology
Proprietary
platform
With 4,661 properties & 765,000 rooms in over 100 countries and
territories, HLT is one of the largest hotel companies in the world
(a) Source: Smith Travel Research (“STR”) (12 months ended 12/31/2015). “RevPAR” or “Revenue per Available Room” represents hotel room revenue divided by room nights available to guests for a given period.
(b) System revenue includes estimated revenues of franchised properties in addition to revenues from properties owned, leased or managed by Hilton.
(c) Based on LTM 3/31/2016 Adj. EBITDA excluding Corporate and Other Adj. EBITDA.
(d) Room count as of 3/31/2016. Other includes Hilton Grand Vacations.
2
Timeshare12%
Mgmt. & Franchise
54%Ownership
34%
Adj. EBITDA by Segment(c) Adj. EBITDA by Geography(c) Current Rooms by Chain Scale(d)
U.S.80%
Europe9%
Asia Pacific6%
Americas Non-U.S.
3%
Middle East & Africa
2%
Upper Upscale
35%
Upscale 33%
Upper Midscale
29%
Luxury 2%
Other 1%
Strong commercial engines support an estimated $36 billion in annual system revenue(b)
Diversified across business segments, geographies and chain scales
© 2016 Hilton Worldwide Confidential and Proprietary
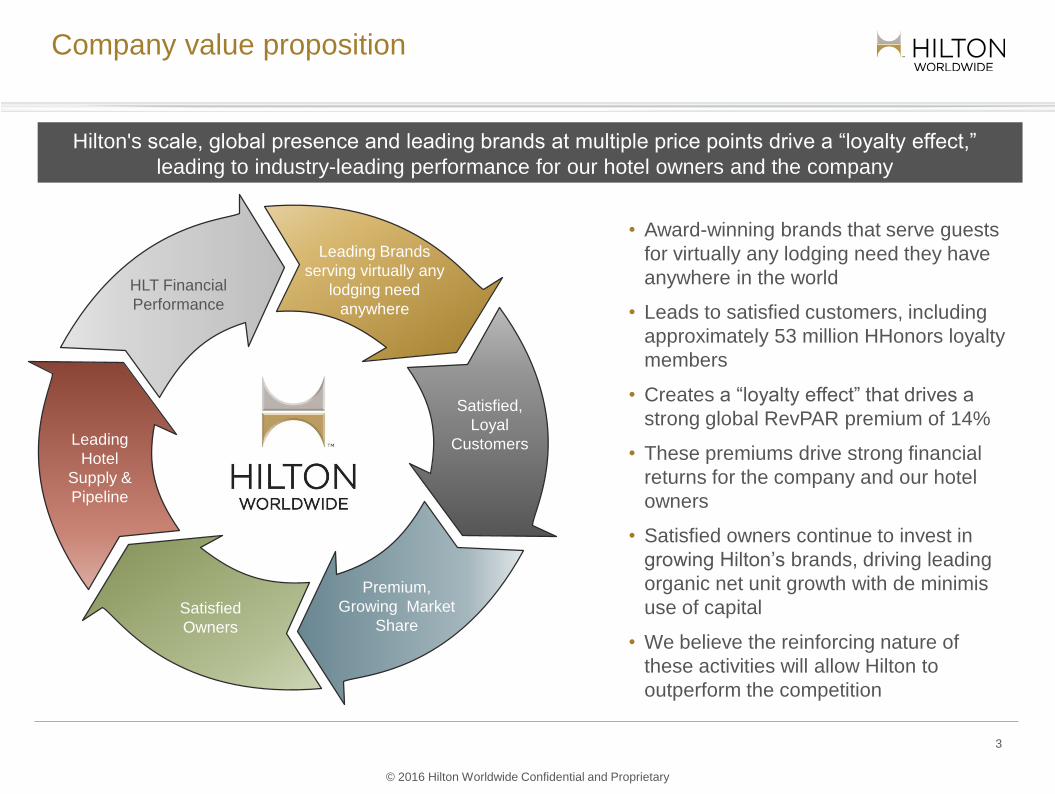
Company value proposition
Leading Brands
serving virtually any
lodging need
anywhere
Satisfied,
Loyal
Customers
Premium,
Growing Market
ShareSatisfied
Owners
Leading
Hotel
Supply &
Pipeline
HLT Financial
Performance
Hilton's scale, global presence and leading brands at multiple price points drive a “loyalty effect,”
leading to industry-leading performance for our hotel owners and the company
• Award-winning brands that serve guests
for virtually any lodging need they have
anywhere in the world
• Leads to satisfied customers, including
approximately 53 million HHonors loyalty
members
• Creates a “loyalty effect” that drives a
strong global RevPAR premium of 14%
• These premiums drive strong financial
returns for the company and our hotel
owners
• Satisfied owners continue to invest in
growing Hilton’s brands, driving leading
organic net unit growth with de minimis
use of capital
• We believe the reinforcing nature of
these activities will allow Hilton to
outperform the competition
3
© 2016 Hilton Worldwide Confidential and Proprietary
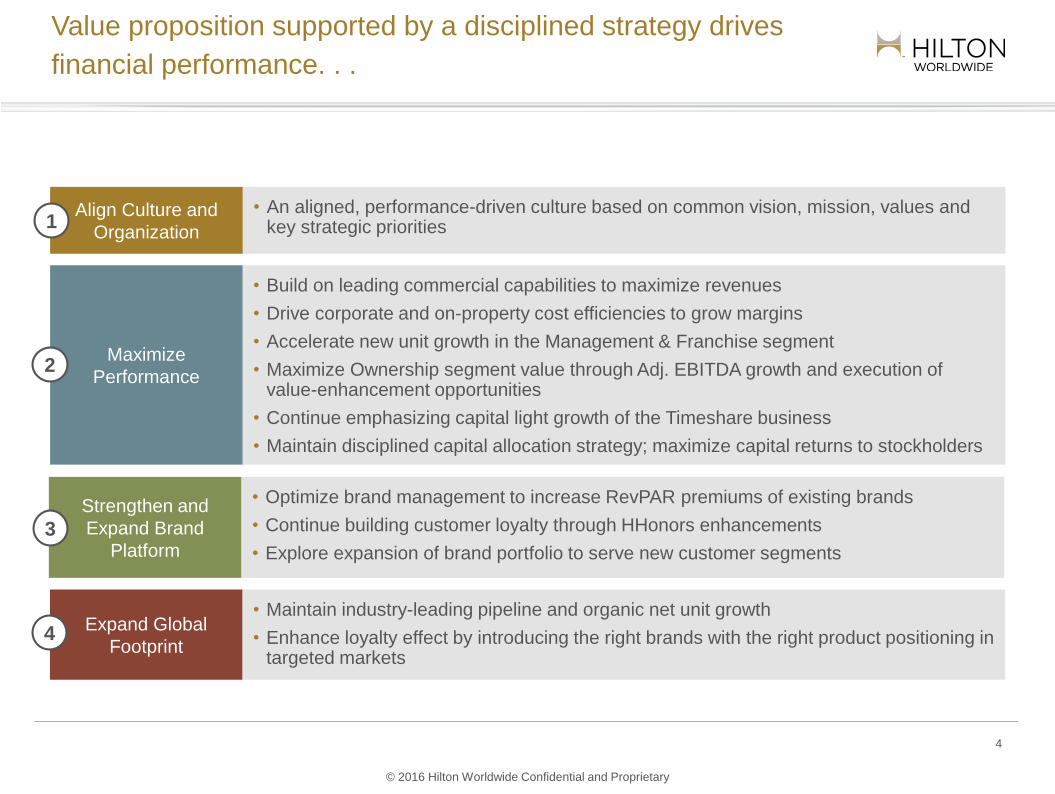
Value proposition supported by a disciplined strategy drives
financial performance. . .
Align Culture and
Organization
• An aligned, performance-driven culture based on common vision, mission, values and key strategic priorities
Maximize
Performance
• Build on leading commercial capabilities to maximize revenues
• Drive corporate and on-property cost efficiencies to grow margins
• Accelerate new unit growth in the Management & Franchise segment
• Maximize Ownership segment value through Adj. EBITDA growth and execution of value-enhancement opportunities
• Continue emphasizing capital light growth of the Timeshare business
• Maintain disciplined capital allocation strategy; maximize capital returns to stockholders
Expand Global
Footprint
• Maintain industry-leading pipeline and organic net unit growth
• Enhance loyalty effect by introducing the right brands with the right product positioning in targeted markets
1
2
4
Strengthen and
Expand Brand
Platform3
• Optimize brand management to increase RevPAR premiums of existing brands
• Continue building customer loyalty through HHonors enhancements
• Explore expansion of brand portfolio to serve new customer segments
4
© 2016 Hilton Worldwide Confidential and Proprietary
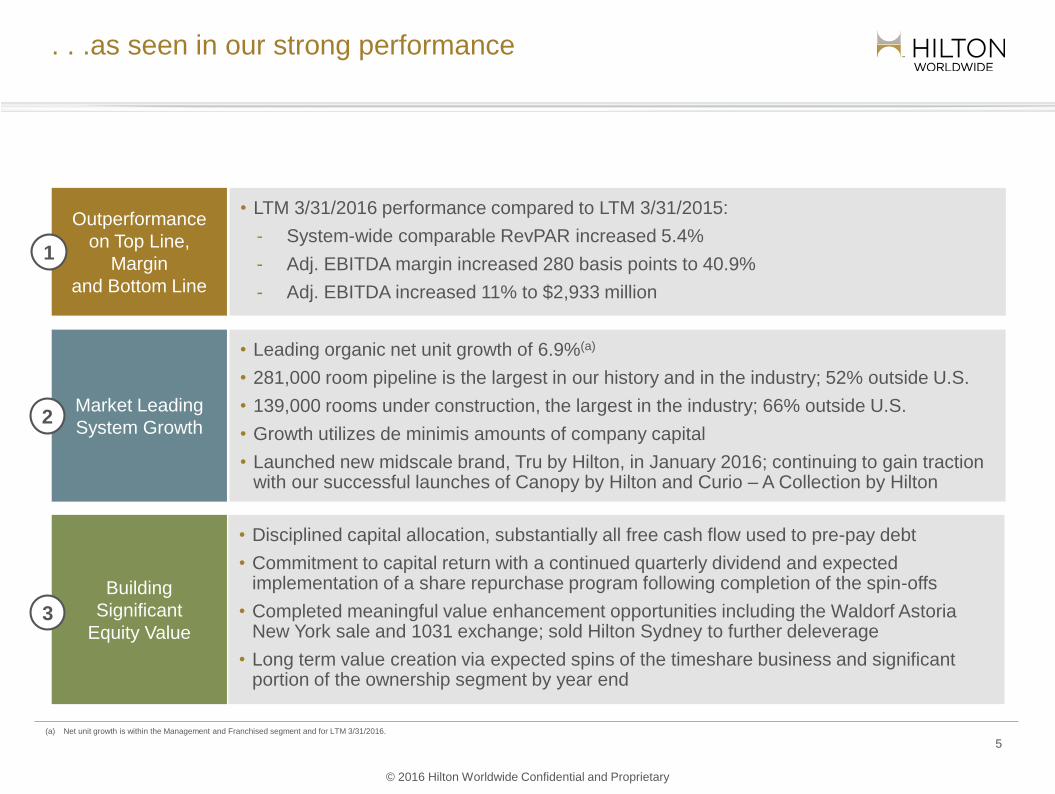
. . .as seen in our strong performance
Outperformance
on Top Line,
Margin
and Bottom Line
• LTM 3/31/2016 performance compared to LTM 3/31/2015:
- System-wide comparable RevPAR increased 5.4%
- Adj. EBITDA margin increased 280 basis points to 40.9%
- Adj. EBITDA increased 11% to $2,933 million
Market Leading
System Growth
• Leading organic net unit growth of 6.9%(a)
• 281,000 room pipeline is the largest in our history and in the industry; 52% outside U.S.
• 139,000 rooms under construction, the largest in the industry; 66% outside U.S.
• Growth utilizes de minimis amounts of company capital
• Launched new midscale brand, Tru by Hilton, in January 2016; continuing to gain traction with our successful launches of Canopy by Hilton and Curio – A Collection by Hilton
1
2
Building
Significant
Equity Value3
• Disciplined capital allocation, substantially all free cash flow used to pre-pay debt
• Commitment to capital return with a continued quarterly dividend and expected implementation of a share repurchase program following completion of the spin-offs
• Completed meaningful value enhancement opportunities including the Waldorf Astoria New York sale and 1031 exchange; sold Hilton Sydney to further deleverage
• Long term value creation via expected spins of the timeshare business and significant portion of the ownership segment by year end
5 6(a) Net unit growth is within the Management and Franchised segment and for LTM 3/31/2016.
© 2016 Hilton Worldwide Confidential and Proprietary
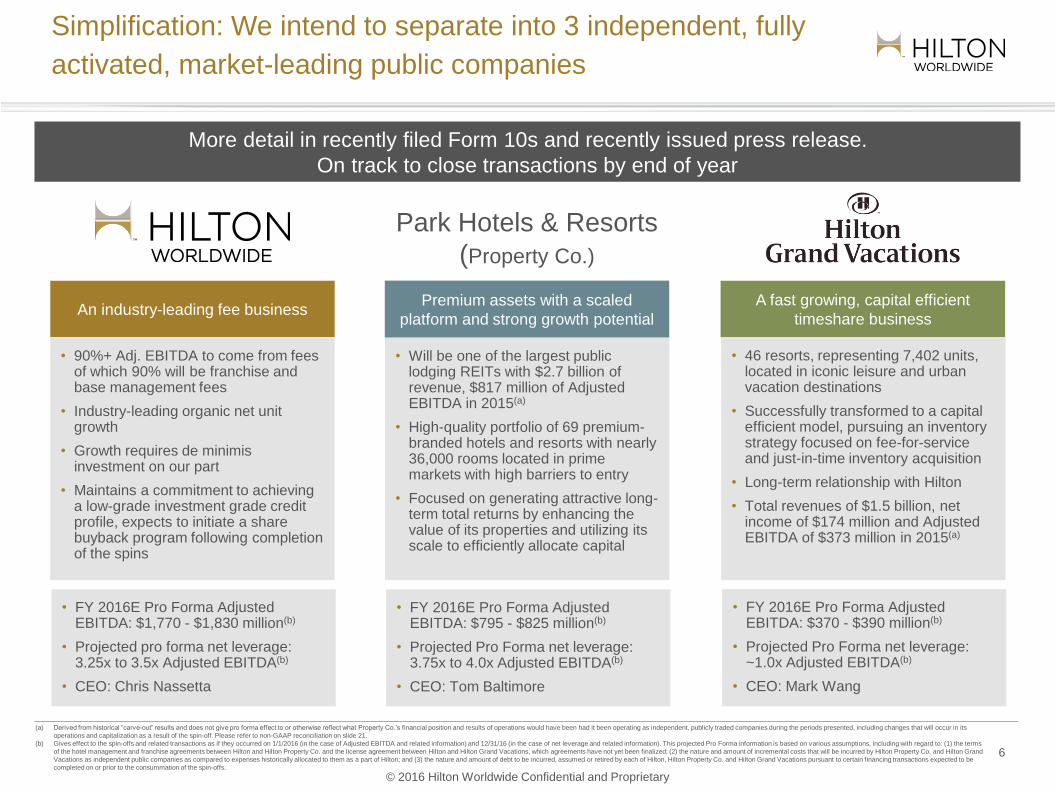
Simplification: We intend to separate into 3 independent, fully
activated, market-leading public companies
• 90%+ Adj. EBITDA to come from fees of which 90% will be franchise and base management fees
• Industry-leading organic net unit growth
• Growth requires de minimis investment on our part
• Maintains a commitment to achieving a low-grade investment grade credit profile, expects to initiate a share buyback program following completion of the spins
• Will be one of the largest public lodging REITs with $2.7 billion of revenue, $817 million of Adjusted EBITDA in 2015(a)
• High-quality portfolio of 69 premium-branded hotels and resorts with nearly 36,000 rooms located in prime markets with high barriers to entry
• Focused on generating attractive long-term total returns by enhancing the value of its properties and utilizing its scale to efficiently allocate capital
• 46 resorts, representing 7,402 units, located in iconic leisure and urban vacation destinations
• Successfully transformed to a capital efficient model, pursuing an inventory strategy focused on fee-for-service and just-in-time inventory acquisition
• Long-term relationship with Hilton
• Total revenues of $1.5 billion, net income of $174 million and Adjusted EBITDA of $373 million in 2015(a)
66(a) Derived from historical “carve-out” results and does not give pro forma effect to or otherwise reflect what Property Co.’s financial position and results of operations would have been had it been operating as independent, publicly traded companies during the periods presented, including changes that will occur in its
operations and capitalization as a result of the spin-off. Please refer to non-GAAP reconciliation on slide 21.
(b) Gives effect to the spin-offs and related transactions as if they occurred on 1/1/2016 (in the case of Adjusted EBITDA and related information) and 12/31/16 (in the case of net leverage and related information). This projected Pro Forma information is based on various assumptions, including with regard to: (1) the terms
of the hotel management and franchise agreements between Hilton and Hilton Property Co. and the license agreement between Hilton and Hilton Grand Vacations, which agreements have not yet been finalized; (2) the nature and amount of incremental costs that will be incurred by Hilton Property Co. and Hilton Grand
Vacations as independent public companies as compared to expenses historically allocated to them as a part of Hilton; and (3) the nature and amount of debt to be incurred, assumed or retired by each of Hilton, Hilton Property Co. and Hilton Grand Vacations pursuant to certain financing transactions expected to be
completed on or prior to the consummation of the spin-offs.
An industry-leading fee businessPremium assets with a scaled
platform and strong growth potential
A fast growing, capital efficient
timeshare business
More detail in recently filed Form 10s and recently issued press release.
On track to close transactions by end of year
Park Hotels & Resorts
(Property Co.)
• FY 2016E Pro Forma Adjusted EBITDA: $1,770 - $1,830 million(b)
• Projected pro forma net leverage: 3.25x to 3.5x Adjusted EBITDA(b)
• CEO: Chris Nassetta
• FY 2016E Pro Forma Adjusted EBITDA: $795 - $825 million(b)
• Projected Pro Forma net leverage: 3.75x to 4.0x Adjusted EBITDA(b)
• CEO: Tom Baltimore
• FY 2016E Pro Forma Adjusted EBITDA: $370 - $390 million(b)
• Projected Pro Forma net leverage: ~1.0x Adjusted EBITDA(b)
• CEO: Mark Wang
© 2016 Hilton Worldwide Confidential and Proprietary
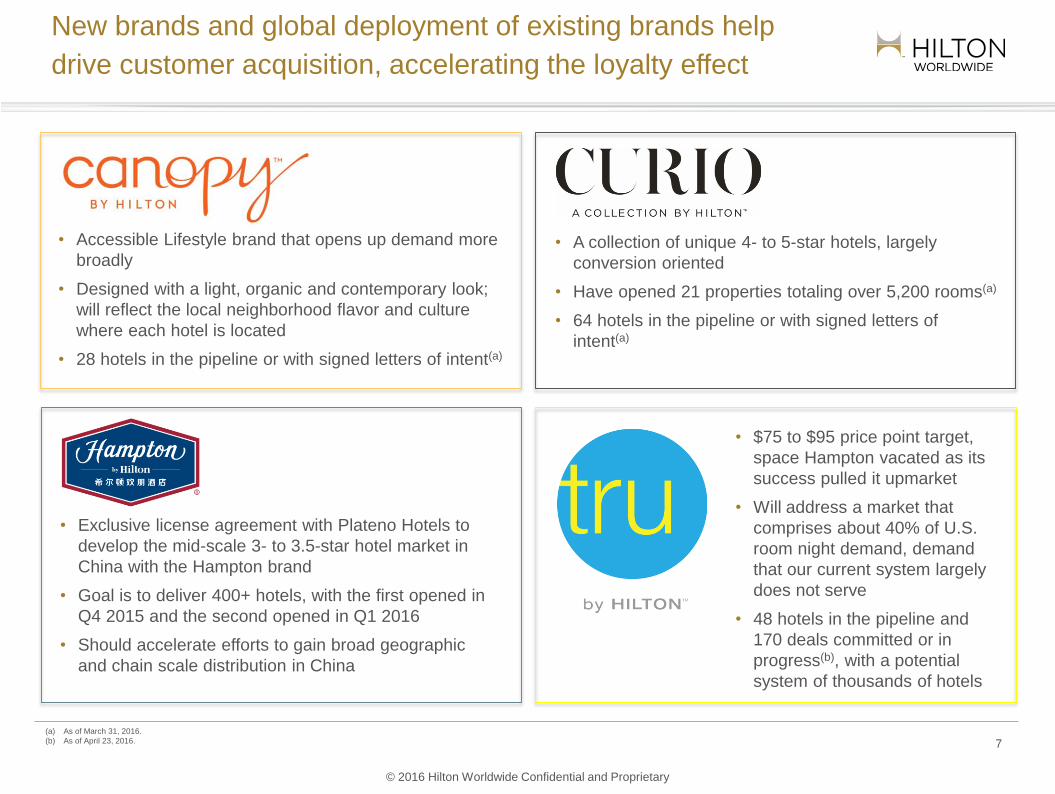
New brands and global deployment of existing brands help
drive customer acquisition, accelerating the loyalty effect
• A collection of unique 4- to 5-star hotels, largely
conversion oriented
• Have opened 21 properties totaling over 5,200 rooms(a)
• 64 hotels in the pipeline or with signed letters of
intent(a)
• Exclusive license agreement with Plateno Hotels to
develop the mid-scale 3- to 3.5-star hotel market in
China with the Hampton brand
• Goal is to deliver 400+ hotels, with the first opened in
Q4 2015 and the second opened in Q1 2016
• Should accelerate efforts to gain broad geographic
and chain scale distribution in China
7
• Accessible Lifestyle brand that opens up demand more
broadly
• Designed with a light, organic and contemporary look;
will reflect the local neighborhood flavor and culture
where each hotel is located
• 28 hotels in the pipeline or with signed letters of intent(a)
• $75 to $95 price point target,
space Hampton vacated as its
success pulled it upmarket
• Will address a market that
comprises about 40% of U.S.
room night demand, demand
that our current system largely
does not serve
• 48 hotels in the pipeline and
170 deals committed or in
progress(b), with a potential
system of thousands of hotels
(a) As of March 31, 2016.
(b) As of April 23, 2016.
© 2016 Hilton Worldwide Confidential and Proprietary
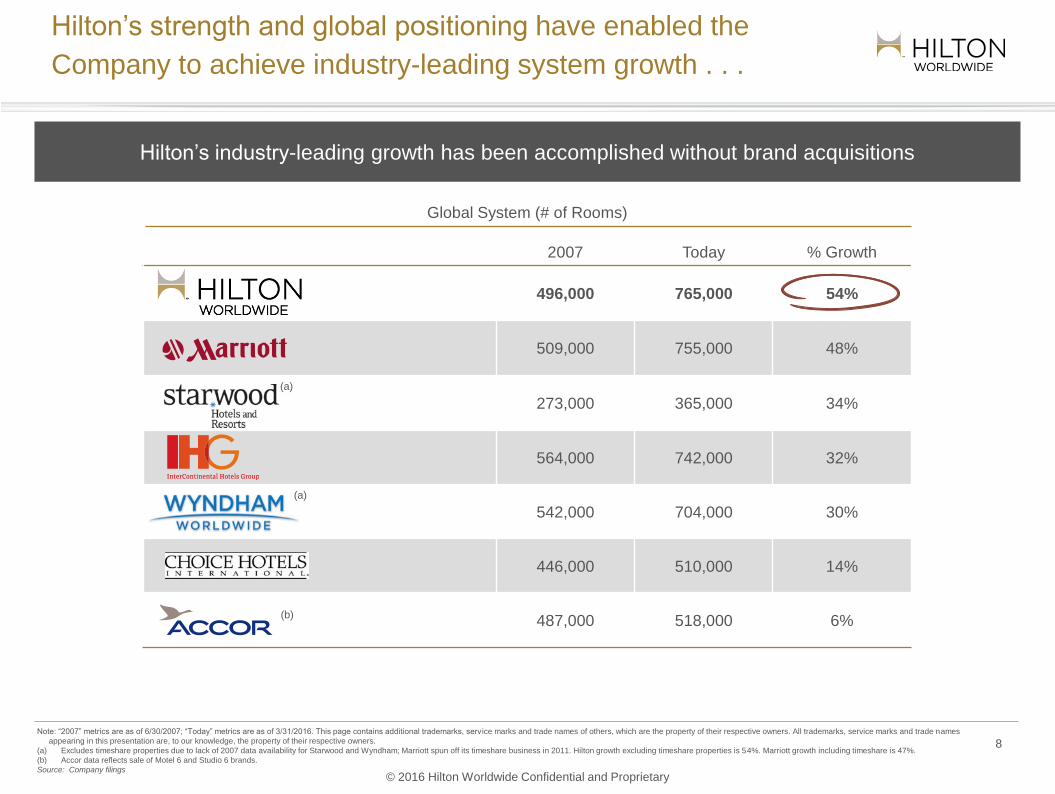
2007 Today % Growth
496,000 765,000 54%
509,000 755,000 48%
273,000 365,000 34%
564,000 742,000 32%
542,000 704,000 30%
446,000 510,000 14%
487,000 518,000 6%
Hilton’s strength and global positioning have enabled the
Company to achieve industry-leading system growth . . .
Note: “2007” metrics are as of 6/30/2007; “Today” metrics are as of 3/31/2016. This page contains additional trademarks, serv ice marks and trade names of others, which are the property of their respective owners. All trademarks, service marks and trade names
appearing in this presentation are, to our knowledge, the property of their respective owners.
(a) Excludes timeshare properties due to lack of 2007 data availability for Starwood and Wyndham; Marriott spun off its timeshare business in 2011. Hilton growth excluding timeshare properties is 54%. Marriott growth including timeshare is 47%.
(b) Accor data reflects sale of Motel 6 and Studio 6 brands.
Source: Company filings
Global System (# of Rooms)
(a)
(b)
(a)
8 8
Hilton’s industry-leading growth has been accomplished without brand acquisitions
© 2016 Hilton Worldwide Confidential and Proprietary
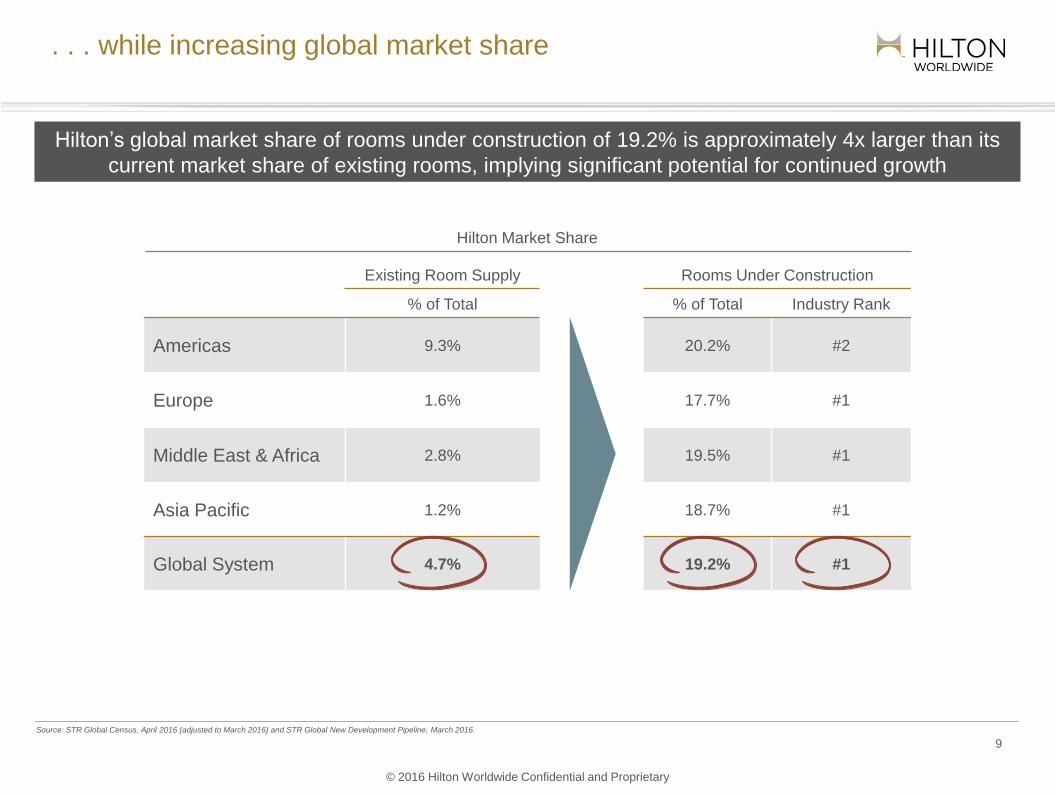
Existing Room Supply Rooms Under Construction
% of Total % of Total Industry Rank
Americas 9.3% 20.2% #2
Europe 1.6% 17.7% #1
Middle East & Africa 2.8% 19.5% #1
Asia Pacific 1.2% 18.7% #1
Global System 4.7% 19.2% #1
. . . while increasing global market share
Hilton Market Share
Hilton’s global market share of rooms under construction of 19.2% is approximately 4x larger than its
current market share of existing rooms, implying significant potential for continued growth
Source: STR Global Census, April 2016 (adjusted to March 2016) and STR Global New Development Pipeline, March 2016.
9 9
© 2016 Hilton Worldwide Confidential and Proprietary
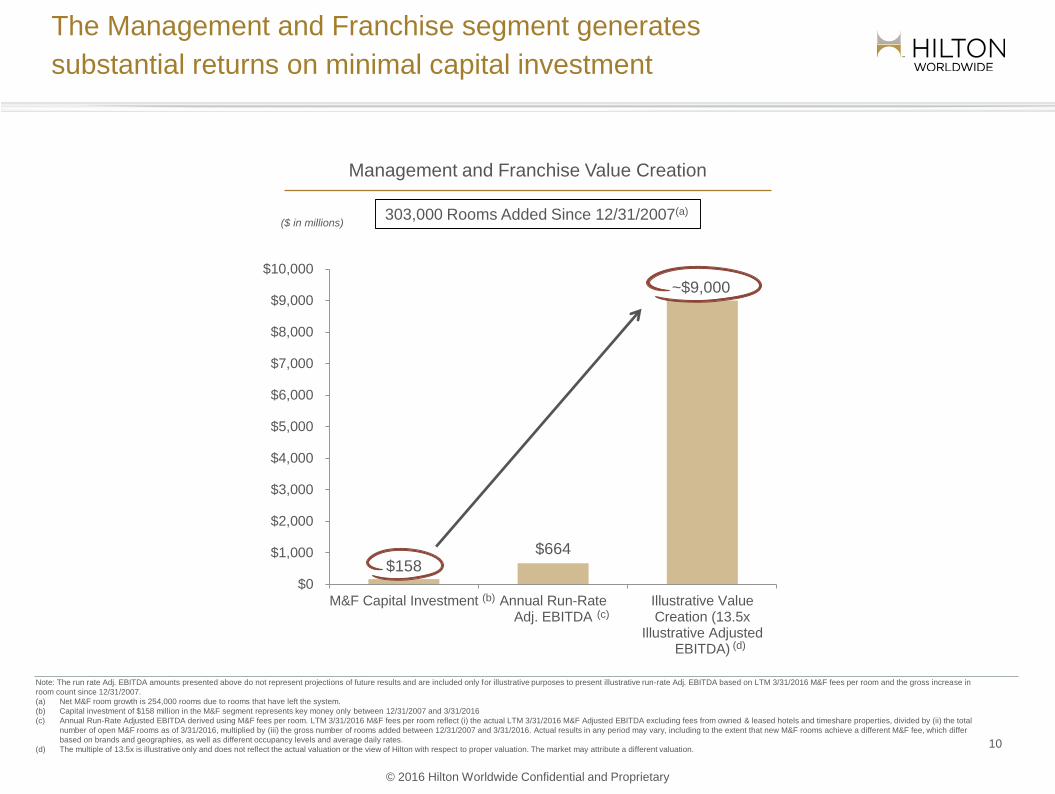
The Management and Franchise segment generates
substantial returns on minimal capital investment
Management and Franchise Value Creation
303,000 Rooms Added Since 12/31/2007(a)($ in millions)
Note: The run rate Adj. EBITDA amounts presented above do not represent projections of future results and are included only for illustrative purposes to present illustrative run-rate Adj. EBITDA based on LTM 3/31/2016 M&F fees per room and the gross increase in
room count since 12/31/2007.
(a) Net M&F room growth is 254,000 rooms due to rooms that have left the system.
(b) Capital investment of $158 million in the M&F segment represents key money only between 12/31/2007 and 3/31/2016
(c) Annual Run-Rate Adjusted EBITDA derived using M&F fees per room. LTM 3/31/2016 M&F fees per room reflect (i) the actual LTM 3/31/2016 M&F Adjusted EBITDA excluding fees from owned & leased hotels and timeshare properties, divided by (ii) the total
number of open M&F rooms as of 3/31/2016, multiplied by (iii) the gross number of rooms added between 12/31/2007 and 3/31/2016. Actual results in any period may vary, including to the extent that new M&F rooms achieve a different M&F fee, which differ
based on brands and geographies, as well as different occupancy levels and average daily rates.
(d) The multiple of 13.5x is illustrative only and does not reflect the actual valuation or the view of Hilton with respect to proper valuation. The market may attribute a different valuation.
$158 $664
~$9,000
$0
$1,000
$2,000
$3,000
$4,000
$5,000
$6,000
$7,000
$8,000
$9,000
$10,000
M&F Capital Investment Annual Run-RateAdj. EBITDA
Illustrative ValueCreation (13.5x
Illustrative AdjustedEBITDA)
(c)
(b)
10
(d)
© 2016 Hilton Worldwide Confidential and Proprietary
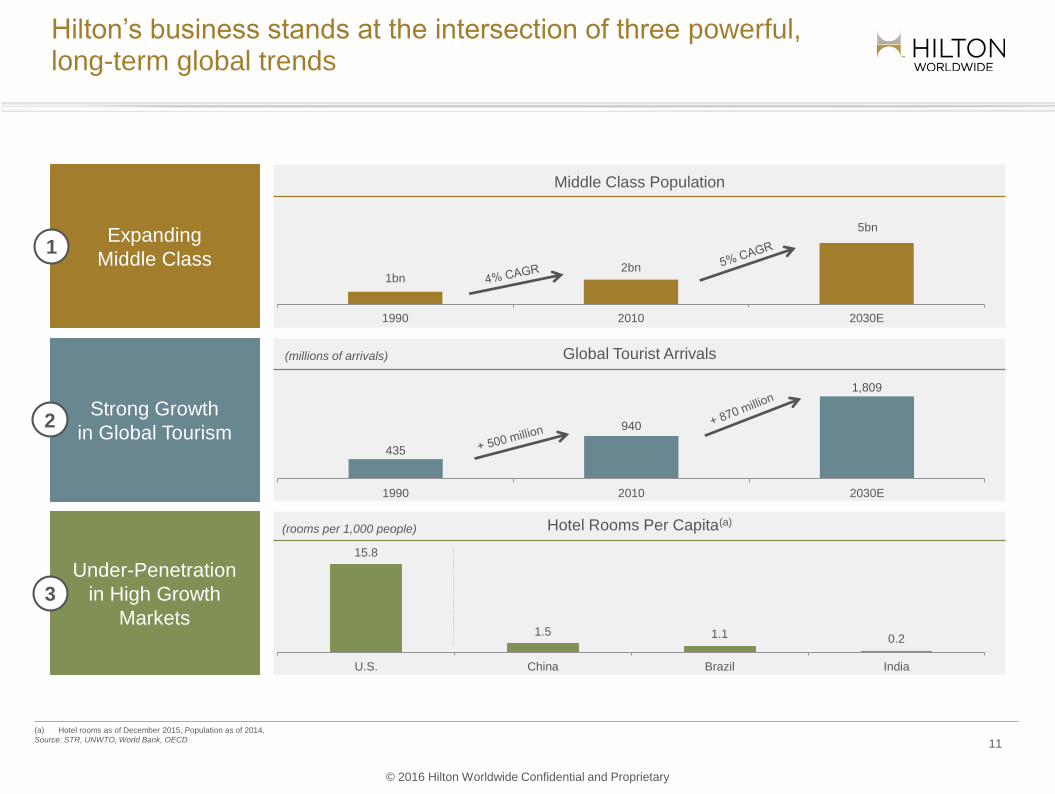
Expanding
Middle Class
Strong Growth
in Global Tourism
Under-Penetration
in High Growth
Markets
1
2
3
Hilton’s business stands at the intersection of three powerful, long-term global trends
Middle Class Population
Hotel Rooms Per Capita(a)(rooms per 1,000 people)
(millions of arrivals) Global Tourist Arrivals
(a) Hotel rooms as of December 2015, Population as of 2014.
Source: STR, UNWTO, World Bank, OECD
15.8
1.5 1.1 0.2
U.S. China Brazil India
1bn2bn
5bn
1990 2010 2030E
435
940
1,809
1990 2010 2030E
11
© 2016 Hilton Worldwide Confidential and Proprietary
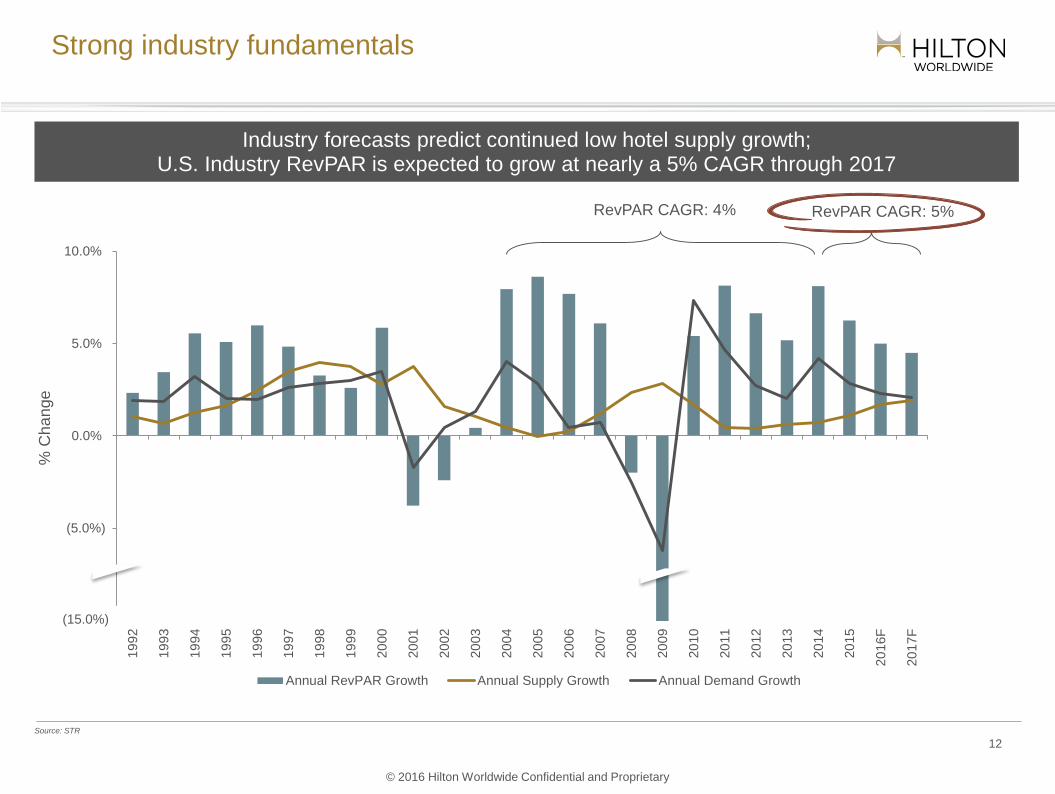
Strong industry fundamentals
Source: STR
Industry forecasts predict continued low hotel supply growth;U.S. Industry RevPAR is expected to grow at nearly a 5% CAGR through 2017
Projected Annual Supply Growth Projected Annual Demand Growth Projected Annual RevPAR Growth
(10.0%)
(5.0%)
0.0%
5.0%
10.0%
19
92
19
93
19
94
19
95
19
96
19
97
19
98
19
99
20
00
20
01
20
02
20
03
20
04
20
05
20
06
20
07
20
08
20
09
20
10
20
11
20
12
20
13
20
14
20
15
20
16F
20
17F
Annual RevPAR Growth Annual Supply Growth Annual Demand Growth
RevPAR CAGR: 4%
12
% C
ha
nge
RevPAR CAGR: 5%
(15.0%)
© 2016 Hilton Worldwide Confidential and Proprietary
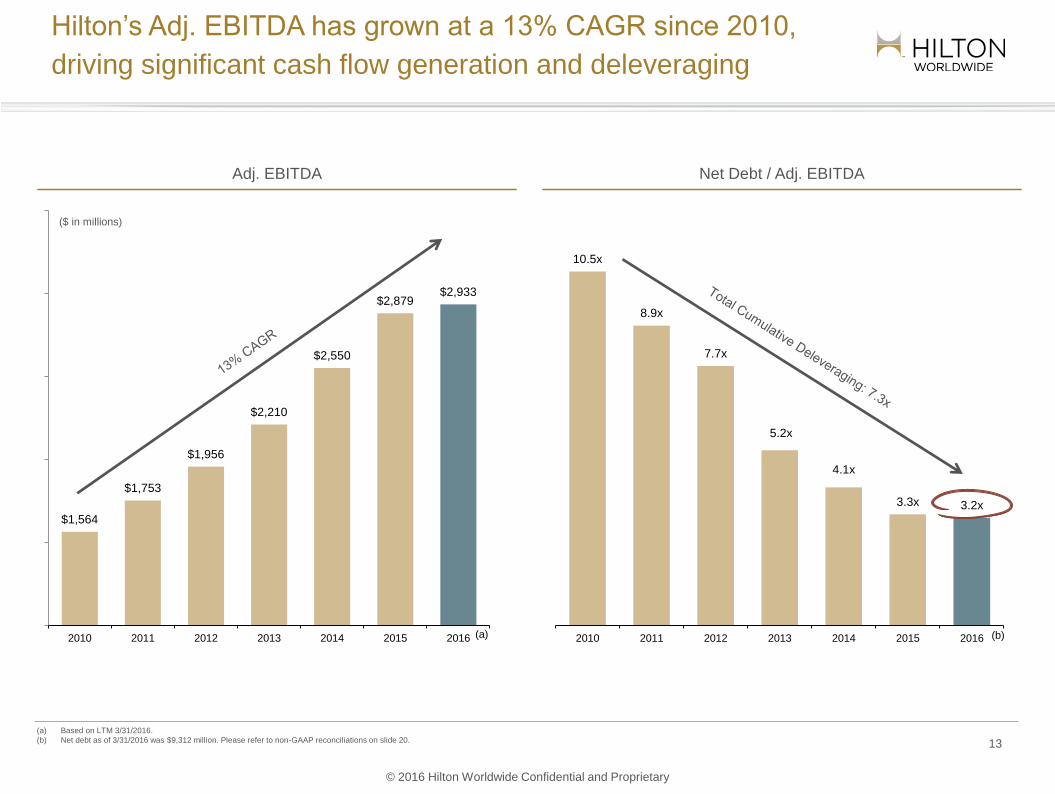
Hilton’s Adj. EBITDA has grown at a 13% CAGR since 2010,
driving significant cash flow generation and deleveraging
Adj. EBITDA Net Debt / Adj. EBITDA
($ in millions)
13
10.5x
8.9x
7.7x
5.2x
4.1x
3.3x 3.2x
2010 2011 2012 2013 2014 2015 2016 (b)
$1,564
$1,753
$1,956
$2,210
$2,550
$2,879 $2,933
2010 2011 2012 2013 2014 2015 2016 (a)
(a) Based on LTM 3/31/2016.
(b) Net debt as of 3/31/2016 was $9,312 million. Please refer to non-GAAP reconciliations on slide 20.
© 2016 Hilton Worldwide Confidential and Proprietary
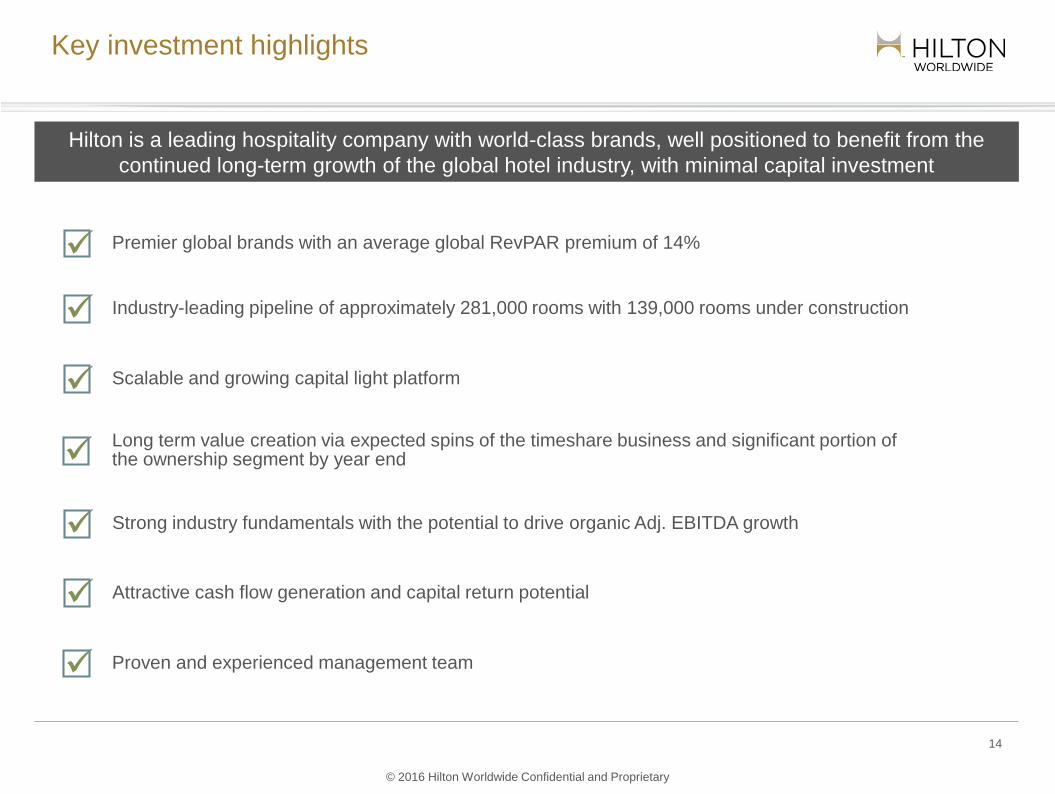
Key investment highlights
Industry-leading pipeline of approximately 281,000 rooms with 139,000 rooms under construction
Proven and experienced management team
Long term value creation via expected spins of the timeshare business and significant portion of the ownership segment by year end
Attractive cash flow generation and capital return potential
Scalable and growing capital light platform
Premier global brands with an average global RevPAR premium of 14%
Strong industry fundamentals with the potential to drive organic Adj. EBITDA growth
Hilton is a leading hospitality company with world-class brands, well positioned to benefit from the
continued long-term growth of the global hotel industry, with minimal capital investment
14

© 2016 Hilton Worldwide Confidential and Proprietary
Appendix
© 2016 Hilton Worldwide Confidential and Proprietary
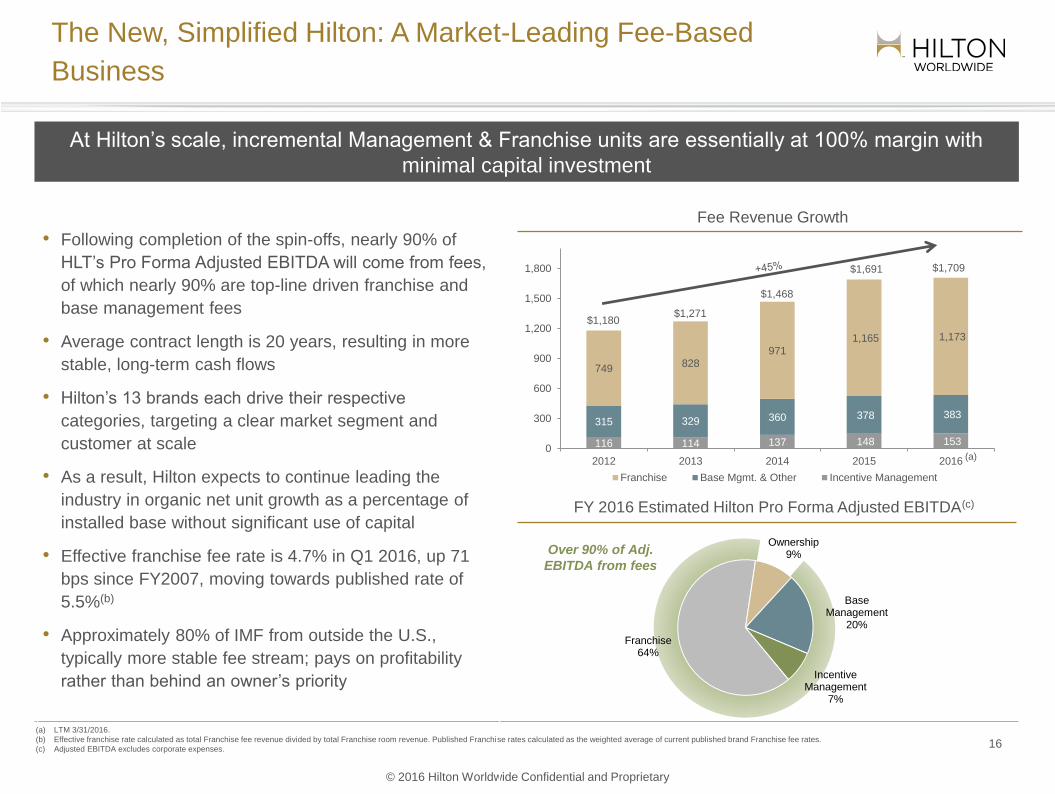
Over 90% of Adj.
EBITDA from fees
• Following completion of the spin-offs, nearly 90% of
HLT’s Pro Forma Adjusted EBITDA will come from fees,
of which nearly 90% are top-line driven franchise and
base management fees
• Average contract length is 20 years, resulting in more
stable, long-term cash flows
• Hilton’s 13 brands each drive their respective
categories, targeting a clear market segment and
customer at scale
• As a result, Hilton expects to continue leading the
industry in organic net unit growth as a percentage of
installed base without significant use of capital
• Effective franchise fee rate is 4.7% in Q1 2016, up 71
bps since FY2007, moving towards published rate of
5.5%(b)
• Approximately 80% of IMF from outside the U.S.,
typically more stable fee stream; pays on profitability
rather than behind an owner’s priority
The New, Simplified Hilton: A Market-Leading Fee-Based
Business
At Hilton’s scale, incremental Management & Franchise units are essentially at 100% margin with
minimal capital investment
16
Fee Revenue Growth
(a) LTM 3/31/2016.
(b) Effective franchise rate calculated as total Franchise fee revenue divided by total Franchise room revenue. Published Franchise rates calculated as the weighted average of current published brand Franchise fee rates.
(c) Adjusted EBITDA excludes corporate expenses.
116 114 137 148 153
315 329 360 378 383
749828
971
1,165 1,173
0
300
600
900
1,200
1,500
1,800
2012 2013 2014 2015 2016
Franchise Base Mgmt. & Other Incentive Management
$1,691 $1,709
(a)
$1,180$1,271
$1,468
Franchise64%
Ownership9%
Base Management
20%
Incentive Management
7%
FY 2016 Estimated Hilton Pro Forma Adjusted EBITDA(c)
© 2016 Hilton Worldwide Confidential and Proprietary
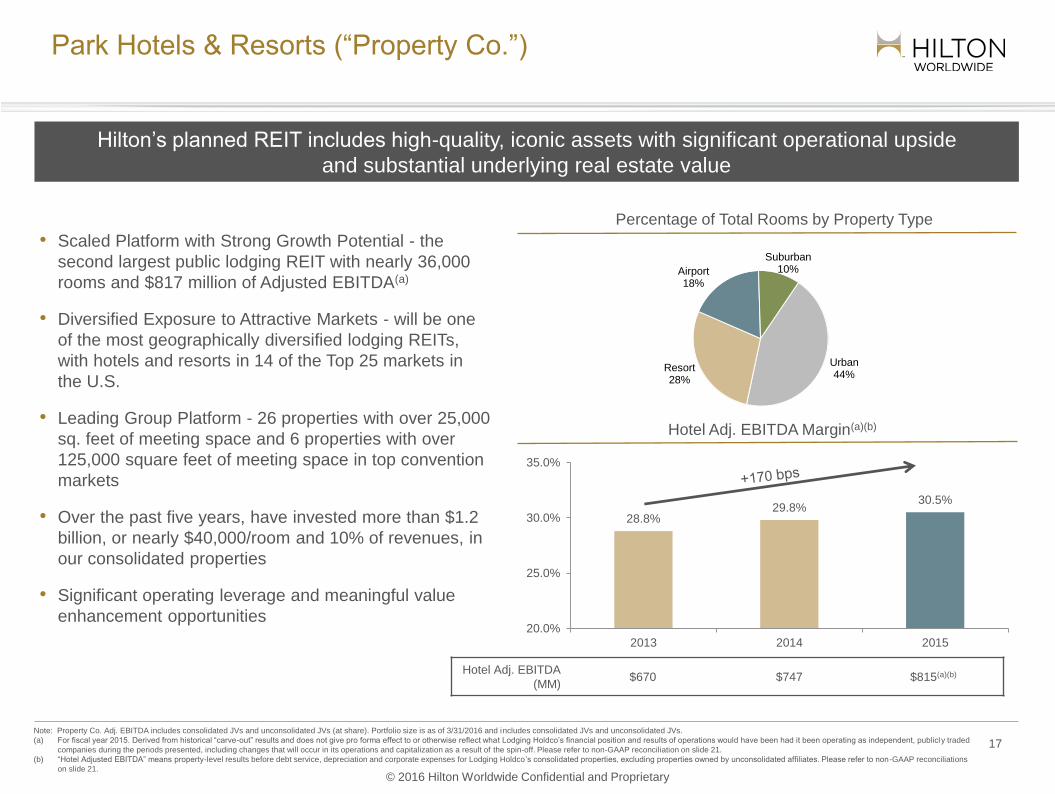
Park Hotels & Resorts (“Property Co.”)
Hilton’s planned REIT includes high-quality, iconic assets with significant operational upside
and substantial underlying real estate value
Hotel Adj. EBITDA Margin(a)(b)
• Scaled Platform with Strong Growth Potential - the
second largest public lodging REIT with nearly 36,000
rooms and $817 million of Adjusted EBITDA(a)
• Diversified Exposure to Attractive Markets - will be one
of the most geographically diversified lodging REITs,
with hotels and resorts in 14 of the Top 25 markets in
the U.S.
• Leading Group Platform - 26 properties with over 25,000
sq. feet of meeting space and 6 properties with over
125,000 square feet of meeting space in top convention
markets
• Over the past five years, have invested more than $1.2
billion, or nearly $40,000/room and 10% of revenues, in
our consolidated properties
• Significant operating leverage and meaningful value
enhancement opportunities
17
Note: Property Co. Adj. EBITDA includes consolidated JVs and unconsolidated JVs (at share). Portfolio size is as of 3/31/2016 and includes consolidated JVs and unconsolidated JVs.
(a) For fiscal year 2015. Derived from historical “carve-out” results and does not give pro forma effect to or otherwise reflect what Lodging Holdco’s financial position and results of operations would have been had it been operating as independent, publicly traded
companies during the periods presented, including changes that will occur in its operations and capitalization as a result of the spin-off. Please refer to non-GAAP reconciliation on slide 21.
(b) “Hotel Adjusted EBITDA” means property-level results before debt service, depreciation and corporate expenses for Lodging Holdco’s consolidated properties, excluding properties owned by unconsolidated affiliates. Please refer to non-GAAP reconciliations
on slide 21.
28.8%29.8%
30.5%
20.0%
25.0%
30.0%
35.0%
2013 2014 2015
Hotel Adj. EBITDA
(MM)$670 $747 $815(a)(b)
Percentage of Total Rooms by Property Type
Urban44%
Resort28%
Airport18%
Suburban10%
© 2016 Hilton Worldwide Confidential and Proprietary
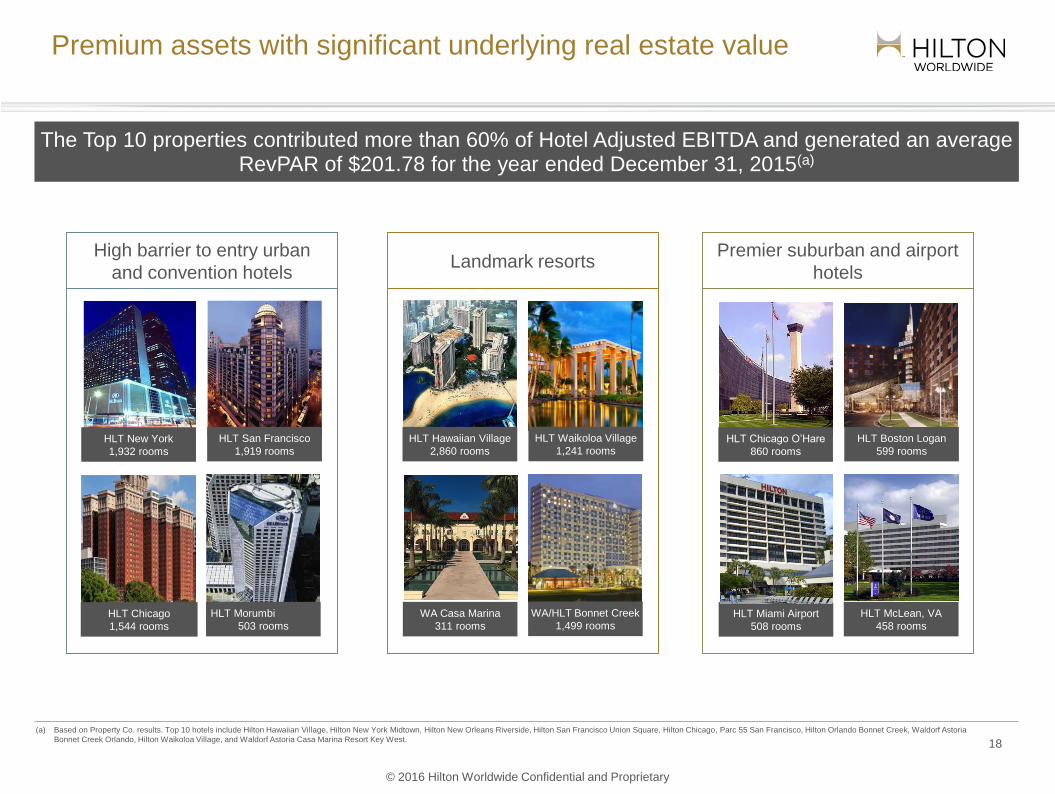
Premium assets with significant underlying real estate value
The Top 10 properties contributed more than 60% of Hotel Adjusted EBITDA and generated an average RevPAR of $201.78 for the year ended December 31, 2015(a)
(a) Based on Property Co. results. Top 10 hotels include Hilton Hawaiian Village, Hilton New York Midtown, Hilton New Orleans Riverside, Hilton San Francisco Union Square, Hilton Chicago, Parc 55 San Francisco, Hilton Orlando Bonnet Creek, Waldorf Astoria
Bonnet Creek Orlando, Hilton Waikoloa Village, and Waldorf Astoria Casa Marina Resort Key West. 18
Landmark resortsHigh barrier to entry urban
and convention hotels
Premier suburban and airport
hotels
HLT Waikoloa Village
1,241 rooms
WA/HLT Bonnet Creek
1,499 rooms
HLT Hawaiian Village
2,860 rooms
WA Casa Marina
311 rooms
HLT San Francisco
1,919 rooms
HLT Morumbi
503 rooms
HLT New York
1,932 rooms
HLT Chicago
1,544 rooms
HLT Boston Logan
599 rooms
HLT McLean, VA
458 roomsHLT Miami Airport
508 rooms
HLT Chicago O’Hare
860 rooms
© 2016 Hilton Worldwide Confidential and Proprietary
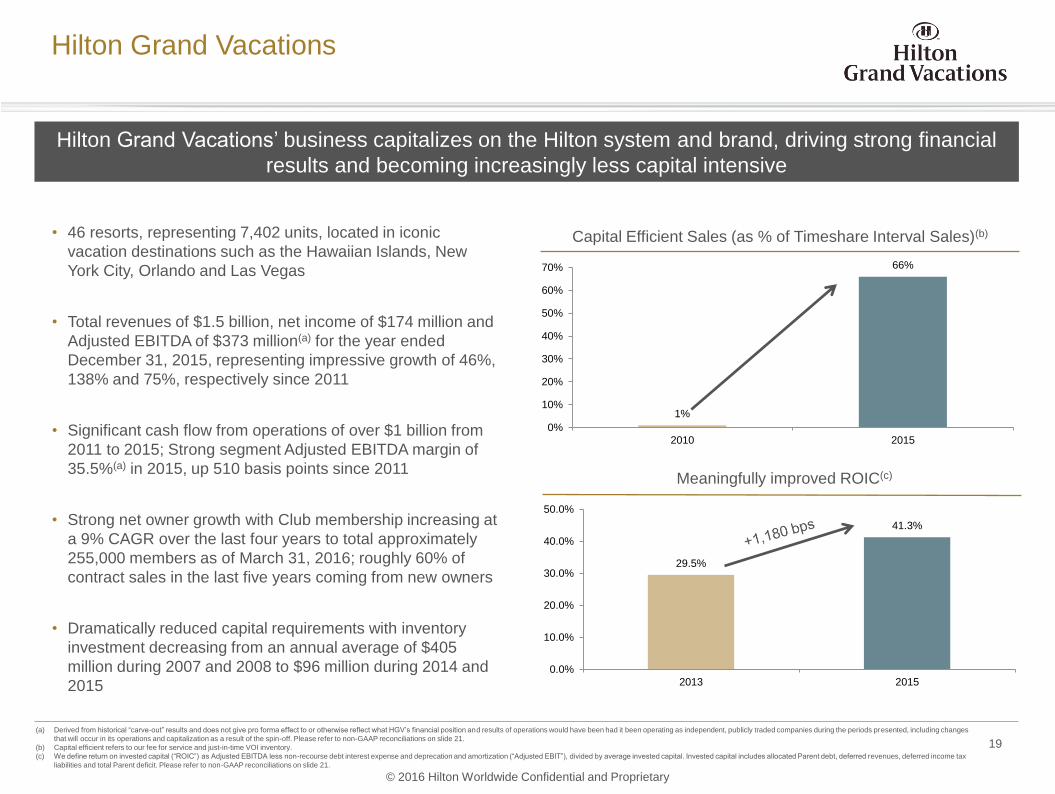
Hilton Grand Vacations
• 46 resorts, representing 7,402 units, located in iconic
vacation destinations such as the Hawaiian Islands, New
York City, Orlando and Las Vegas
• Total revenues of $1.5 billion, net income of $174 million and
Adjusted EBITDA of $373 million(a) for the year ended
December 31, 2015, representing impressive growth of 46%,
138% and 75%, respectively since 2011
• Significant cash flow from operations of over $1 billion from
2011 to 2015; Strong segment Adjusted EBITDA margin of
35.5%(a) in 2015, up 510 basis points since 2011
• Strong net owner growth with Club membership increasing at
a 9% CAGR over the last four years to total approximately
255,000 members as of March 31, 2016; roughly 60% of
contract sales in the last five years coming from new owners
• Dramatically reduced capital requirements with inventory
investment decreasing from an annual average of $405
million during 2007 and 2008 to $96 million during 2014 and
2015
19
Hilton Grand Vacations’ business capitalizes on the Hilton system and brand, driving strong financial
results and becoming increasingly less capital intensive
Capital Efficient Sales (as % of Timeshare Interval Sales)(b)
1%
66%
0%
10%
20%
30%
40%
50%
60%
70%
2010 2015
(a) Derived from historical “carve-out” results and does not give pro forma effect to or otherwise reflect what HGV’s financial position and results of operations would have been had it been operating as independent, publicly traded companies during the periods presented, including changes
that will occur in its operations and capitalization as a result of the spin-off. Please refer to non-GAAP reconciliations on slide 21.
(b) Capital efficient refers to our fee for service and just-in-time VOI inventory.
(c) We define return on invested capital (“ROIC”) as Adjusted EBITDA less non-recourse debt interest expense and deprecation and amortization (“Adjusted EBIT”), divided by average invested capital. Invested capital includes allocated Parent debt, deferred revenues, deferred income tax
liabilities and total Parent deficit. Please refer to non-GAAP reconciliations on slide 21.
Meaningfully improved ROIC(c)
29.5%
41.3%
0.0%
10.0%
20.0%
30.0%
40.0%
50.0%
2013 2015
© 2016 Hilton Worldwide Confidential and Proprietary
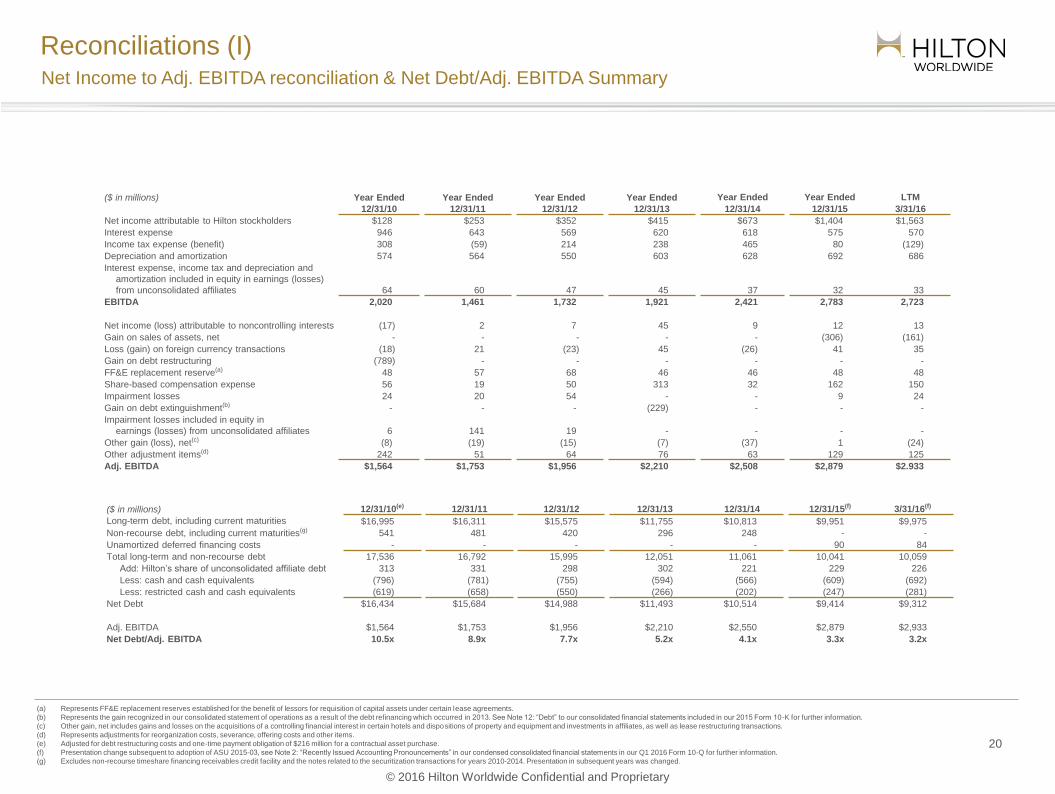
Reconciliations (I)
20
($ in millions) Year Ended Year Ended Year Ended Year Ended Year Ended Year Ended LTM
12/31/10 12/31/11 12/31/12 12/31/13 12/31/14 12/31/15 3/31/16
Net income attributable to Hilton stockholders $128 $253 $352 $415 $673 $1,404 $1,563
Interest expense 946 643 569 620 618 575 570
Income tax expense (benefit) 308 (59) 214 238 465 80 (129)
Depreciation and amortization 574 564 550 603 628 692 686
Interest expense, income tax and depreciation and
amortization included in equity in earnings (losses)
from unconsolidated affiliates 64 60 47 45 37 32 33
EBITDA 2,020 1,461 1,732 1,921 2,421 2,783 2,723
Net income (loss) attributable to noncontrolling interests (17) 2 7 45 9 12 13
Gain on sales of assets, net - - - - - (306) (161)
Loss (gain) on foreign currency transactions (18) 21 (23) 45 (26) 41 35
Gain on debt restructuring (789) - - - - - -
FF&E replacement reserve(a) 48 57 68 46 46 48 48
Share-based compensation expense 56 19 50 313 32 162 150
Impairment losses 24 20 54 - - 9 24
Gain on debt extinguishment(b) - - - (229) - - -
Impairment losses included in equity in
earnings (losses) from unconsolidated affiliates 6 141 19 - - - -
Other gain (loss), net(c) (8) (19) (15) (7) (37) 1 (24)
Other adjustment items(d) 242 51 64 76 63 129 125
Adj. EBITDA $1,564 $1,753 $1,956 $2,210 $2,508 $2,879 $2.933
($ in millions) 12/31/10(e) 12/31/11 12/31/12 12/31/13 12/31/14 12/31/15(f) 3/31/16(f)
Long-term debt, including current maturities $16,995 $16,311 $15,575 $11,755 $10,813 $9,951 $9,975
Non-recourse debt, including current maturities(g) 541 481 420 296 248 - -
Unamortized deferred financing costs - - - - - 90 84
Total long-term and non-recourse debt 17,536 16,792 15,995 12,051 11,061 10,041 10,059
Add: Hilton’s share of unconsolidated affiliate debt 313 331 298 302 221 229 226
Less: cash and cash equivalents (796) (781) (755) (594) (566) (609) (692)
Less: restricted cash and cash equivalents (619) (658) (550) (266) (202) (247) (281)
Net Debt $16,434 $15,684 $14,988 $11,493 $10,514 $9,414 $9,312
Adj. EBITDA $1,564 $1,753 $1,956 $2,210 $2,550 $2,879 $2,933
Net Debt/Adj. EBITDA 10.5x 8.9x 7.7x 5.2x 4.1x 3.3x 3.2x
(a) Represents FF&E replacement reserves established for the benefit of lessors for requisition of capital assets under certain lease agreements.
(b) Represents the gain recognized in our consolidated statement of operations as a result of the debt refinancing which occurred in 2013. See Note 12: “Debt” to our consolidated financial statements included in our 2015 Form 10-K for further information.
(c) Other gain, net includes gains and losses on the acquisitions of a controlling financial interest in certain hotels and dispositions of property and equipment and investments in affiliates, as well as lease restructuring transactions.
(d) Represents adjustments for reorganization costs, severance, offering costs and other items.
(e) Adjusted for debt restructuring costs and one-time payment obligation of $216 million for a contractual asset purchase.
(f) Presentation change subsequent to adoption of ASU 2015-03, see Note 2: “Recently Issued Accounting Pronouncements” in our condensed consolidated financial statements in our Q1 2016 Form 10-Q for further information.
(g) Excludes non-recourse timeshare financing receivables credit facility and the notes related to the securitization transactions for years 2010-2014. Presentation in subsequent years was changed.
Net Income to Adj. EBITDA reconciliation & Net Debt/Adj. EBITDA Summary
© 2016 Hilton Worldwide Confidential and Proprietary
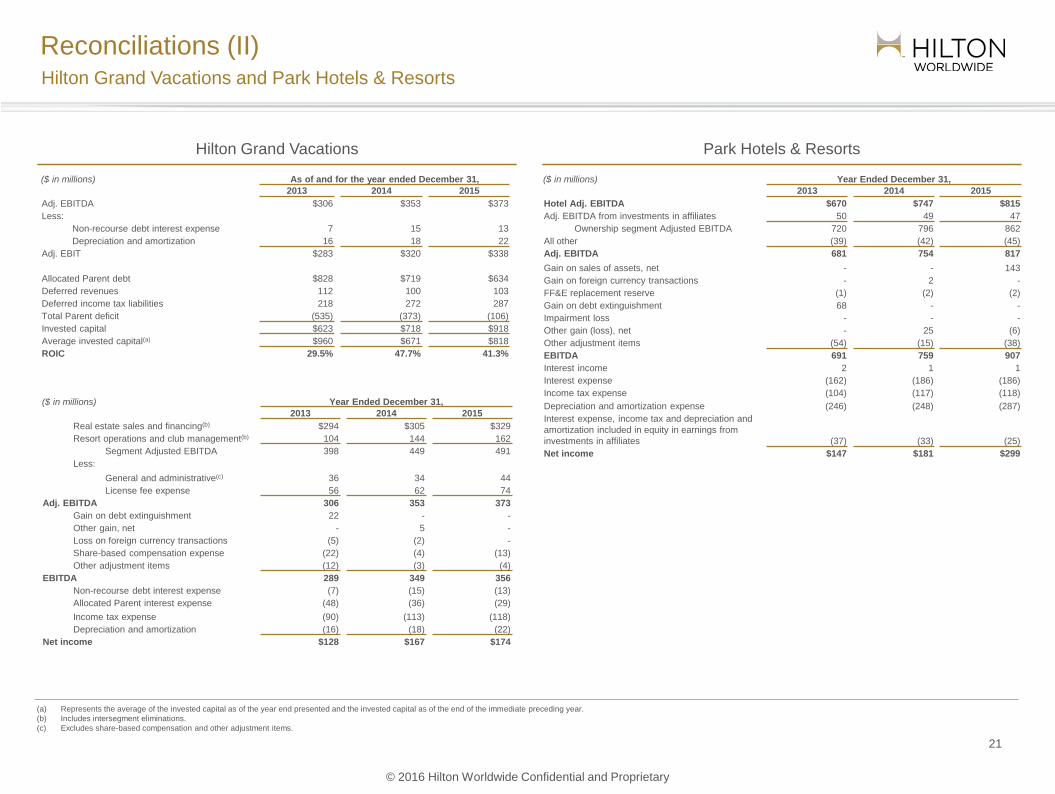
Reconciliations (II)
21
($ in millions) As of and for the year ended December 31,
2013 2014 2015
Adj. EBITDA $306 $353 $373
Less:
Non-recourse debt interest expense 7 15 13
Depreciation and amortization 16 18 22
Adj. EBIT $283 $320 $338
Allocated Parent debt $828 $719 $634
Deferred revenues 112 100 103
Deferred income tax liabilities 218 272 287
Total Parent deficit (535) (373) (106)
Invested capital $623 $718 $918
Average invested capital(a) $960 $671 $818
ROIC 29.5% 47.7% 41.3%
(a) Represents the average of the invested capital as of the year end presented and the invested capital as of the end of the immediate preceding year.
(b) Includes intersegment eliminations.
(c) Excludes share-based compensation and other adjustment items.
Hilton Grand Vacations and Park Hotels & Resorts
($ in millions) Year Ended December 31,
2013 2014 2015
Real estate sales and financing(b) $294 $305 $329
Resort operations and club management(b) 104 144 162
Segment Adjusted EBITDA 398 449 491
Less:
General and administrative(c) 36 34 44
License fee expense 56 62 74
Adj. EBITDA 306 353 373
Gain on debt extinguishment 22 - -
Other gain, net - 5 -
Loss on foreign currency transactions (5) (2) -
Share-based compensation expense (22) (4) (13)
Other adjustment items (12) (3) (4)
EBITDA 289 349 356
Non-recourse debt interest expense (7) (15) (13)
Allocated Parent interest expense (48) (36) (29)
Income tax expense (90) (113) (118)
Depreciation and amortization (16) (18) (22)
Net income $128 $167 $174
Hilton Grand Vacations Park Hotels & Resorts
($ in millions) Year Ended December 31,
2013 2014 2015
Hotel Adj. EBITDA $670 $747 $815
Adj. EBITDA from investments in affiliates 50 49 47
Ownership segment Adjusted EBITDA 720 796 862
All other (39) (42) (45)
Adj. EBITDA 681 754 817
Gain on sales of assets, net - - 143
Gain on foreign currency transactions - 2 -
FF&E replacement reserve (1) (2) (2)
Gain on debt extinguishment 68 - -
Impairment loss - - -
Other gain (loss), net - 25 (6)
Other adjustment items (54) (15) (38)
EBITDA 691 759 907
Interest income 2 1 1
Interest expense (162) (186) (186)
Income tax expense (104) (117) (118)
Depreciation and amortization expense (246) (248) (287)
Interest expense, income tax and depreciation and
amortization included in equity in earnings from
investments in affiliates (37) (33) (25)
Net income $147 $181 $299

© 2016 Hilton Worldwide Confidential and Proprietary