investor presentation - ii-vi.com · page 2 safe harbor statement matters discussed in this...
TRANSCRIPT

Page 1
INVESTOR PRESENTATIONFebruary 2018
IIVI

Page 2
Safe Harbor Statement
Matters discussed in this presentation may contain forward-looking statements that are subject to risks and uncertainties. These risks and uncertainties could cause the forward-looking statements and II-VI Incorporated’s (the “Company’s”) actual results to differ materially. In evaluating these forward-looking statements, you should specifically consider the “Risk Factors” in the Company’s most recent Form 10-K and Form 10-Q. Forward-looking statements are only estimates and actual events or results may differ materially. II-VI Incorporated disclaims any obligation to update information contained in any forward-looking statement. This presentation contains certain non-GAAP financial measures. Reconciliations of non-GAAP financial measures to their most comparable GAAP financial measures are presented at the end of this presentation.

Page 3
Origins of Our Company Name
Refers to groups II and VI of the Periodic Table of Elements.“TWO SIX”
SSulfur
SeSelenium
ZnZinc
TeTellurium
CdCadmium

Page 4
1971 1987 2017
IPO 30th Anniversary since the IPO
We Started In Saxonburg, PA
Francis J. Kramer(Left) and Dr. Carl J. Johnson(Right)
Saxonburg Campus in 1997
Pittsburgh Saxonburg
Since 1971

Page 5
Our Footprint
14Countries
44Worldwide Locations
10,000+Worldwide employee
World Headquarters
Manufacturing and R&D FacilitiesGlobal Sales Offices
North America Europe
Asia
2,000+ 500+ 7,500+
Page 6
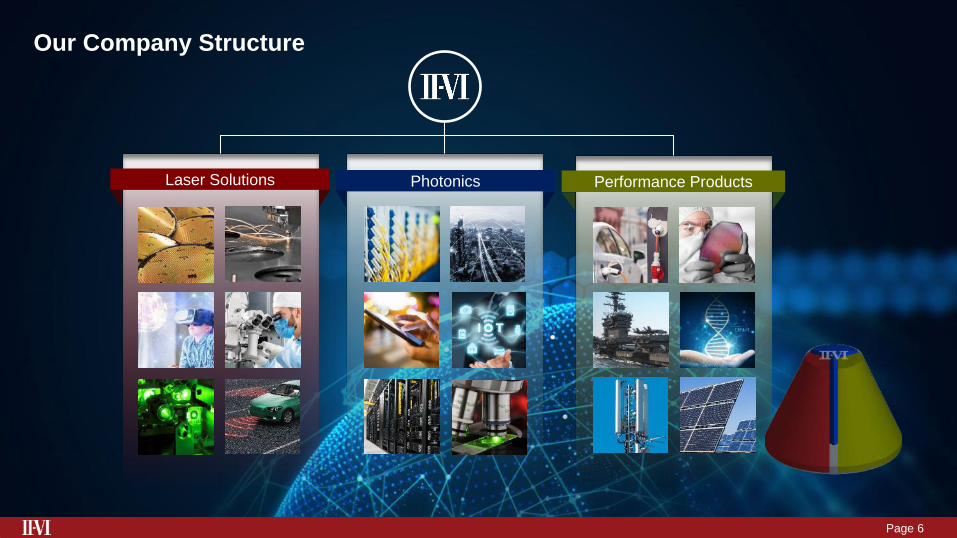
Our Company Structure
Laser Solutions Photonics Performance Products

Page 7
Vertically Integrated Manufacturing Platforms
Industrial Materials Processing Optical & Wireless Communications Advanced Materials & Military 3D Sensing & IoT Emerging Technologies

Page 8
How We Use Our Platforms to Serve Our End Markets
Industrial Materials Processing Optical & Wireless Communications Advanced Materials & Military 3D Sensing & IoT Emerging Technologies
Reported Segments FY17Revenue
Q2FY18Revenue
Q2FY18 OpMargin –
GAAP
Q2FY18/Q2FY17 Revenue
Growth
Industrial(Automotive)
Fiber Optic& Wireless
Comm.Military Semi
Cap
Life Science,
Consumer,Other
Laser Solutions $339M $110M 9% 35% 61%(5%)
9% 4% 6% 20%
Photonics $419M $111M 15% 10% 10% 81% 0% 3% 6%
Performance Products $214M $61M 10% 24% 16%(2%) 13% 37% 19% 15%
II-VI Consolidated $972M $282M 12% 21% 31%(2%) 38% 10% 8% 13%

Page 9
Over 4 Decades of Continuous Growth
$28 $38 $53 $61 $62 $74$123 $114 $128 $143
$187 $224 $225$316 $292
$333
$487 $516 $551
$683$742
$827
$972
Over$1B*
1995 1996 1997 1998 1999 2000 2001 2002 2003 2004 2005 2006 2007 2008 2009 2010 2011 2012 2013 2014 2015 2016 2017 2018
Micro-opticsVergo Optics
Micro-opticsLighting Optical
ZnSe GrowthLaser Power Corp
Silicon CarbideLitton SIC Group
UV FiltersLaser Power Corp
Thermo-electric CoolersMarlow Industries
Selenium RefineryPacific Rare Metals
Laser Processing HeadsHighyag
Micro-opticsPhotop Technologies
Conformal PatterningMax Levy Autograph
Optical Channel MonitorsAegis Lightwave
Metal MatrixComponentsM Cubed Technologies
Military & AerospaceOptical SystemsLightWorks Optics
Advanced CoatingsOclaro Optical Coatings
Optical AmplifiersOclaro Optical Amplifier
Semiconductor LasersOclaro Semiconductor Laser
EpiwaferFoundryEpiworks
GaAs Wafer FabAnadigics
Compound Semi. Wafer FabKaiam Laser Limited(U.K. Fab)
Faraday RotatorIntegrated Photonics
Direct Diode High Power LasersDirect Diode
IIVI
IPO 1987
Acquisition History
Average Organic Revenue Growth over the last 10 years7%
FY1987-FY2017Revenue
PATCash Flow from Ops
R&DCap Ex
$7.4B$0.8B$1.2B$0.4B$0.6B
Cumulative

Page 10
Recent Platform Acquisitions
COMPOUND SEMICONDUCTOR LASERS
COMPOUND SEMICONDUCTOR DEVICES:
AIMING BEYOND LASERS
VERTICAL INTEGRATION & SCALE
OPTICAL COMMUNICATIONS & ACCESS TO CHINA MARKET
2010 2013 2016 2017

Page 11
Megatrends
Ubiquitous Connectivity
Big Data
Internet of Things
RenewableEnergy
Industry4.0
Next GenerationDefense Systems Low Emission
Vehicles
Consumer Electronics
Robotics

Page 12
SiC Substrates for Wireless Communications
Share of the Projected Annual $200 Billion Investment In 5G by Country Starting Around Year 2020
US 28%
China 23%
Japan 11%
Germany 4%
U.K. 3%
Source: Bloomberg Business Week
SiC for High Frequency GaN Electronics Market
CAGR (‘17-’22): +15%Source: Yole

Page 13
SiC Substrates for Power Electronics
Electric Car Announcements
GM 20 all electric cars by 2023
Ford 13 models by 2023
Toyota & Mazda U.S.-based plant by 2021
Daimler /Mercedes-Benz Electrify entire portfolio by 2022
Renault/Nissan/Mitsubishi 12 All-Electric cars by 2022
Jaguar Land Rover Electrify (HEV/EV) all lineup by 2020
Volvo Electrify entire line by 2019
VW/Audi/Porsche EV/HEV by 2030SiC for High Power Electronics Market
CAGR (‘17-’21): +23%Source: Yole
Source: Mashable

Page 14
Laser & Micro-optics for 3D Sensing
* VCSEL: Vertical Cavity Surface Emitting LasersVCSEL Market CAGR (’15-’22): +19%
Source: Markets & Markets

Page 15
Tesla 2017
GM 2018
Hyundai 2020
Renault-Nissan 2020
Toyota 2020
Opto-Electronics for LiDAR
Laser Diodes for LiDAR Market (’17-’22): +20%Source: Strategies Unlimited
Self-driving car availability by car manufacturer
Volvo 2020
Daimler 2020
BMW 2021
Ford 2021
Honda 2025Source: AXIOS

Page 16
EUV Lithography System
EUV Source System
CO2 System
Front/Back End Processing System
Beam Transport System
Laser Optics & Precision Ceramics for Extreme Ultraviolet (EUV) Lithography
EUV Lithography Systems Market CAGR (‘16-‘22): 9%
Source: Allied Market Research

Page 17
Differentiated Product Portfolio for Industrial Lasers
Fiber Lasers Direct diode Lasers
Fiber Lasers Market CAGR (‘17-‘22): +8%Direct Diode Market CAGR (‘17-‘22): +7%
Source: Strategies Unlimited
Laser Remote Welding Head Direct Diode Laser Engine
Broad portfolio of components including: pump lasers, high power combiners, acousto-optic modulators, high power isolators, gratings and micro-optics.

Page 18
Optics & Optoelectronics for Datacenters
Datacom Optical Components Market CAGR (’17-‘22): +25%
Z-Block

Page 19
Leading Edge Subsystems for Intelligent Communications Networks
Laser Chip-on-Carrier Assembly
Thermoelectric Cooler
Optics
Optical Channel Monitor
OTDR
Passive Components
Optical Amplifier
Optical Communications MarketCAGR (’15-’21): +12%
Source: Ovum

Page 20
Engineered Materials, High Energy Laser and Optics for Military & Aerospace
World leader in large sapphire panel output 24,000 sf dedicated facility
F-35 Electro-Optical Targeting System (EOTS)Infrared Countermeasure Systems Market
CAGR (’17-’22): +8%Source: Strategies Unlimited

Page 21
Innovation Strategy
BESTPRODUCT
Markets Differentiation Performance Products Infrastructure Business Model

Page 22
Financials
ExpectationsCash and Equivalents
Cash Flow from Operations
Long-Term Debt(Including current portion)
FY17FY15 FY16
Shareholder’s Equity
$271M$174M $218M
$118M$129M $123M
$342M$176M $235M
$900M$729M $782M
Cash and Liquidity 6M FY18
$254M
$60M
$463M
$964M
FY15 FY16 FY17 6M FY18
$762$875
$1,072
$547$742
$827$972
$543
$242 $290$399 $404
Booking/Revenue/Backlog
Booking Revenue BacklogFY15 FY16 FY17 6M FY18
36.6% 37.8% 40.0% 39.7%
17.3% 18.1% 19.5% 19.1%
10.4% 11.1% 11.9% 11.5%
Margin Performance
Gross Margin EBITDA Operating Margin
Page 15 details typical industry EPS adjustments
Financial Trends
FY17 FY18
Gross Margin 40.0% 38.5%-41%
EDBITDA 19.5% 18.5%-22%
Operating Margin 11.9% 11%-14%

Page 23
www.ii-vi.comIIVI

Page 24
Reconciliation Tables
Three Months Ended Year Ended
Dec 31, 2017 Sept 30, 2017 Dec 31, 2016 Dec 31, 2017 Dec 31, 2016
Operating Income $32.5 $29.8 $27.1 $62.3 $50.8
Interest Expense 4.7 3.6 1.4 8.3 2.6
Other expense (income), net (2.0) (0.7) (6.1) (2.7) (7.5)
Income taxes 20.2 5.8 7.9 26 15.5
Net Earnings $9.6 $21.1 $23.9 $30.7 $40.2
EBITDA $53.9 $49.4 $48.1 $103.3 $88.1
EBITDA margin 19.1% 18.9% 20.8% 19.1% 19.4%
Interest expense 4.7 3.6 1.4 8.3 2.6
Depreciation and amortization 19.4 18.9 14.9 38.3 29.8
Income taxes 20.2 5.8 7.9 26.0 15.5
Net Earnings $9.6 $21.1 $23.9 $30.7 $40.2

Page 25
II-VI Reports GAAP EPS
II-VI ConsolidatedSummary of Typical Industry Adjustments
Q1 FY17 Q2 FY17 Q3 FY17 Q4 FY17 Q1 FY18 Q2 FY18
GAAP Gross Margin 87.5 94.3 97.8 108.7 105.9 109.5
Shared Based Comp 0.7 0.6 0.7 0.5 1.0 1.0
Operation Dilution (Inv roll through) - - - 0.2 1.0 1.0
Peer Comparable Gross Margin 88.2 94.9 98.5 109.4 107.9 111.5
Peer Comparable Gross Margin % 39.8% 41.0% 40.2% 40.0% 41.3% 39.6%
GAAP SG&A 42.1 43.5 43.3 47.1 50.6 49.1
One Time Costs - - - 0.3 1.0 0.4
Amortization 3.2 3.2 3.2 3.2 3.6 3.8
Shared Based Comp 3.4 3.3 3.8 3.0 5.3 4.4
Peer Comparable SG&A 35.5 37.0 36.3 40.6 40.7 40.5
GAAP Operating Income 23.7 27.1 29.0 35.7 29.8 32.5
Shared Based Comp 4.1 3.9 4.5 3.5 6.3 5.4
Operation Dilution (Inv roll through) - - - 0.2 1.0 1.0
One Time Costs - - - 0.3 1.0 0.4
Amortization 3.2 3.2 3.2 3.2 3.6 3.8
Peer Comparable Operating Income 31.0 34.2 36.7 42.9 41.7 43.1
Peer Comparable Operating Margin % 14.0% 14.8% 15.0% 15.7% 15.9% 15.3%
To calculate EPS comparable to some peers, below are the values of typical adjustments used by other companies
