investor presentation - invocare
TRANSCRIPT

Presenters:
Martin Earp CEO
Phillip Friery CFO
Investor Presentation 2016 Half Year Results
August 2016

Contents
1. 2016 Half Year – Key Highlights
2. Pillars of Growth
3. Group Financial Highlights
4. Outlook
5. Appendices
2

2016 Half Year - Key Highlights
> Sales revenue up 3.1% on H1 2015 > Compared to 6.1% increase for H1 2015 on H1 2014
> In a market where numbers of deaths were down
> EBITDA up 4.6% > Compared to 1.0% increase for H1 2015 on H1 2014
> Excellent result in current environment due to tight management of costs
> EBITDA margin on sales up 0.3% to 22.0% (compared to 1.1% decline H1 2015 on H1 2014)
> Operating earnings after tax up 13.2% > Compared to 2.1% decline for H1 2015 on H1 2014
> Lower finance costs and tax main contributors to higher growth than EBITDA
> Reported profit, after tax and minority interest, up 50.6% > Compared to 11.3% decline for H1 2015 on H1 2014
> Higher investment returns on undelivered prepaid funds and asset sale gains
> EBITDA to cash conversion 95%
> Interim fully franked dividend up 7.9% to 17.00 cents per share > Payable on 7 October 2016; record date 15 September 2016
3

Contents
1. 2016 Half Year – Key Highlights
2. Pillars of Growth
3. Group Financial Highlights
4. Outlook
5. Appendices
4

Operational Highlights
Growth Pillar Summary:
> Demographics
X
Number of deaths down 0.3% on H1 2015
> Market share X IVC Group down slightly on H1 2015
> Average contract values Comparable per case funeral average up 2.7%
> Operating leverage Improved to 22% (up 30bps on H1 2015)
> Prepaid funeral
business
H1 2016 contracts sold up 7% on PCP
FUM up 7.4% from June 2015
5
Demographics
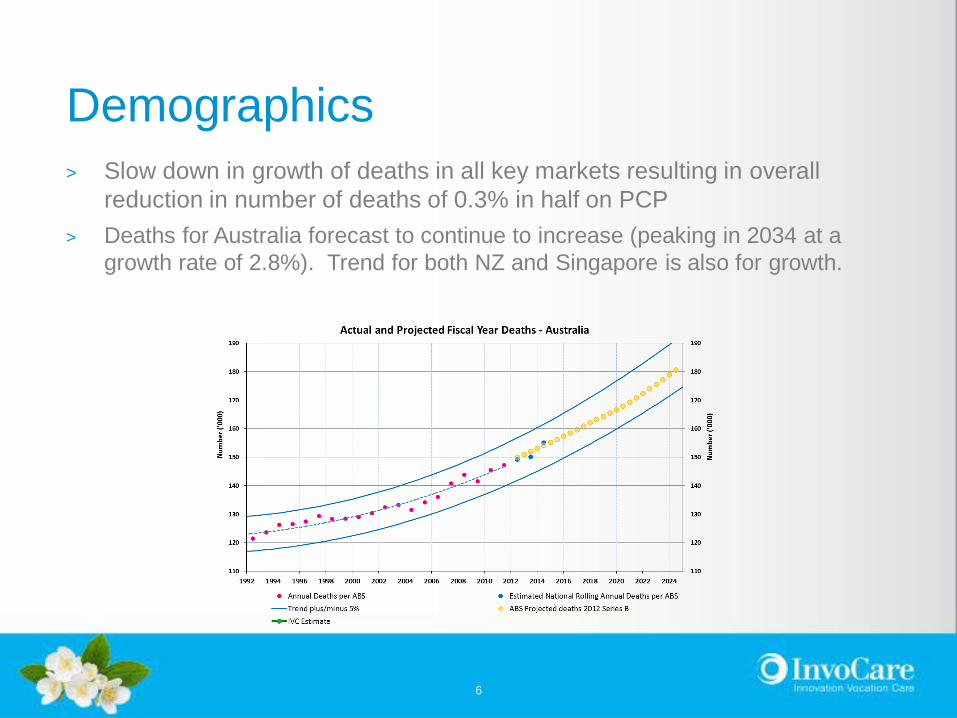
> Slow down in growth of deaths in all key markets resulting in overall
reduction in number of deaths of 0.3% in half on PCP
> Deaths for Australia forecast to continue to increase (peaking in 2034 at a
growth rate of 2.8%). Trend for both NZ and Singapore is also for growth.
6

Market Share
Total comparable Group H1 2016 market share dropped marginally in
IVC’s markets on PCP
> Australia small decline consistent with experience in previous low
death number periods (share circa 33%)
> New Zealand estimated remained relatively flat (at circa 30%) -
despite significant decrease in volume (but official Q2 death data not
yet available)
> Singapore down 90 bps (to circa 9.4%) - Smaller, more volatile and
highly competitive market. Decline represents 73 cases and, on
rolling 12 months basis (at 9.8%), is a reversion to more historical
market share levels.
> Profile of marketing spend smoothed this year to ensure a strong
presence in Q3 and Q4
> Digital marketing focus has contributed to website traffic increase (by
21% on PCP) generating quality leads
7

Case Average
Funeral case averages in comparable business increased by 2.7% across all
regions, which in local currency were:
> Australia up 2.7%
> Brand and state mix shifts have reduced average below overall average price
increases of 3.3% applied in December 2015
> Since January, Australian operations team has had success from a greater focus
on reducing number of direct cremation funerals
> New Zealand up 3.5%
> Singapore up 6.8% - continued success of sales packages
8

Operating leverage
> Group EBITDA to Sales margin increased to 22.0% from 21.7%
Australia remained unchanged at 22.5%
New Zealand improved to 18.0% from 14.6%
Singapore margin down to 46.5% from 47.9%
> To highlight strong underlying business performance EBITDA margin improvement
actually increased to 23.5% after backing out:
Corporate Office redundancies ($1.1m)
Project costs for key initiatives to create longer term value ($0.5m)
Option fees relating to possible future property sale ($0.6m- 2015: $0.1m)
9

Pre-Paid Funerals
Pre-paid funerals remains a core part of the business strategy, due to their
ability to lock in future market share and provide certainty on price.
The current level of pre-paid funerals as a percentage of total funerals
increased to 14.3% from 13.9% in PCP.
The performance of the business in securing pre-paid funerals has continued
to improve during H1 2016. Key date shown below:
> Pre paid funeral contracts in H1 2016 are up 7% on PCP
> Prepaid contract funds managed externally $439m ($408m at June 2015)
> New contracts exceeded redemptions by 21% (15% in PCP)
The performance of Funds Under Management is addressed later in the
presentation (See Section 3 - Group Financial Highlights).
10

Contents
1. 2016 Half Year – Key Highlights
2. Pillars of Growth
3. Group Financial Highlights
4. Outlook
5. Appendices
11

2016 Half Year – Key Highlights
Comparable Business Consolidated Business
Actual
2016
Variance to
2015
Variance to
2015
Actual
2016
Variance to
2015
Variance to
2015
Sales revenue $213.0m $5.4m 2.6% $214.5m $6.4m 3.1%
Other revenue $4.7m $0.9m 24.7% $4.8m $1.0m 26.2%
Operating expenses $168.7m $4.4m 2.7% $172.0m $5.3m 3.2%
EBITDA $49.0m $1.9m 4.0% $47.3m $2.1m 4.6%
Margin on sales 23.0% n/a +0.3% 22.0% n/a +0.3%
Operating earnings (after tax) $23.7m $2.6m 12.3% $21.6m $2.5m 13.2%
Net profit (after tax) $30.0m $9.4m 45.7% $27.8m $9.3m 50.6%
Operating EPS 21.7c 2.4c 12.4% 19.7c 2.3c 13.2%
EPS Basic 27.3c 8.5c 45.2% 25.4c 8.5c 50.3%
Dividend n/a n/a n/a 17.00c 1.25c 7.9%
12
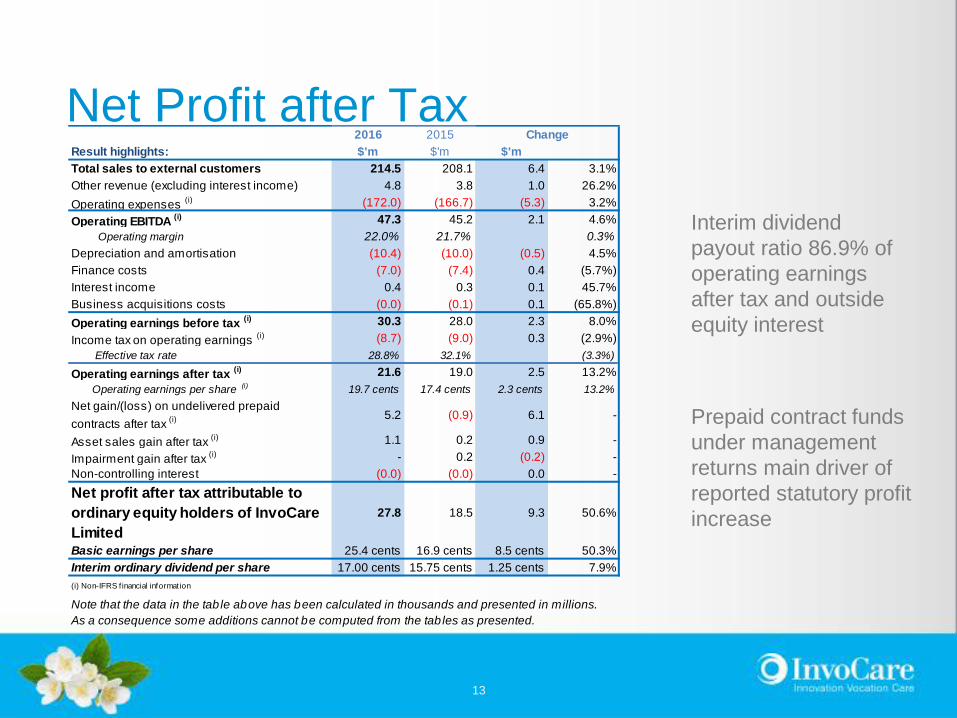
Net Profit after Tax
Interim dividend
payout ratio 86.9% of
operating earnings
after tax and outside
equity interest
Prepaid contract funds
under management
returns main driver of
reported statutory profit
increase
2016 2015
Result highlights: $'m $'m $'m
Total sales to external customers 214.5 208.1 6.4 3.1%
Other revenue (excluding interest income) 4.8 3.8 1.0 26.2%
Operating expenses (i) (172.0) (166.7) (5.3) 3.2%
Operating EBITDA (i) 47.3 45.2 2.1 4.6%
Operating margin 22.0% 21.7% 0.3%
Depreciation and amortisation (10.4) (10.0) (0.5) 4.5%
Finance costs (7.0) (7.4) 0.4 (5.7%)
Interest income 0.4 0.3 0.1 45.7%
Business acquisitions costs (0.0) (0.1) 0.1 (65.8%)
Operating earnings before tax (i) 30.3 28.0 2.3 8.0%
Income tax on operating earnings (i) (8.7) (9.0) 0.3 (2.9%)
Effective tax rate 28.8% 32.1% (3.3%)
Operating earnings after tax (i) 21.6 19.0 2.5 13.2%
Operating earnings per share (i) 19.7 cents 17.4 cents 2.3 cents 13.2%
Net gain/(loss) on undelivered prepaid
contracts after tax (i) 5.2 (0.9) 6.1 -
Asset sales gain after tax (i) 1.1 0.2 0.9 -
Impairment gain after tax (i) - 0.2 (0.2) -
Non-controlling interest (0.0) (0.0) 0.0 -
Net profit after tax attributable to
ordinary equity holders of InvoCare
Limited
27.8 18.5 9.3 50.6%
Basic earnings per share 25.4 cents 16.9 cents 8.5 cents 50.3%
Interim ordinary dividend per share 17.00 cents 15.75 cents 1.25 cents 7.9%
(i) Non-IFRS f inancial information
Change
Note that the data in the table above has been calculated in thousands and presented in millions.
As a consequence some additions cannot be computed from the tables as presented.
13

EBITDA components – total business
$'m
% of
Gross
Sales
$'m
% of
Gross
Sales
$'m %
Total - all lines of business
Sales Revenue 214.5 100.0% 208.1 100.0% 6.4 3.1%
Other revenue 4.8 2.2% 3.8 1.8% 1.0 26.3%
Expenses:
Cost of goods sold 60.0 28.0% 60.3 29.0% 0.3 0.6%
Personnel 75.3 35.1% 69.7 33.5% (5.6) (8.0%)
Advertising & promotions 8.7 4.1% 8.5 4.1% (0.2) (2.8%)
Occupancy & facility expenses 14.3 6.7% 14.2 6.8% (0.1) (0.6%)
Motor vehicle expenses 3.8 1.8% 4.2 2.0% 0.4 9.0%
Other expenses 9.9 4.6% 9.8 4.7% (0.1) (1.0%)
Operating expenses 172.0 80.2% 166.7 80.1% (5.3) (3.2%)
Operating EBITDA 47.3 22.0% 45.2 21.7% 2.1 4.6%
Operating margin % 22.0% 21.7% 0.3%
Note that the data in the table above has been calculated in thousands and displayed in millions. As a
consequence some additions cannot be computed from the tables as presented.
Variance
The EBITDA performance by major income statement line item for the total business is presented in
the next table.
2016 2015
Equivalent table for comparable business is included in Appendix A
14

Operating expenses
Operating expenses
> Overall up 3.2% or $5.3m to $172.0m (2015: $166.7m), including $3.3m
(2015: $2.4m) for non comparable businesses (mainly USA)
> Comparable up 2.7% or $4.4m to $168.7M (2015: $164.3m)
Cost of sales
> $60.0m (down 0.6% on 2015: $60.3m) comprised:
Funeral disbursements charged to families $31.6m (2015: $33.2m) - dropped due
to both case volume declines and customer disbursement spending patterns
Costs of product and merchandise sold $28.4m (2015: $27.2m)
– 13.2% of gross sales (2015: 13.1%)
– 15.5% of sales net of funeral disbursements (2015: 15.5%)
– Cemetery memorial sales and deliveries were a larger proportion of sales mix this half
following solid performance and, being lower margin product, has caused flat cost of
sales %
15

Operating expenses (cont’d)
Personnel costs
> Represent approx. 44% of operating expenses and included:
> Redundancy costs $1.1m in restructure of Corporate Office resourcing to better
service growing business needs
> Commencement of key longer term value creating projects $0.3m
> Excluding above items, personnel costs increased by 6.0% or $4.2m to
$73.9m (2015: $69.7m), comprising:
> Non-sales related payroll up 4.5% or $2.9m to $65.8m (2015: $62.9m)
Commenced curtailment of growth in this cost experienced over recent years
(eg. H1 2015 on H1 2014 was up 8.8%)
Rate increases generally up to 3.5% across Group
> Sales related payroll up 19.8% or $1.3m to $8.1m (2015: $6.7m)
Result of increased sales by cemeteries and crematoria
16

Operating expenses (cont’d)
Remaining operating expense line items
> Tightly managed and together less than $0.1m above PCP
> Excluding USA and NZ acquisitions, these items collectively were $0.7m
below PCP
Operating Leverage improved
> EBITDA margins improved by 0.3%
> Backing out unusual items shows strength of underlying business in
generating higher margin growth:
17

Other income statement items
Other revenue
> Up $1.0m to $4.8m (2015: $3.8m)
> Mainly comprises administration fees upon initial sale of prepaid funeral
contracts and trailing commissions on prepaid funds under management
> Also included non-refundable option fee of $0.6m received from a prospective
purchaser of a property owned by the Group (2015: $0.1m)
Depreciation and amortisation
> Up $0.4m to $10.4m (2015: $10.0m) - $0.1m of which increase is due to
higher amortisation of cemetery land due to increased sales of burial sites
during half year
> Comparable business up $0.3m to $10.2m (2015: $9.9m)
18

Other income statement items (cont’d)
Finance costs
> Down $0.4m to $7.0m (2015: $7.4m) with benefit of refinancing $85m of
facilities in December 2015 at lower margins and historically low prevailing
market rates
> Debt drawn from total $290m (2015: $255m) available facilities was $252m at
30 June 2016 (Dec 2015 - $232m; Jun 2015 - $242m)
> Effective overall interest rate, inclusive of swaps, fees and margins, at 30
June 2016 was 5.0% (Dec 2015 & Jun 2015 - 5.4%)
> Floating to fixed interest rate swaps cover 58% of drawn debt (2015: 72%)
> Covenant ratios comfortably met – leverage ratio 2.2 (must be no greater
than 3.5) and interest cover 8.9 (must be greater than 3.0)
> Headroom on debt facilities $38m and available cash $12m provide $50m at
30 June 2016 to fund near term growth opportunities
19

Other income statement items (cont’d)
Undelivered prepaid contracts
June 2016 June 2015
P&L impacts of undelivered contracts:
FUM earnings 14.5m 6.4m
Service delivery liability increase (7.0m) (7.7m)
Net pre-tax gain/(loss) on undelivered contracts $7.5m ($1.3m)
Total FUM $438.7m $408.3m
% in equities 15% 12%
% in property 27% 26%
% in cash & fixed interest 58% 62%
> FUM mark to market creates volatility in IVC’s reported profit
> Property investment revaluations major contributor to improved FUM earnings
> H2 earnings not expected to be as strong
20

Other income statement items (cont’d)
Gain on asset sales
> Asset sale gains up $0.9m (after tax) on PCP to $1.1m
Income Tax
> Income tax on reported profit $10.9m (2015: $8.9m)
> Effective rate 28% down from 32% in PCP due to impacts including prior
period adjustments, taxation treatment of New Zealand foreign exchange
movements and, in relation to asset sales, reversal of deferred tax and
utilisation of previously unrecognised capital losses
21
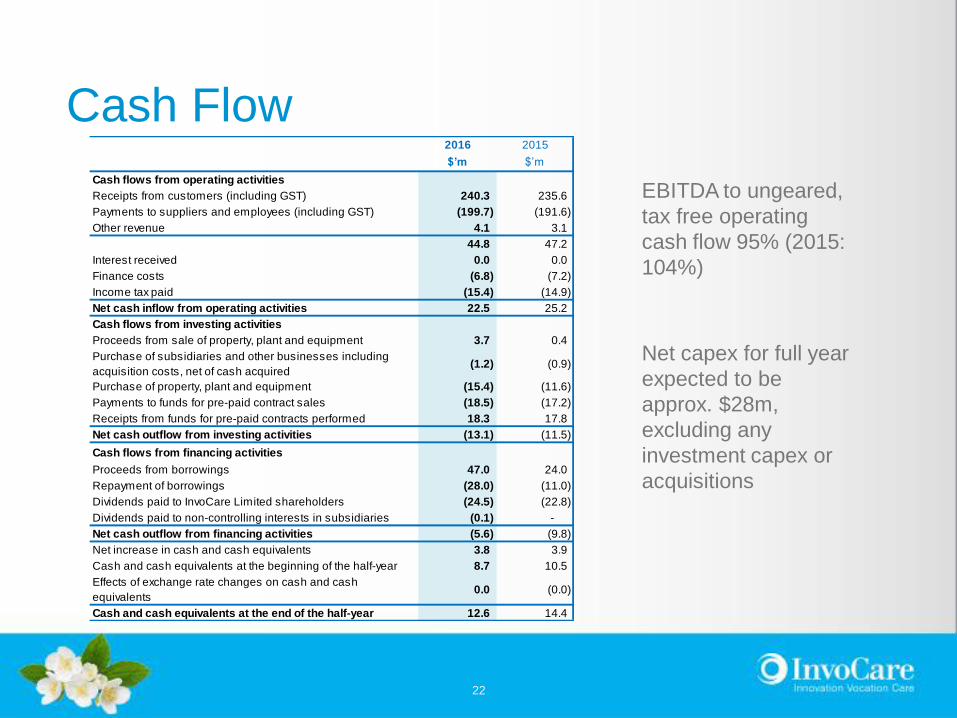
Cash Flow
EBITDA to ungeared,
tax free operating
cash flow 95% (2015:
104%)
Net capex for full year
expected to be
approx. $28m,
excluding any
investment capex or
acquisitions
2016 2015
$’m $’m
Cash flows from operating activities
Receipts from customers (including GST) 240.3 235.6
Payments to suppliers and employees (including GST) (199.7) (191.6)
Other revenue 4.1 3.1
44.8 47.2
Interest received 0.0 0.0
Finance costs (6.8) (7.2)
Income tax paid (15.4) (14.9)
Net cash inflow from operating activities 22.5 25.2
Cash flows from investing activities
Proceeds from sale of property, plant and equipment 3.7 0.4
Purchase of subsidiaries and other businesses including
acquisition costs, net of cash acquired(1.2) (0.9)
Purchase of property, plant and equipment (15.4) (11.6)
Payments to funds for pre-paid contract sales (18.5) (17.2)
Receipts from funds for pre-paid contracts performed 18.3 17.8
Net cash outflow from investing activities (13.1) (11.5)
Cash flows from financing activities
Proceeds from borrowings 47.0 24.0
Repayment of borrowings (28.0) (11.0)
Dividends paid to InvoCare Limited shareholders (24.5) (22.8)
Dividends paid to non-controlling interests in subsidiaries (0.1) -
Net cash outflow from financing activities (5.6) (9.8)
Net increase in cash and cash equivalents 3.8 3.9
Cash and cash equivalents at the beginning of the half-year 8.7 10.5
Effects of exchange rate changes on cash and cash
equivalents0.0 (0.0)
Cash and cash equivalents at the end of the half-year 12.6 14.4
22

Contents
1. 2016 Half Year – Key Highlights
2. Pillars of Growth
3. Group Financial Highlights
4. Outlook
5. Appendices
23

2016 H2 Outlook
IVC has modelled that lower deaths continue into second half of year
In response, a number of actions have been identified:
> Continue to focus on cost control (labour costs, general expenses including travel,
corporate costs etc)
> Implementation of revenue generating initiatives and incentive based sales targets
programs
Performance for full year 2016 will be subject to numbers of deaths, but
currently expect EBITDA percentage growth similar to H1 (ie. approx. 4.6%)
24

Longer Term Outlook
Continue work in 2016 and 2017 on key initiatives relating to:
> Standardising business systems and processes to increase efficiencies
> New business operations leader appointed
> ERP renewal project commenced
> Introducing more centralised procurement
> Increasing revenue from existing assets
> Launch funeral aggregator site
> Establish customer care centres
> Capital allocations, including network and brand optimisation review
> Reviewed Queensland and New Zealand
> First two small property refurbishment projects in Queensland approved
Further guidance on implications of these projects will be provided during 2017
Acquisitions fitting core strategy will continue to be pursued to drive growth
25

Contents
1. 2016 Half Year – Key Highlights
2. Pillars of Growth
3. Group Financial Highlights
4. Outlook
5. Appendices
26

Appendices - Contents
A. EBITDA Components – Comparable Business
B. Country Segment Results
C. Australia Results Summary
D. New Zealand Results Summary
E. Singapore Results Summary
F. Southern California, USA
27

Appendix A:
EBITDA components – Comparable Business
$'m
% of
Gross
Sales
$'m
% of
Gross
Sales
$'m %
Total - all lines of business
Sales Revenue 213.0 100.0% 207.6 100.0% 5.4 2.6%
Other revenue 4.7 2.2% 3.8 1.8% 0.9 24.7%
Expenses:
Cost of goods sold 60.1 28.2% 60.3 29.0% 0.2 0.3%
Personnel 73.8 34.6% 68.4 33.0% (5.4) (7.8%)
Advertising & promotions 7.6 3.6% 7.8 3.8% 0.2 2.4%
Occupancy & facility expenses 14.1 6.6% 14.2 6.8% 0.1 0.4%
Motor vehicle expenses 3.7 1.7% 4.1 2.0% 0.4 10.6%
Other expenses 9.5 4.4% 9.6 4.6% 0.1 0.8%
Operating expenses 168.7 79.2% 164.3 79.1% (4.4) (2.7%)
Operating EBITDA 49.0 23.0% 47.1 22.7% 1.9 4.0%
Operating margin % 23.0% 22.7% 0.3%
Note that the data in the table above has been calculated in thousands and presented in millions. As a
consequence some additions cannot be computed from the tables as presented.
Variance
The EBITDA performance by major income statement line item for the comparable business is presented in
the next table.
2016 2015
28

Appendix B:
Country Segment Results Summary 2016 2015
$'m $'m $'m %
Sales Revenue
Australia 184.6 178.1 6.5 3.6%
New Zealand 20.1 21.3 (1.3) (6.0%)
Singapore 8.4 8.2 0.2 2.7%
Comparable business 213.0 207.6 5.4 2.6%
USA & Acquisitions 1.5 0.5 1.0 199.6%
Total 214.5 208.1 6.4 3.1%
EBITDA
Australia 41.6 40.0 1.6 4.0%
New Zealand 3.5 3.1 0.3 10.2%
Singapore 3.9 3.9 (0.0) (0.3%)
Comparable business 49.0 47.1 1.9 4.0%
USA & Acquisitions (1.7) (1.9) 0.2 10.4%
Total 47.3 45.2 2.1 4.6%
Margin on sales
Australia 22.5% 22.5% -
New Zealand 17.3% 14.7% 2.6%
Singapore 46.5% 47.9% (1.4%)
Comparable business 23.0% 22.7% 0.3%
USA & Acquisitions (114.5%) (382.9%) -
Total 22.0% 21.7% 0.3%
The following table summarises sales revenue, EBITDA and margins by country segments.
Change
Note that the data in the table above has been calculated in thousands and displayed in millions. As a
consequence some additions cannot be computed from the tables as presented.
29

Appendix C:
Australia Results Summary
> Australia generates approx.
86% of Group sales and
88% of Group EBITDA
> Funerals impacted by case
volume declines, mitigated
by strong cemeteries &
crematoria result
> Tight management of costs
to maintain margins
2016 2015
$'m $'m $'m %
Australian Sales
Funerals 142.0 141.2 0.8 0.6%
Cemeteries & crematoria 48.6 42.5 6.1 14.3%
Intra-group elimination (6.0) (5.6) (0.4) 7.5%
Total Australia 184.6 178.1 6.5 3.6%
Australian EBITDA 41.6 40.0 1.6 4.0%
Margin on sales 22.5% 22.5% 0.0%
Change
30

Appendix C:
Australia Results Summary (cont’d)
At-need funerals sales
> Sales up 0.6% to $142.0m (2015:$141.2m)
> Case volumes down 1.6%
Number of deaths down overall in IVC markets by estimated 0.3%
Market share marginally down
> Average revenue per funeral case up 2.7% (excluding disbursements and
delivered prepaid impacts) - estimated $2.9m sales impact
Price increases averaging 3.3%
State and brand mix shifts – eg. Traditional down, Simplicity/Value up
No committal services remained flat, arresting previous increases
Dual/single service mix shifts stabilised
31

Appendix C:
Australia Results Summary (cont’d)
Cemeteries and crematoria sales
> Sales up 14.3% to $48.6m (2015: $42.5m)
> At-need cremation and burial case volumes down 1.5%
> Memorial sales strong:
Higher numbers of larger value contracts, in part attributable to stronger sales
team management
Park development activity (opening up new areas, introducing new memorial
products)
32

Appendix D:
New Zealand Results Summary
> Comparable sales down 3.4% to NZD21.7m (2015: NZD22.5m)
> Funeral case volumes down 4.1%
> NZ Q2 2016 death data yet to be published, but based on data up to end Q2 IVC
estimates deaths in its NZ markets are down over 4%
> Market share estimated to be relatively flat
> Average revenue per funeral case up 3.5% (excluding disbursements and
delivered prepaid impacts)
> Case averages impacted by increasing customer demand for lower cost offerings
(which Simplicity successfully meets)
> Tight cost control, particularly payroll and marketing, have contributed to margin
improvement
> Memorial parks acquired in July 2015 generated sales NZD1.0m and EBITDA
NZD0.3m, in line with expectations
33

Appendix E:
Singapore Results Summary
> Sales down 1.5% to SGD8.5m (2015: SGD8.6m)
> Case volumes down 8.3%
Number of deaths up slightly half on half, or up 1.4% for rolling 12m
Market share down 90bps half on half, or down 20bps on rolling 12m
Volume and share eroded by next largest competitor action
> Average revenue per funeral case up 6.8%, with continued success of
packaging
> Margin slight decline to 46.5% from 47.9%, impacted by case volumes below
expectations
34

Appendix F:
Southern California, USA
> Funeral operations commenced February 2015
> Sales USD0.7m (2015: USD0.4m)
> Funeral cases 351 – case average USD950
> Cremation cases 1,173 – case average USD245
> Change in Q2 to focus on volume and brand awareness strategies
> Call tracking initiatives implemented to enhance digital marketing efforts and
improve call conversion rates
> Positive customer reaction to, and satisfaction with, mobile arranger concept
> EBITDA loss in H1 USD1.4m (2015: USD1.5m)
> Targeting under USD1.0m EBITDA loss in H2 as continue to gain further
valuable insights and develop strategies to serve growing numbers of digital
consumers
35

Disclaimer
This presentation contains forward looking statements, which may be subject
to significant uncertainties outside of IVC’s control. No representation is made
as to the accuracy or reliability of these forecasts or the assumptions on which
they are based. Actual future events may vary from these forecasts.
36