investor presentation - kimberly-clark€¦ · leading the world in essentials for a better life...
TRANSCRIPT
Leading the World in Essentials for a Better Life
Investor
Presentation Financial Information
as of December 31, 2014
www.kimberly-clark.com
• $20 billion global company founded in 1872
• Products used by one-quarter of world’s population
• Strong legacy of innovation – created 5 of the 8 major product
categories in which we compete
• Products sold in more than 175 countries
• #1 or #2 position in 80 countries
• Strong global brands, including five billion-dollar brands:
2
Highlights
3
Our Values
Authentic: Our heritage is one of honesty, integrity and doing
the right thing
Accountable: We take ownership for our business and our future
Innovative: Our commitment is to new ideas that add value
Caring: We respect each other and care for the communities
where we live and work
• Sustainability 2015 vision built around a framework of People,
Planet and Products
– Engage with people to build enduring relationships
– Respect our planet and conserve its resources
– Deliver quality products today and for generations to come
• Visit www.kimberly-clark.com/sustainability for information on
our sustainability strategy and performance
4
Commitment to Sustainability
A Trusted Brand…Yesterday, Today and Tomorrow
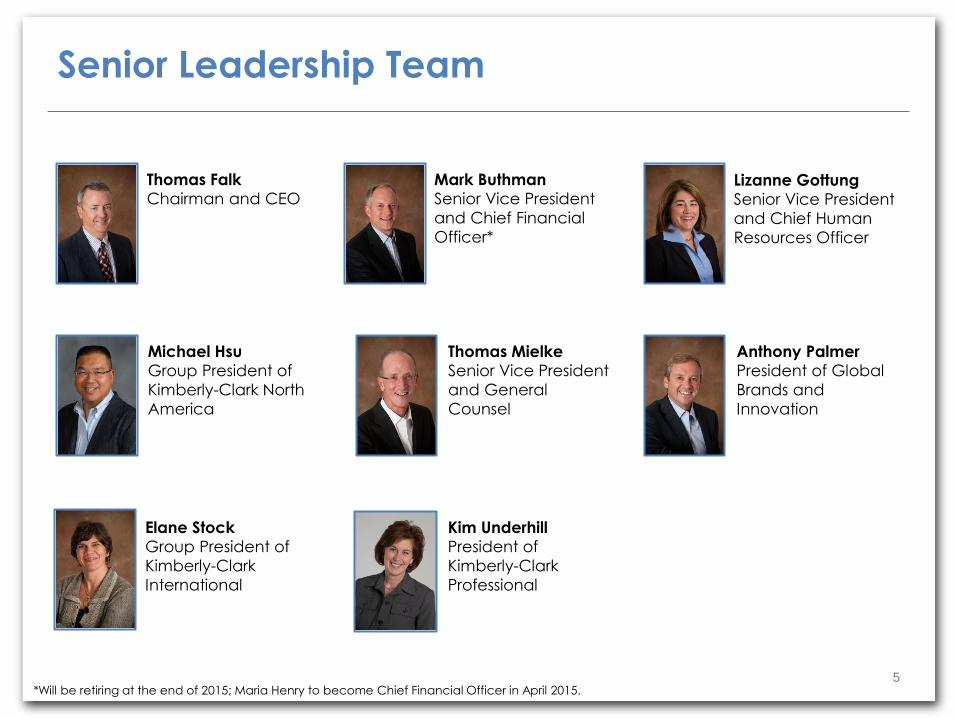
5
Senior Leadership Team
Mark Buthman
Senior Vice President
and Chief Financial
Officer*
Anthony Palmer
President of Global
Brands and
Innovation
Lizanne Gottung
Senior Vice President
and Chief Human
Resources Officer
Thomas Mielke
Senior Vice President
and General
Counsel
Thomas Falk
Chairman and CEO
Kim Underhill
President of
Kimberly-Clark
Professional
Michael Hsu
Group President of
Kimberly-Clark North
America
Elane Stock
Group President of
Kimberly-Clark
International
*Will be retiring at the end of 2015; Maria Henry to become Chief Financial Officer in April 2015.
6
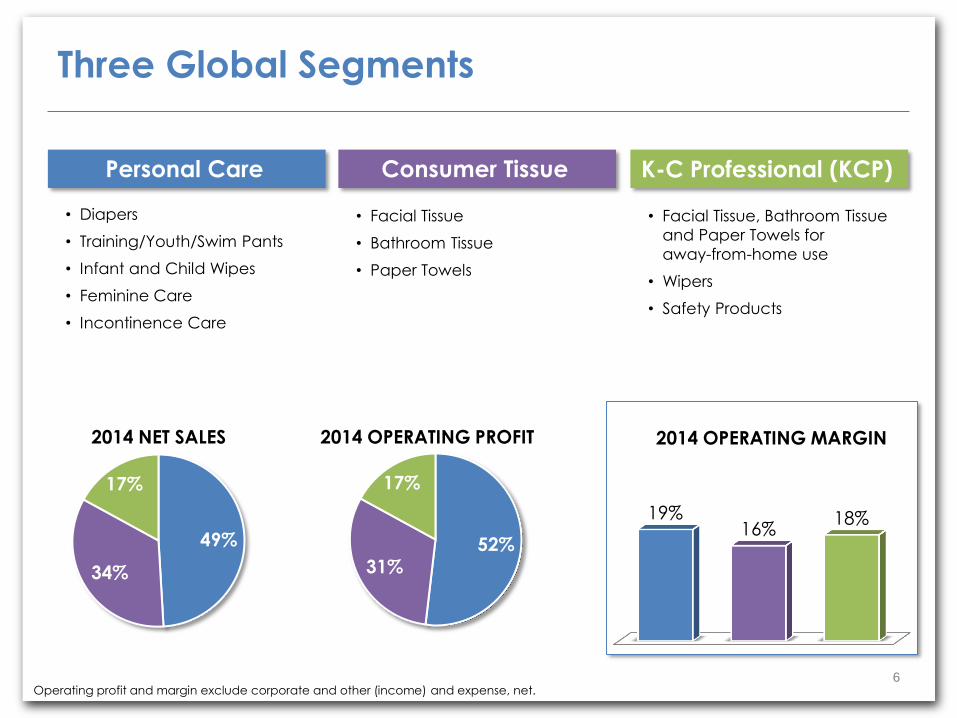
Three Global Segments
49%
34%
17%
2014 NET SALES
52% 31%
17%
2014 OPERATING PROFIT
Operating profit and margin exclude corporate and other (income) and expense, net.
Personal Care Consumer Tissue K-C Professional (KCP)
• Diapers
• Training/Youth/Swim Pants
• Infant and Child Wipes
• Feminine Care
• Incontinence Care
• Facial Tissue
• Bathroom Tissue
• Paper Towels
• Facial Tissue, Bathroom Tissue
and Paper Towels for
away-from-home use
• Wipers
• Safety Products
19% 16%
18%
2014 OPERATING MARGIN
7
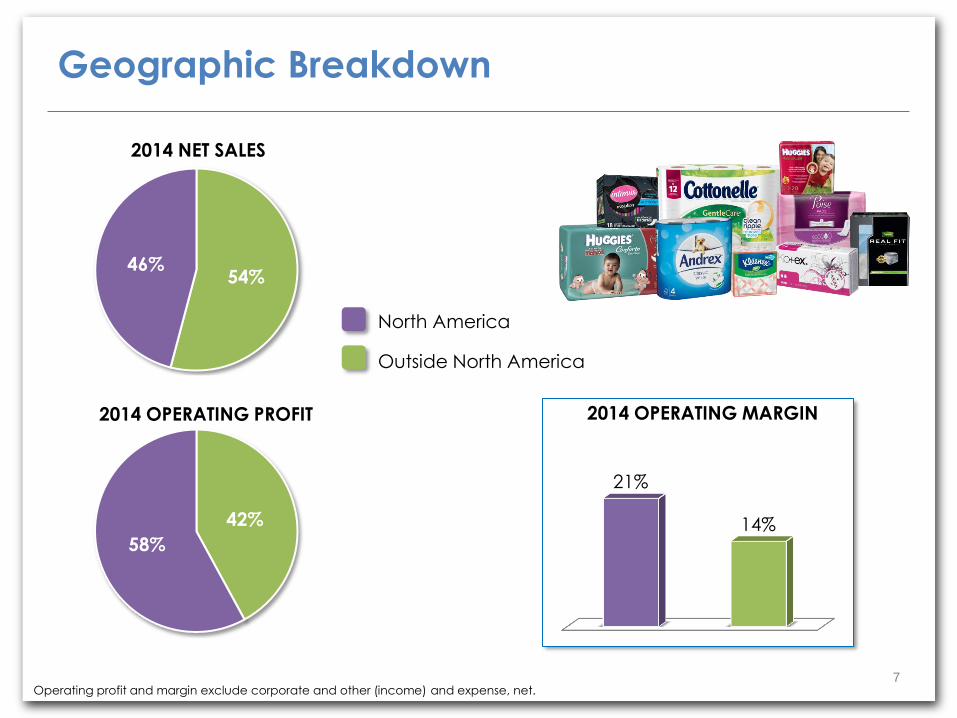
Geographic Breakdown
54% 46%
2014 NET SALES
42%
58%
2014 OPERATING PROFIT
Operating profit and margin exclude corporate and other (income) and expense, net.
21%
14%
2014 OPERATING MARGIN
North America
Outside North America
• GBP is our strategic plan that prioritizes growth opportunities
and applies greater financial discipline to our operations
– Launched in mid-2003 and designed to generate sustainable
growth and improved shareholder returns
• GBP strategies
– Manage portfolio to balance growth, profitability, cash flow
– Invest in brands, innovation, growth initiatives
– Deliver sustainable cost reduction
– Disciplined capital management to improve
ROIC and return cash to shareholders
8
Global Business Plan (GBP)
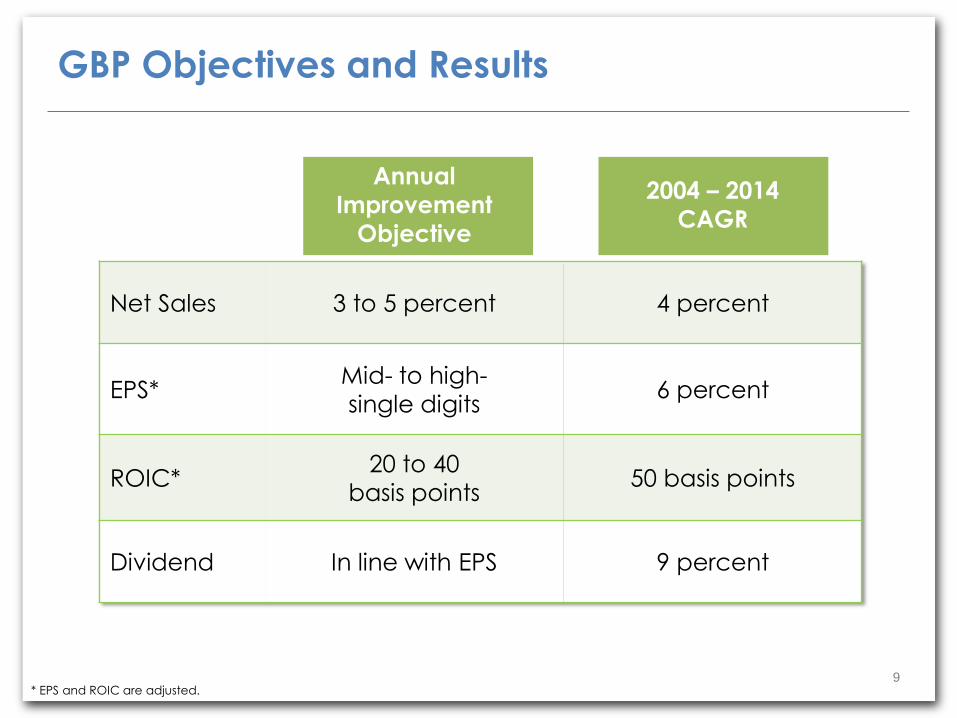
Annual
Improvement
Objective
2004 – 2014
CAGR
Net Sales 3 to 5 percent 4 percent
EPS* Mid- to high-
single digits 6 percent
ROIC* 20 to 40
basis points 50 basis points
Dividend In line with EPS 9 percent
9
GBP Objectives and Results
* EPS and ROIC are adjusted.
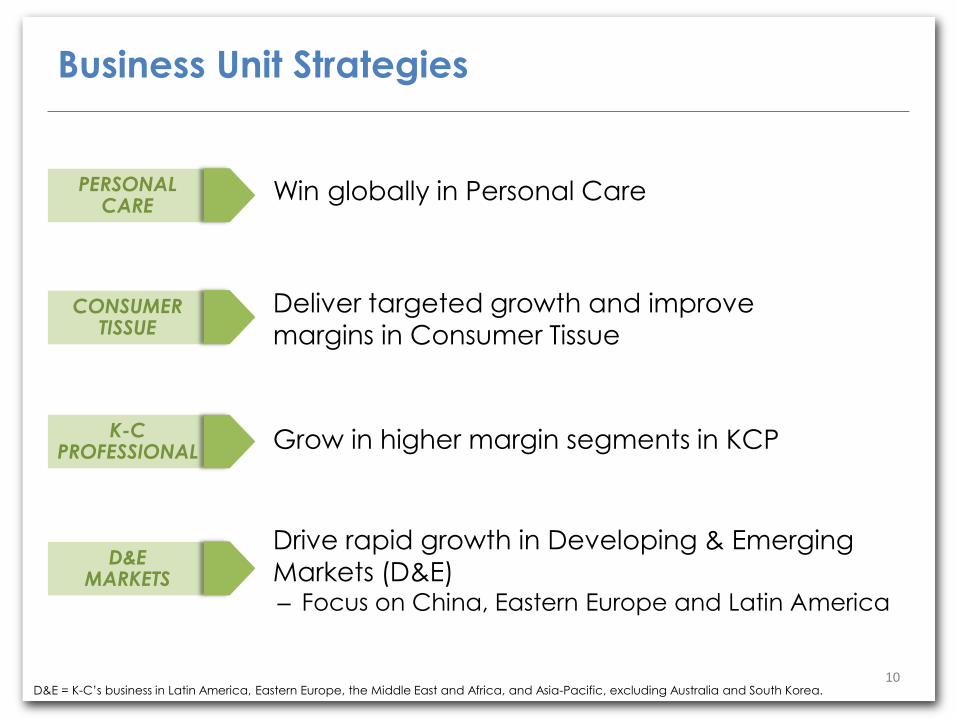
Drive rapid growth in Developing & Emerging
Markets (D&E) – Focus on China, Eastern Europe and Latin America
D&E MARKETS
Deliver targeted growth and improve margins in Consumer Tissue
10
Business Unit Strategies
Win globally in Personal Care
Grow in higher margin segments in KCP K-C PROFESSIONAL
CONSUMER TISSUE
PERSONAL CARE
D&E = K-C’s business in Latin America, Eastern Europe, the Middle East and Africa, and Asia-Pacific, excluding Australia and South Korea.
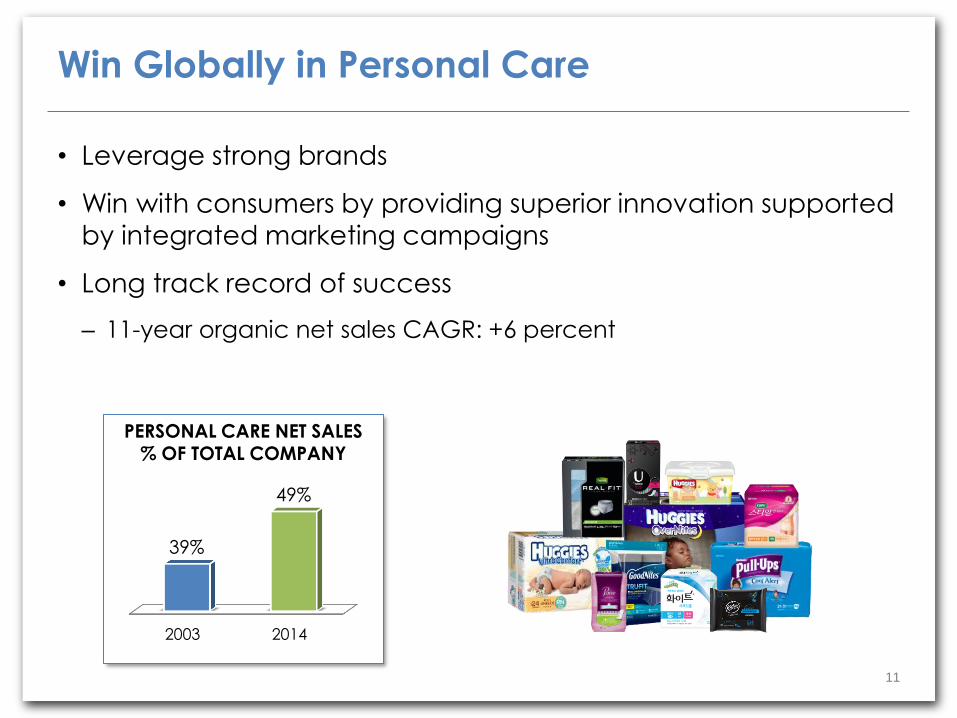
• Leverage strong brands
• Win with consumers by providing superior innovation supported by integrated marketing campaigns
• Long track record of success
– 11-year organic net sales CAGR: +6 percent
11
Win Globally in Personal Care
2003 2014
39%
49%
PERSONAL CARE NET SALES % OF TOTAL COMPANY
12
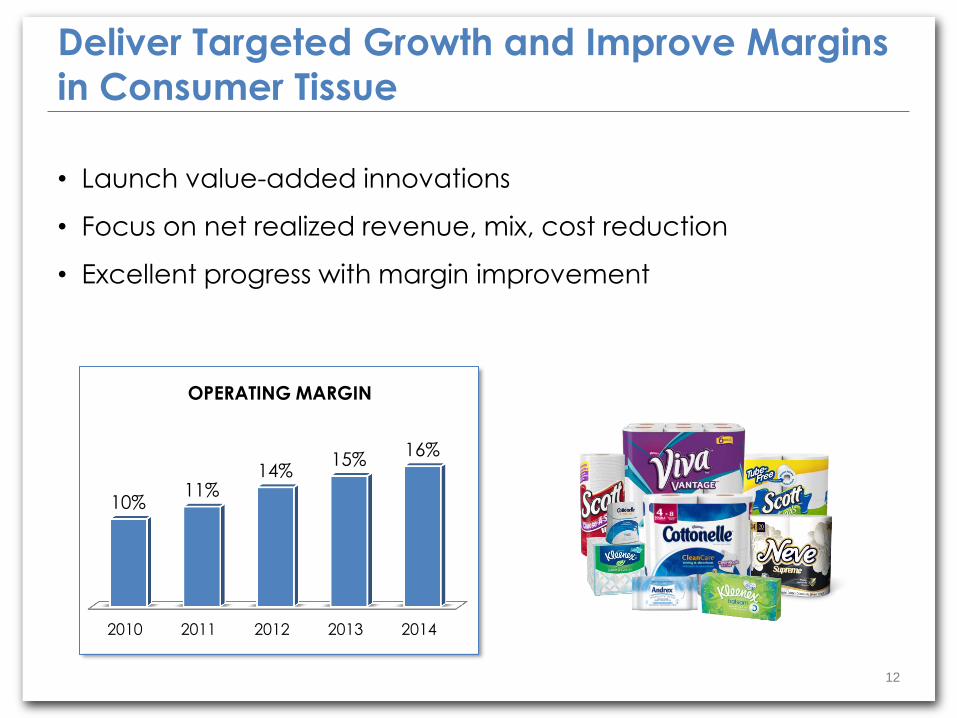
Deliver Targeted Growth and Improve Margins
in Consumer Tissue
• Launch value-added innovations
• Focus on net realized revenue, mix, cost reduction
• Excellent progress with margin improvement
2010 2011 2012 2013 2014
10% 11%
14% 15%
16%
OPERATING MARGIN
13
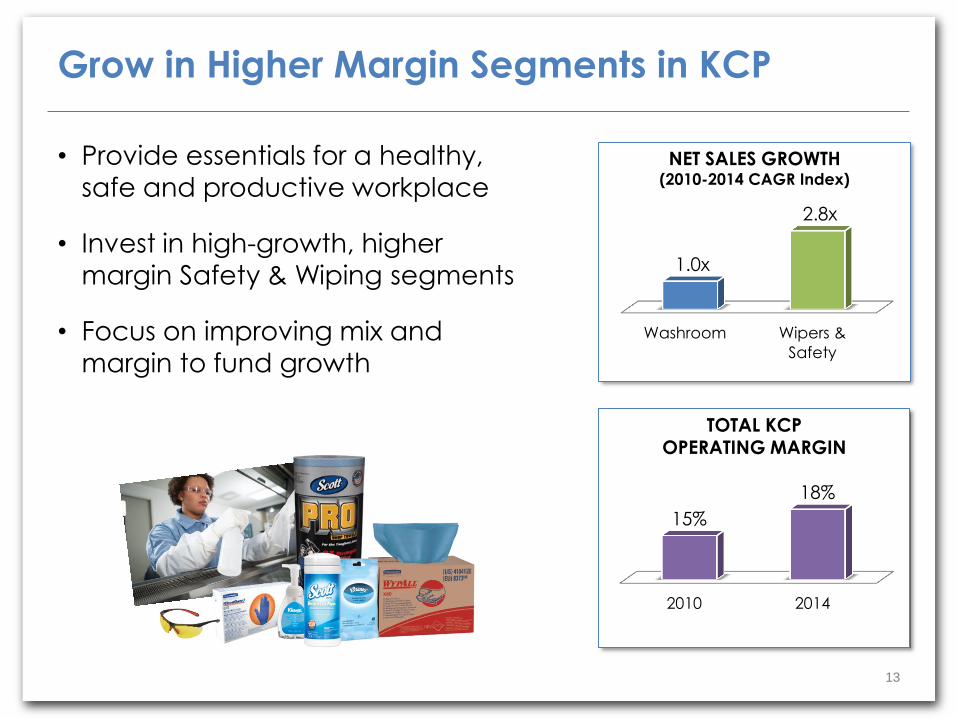
Grow in Higher Margin Segments in KCP
• Provide essentials for a healthy,
safe and productive workplace
• Invest in high-growth, higher
margin Safety & Wiping segments
• Focus on improving mix and margin to fund growth
Washroom Wipers &
Safety
1.0x
2.8x
NET SALES GROWTH (2010-2014 CAGR Index)
2010 2014
15%
18%
TOTAL KCP OPERATING MARGIN
14
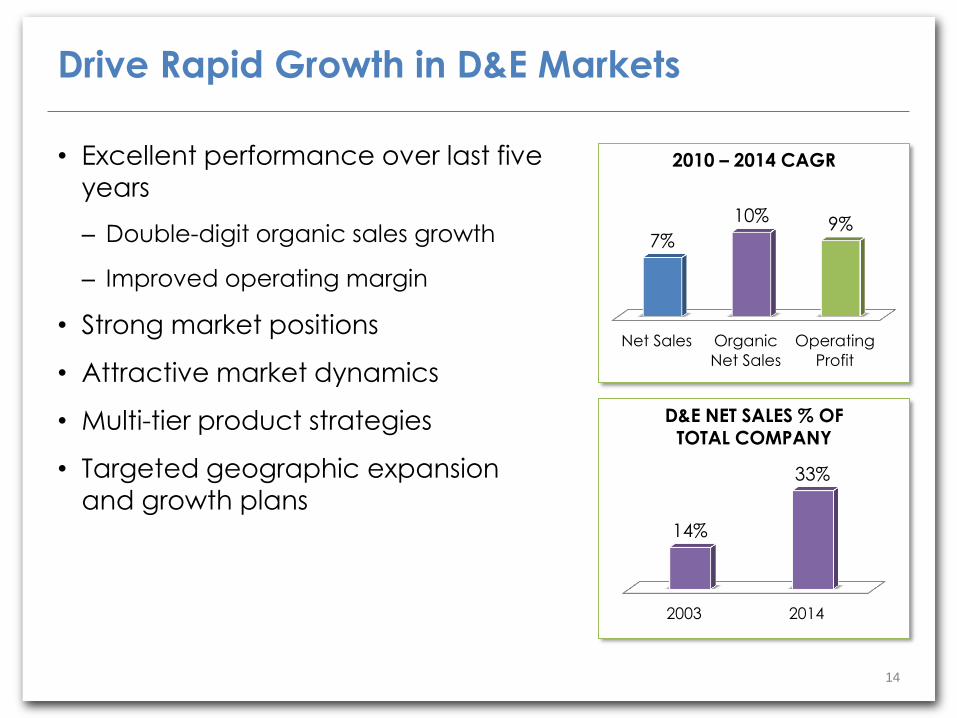
Drive Rapid Growth in D&E Markets
• Excellent performance over last five
years
– Double-digit organic sales growth
– Improved operating margin
• Strong market positions
• Attractive market dynamics
• Multi-tier product strategies
• Targeted geographic expansion
and growth plans
Net Sales Organic
Net Sales
Operating
Profit
7%
10% 9%
2003 2014
14%
33%
2010 – 2014 CAGR
D&E NET SALES % OF TOTAL COMPANY
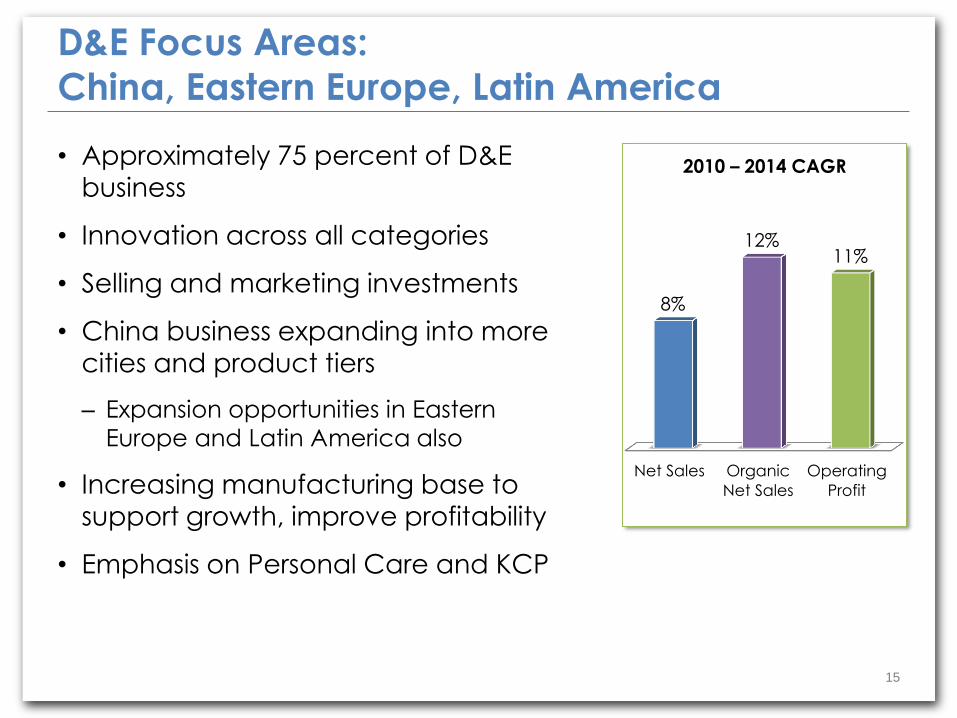
• Approximately 75 percent of D&E
business
• Innovation across all categories
• Selling and marketing investments
• China business expanding into more cities and product tiers
– Expansion opportunities in Eastern
Europe and Latin America also
• Increasing manufacturing base to
support growth, improve profitability
• Emphasis on Personal Care and KCP
15
D&E Focus Areas:
China, Eastern Europe, Latin America
Net Sales Organic
Net Sales
Operating
Profit
8%
12% 11%
2010 – 2014 CAGR
2003 2014
18%
41%
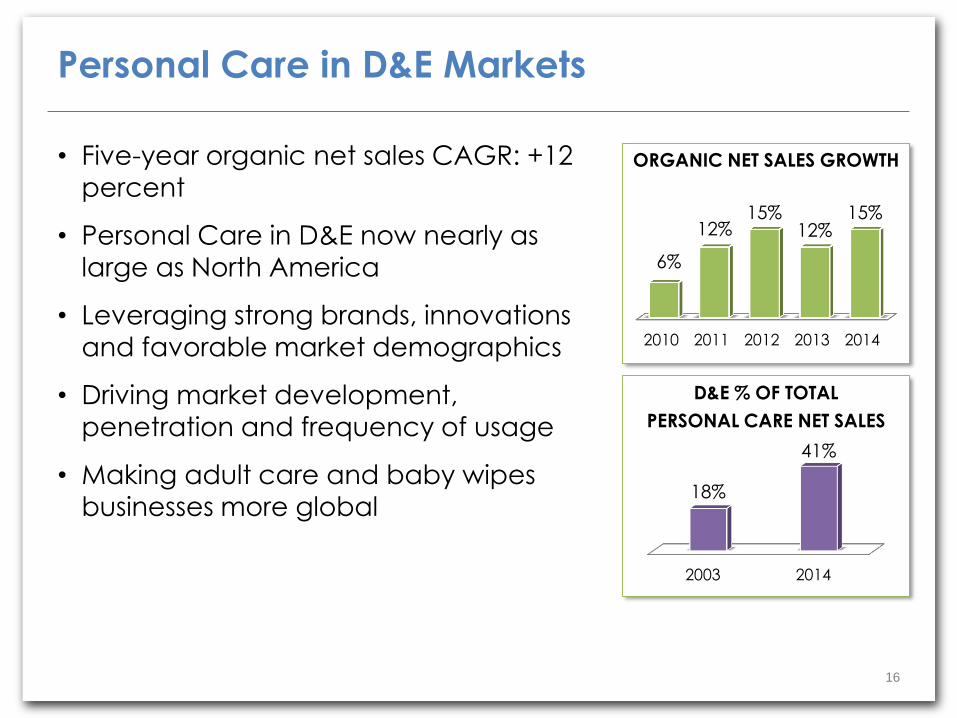
• Five-year organic net sales CAGR: +12
percent
• Personal Care in D&E now nearly as
large as North America
• Leveraging strong brands, innovations and favorable market demographics
• Driving market development,
penetration and frequency of usage
• Making adult care and baby wipes
businesses more global
16
Personal Care in D&E Markets
D&E % OF TOTAL
PERSONAL CARE NET SALES
2010 2011 2012 2013 2014
6%
12% 15%
12% 15%
ORGANIC NET SALES GROWTH
17
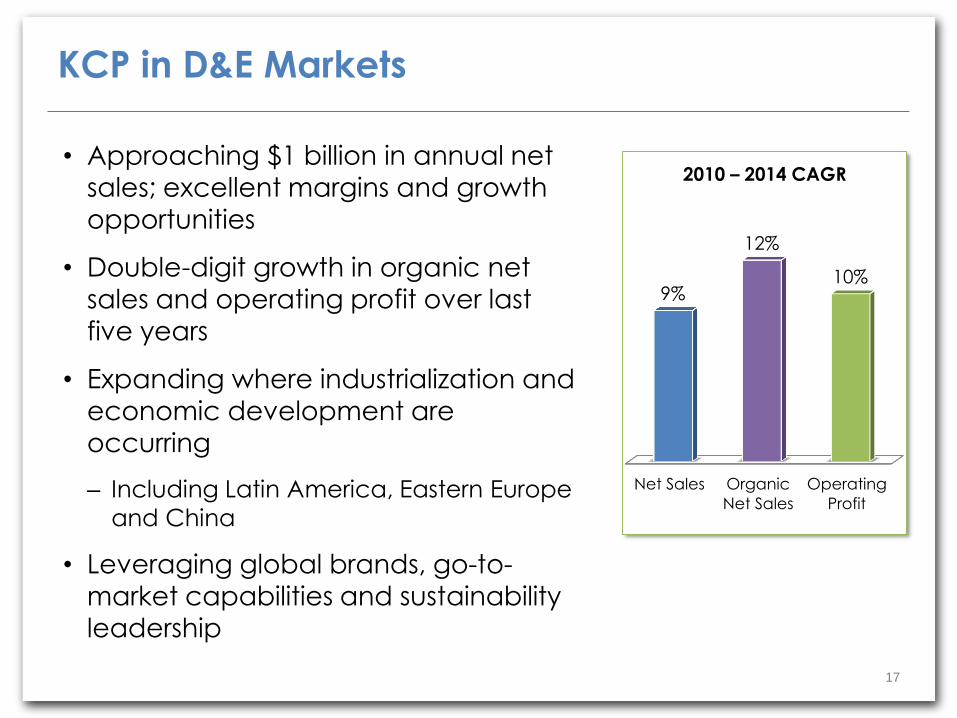
KCP in D&E Markets
• Approaching $1 billion in annual net
sales; excellent margins and growth opportunities
• Double-digit growth in organic net
sales and operating profit over last
five years
• Expanding where industrialization and
economic development are
occurring
– Including Latin America, Eastern Europe
and China
• Leveraging global brands, go-to-
market capabilities and sustainability leadership
Net Sales Organic
Net Sales
Operating
Profit
9%
12%
10%
2010 – 2014 CAGR
• Pulp & Tissue Restructuring (2011 – 2012)
– Exited remaining integrated pulp operations; streamlined tissue
manufacturing; $100 million cumulative operating profit benefit
• European Strategic Changes (2012 – 2014)
– Exited diaper category in most of Western/Central Europe and
some other lower margin or slower growing businesses
– 2014 consumer business margins up 300 basis points versus 2012
• Health Care Spin-off Creating Halyard Health, Inc. (2014)
– Allows Halyard to optimize performance and flexibility to pursue
value-creation opportunities
– Further sharpens K-C’s focus on growing consumer and KCP
brands
18
Recent Portfolio Changes
• Announced October 2014
• Will offset impact of stranded overhead costs from health care business spin-off and improve efficiency
• More flexibility to invest in brands, targeted growth initiatives,
capabilities
• Anticipated workforce reductions 1,100 to 1,300
• Expected financial impacts
– After-tax costs $130 to $160 million by end of 2016
– Pre-tax savings $120 to $140 million by end of 2017
• Further evidence of financial and cost discipline
19
2014 Organization Restructuring
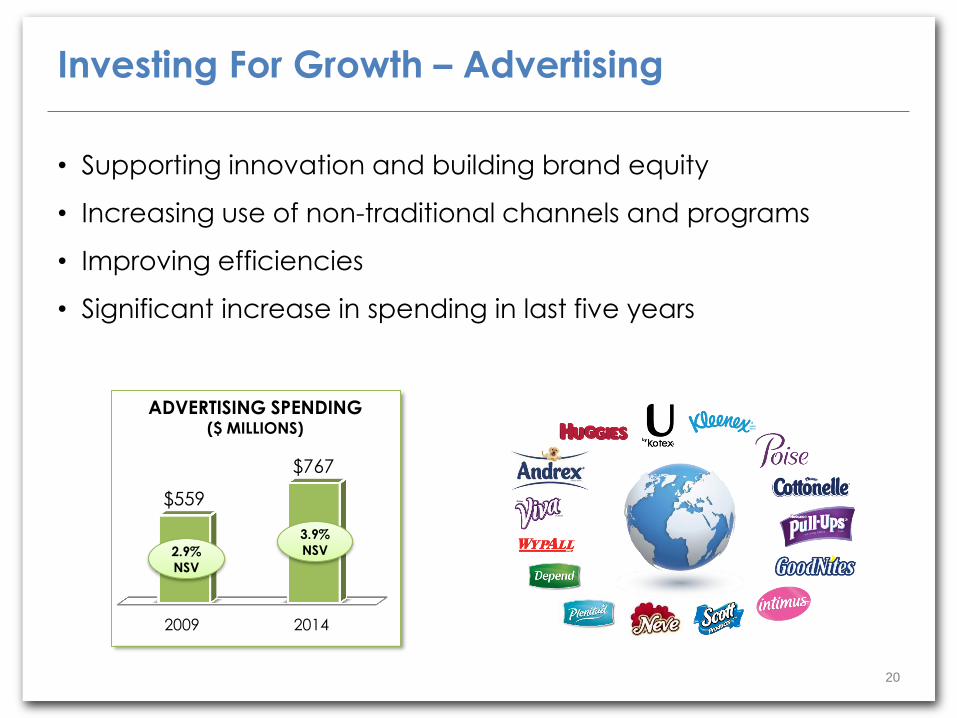
• Supporting innovation and building brand equity
• Increasing use of non-traditional channels and programs
• Improving efficiencies
• Significant increase in spending in last five years
20
Investing For Growth – Advertising
2009 2014
$559
$767
2.9%
NSV
3.9%
NSV
ADVERTISING SPENDING ($ MILLIONS)
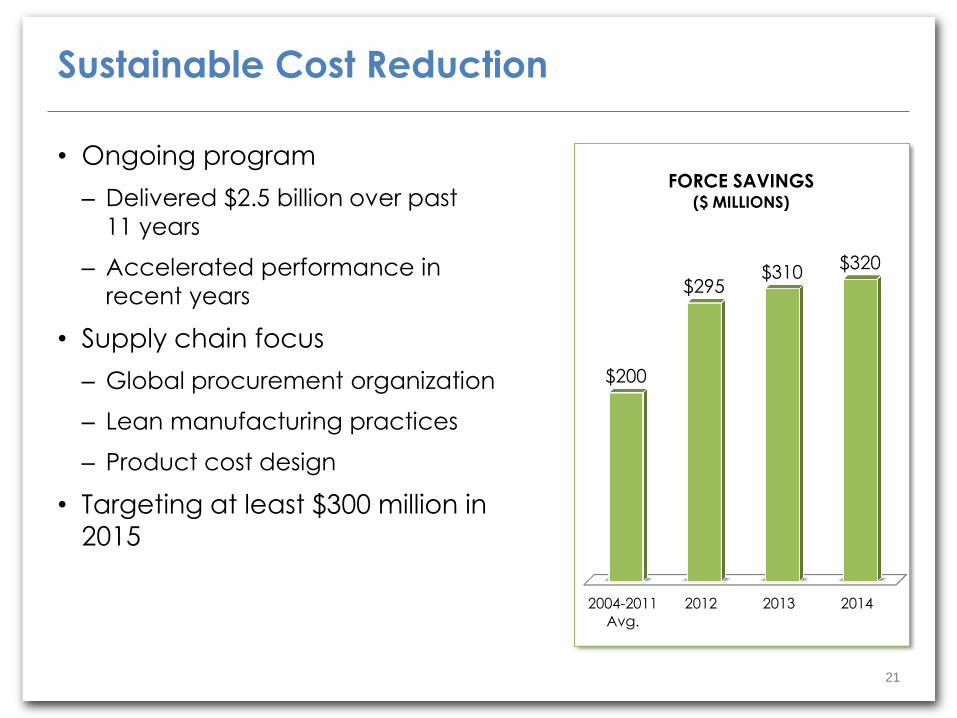
• Ongoing program
– Delivered $2.5 billion over past
11 years
– Accelerated performance in
recent years
• Supply chain focus
– Global procurement organization
– Lean manufacturing practices
– Product cost design
• Targeting at least $300 million in
2015
21
Sustainable Cost Reduction
2004-2011
Avg.
2012 2013 2014
$200
$295 $310
$320
FORCE SAVINGS ($ MILLIONS)
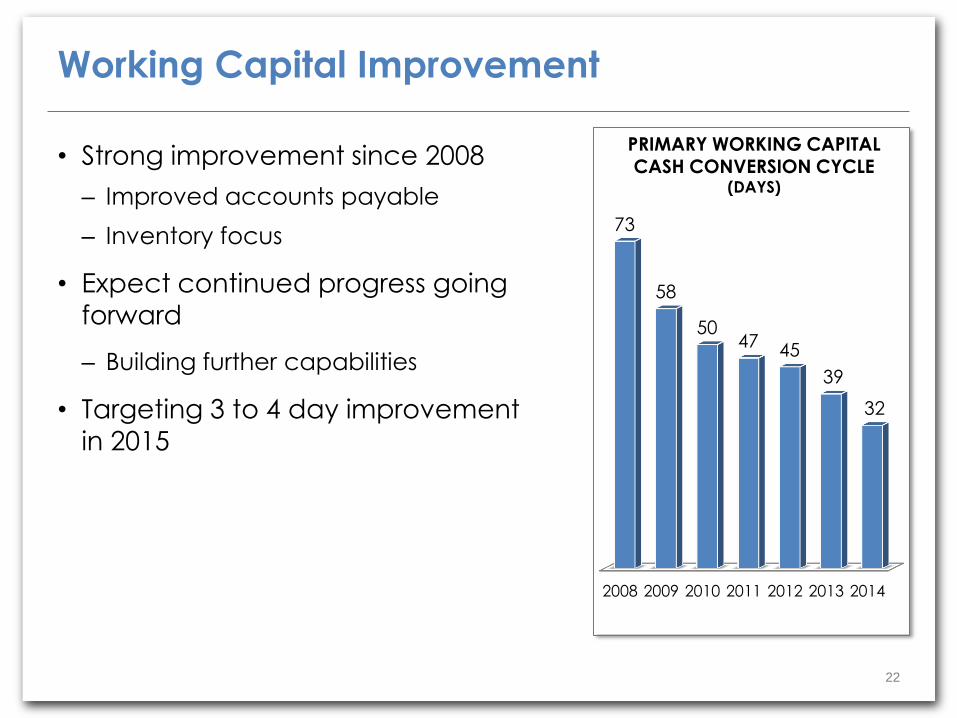
• Strong improvement since 2008
– Improved accounts payable
– Inventory focus
• Expect continued progress going
forward
– Building further capabilities
• Targeting 3 to 4 day improvement
in 2015
22
Working Capital Improvement
2008 2009 2010 2011 2012 2013 2014
73
58
50 47
45
39
32
PRIMARY WORKING CAPITAL CASH CONVERSION CYCLE
(DAYS)
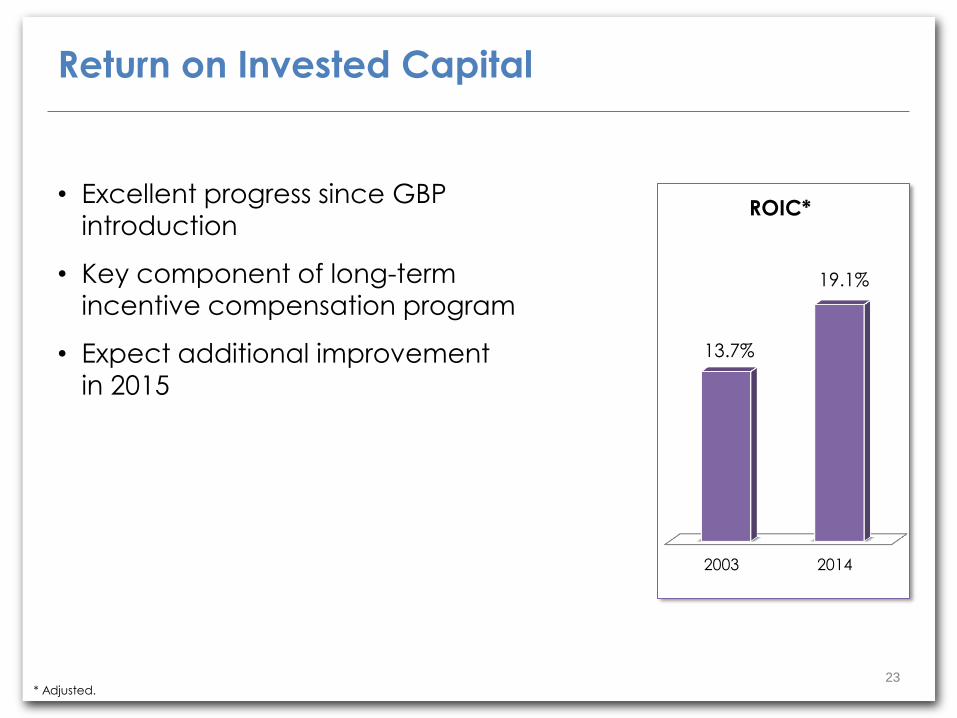
• Excellent progress since GBP introduction
• Key component of long-term
incentive compensation program
• Expect additional improvement
in 2015
23
Return on Invested Capital
* Adjusted.
2003 2014
ROIC*
19.1%
13.7%
• Maintain ‘A’ credit rating and balance sheet flexibility
• Fund business needs (growth, innovation, cost savings)
– Capital spending 4.5 to 5.5 percent of net sales
• Grow dividend
– Top-tier payout in Consumer Packaged Goods industry
• Consider M&A
– Not core part of growth strategy
• Return excess cash to shareholders via
share repurchases
24
Capital Allocation Strategy
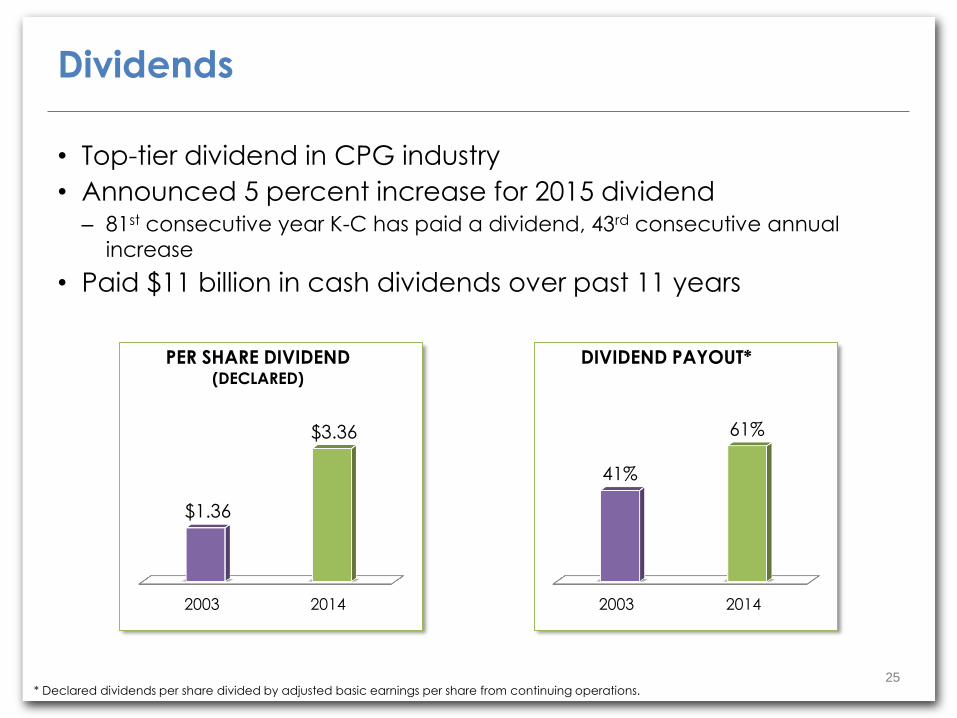
• Top-tier dividend in CPG industry
• Announced 5 percent increase for 2015 dividend – 81st consecutive year K-C has paid a dividend, 43rd consecutive annual
increase
• Paid $11 billion in cash dividends over past 11 years
25
Dividends
* Declared dividends per share divided by adjusted basic earnings per share from continuing operations.
2003 2014
41%
61%
DIVIDEND PAYOUT*
2003 2014
$1.36
$3.36
PER SHARE DIVIDEND (DECLARED)
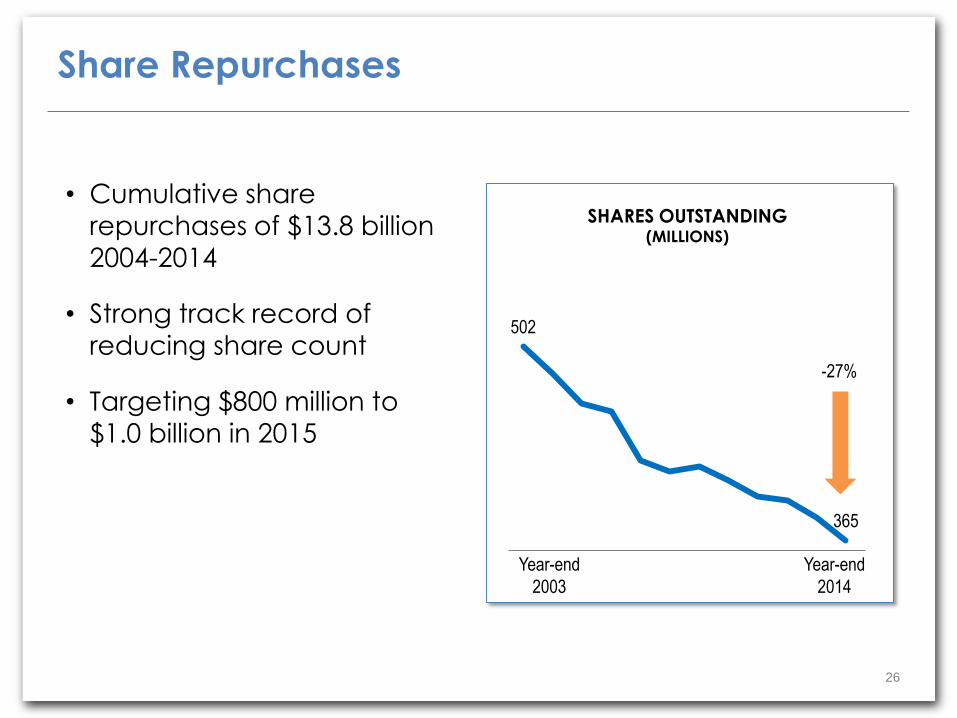
• Cumulative share repurchases of $13.8 billion
2004-2014
• Strong track record of reducing share count
• Targeting $800 million to
$1.0 billion in 2015
26
Share Repurchases
502
365
SHARES OUTSTANDING (MILLIONS)
-27%
Year-end
2014
Year-end
2003
27
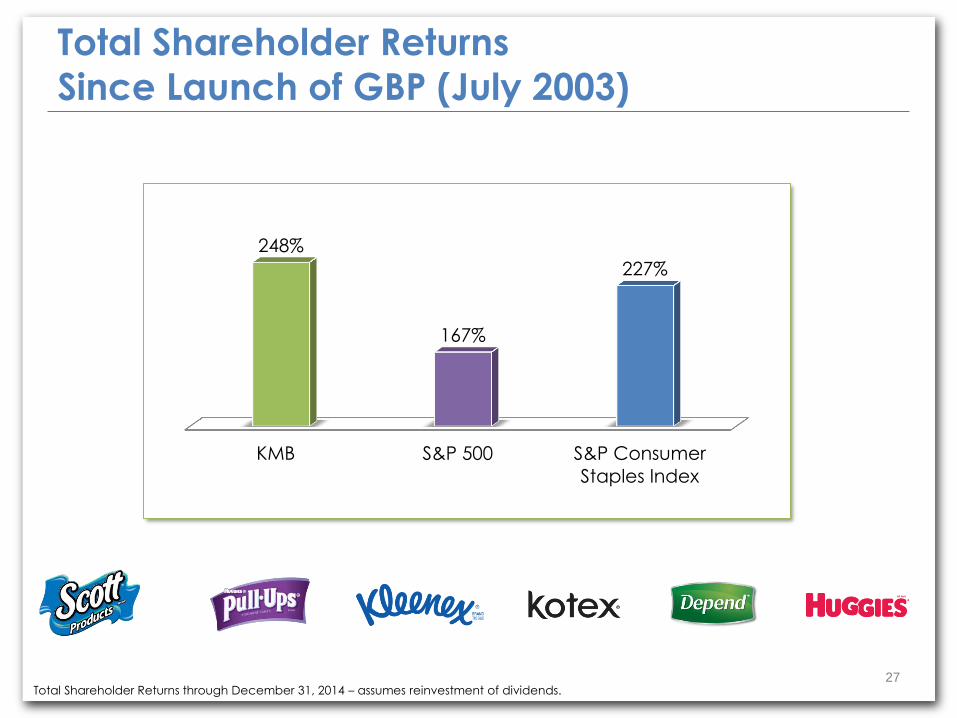
Total Shareholder Returns
Since Launch of GBP (July 2003)
Total Shareholder Returns through December 31, 2014 – assumes reinvestment of dividends.
KMB S&P 500 S&P Consumer
Staples Index
248%
167%
227%
• Contact Investor Relations with your questions
– Paul Alexander, Vice President at (972) 281-1440
• Visit www.kimberly-clark.com/investors to view our annual
report, SEC filings or news releases
• To obtain copies of our 2014 Annual Report on Form 10-K, SEC
filings or news releases, call (800) 639-1352
28
To Learn More About Kimberly-Clark
Forward-Looking Information
Certain matters in this presentation, including our 2015 outlook, expectations and planning assumptions,
and any estimates, projections, and statements relating to our business plans, strategies or objectives,
constitute forward-looking statements and are based upon management’s expectations and beliefs
concerning future events impacting the company. These statements are subject to risks and
uncertainties, including currency rates and exchange risks, cost savings and reductions, raw material,
energy, and other input costs, competition, market demand and economic and political conditions and
the anticipated costs, scope, timing and financial and other effects of the 2014 organization
restructuring. There can be no assurance that these future events will occur as anticipated or that the
company’s results will be as estimated. Furthermore, unless otherwise specifically indicated, forward-
looking statements contained in this presentation are based on our fourth quarter 2014 earnings
communication which occurred on January 23, 2015. Forward-looking statements speak only as of the
date they were made, and we undertake no obligation to publicly update any of these statements. For
a description of certain factors that could cause the company’s future results to differ materially from
those expressed in any such forward-looking statements, see Item 1A of the company’s Annual Report
on Form 10-K for the year ended December 31, 2014 entitled “Risk Factors.”
Non-GAAP Financial Measures
This presentation contains some financial measures that have been adjusted to exclude certain items
and differ from reported results using Generally Accepted Accounting Principles (GAAP). Management
believes that reporting in this manner enhances investors’ understanding and analysis of the company’s
performance. Organic net sales exclude the impact of changes in foreign currency exchange rates and
lower sales as a result of portfolio changes. For additional information on why we make these
adjustments and reconciliations to comparable measures under GAAP, see the supplemental
information posted to the Investors section of our website (www.kimberly-clark.com/investors).
29
Safe Harbor Statement