investor presentation may2021
TRANSCRIPT

INVESTOR PRESENTATION
MAY 2021

Holly Energy Partners (NYSE: HEP) 2
Safe Harbor Disclosure Statement
Statements made during the course of this presentation that are not historical facts are “forward-looking statements” within the meaning of the U.S. Private
Securities Litigation Reform Act of 1995. Words such as “anticipate,” “project,” “expect,” “plan,” “goal,” “forecast,” “intend,” “should,” “would,” “could,”
“believe,” “may,” and similar expressions and statements regarding our plans and objectives for future operations are intended to identify forward-looking
statements. Forward-looking statements are inherently uncertain and necessarily involve risks that may affect the business prospects and performance of
HollyFrontier Corporation (“HollyFrontier”) and/or Holly Energy Partners, L.P., and actual results may differ materially from those discussed during the
presentation. These statements are based on management’s beliefs and assumptions using currently available information and expectations as of the date
hereof, are not guarantees of future performance and involve certain risk and uncertainties. Such risks and uncertainties include, but are not limited to, the
extraordinary market environment and effects of the COVID-19 pandemic, including a significant decline in demand for refined petroleum products in markets
HollyFrontier and Holly Energy Partners serve, risks and uncertainties with respect to the actions of actual or potential competitive suppliers and transporters of
refined petroleum products in HollyFrontier’s and Holly Energy Partners’ markets, the spread between market prices for refined products and market prices for
crude oil, the possibility of constraints on the transportation of refined products, the possibility of inefficiencies, curtailments or shutdowns in refinery
operations or pipelines, whether due to infection in the workforce or in response to reductions in demand, effects of current and future governmental
regulations and policies, including the effects of current and future restrictions on various commercial and economic activities in response to the COVID-19
pandemic, the availability and cost of financing to HollyFrontier and Holly Energy Partners, the effectiveness of HollyFrontier’s and Holly Energy Partners’ capital
investments and marketing strategies, HollyFrontier's and Holly Energy Partners’ efficiency in carrying out and consummating construction projects, including
HollyFrontier or Holly Energy Partners’ ability to complete announced capital projects, such as the conversion of the Cheyenne Refinery to a renewable diesel
facility and the construction of the Artesia renewable diesel unit and pretreatment unit, on time and within budget; HollyFrontier or Holly Energy Partners’
ability to timely obtain or maintain permits, including those necessary for operations or capital projects; HollyFrontier's ability to acquire refined or lubricant
product operations or pipeline and terminal operations on acceptable terms and to integrate any existing or future acquired operations, the possibility of
terrorist attacks and the consequences of any such attacks, pandemic or outbreak of infectious disease, the impact of recent or proposed changes in tax laws
and regulations that affect master limited partnerships, general economic conditions, including uncertainty regarding the timing, pace and extent of an
economic recovery in the United States; and continued deterioration in gross margins or a prolonged economic slowdown due to COVID-19 could result in an
impairment of goodwill and / or additional long-lived asset impairments. Additional information on risks and uncertainties that could affect the business
prospects and performance of HollyFrontier and Holly Energy Partners is provided in the most recent reports of HollyFrontier and Holly Energy Partners filed
with the Securities and Exchange Commission. All forward-looking statements included in this presentation are expressly qualified in their entirety by the
foregoing cautionary statements. The forward-looking statements speak only as of the date hereof and, other than as required by law, HollyFrontier and Holly
Energy Partners undertake no obligation to publicly update or revise any forward-looking statements, whether as a result of new information, future events or
otherwise.

Holly Energy Partners (NYSE: HEP)
Holly Energy Partners Company Profile
STABLE
EARNINGS
FINANCIAL
TARGETS &
GUIDANCE
BALANCE
SHEET
HIGHLIGHTS
• Revenues are nearly 100% fee-based with de minimis commodity risk
• Customer base consisting of refining companies (contracts not with E&Ps)
• Minimum Volume Commitments (MVCs) comprise over 75% of total revenue1
• Substantially all MVC revenues tied to PPI and/or FERC
COMPANY
OVERVIEW(NYSE: HEP)
• Maintain Balance Sheet flexibility
• Operate within free cash flow while reducing leverage
• HEP Corporate Credit Ratings: S&P BB+, Moody’s Ba2, Fitch BB+
• A system of petroleum product and crude pipelines, storage tanks, distribution terminals, loading racks and processing units located at or near HollyFrontier Corporation’s refining assets in high growth markets
• Assets strategically located in core growth areas of Permian, Rockies, and Mid-Continent
• 57% owned by refining parent HollyFrontier Corporation (NYSE:HFC)
• Target distribution coverage of at least 1.3x (2x as of YE20)
• Target leverage: 3.0-3.5x (4x as of YE20)
• Self-funding model to cover all capital expenditures and distributions with cash flow from operations
• Maintain distribution of $1.40 per unit for 2021
31) Per HEP 2020 10-K.

Holly Energy Partners (NYSE: HEP) 4
Minimum Volume Commitments
MVC Contract Renewal Schedule2
10-15 years = typical contract lengths with HFC
6 years = weighted-average remaining contract duration
2022 = next notable 3rd Party renewal on UNEV Pipeline
(UNEV 3rd Party = 2% of 2020 Total Revenue)
80% of MVC contracts expire 2024 or later
Inflation Escalators as % of Total Revenue1 MVC Contract Profile
MVCs as % of 2020 Total Revenue1
1) Per HEP 2020 10-K, based on FY2020 total revenue of $498 million.2) As of December 31, 2020.
PPI65%
FERC30%
Other 5%
$0
$10
$20
$30
$40
$50
$60
$70
$80
$90
$100
'21 '22 '23 '24 '25 '26 '27 '28 '29 '30 '31
Rev
enu
es $
(in
mill
ion
s)
HFC 3rd Party
HFC70%
3rd Party6%
Non-MVC24%

Holly Energy Partners (NYSE: HEP) 5
Historical Leverage and Coverage Ratios
• Long-term coverage target of at least 1.3x
• Majority of contracts tied to MVCs provides coverage cushion
• Free cash flow after distributions1 to fund maintenance and growth capex while deleveraging
• Averaged 4.0x leverage since 2005
• Visible path to leverage target of 3.0-3.5x
• Conservative annual capital need ($49-61 million in 2021)
3.63.3
2.7
5.1
3.9 4.0 4.04.5
4.2 4.1 4.34.5
4.14.3
4.1 4.0
0.0x
1.0x
2.0x
3.0x
4.0x
5.0x
6.0x
'05 '06 '07 '08 '09 '10 '11 '12 '13 '14 '15 '16 '17 '18 '19 '20
Leverage Ratio
1.21.1 1.1
1.21.1 1.1 1.0
1.2
1.01.1 1.1
1.11.0 1.0 1.0
2.0
0.0x
0.2x
0.4x
0.6x
0.8x
1.0x
1.2x
1.4x
1.6x
1.8x
2.0x
'05 '06 '07 '08 '09 '10 '11 '12 '13 '14 '15 '16 '17 '18 '19 '20
Coverage Ratio
1) See definitions page in Appendix.

Holly Energy Partners (NYSE: HEP)
HEP Financial Strength
Reimbursable$15-20mm
Maintenance$10-15mm
Expansion$40-50mm
HEP Capital Structure ($ millions) 3/31/2021
Revolver Capacity (matures 7/2022) $1,400
Revolver Borrowings $(896)
Revolver Availability $504
$20Cash
Total Liquidity $524
5.00% Senior Notes due 2028 $500
Revolver Borrowings $896
Total HEP Debt $1,396
TTM Adjusted EBITDA1 $349
Debt/TTM Adjusted EBITDA1 3.98x
6
Credit Ratings
HEP Corporate S&P BB+ Moody’s Ba2 Fitch BB+
HFC Corporate Investment Grade Ratings S&P BBB- Moody’s Baa3 Fitch BBB-
*strong parent credit rating that represents significant revenues for HEP
1) See definitions page in Appendix.

Holly Energy Partners (NYSE: HEP) 7
Distributable Cash Flow / LP Unit Since Inception
$1.35 $1.47 $1.58
$1.85
$1.98 $2.06
$2.20
$2.75
$2.52
$2.94
$3.36
$3.65
$3.46
$2.52 $2.57 $2.68
$-
$0.50
$1.00
$1.50
$2.00
$2.50
$3.00
$3.50
$4.00
2005 2006 2007 2008 2009 2010 2011 2012 2013 2014 2015 2016 2017 2018 2019 2020
Distributable Cash Flow per LP Unit1
1) See definitions page in Appendix. LP units outstanding are split adjusted reflecting HEP’s January 2013 two-for-one unit split. Amounts based on distributable cash flow earned during the period.
DCF/LP Unit
LP Units Outstanding
(in mil l ions)30.8 32.2 32.2 32.6 36.6 44.2 45.7 55.7 58.2 58.7 58.7 59.9 70.3 105.0 105.4
2013: public offering of HEP common units2017: IDR simplification 2018: private offering of HEP common units

Holly Energy Partners (NYSE: HEP)
HEP Capital Budget
2021 Capex Budget$49-61mm
Turnarounds$5-8mm
Maintenance$14-18mm
Expansion/JV Investment$30-35
8

Holly Energy Partners (NYSE: HEP) 9
HEP Avenues for Growth
ORGANIC EXTERNAL TRANSACTIONS DROPDOWNS FROM HFC
Leverage HEP’s existing footprint to capitalize on commercial opportunities
Contractual PPI/FERC escalators
Replace incumbent HFC service providers with HEP
Pursue logistics assets in HEP’s current geographic region
Replace incumbent HFC service providers with HEP
Leverage HFC refining and commercial footprint
Participate in expected MLP sector consolidation
Partnering with HFC to build and/or acquire new assets / businesses
Target high tax basis assets with durable cash flow characteristics that also add to HFC EBITDA
Example: Frontier Pipeline Expansion Example: Cushing Connect JV Example: El Dorado Processing Unit

Holly Energy Partners (NYSE: HEP) 10
Cushing Connect Joint Venture
Deal Highlights
JV estimated total capital of $130 million with expected initial EBITDA1
multiple of 8x-9x.
HEP to build and operate pipeline, PAA to build terminal connections
and operate terminal
HFC entered into 15 year minimum volume commitment of 100 KBPD
with HEP, which will commence upon completion of pipeline
Asset Description
HEP formed a 50/50 JV with Plains All American Pipeline, L.P. (PAA)
consisting of:
New build, 50-mile, 160 KBPD common carrier crude pipeline
from Cushing to Tulsa
1.5 million barrels of crude storage in Cushing
Terminal in-service 2Q2020
Pipeline anticipated in-service 3Q2021
Strategic Rationale
Generates HEP growth while providing long term control of a
strategic asset
Insources HFC’s logistics spend to HEP
New pipeline provides capability to supply 100% of HFC’s
Tulsa Refinery crude throughput
HFC El Dorado Refinery
Crude Capacity 160 KBPD
HFC Tulsa Refinery
Crude Capacity 140 KBPD
Plains Cushing Terminal System
Cushing Connect Pipeline JV
Osage Pipeline JV
1) See definitions page in Appendix.

Holly Energy Partners (NYSE: HEP)
100% interest
45.8mm HEP units1
43% LP interest$982M Value2
59.6mm HEP units1
57% LP interest$1,278M Value2
HOLLYFRONTIER CORPORATION (HFC)
GENERAL PARTNER (GP)HOLLY LOGISTIC SERVICES, L.L.C.
HOLLY ENERGYPARTNERS, L.P. (HEP)
PUBLIC
Non-economicGP Interest
HEP Ownership Structure
Eliminated IDRs in 2017 to simplify structure
111) Unit Count as of March 31, 2021.2) Based on HEP unit closing price on May 11, 2021.
Holly Energy Partners (NYSE: HEP) 12
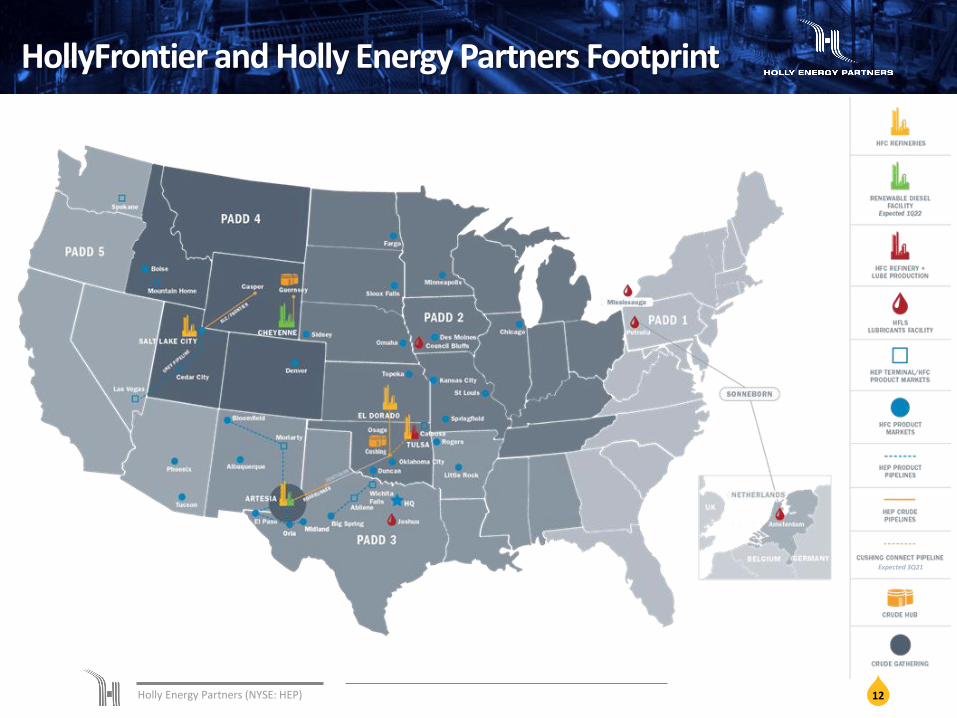
HollyFrontier and Holly Energy Partners Footprint
Expected 3Q21

Holly Energy Partners (NYSE: HEP) 13
HollyFrontier Business Segment Highlights
Financially Strong Investment Grade Parent Positioned for Value Creation Across all Segments
MIDSTREAM SPECIALTY LUBRICANTSREFINING RENEWABLES
Inland merchant refiner
4 refineries in the Mid-Continent, and West regions
Flexible refining system with fleet wide discount to WTI
Premium niche product markets versus Gulf Coast
Organic initiatives to drive growth and enhance returns
Disciplined capital structure & allocation
Operate crude and product pipelines, loading racks, terminals and tanks in and around HFC’s refining assets
HFC owns 57% of the LP Interest in HEP and the non-economic GP interest
Eliminated IDRs in 2017 to simplify structure
Over 75% of revenues tied to long term contracts and minimum volume commitments
Integrated specialty lubricants producer with 34,000 barrels per day of production capacity
Sells finished lubricants & products in >80 countries under Petro-Canada Lubricants, Sonneborn, Red Giant Oil & HollyFrontier product lines
Production facilities in Mississauga, Ontario; Tulsa, Oklahoma; Petrolia, Pennsylvania; & the Netherlands
One of the largest North American white oil & group III base oil producers
Construction of 9,000 BPD Renewable Diesel Unit at Artesia, NM Refinery expected to be completed in Q1 2022
Construction of 6,000 BPD Renewable Diesel Unit at Cheyenne, WY Refinery expected to be completed in Q1 2022
Construction of Pre-Treatment Unit providing feedstock flexibility expected to be completed in the first half of 2022

Holly Energy Partners (NYSE: HEP) 14
HEP Historical Growth
Committed to Continuing Successful Track Record of Growth
2004 2005 2006 2007 2008 2009
MLP IPO
(July 2004)
Holly intermediate
feedstock pipeline
dropdown
(July 2005)
25% JV with
Plains for
SLC pipeline
(Mar 2009)
Holly Tulsa
dropdown of
loading rack
(Tulsa West)
(Aug 2009)
Holly crude oil
and tankage
assets
dropdown
(Feb 2008)
Alon pipeline
and terminal
asset
acquisition
(Feb 2005)
Holly 16”
intermediate
pipeline
facilities
acquisition
(June 2009)
Tulsa East
acquisition &
Roadrunner /
Beeson
dropdown
(Dec 2009)
Sale of 70%
interest in Rio
Grande to
Enterprise
(Dec 2009)
2010
Purchase of
additional
Tulsa tanks
& racks and
Lovington rack
(Mar 2010)
2011
HFC
dropdown of
El Dorado &
Cheyenne
assets
(Nov 2011)
Holly South
Line expansion
project
(2007-2008)
Holly Corporation
and Frontier Oil
Corporation
complete merger
(July 2011)
2012
HEP purchases
75% interest in
UNEV from HFC
(July 2012)
Tulsa
interconnect
pipelines
(Aug 2011)
2013
Crude gathering
system expansion
(2014)
2014 2015 2016 2017
Acquired remaining
interests in SLC /
Frontier pipelines
(Oct 2017)
IDR
Simplification
(Oct 2017)
Purchase of
Tulsa West
Tanks
(March 2016)
HFC dropdown
of El Dorado
processing
units
(Nov 2015)
50% JV with
Plains for
Frontier
pipeline
(Aug 2015)
50% JV with
Plains for
Cheyenne
pipeline
(June 2016)
HFC
dropdown of
Woods Cross
processing
units
(Oct 2016)
Acquisition of
El Dorado
tank farm
(Mar 2015)
2018 2019
Constructed
Orla Truck
Rack
(Jan 2019)
Purchase of
Catoosa
Lubricants
Terminal
(June 2018)
HEP purchases
50% interest in
Osage from HFC
(Feb 2016)
50% JV with
Plains for
Cushing Connect
pipeline and
Cushing terminal
(October 2019)
Holly Energy Partners (NYSE: HEP) 15
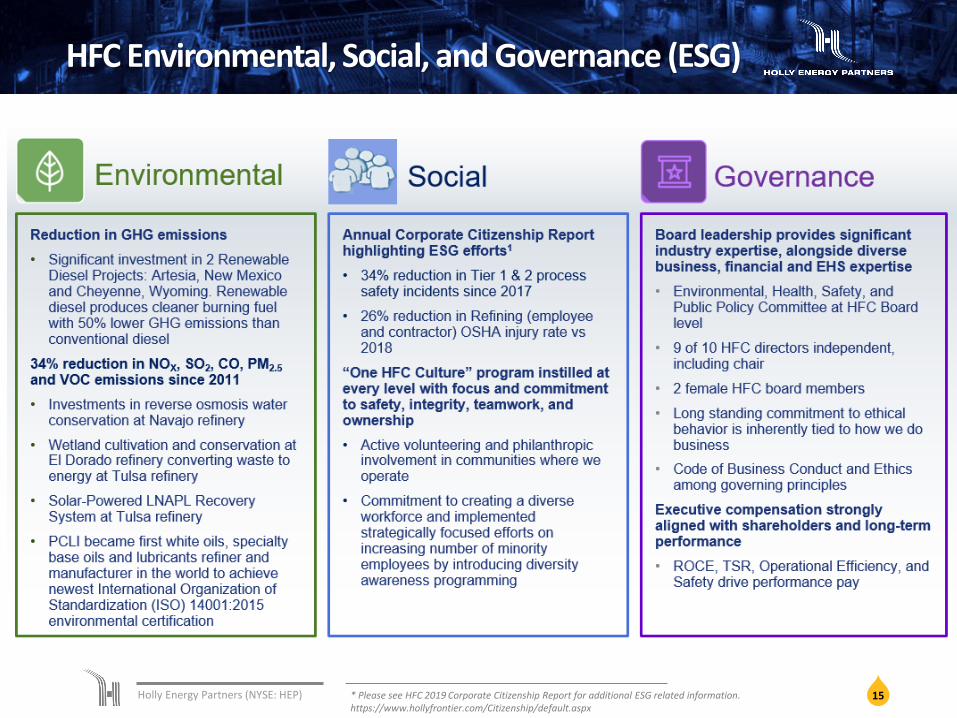
HFC Environmental, Social, and Governance (ESG)
* Please see HFC 2019 Corporate Citizenship Report for additional ESG related information. https://www.hollyfrontier.com/Citizenship/default.aspx

Holly Energy Partners (NYSE: HEP) 16
Appendix

Holly Energy Partners (NYSE: HEP) 17
2020 Highlights
Demonstrated strength and resiliency of fee-based
business model and strong customer base despite
challenging macro conditions in 2020
Improved DCF and Leverage ratios
• DCF from 1.0x to 2.0x YoY
• Leverage from 4.1x to 4.0x YoY
Opportunistically refinanced $500 million of 6%
Senior Notes due 2024 with new issuance of 5%
Senior Notes due 2028
Organic Growth Projects:
• Completed Cushing Connect Terminal Project
• Advanced Cushing Connect Pipeline
• Announced expansion of Frontier Aspen
Pipeline
• Announced construction of Navajo Tanks
project at HFC’s Navajo Refinery
$211 $237
$278
$345 $347 $359 $346
2014 2015 2016 2017 2018 2019 2020
Adjusted EBITDA ($mm)1
$173 $197
$219 $243
$265 $271 $283
2014 2015 2016 2017 2018 2019 2020
Distributable Cash Flow ($mm)1
1) See definitions page in Appendix.
Holly Energy Partners (NYSE: HEP) 18
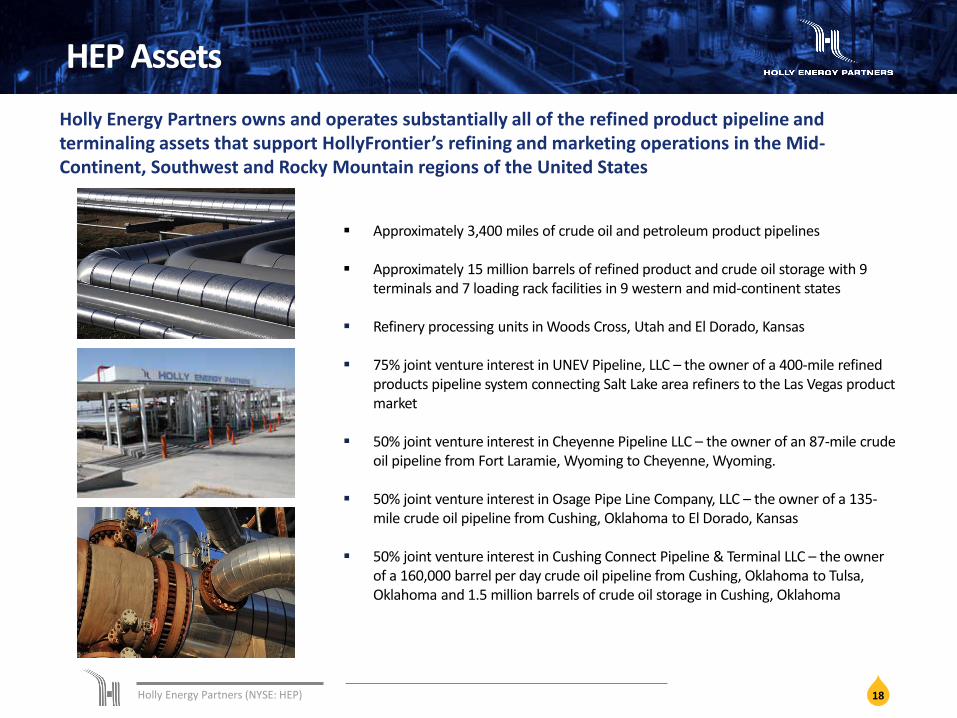
HEP Assets
Holly Energy Partners owns and operates substantially all of the refined product pipeline and terminaling assets that support HollyFrontier’s refining and marketing operations in the Mid-Continent, Southwest and Rocky Mountain regions of the United States
Approximately 3,400 miles of crude oil and petroleum product pipelines
Approximately 15 million barrels of refined product and crude oil storage with 9 terminals and 7 loading rack facilities in 9 western and mid-continent states
Refinery processing units in Woods Cross, Utah and El Dorado, Kansas
75% joint venture interest in UNEV Pipeline, LLC – the owner of a 400-mile refined products pipeline system connecting Salt Lake area refiners to the Las Vegas product market
50% joint venture interest in Cheyenne Pipeline LLC – the owner of an 87-mile crude oil pipeline from Fort Laramie, Wyoming to Cheyenne, Wyoming.
50% joint venture interest in Osage Pipe Line Company, LLC – the owner of a 135-mile crude oil pipeline from Cushing, Oklahoma to El Dorado, Kansas
50% joint venture interest in Cushing Connect Pipeline & Terminal LLC – the owner of a 160,000 barrel per day crude oil pipeline from Cushing, Oklahoma to Tulsa, Oklahoma and 1.5 million barrels of crude oil storage in Cushing, Oklahoma

Holly Energy Partners (NYSE: HEP) 19
Contract Renewal Schedule
1. Per HEP 2020 10-K ($498 million).
2021 MVC (revenue in millions)
Renewal Year HFC MVC 3rd Party MVC Total MVC Tariff
MVC as % of 2020
Total Revenue1
2021 4 0 4 FERC 1%
2022 22 12 34 PPI (5%), FERC (93%) 7%
2023 37 0 37 PPI (88%), FERC (10%) 7%
2024 90 0 90 PPI (89%), FERC (11%) 18%
2025 6 13 19 PPI 4%
2026 48 0 48 PPI 10%
2028 1 0 1 PPI 0%
2029 52 0 52 PPI 10%
2030 17 0 17 PPI 3%
2031 63 0 63 PPI 13%
2036 1 0 1 PPI 0%
$340 $25 $365 73%

Holly Energy Partners (NYSE: HEP) 20
Definitions
CAGR: The compound annual growth rate is calculated by dividing the ending value by the beginning value, raise the result to the power of one divided by the period length, and subtract one from the subsequent result. CAGR is the mean annual growth rate of an investment over a specified period of time longer than one year.
DISTRIBUTABLE CASH FLOW: Distributable cash flow (DCF) is not a calculation based upon U.S. generally accepted accounting principles (“GAAP”). However, the amounts included in the calculation are derived fromamounts separately presented in our consolidated financial statements, with the exception of excess cash flows over earnings of SLC Pipeline, maintenance capital expenditures and distributable cash flow fromdiscontinued operations. Distributable cash flow should not be considered in isolation or as an alternative to net income or operating income as an indication of our operating performance or as an alternative tooperating cash flow as a measure of liquidity. Distributable cash flow is not necessarily comparable to similarly titled measures of other companies. Distributable cash flow is presented here because it is a widelyaccepted financial indicator used by investors to compare partnership performance. We believe that this measure provides investors an enhanced perspective of the operating performance of our assets and thecash our business is generating. Our historical distributable cash flow for the past five years is reconciled to net income in footnote 3 to the table in "Item 6. Selected Financial Data" of HEP's 2020 10-K. Historicaldistributable cash flow for prior years and fiscal quarters is reconciled to net income in a footnote to the table in “Item 6. Selected Financial Data” in HEP’s 10-Ks and in a footnote to the “Income, Distributable CashFlow and Volumes” table in “Item 2. Management’s Discussion and Analysis of Financial Condition and Results of Operations in HEP’s 10-Qs, available on our website, www.hollyenergy.com.
EBITDA: Earnings before interest, taxes, depreciation and amortization which is calculated as net income plus (i) interest expense net of interest income and (ii) depreciation and amortization. EBITDA is not acalculation based upon GAAP. However, the amounts included in the EBITDA calculation are derived from amounts included in our consolidated financial statements. EBITDA should not be considered as analternative to net income or operating income, as an indication of our operating performance or as an alternative to operating cash flow as a measure of liquidity. EBITDA is not necessarily comparable to similarlytitled measures of other companies. EBITDA is presented here because it is a widely used financial indicator used by investors and analysts to measure performance. EBITDA is also used by our management forinternal analysis and as a basis for compliance with financial covenants. Our historical EBITDA for the past five years is reconciled to net income in footnote 2 to the table in “Item 6. Selected Financial Data” of HEP’s2020 10-K. Historical EBITDA for prior years and fiscal quarters is reconciled to net income in a footnote to the table in “Item 6. Selected Financial Data” in HEP’s 10-Ks and in a footnote to the “Income, DistributableCash Flow and Volumes” table in “Item 2. Management’s Discussion and Analysis of Financial Condition and Results of Operations in HEP’s 10-Qs, available on our website, www.hollyenergy.com.
ADJUSTED EBITDA: EBITDA plus adjustments for extraordinary items, other unusual or non-recurring items, each as determined in accordance with GAAP and identified in the financial statements, such as loss onearly extinguishment of debt, goodwill or long-lived asset impairments, gain on sales-type leases, pipeline tariffs not included in revenues due to impacts from lease accounting for certain pipeline tariffs or pipelinelease payments not included in operating costs and expenses. Adjusted EBITDA is not a calculation based upon GAAP. However, the amounts included in the Adjusted EBITDA calculation are derived from amountsincluded in our consolidated financial statements. Adjusted EBITDA should not be considered as an alternative to net income or operating income, as an indication of our operating performance or as an alternativeto operating cash flow as a measure of liquidity. Adjusted EBITDA is not necessarily comparable to similarly titled measures of other companies. Adjusted EBITDA is presented here because it is a widely usedfinancial indicator used by investors and analysts to measure performance. Adjusted EBITDA is reconciled to net income in a footnote to the table in “Item 6. Selected Financial Data” in HEP’s 10-Ks, in a footnote tothe “Income, Distributable Cash Flow and Volumes” table in “Item 2. Management’s Discussion and Analysis of Financial Condition and Results of Operations” in HEP’s 10-Qs or in a footnote to the “Income,Distributable Cash Flow and Volumes” table in HEP’s quarterly earnings releases, available on our website, www.hollyenergy.com.
FREE CASH FLOW AFTER DISTRIBUTIONS: Free cash flow after distributions is calculated by taking operating cash flow and subtracting capital expenditures and distributions to HEP unitholders. Free cash flow afterdistributions is not based upon GAAP. Free cash flow after distributions should not be considered in isolation or as an alternative to net income or operating income as an indication of our operating performance oras an alternative to operating cash flow as a measure of liquidity. Free cash flow after distributions is not necessarily comparable to similarly titled measures of other companies. Free cash flow after distributions ispresented here because it is a widely accepted financial indicator used by investors to compare partnership performance. We believe that this measure provides investors an enhanced perspective of the operatingperformance of our assets and the cash our business is generating.
KBPD: Thousand barrels per day.
NON GAAP MEASUREMENTS: We report certain financial measures that are not prescribed or authorized by GAAP. We discuss management's reasons for reporting these non-GAAP measures below. Althoughmanagement evaluates and presents these non-GAAP measures for the reasons described below, please be aware that these non-GAAP measures are not alternatives to revenue, operating income, income fromcontinuing operations, net income, or any other comparable operating measure prescribed by GAAP. In addition, these non-GAAP financial measures may be calculated and/or presented differently than measureswith the same or similar names that are reported by other companies, and as a result, the non-GAAP measures we report may not be comparable to those reported by others.
TTM: Trailing Twelve Months.