investor presentation - mkb
TRANSCRIPT
Investor PresentationMarch 2021
Investor presentationMarch 2022

2
IMPORTANT: This presentation may contain “forward-looking statements”, which are statements related to the future business and financial performance and future events or
developments involving CREDIT BANK OF MOSCOW. Such forward-looking statements are based on the current expectations and certain assumptions of CREDIT BANK OF
MOSCOW management, and, therefore, should be evaluated with consideration taken into of risks and uncertainties inherent in CREDIT BANK OF MOSCOW’s business. A variety
of factors, many of which are beyond CREDIT BANK OF MOSCOW’s control, can materially affect the actual results, which may differ from the forward-looking statements.
This presentation includes information presented in accordance with IFRS, as well as certain information that is not presented in accordance with the relevant accounting
principles and/or that has not been the subject of an audit. CREDIT BANK OF MOSCOW does not make any assurance, expressed or implied, as to the accuracy or completeness
of any information set forth herein. Past results may not be indicative of future performance, and accordingly CREDIT BANK OF MOSCOW undertakes no guarantees that its
future operations will be consistent with the information included in the presentation. CREDIT BANK OF MOSCOW accepts no liability whatsoever for any expenses or loss
connected with the use of the presentation. Please note that due to rounding, the numbers presented may not add up precisely to the totals provided and percentages may not
precisely reflect the absolute figures.
Information contained in the presentation is valid only as at the stated date on the cover page. CREDIT BANK OF MOSCOW undertakes no obligation to update or revise the
information or any forward-looking statements in the presentation to reflect any changes after such date.
This presentation is for information purposes only. This presentation does not constitute an offer or sale of securities in any jurisdiction or otherwise constitute an invitation or
inducement to any person to underwrite, subscribe for or otherwise acquire securities of CREDIT BANK OF MOSCOW. If this presentation is provided to you in electronic form,
although reasonable care was used to prepare and maintain the electronic version of the presentation, CREDIT BANK OF MOSCOW accepts no liability for any loss or damage
connected to the electronic storage or transfer of information.
2
Disclaimer
Introduction 4
Financial Performance
12Strategy and Business Overview
18
Appendix 26
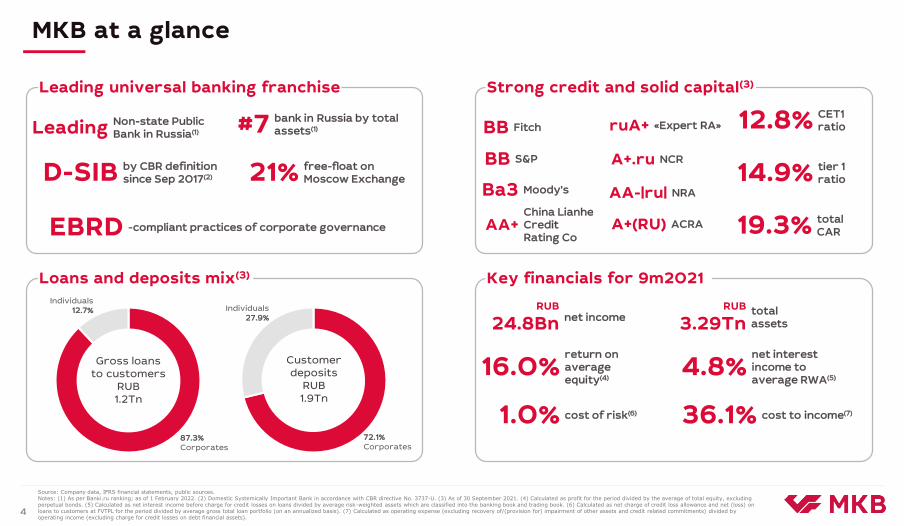
MKB at a glance
Source: Company data, IFRS financial statements, public sources. Notes: (1) As per Banki.ru ranking; as of 1 February 2022. (2) Domestic Systemically Important Bank in accordance with CBR directive No. 3737-U. (3) As of 30 September 2021. (4) Calculated as profit for the period divided by the average of total equity, excluding perpetual bonds. (5) Calculated as net interest income before charge for credit losses on loans divided by average risk-weighted assets which are classified into the banking book and trading book. (6) Calculated as net charge of credit loss allowance and net (loss) on loans to customers at FVTPL for the period divided by average gross total loan portfolio (on an annualized basis). (7) Calculated as operating expense (excluding recovery of/(provision for) impairment of other assets and credit related commitments) divided by operating income (excluding charge for credit losses on debt financial assets).
4
Gross loansto customers
RUB1.2Tn
Leading universal banking franchise Strong credit and solid capital(3)
Loans and deposits mix(3) Key financials for 9m2021
#7 bank in Russia by total assets(1)
D-SIB by CBR definition since Sep 2017(2) 21% free-float on
Moscow Exchange
EBRD -compliant practices of corporate governance
14.9% tier 1 ratio
19.3% total CAR
RUB
24.8Bn net incomeRUB
3.29Tntotal assets
16.0%return on average equity(4)
4.8%net interest income to average RWA(5)
36.1% cost to income(7)1.0% cost of risk(6)
Customer deposits
RUB1.9Tn
12.8% CET1ratio
Individuals27.9%
72.1%Corporates
Individuals12.7%
87.3%Corporates
BB Fitch
BB S&P
Ba3 Moody’s
A+(RU) ACRA
ruA+ «Expert RA»
А+.ru NCR
АА+China LianheCredit Rating Co
Leading Non-state Public Bank in Russia(1)
AA-|ru| NRA
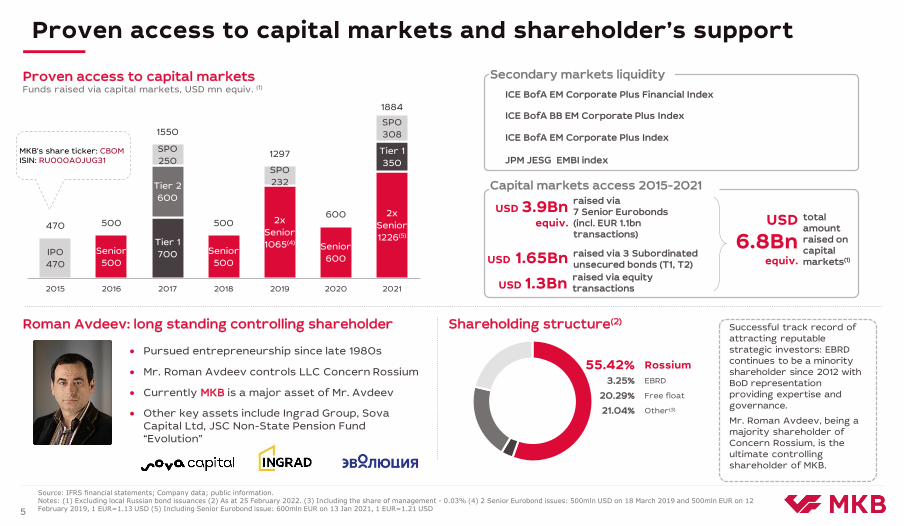
55.42% Rossium
3.25% EBRD
20.29% Free float
21.04% Other(3)
USD 1.3Bnraised via equity transactions
Successful track record of attracting reputable strategic investors: EBRD continues to be a minority shareholder since 2012 with BoD representation providing expertise and governance.
Mr. Roman Avdeev, being a majority shareholder of Concern Rossium, is the ultimate controlling shareholder of MKB.
Pursued entrepreneurship since late 1980s
Mr. Roman Avdeev controls LLC Concern Rossium
Currently MKB is a major asset of Mr. Avdeev
Other key assets include Ingrad Group, Sova Capital Ltd, JSC Non-State Pension Fund “Evolution”
Source: IFRS financial statements; Company data; public information. Notes: (1) Excluding local Russian bond issuances (2) As at 25 February 2022. (3) Including the share of management - 0.03% (4) 2 Senior Eurobond issues: 500mln USD on 18 March 2019 and 500mln EUR on 12 February 2019, 1 EUR=1.13 USD (5) Including Senior Eurobond issue: 600mln EUR on 13 Jan 2021, 1 EUR=1.21 USD5
Proven access to capital markets and shareholder’s support
ICE BofA EM Corporate Plus Financial Index
ICE BofA BB EM Corporate Plus Index
ICE BofA EM Corporate Plus Index
USD 3.9Bnequiv.
USD 1.65Bn
raised via 7 Senior Eurobonds (incl. EUR 1.1bntransactions)
raised via 3 Subordinated unsecured bonds (T1, T2)
USD
6.8Bnequiv.
total amount raised on capital markets(1)
Funds raised via capital markets, USD mn equiv. (1)Proven access to capital markets
Shareholding structure(2)Roman Avdeev: long standing controlling shareholder
Secondary markets liquidity
Capital markets access 2015-2021
Senior
500
Senior
500
2x
Senior
1065(4)Senior
600
2x
Senior
1226(5)Tier 1
700
Tier 1
350
Tier 2
600
IPO
470
SPO
250SPO
232
SPO
308
470 500
1550
500
1297
600
1884
2015 2016 2017 2018 2019 2020 2021
MKB’s share ticker: CBOMISIN: RU000A0JUG31 JPM JESG EMBI index
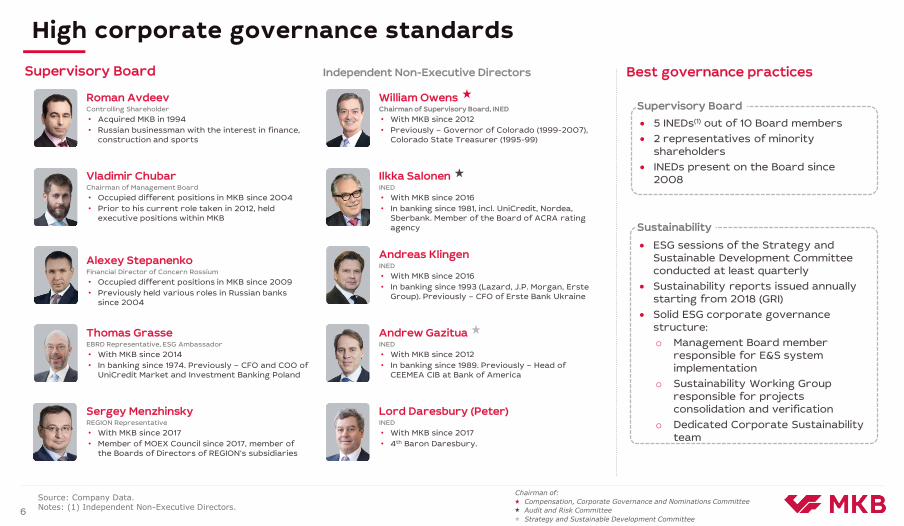
Sustainable Performance – Comparison with Russian PeersHigh corporate governance standards
Supervisory Board
Vladimir ChubarChairman of Management Board
• Occupied different positions in MKB since 2004
• Prior to his current role taken in 2012, held executive positions within MKB
Compensation, Corporate Governance and Nominations Committee
Audit and Risk Committee
Strategy and Sustainable Development Committee
Chairman of:
6
Source: Company Data.Notes: (1) Independent Non-Executive Directors.
Best governance practices
5 INEDs(1) out of 10 Board members
2 representatives of minority shareholders
INEDs present on the Board since 2008
Supervisory Board
Sustainability
ESG sessions of the Strategy and Sustainable Development Committee conducted at least quarterly
Sustainability reports issued annually starting from 2018 (GRI)
Solid ESG corporate governance structure:
o Management Board member responsible for E&S system implementation
o Sustainability Working Group responsible for projects consolidation and verification
o Dedicated Corporate Sustainability team
Roman AvdeevControlling Shareholder
• Acquired MKB in 1994
• Russian businessman with the interest in finance, construction and sports
Alexey StepanenkoFinancial Director of Concern Rossium
• Occupied different positions in MKB since 2009
• Previously held various roles in Russian banks since 2004
Thomas GrasseEBRD Representative, ESG Ambassador
• With MKB since 2014
• In banking since 1974. Previously – CFO and COO of UniCredit Market and Investment Banking Poland
Sergey MenzhinskyREGION Representative
• With MKB since 2017
• Member of MOEX Council since 2017, member of the Boards of Directors of REGION’s subsidiaries
Ilkka SalonenINED
• With MKB since 2016
• In banking since 1981, incl. UniCredit, Nordea, Sberbank. Member of the Board of ACRA rating agency
William OwensChairman of Supervisory Board, INED
• With MKB since 2012
• Previously – Governor of Colorado (1999-2007), Colorado State Treasurer (1995-99)
Andreas KlingenINED
• With MKB since 2016
• In banking since 1993 (Lazard, J.P. Morgan, ErsteGroup). Previously – CFO of Erste Bank Ukraine
Andrew GazituaINED
• With MKB since 2012
• In banking since 1989. Previously – Head of CEEMEA CIB at Bank of America
Lord Daresbury (Peter)INED
• With MKB since 2017
• 4th Baron Daresbury.
Independent Non-Executive Directors
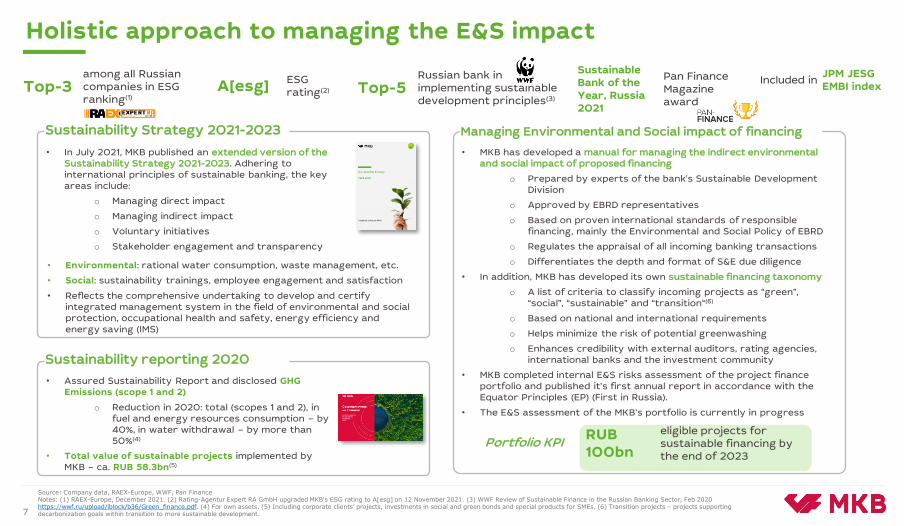
Holistic approach to managing the E&S impact
Sustainability Strategy 2021-2023
A[esg] ESG rating(2)
• In July 2021, MKB published an extended version of the Sustainability Strategy 2021-2023. Adhering to international principles of sustainable banking, the key areas include:
o Managing direct impact
o Managing indirect impact
o Voluntary initiatives
o Stakeholder engagement and transparency
Top-3 among all Russian companies in ESG ranking(1)
Top-5Russian bank in implementing sustainable development principles(3)
Managing Environmental and Social impact of financing
• MKB has developed a manual for managing the indirect environmental and social impact of proposed financing
o Prepared by experts of the bank's Sustainable Development Division
o Approved by EBRD representatives
o Based on proven international standards of responsible financing, mainly the Environmental and Social Policy of EBRD
o Regulates the appraisal of all incoming banking transactions
o Differentiates the depth and format of S&E due diligence
• In addition, MKB has developed its own sustainable financing taxonomy
o A list of criteria to classify incoming projects as “green”, “social”, “sustainable” and “transition“(6)
o Based on national and international requirements
o Helps minimize the risk of potential greenwashing
o Enhances credibility with external auditors, rating agencies, international banks and the investment community
• MKB completed internal E&S risks assessment of the project finance portfolio and published it’s first annual report in accordance with the Equator Principles (EP) (First in Russia).
• The E&S assessment of the MKB’s portfolio is currently in progress
RUB 100bn
eligible projects for sustainable financing by the end of 2023
Sustainable Bank of the Year, Russia 2021
Pan Finance Magazine award
Portfolio KPI
Sustainability reporting 2020
• Assured Sustainability Report and disclosed GHG Emissions (scope 1 and 2)
o Reduction in 2020: total (scopes 1 and 2), in fuel and energy resources consumption – by 40%, in water withdrawal – by more than 50%(4)
• Total value of sustainable projects implemented by MKB – ca. RUB 58.3bn(5)
• Environmental: rational water consumption, waste management, etc.
• Social: sustainability trainings, employee engagement and satisfaction
• Reflects the comprehensive undertaking to develop and certify integrated management system in the field of environmental and social protection, occupational health and safety, energy efficiency and energy saving (IMS)
Source: Company data, RAEX-Europe, WWF, Pan FinanceNotes: (1) RAEX-Europe, December 2021. (2) Rating-Agentur Expert RA GmbH upgraded MKB's ESG rating to A[esg] on 12 November 2021. (3) WWF Review of Sustainable Finance in the Russian Banking Sector, Feb 2020 https://wwf.ru/upload/iblock/b36/Green_finance.pdf. (4) For own assets. (5) Including corporate clients’ projects, investments in social and green bonds and special products for SMEs. (6) Transition projects – projects supporting decarbonization goals within transition to more sustainable development.7
Holistic approach to managing the E&S impact
Included inJPM JESG EMBI index

1.51.51.8
3.03.34.0
5.3
8.1
19.5
37.1
RosbankRaiffeisenSovcomOtkritieRABAlfaGPBVTBSber
165 232 309 454 585
1 2081 568
1 8882 146
2 4232 916
3 286
2010 2011 2012 2013 2014 2015 2016 2017 2018 2019 2020 9m2021
24.5%19.0% 18.2% 20.1%
10.1%2.1%
11.1%17.8% 19.9%
7.8%16.9% 16.0%
4.5% 5.1% 3.7% 1.8% 0.7% -2.5% 0.3% 1.6% 2.3% 1.3% -3.1%4.7%
[Tripling Market Share Since 2014]
State owned banks
Non-state owned banks
… translated into leadership in Russian banking industry…
8
… and sustainable positioning in corporate business
#4
3.8%
Sustainable leadership among Russian non-state owned banks
Time-tested organic growth strategy and resilient profitability…
Top-10 Banks by Total Assets (RUB Tn)(4)
Market share: corporate lending(3) Market share: corporate deposits(4)
Total Assets (RUB Bn) Ranking by Total Assets(1) ROAE Real GDP growth(2)
#6
5.0%
Non-state31.8%
Other28.0%
#6
67.0%State(5)
State(5)
64.4%
Source: Company data, www.banki.ru, IMF, IFRS. Notes: (1) According to banki.ru (2) According to IMF. (3) Based on RAS, includes reverse repo operations, as for 1 October 2021. (4) as for 1 October 2021 (5) Including Sber, VTB, GPB, RAB and Otkritie
#26 #21 #20 #13 #14
#11#8 #8
#6 #7#6
#6
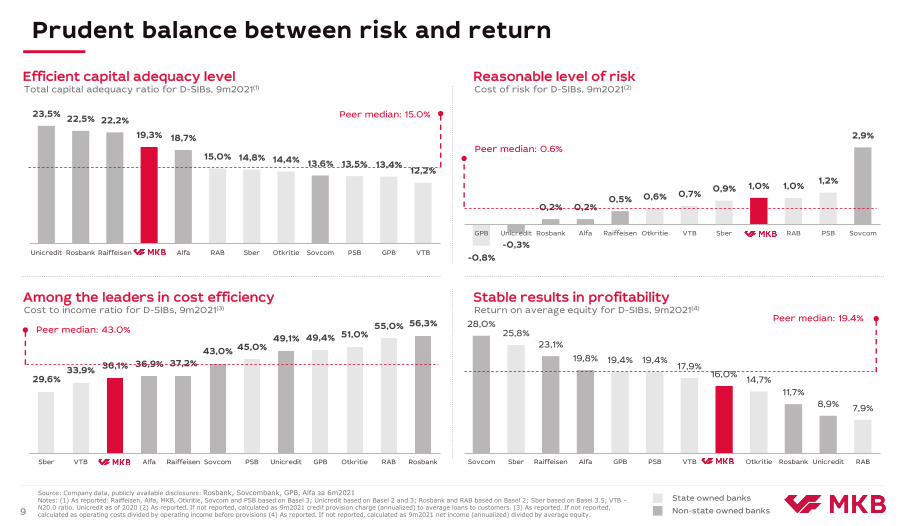
-0,8%
-0,3%
0,2% 0,2%0,5% 0,6% 0,7%
0,9% 1,0% 1,0%1,2%
2,9%
GPB Unicredit Rosbank Alfa Raiffeisen Otkritie VTB Sber RAB PSB Sovcom
29,6%33,9% 36,1% 36,9% 37,2%
43,0% 45,0%49,1% 49,4% 51,0%
55,0% 56,3%
Sber VTB Alfa Raiffeisen Sovcom PSB Unicredit GPB Otkritie RAB Rosbank
23,5%22,5% 22,2%
19,3% 18,7%
15,0% 14,8% 14,4% 13,6% 13,5% 13,4%12,2%
Unicredit Rosbank Raiffeisen Alfa RAB Sber Otkritie Sovcom PSB GPB VTB
28,0%25,8%
23,1%
19,8% 19,4% 19,4%17,9%
16,0%14,7%
11,7%
8,9% 7,9%
Sovcom Sber Raiffeisen Alfa GPB PSB VTB Otkritie Rosbank Unicredit RAB
Sustainable Performance – Comparison with Russian Peers
Efficient capital adequacy level
Among the leaders in cost efficiency
Reasonable level of risk
Stable results in profitability
Total capital adequacy ratio for D-SIBs, 9m2021(1) Cost of risk for D-SIBs, 9m2021(2)
Return on average equity for D-SIBs, 9m2021(4)Cost to income ratio for D-SIBs, 9m2021(3)
9
Prudent balance between risk and return
Source: Company data, publicly available disclosures: Rosbank, Sovcombank, GPB, Alfa за 6m2021Notes: (1) As reported: Raiffeisen, Alfa, MKB, Otkritie, Sovcom and PSB based on Basel 3; Unicredit based on Basel 2 and 3; Rosbank and RAB based on Basel 2; Sber based on Basel 3.5; VTB –N20.0 ratio. Unicredit as of 2020 (2) As reported. If not reported, calculated as 9m2021 credit provision charge (annualized) to average loans to customers. (3) As reported. If not reported, calculated as operating costs divided by operating income before provisions (4) As reported. If not reported, calculated as 9m2021 net income (annualized) divided by average equity.
State owned banks
Non-state owned banks
Peer median: 0.6%
Peer median: 15.0%
Peer median: 19.4%Peer median: 43.0%

Universal model with focus on large corporates and omnichannel distribution platform
Capturing niche opportunities in real estate sector and building SME online platform
Competitive retail solutions over wide range of products capturing market trends
Prudent balance between risk and return with 1.0% CoR and 16.0% RoAE(2)
Resilient capital adequacy with 19.3% total CAR(2)
Credit Highlights
1. Leadership and Scale
2. Financial Strength
3. Business Model
4. Resilient Risk Profile
5. Sustainability
Source: Company data, IFRS financial statements, public sources. Notes: (1) According to banki.ru; as of 1 October 2021. (2) As of 30 September 2021. (3) As of 30 September 2021. Calculated as credit loss allowance related to loans to customers divided by total amount of loans to customers overdue for more than 90 days. (4) WWF Review of Sustainable Finance in the Russian Banking Sector, Feb 2020.tps://wwf.ru/upload/iblock/b36/Green_finance.pdf10
One of 13 systemically important banks in Russia
#1 non-state bank by corporate loan portfolio: 5.0% market share(1)
#1 non-state public bank by total assets: 2.9% share in banking sector assets(1)
Responsible approach focused on stimulating economic growth while improving social welfare
EBRD-compliant practices of corporate governance and environmental standards on loan portfolio
Top-5 Russian bank in implementing sustainable development principles(4)
Conservative asset mix focused on loans to Russian blue-chips proved to be resilient with only 0.1% of corporate loan portfolio restructured due to COVID in 2021(2)
Proactive risk management policy with balanced approach to loan loss reserves at 187.9% NPL coverage level(3)
Introduction 4
Financial Performance 18
Strategy and Business Overview 12
Appendix 26
MKB Online Banking
Loans
Syndicated Loans
Trade Finance
Acquiring
Current Accounts
Payments
Factoring
Cash Management
Deposits
Letters ofCredit
Relationship Managers
Overdrafts Guarantees Branches
Cash Handling
Credit Non-CreditDistribution Channels
Deposits
CreditCards
Insurance
Payments/P2P Transfers
Mortgage Loans
General-purpose
Loans
Individual Investments
Distribution ChannelsCredit Non-Credit
Payment Terminals
ATMs
Web Application
Mobile Application
BranchesCards
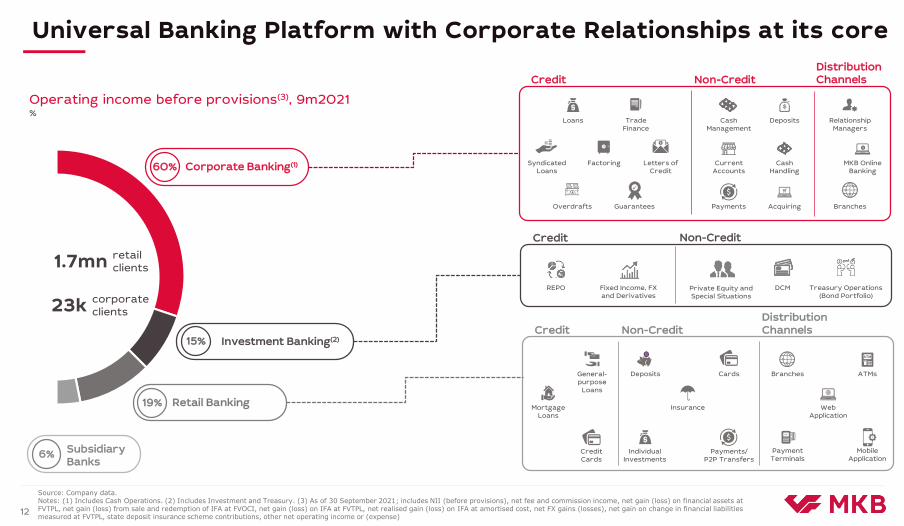
Source: Company data. Notes: (1) Includes Cash Operations. (2) Includes Investment and Treasury. (3) As of 30 September 2021; includes NII (before provisions), net fee and commission income, net gain (loss) on financial assets at FVTPL, net gain (loss) from sale and redemption of IFA at FVOCI, net gain (loss) on IFA at FVTPL, net realised gain (loss) on IFA at amortised cost, net FX gains (losses), net gain on change in financial liabilities measured at FVTPL, state deposit insurance scheme contributions, other net operating income or (expense)
12
Universal Banking Platform with Corporate Relationships at its core
DCM Treasury Operations (Bond Portfolio)
Fixed Income, FX and Derivatives
REPO
Credit Non-Credit
Private Equity and Special Situations
1.7mn retail clients
23k corporate clients
Operating income before provisions(3), 9m2021%
Corporate Banking(1)60%
Retail Banking19%
Investment Banking(2)15%
Subsidiary Banks
6%
1,6
3,53,9
9m2019 9m2020 9m2021
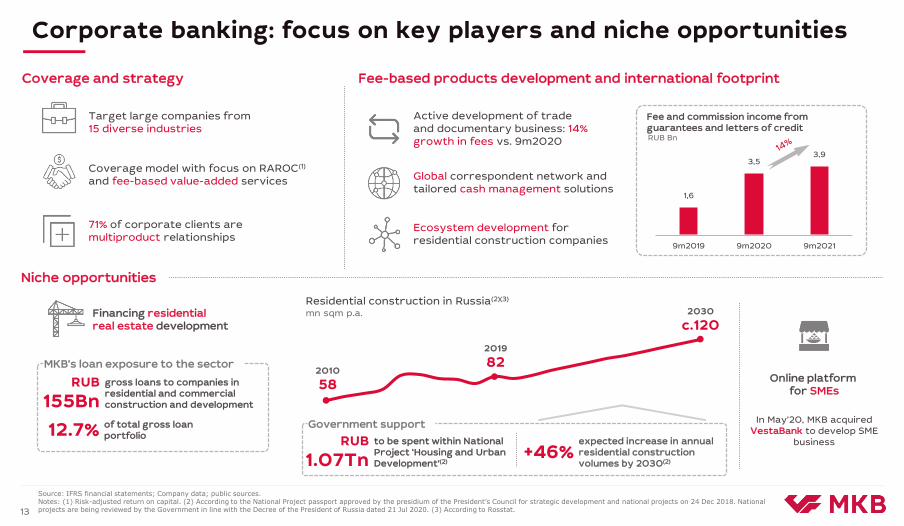
Sustainable Performance – Comparison with Russian PeersCorporate banking: focus on key players and niche opportunities
Coverage model with focus on RAROC(1)
and fee-based value-added services
13
Financing residentialreal estate development
Online platform for SMEs
Niche opportunities
Global correspondent network and tailored cash management solutions
Target large companies from 15 diverse industries
Active development of trade and documentary business: 14% growth in fees vs. 9m2020
71% of corporate clients are multiproduct relationships
Ecosystem development for residential construction companies
Coverage and strategy Fee-based products development and international footprint
RUB Bn
Fee and commission income from guarantees and letters of credit
2010
58
2019
82
2030
c.120mn sqm p.a.
Residential construction in Russia(2)(3)
Government support
Source: IFRS financial statements; Company data; public sources. Notes: (1) Risk-adjusted return on capital. (2) According to the National Project passport approved by the presidium of the President’s Council for strategic development and national projects on 24 Dec 2018. National projects are being reviewed by the Government in line with the Decree of the President of Russia dated 21 Jul 2020. (3) According to Rosstat.
In May’20, MKB acquired VestaBank to develop SME
business
RUB
155Bngross loans to companies in residential and commercial construction and development
MKB’s loan exposure to the sector
12.7% of total gross loan portfolio RUB
1.07Tnto be spent within National Project ‘Housing and Urban Development’(2)
+46%expected increase in annual residential construction volumes by 2030(2)

1,12,0
3,9
8,8
Dec '16 Dec '18 Dec '19 Dec '20 10m2021
2019 2020 2030
Sustainable Performance – Comparison with Russian PeersRetail banking: trusted bank of choice for customers
14
Government support
Strategic growth opportunities
6.5% interest rate ceiling for subsidized mortgages(4)
EscrowSince mid-2019, all new residential projects obliged to use escrow scheme to decrease risks borne by consumers. As of Dec 2020, 51.2% of current projects used escrow(5)
Mortgages
2.3x
Expected mortgage market growth in
Russia, 2019-2030(3)
Competitive advantages Product mixProduct breakdown of gross loans to individuals (RUB bn)
Auto loans
40 regions
Acquired Rusnarbank’spartner network
presence
unique retail clients on MOEX 15.3mn(6)
Retail brokerage
+74%
10m2021 YTD increase in unique
retail clients on MOEX
RUB
2.8tn
RUB
6.2tn
Neworiginations(3)
#5 digital office
mobile banking app in Russia for Android(1)
MKB.Invest: brokerage platform for retail investors
Joint mortgagesolutions with leading developers
Bank for depositors: Leading deposit offering
Source: IFRS Financial Statements, Company data, public sourcesNotes: (1) According to MarksWebb Mobile Banking Rank 2020. (2) Includes auto loans in 2018 and 2019 (<1% of gross retail loans) and credit cards. (3) According to the report published by Association of Banks of Russia: https://asros.ru/upload/iblock/461/Finansirovanie_zhilishchnogo_stroitelstva_na_sayt_.pdf. For 2020 according to DOM.RF. (4) According to the Order of the Government of Russia No.1732. (5) According to DOM.RF. (6) According to MOEX
Mortgage portfolio increased significantly from RUB 39bn in 2020 to RUB 54bn for 9m2021 (+38%).
MKB expects mortgage loans to become the main source of growth of its retail business in the future
RUB
4.3tn
82 86 92
2439
546
7
4
3
3
2019 2020 9m2021
General Purpose Loans MortgagesAuto Loans Credit Card Loans
110
133
156
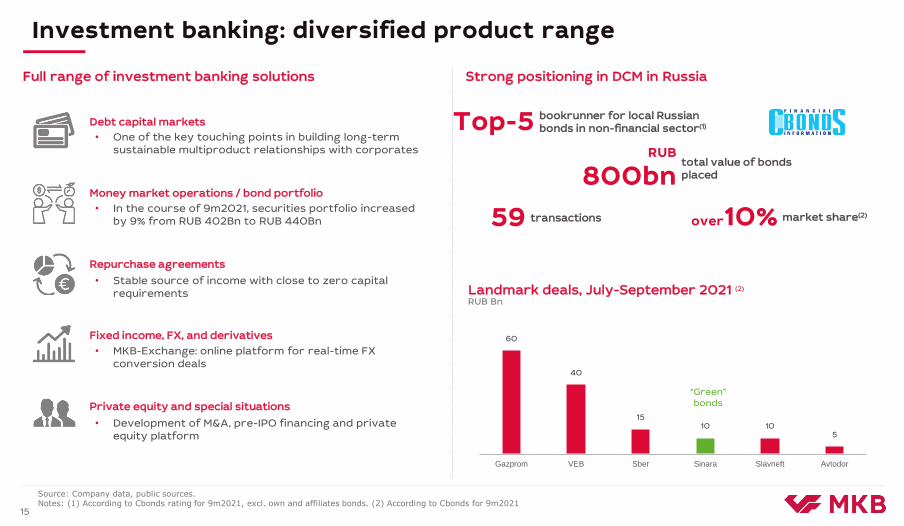
Sustainable Performance – Comparison with Russian PeersInvestment banking: diversified product range
15
Debt capital markets
Private equity and special situations
Repurchase agreements
Source: Company data, public sources.Notes: (1) According to Cbonds rating for 9m2021, excl. own and affiliates bonds. (2) According to Cbonds for 9m2021
Money market operations / bond portfolio
• In the course of 9m2021, securities portfolio increased by 9% from RUB 402Bn to RUB 440Bn
• Stable source of income with close to zero capital requirements
• One of the key touching points in building long-term sustainable multiproduct relationships with corporates
Full range of investment banking solutions
• Development of M&A, pre-IPO financing and private equity platform
Fixed income, FX, and derivatives
• MKB-Exchange: online platform for real-time FX conversion deals
Strong positioning in DCM in Russia
Landmark deals, July-September 2021 (2)
RUB Bn
60
40
1510 10
5
Gazprom VEB Sber Sinara Slavneft Avtodor
“Green”bonds
59 transactions
RUB
800bntotal value of bonds placed
Top-5 bookrunner for local Russian bonds in non-financial sector(1)
over10% market share(2)
16
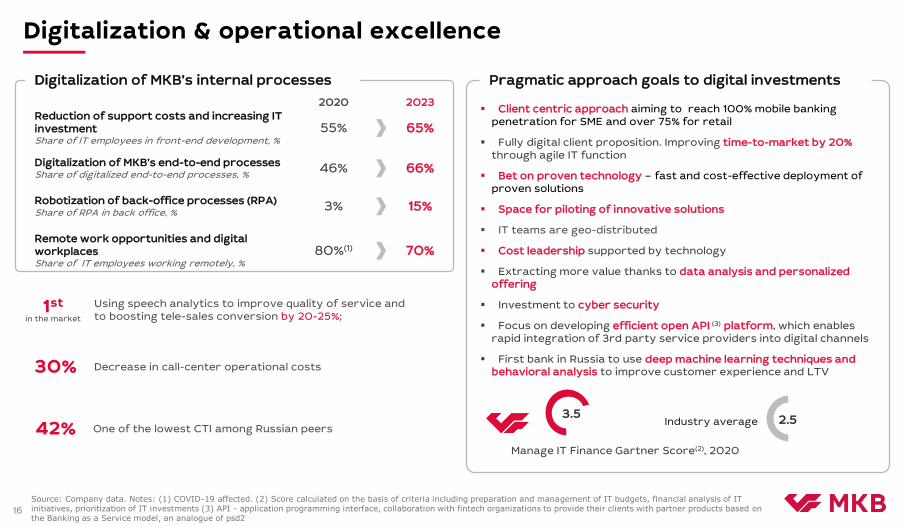
Digitalization & operational excellence
Client centric approach aiming to reach 100% mobile banking penetration for SME and over 75% for retail
Fully digital client proposition. Improving time-to-market by 20% through agile IT function
Bet on proven technology – fast and cost-effective deployment of proven solutions
Space for piloting of innovative solutions
IT teams are geo-distributed
Cost leadership supported by technology
Extracting more value thanks to data analysis and personalized offering
Investment to cyber security
Focus on developing efficient open API (3) platform, which enables rapid integration of 3rd party service providers into digital channels
First bank in Russia to use deep machine learning techniques and behavioral analysis to improve customer experience and LTV
Manage IT Finance Gartner Score(2), 2020
Industry average 2.53.5
Pragmatic approach goals to digital investmentsDigitalization of MKB’s internal processes
2020 2023
Reduction of support costs and increasing IT investmentShare of IT employees in front-end development, %
55% 65%
Digitalization of MKB’s end-to-end processesShare of digitalized end-to-end processes, %
46% 66%
Remote work opportunities and digital workplaces Share of IT employees working remotely, %
80%(1) 70%
Source: Company data. Notes: (1) COVID-19 affected. (2) Score calculated on the basis of criteria including preparation and management of IT budgets, financial analysis of IT initiatives, prioritization of IT investments (3) API - application programming interface, collaboration with fintech organizations to provide their clients with partner products based on the Banking as a Service model, an analogue of psd2
Robotization of back-office processes (RPA)Share of RPA in back office, %
3% 15%
Decrease in call-center operational costs30%
Using speech analytics to improve quality of service and to boosting tele-sales conversion by 20-25%;
1stin the market
One of the lowest CTI among Russian peers42%
Introduction 4
Financial Performance 18
Strategy and Business Overview 12
Appendix 26
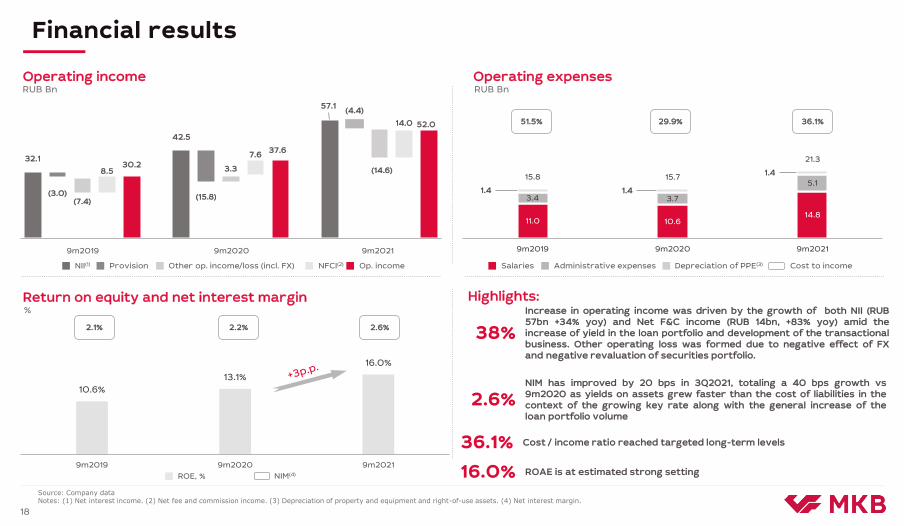
32.130.2
42.5
37.6
57.1
52.0
(3.0)(7.4)
8.5
(15.8)
3.3
7.6
(4.4)
(14.6)
14.0
NII Provision Other NFCI Op. income NII Provision Other NFCI Op. income NII Provision Other NFCI Op. income
10.6%
13.1%
16.0%
9m2019 9m2020 9m2021
11.0 10.614.8
3.4 3.7
5.11.4 1.4
1.415.8 15.7
21.3
9m2019 9m2020 9m2021
Depreciation of PPE(3)
Operating income
Return on equity and net interest margin
Operating expensesRUB Bn RUB Bn
%
Sustainable Performance – Comparison with Russian PeersFinancial results
Administrative expenses Cost to income
51.5% 29.9% 36.1%
NII(1) Other op. income/loss (incl. FX)Provision NFCI(2)
ROE, % NIM(4)
18
Op. income Salaries
Source: Company dataNotes: (1) Net interest income. (2) Net fee and commission income. (3) Depreciation of property and equipment and right-of-use assets. (4) Net interest margin.
Highlights:
9m2019 9m2020 9m2021
2.1% 2.2% 2.6%
16.0% ROAE is at estimated strong setting
36.1% Cost / income ratio reached targeted long-term levels
2.6%NIM has improved by 20 bps in 3Q2021, totaling a 40 bps growth vs9m2020 as yields on assets grew faster than the cost of liabilities in thecontext of the growing key rate along with the general increase of theloan portfolio volume
38%
Increase in operating income was driven by the growth of both NII (RUB57bn +34% yoy) and Net F&C income (RUB 14bn, +83% yoy) amid theincrease of yield in the loan portfolio and development of the transactionalbusiness. Other operating loss was formed due to negative effect of FXand negative revaluation of securities portfolio.
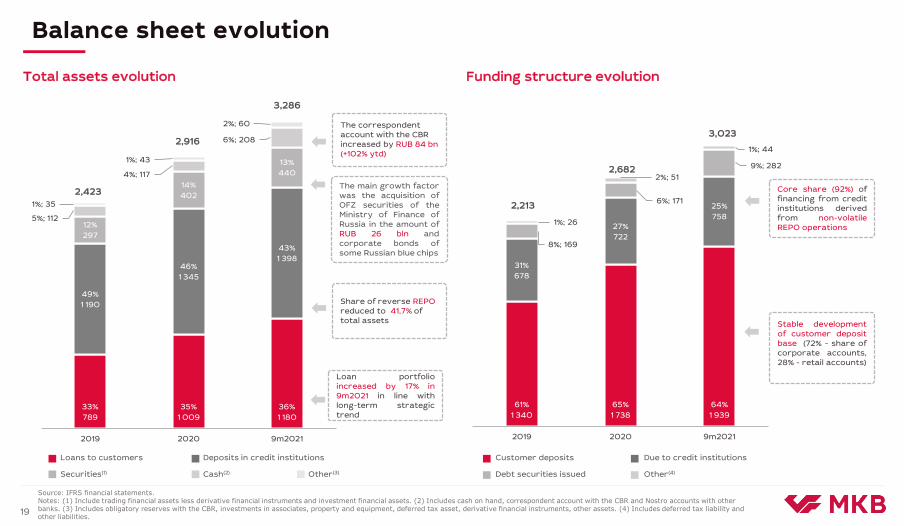
61%
1 340
65%
1 738
64%
1 939
31%
678
27%
722
25%
758
8%; 169
6%; 171
9%; 282
1%; 26
2%; 51
1%; 44
2019 2020 9m2021
33%
789
35%
1 009
36%
1 180
49%
1 190
46%
1 345
43%
1 398
12%
297
14%
402
13%
440
5%; 112
4%; 117
6%; 208
1%; 35
1%; 43
2%; 60
2019 2020 9m2021
Sustainable Performance – Comparison with Russian PeersBalance sheet evolution
19
Total assets evolution Funding structure evolution
Source: IFRS financial statements. Notes: (1) Include trading financial assets less derivative financial instruments and investment financial assets. (2) Includes cash on hand, correspondent account with the CBR and Nostro accounts with other banks. (3) Includes obligatory reserves with the CBR, investments in associates, property and equipment, deferred tax asset, derivative financial instruments, other assets. (4) Includes deferred tax liability and other liabilities.
Loans to customers Deposits in credit institutions
Securities(1) Cash(2) Other(3)
Customer deposits Due to credit institutions
Debt securities issued Other(4)
2,423
2,916
3,286
2,213
2,682
3,023
Loan portfolioincreased by 17% in9m2021 in line withlong-term strategictrend
Share of reverse REPOreduced to 41,7% of total assets
The main growth factorwas the acquisition ofOFZ securities of theMinistry of Finance ofRussia in the amount ofRUB 26 bln andcorporate bonds ofsome Russian blue chips
The correspondent account with the CBR increased by RUB 84 bn(+102% ytd)
Stable developmentof customer depositbase (72% - share ofcorporate accounts,28% - retail accounts)
Core share (92%) offinancing from creditinstitutions derivedfrom non-volatileREPO operations
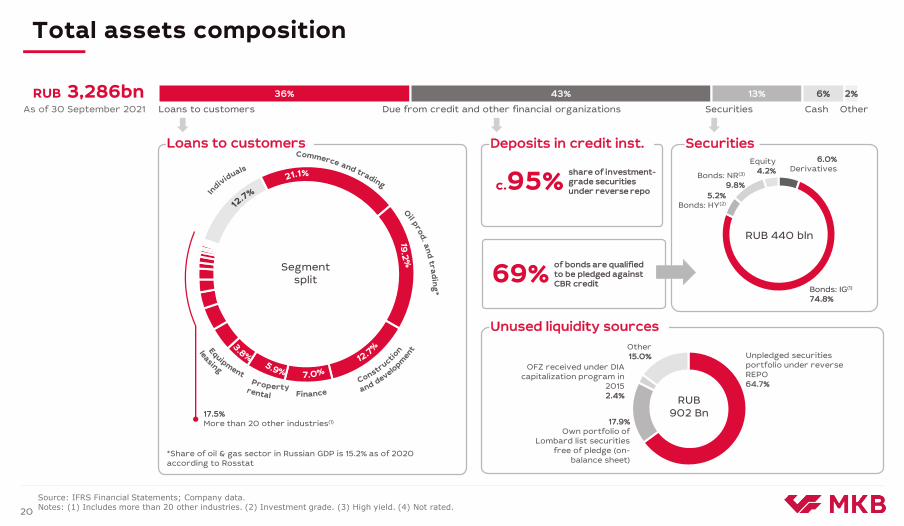
36% 43% 13% 6% 2%
Sustainable Performance – Comparison with Russian PeersTotal assets composition
20
RUB 3,286bnAs of 30 September 2021 Loans to customers Due from credit and other financial organizations Securities Cash Other
69%of bonds are qualifiedto be pledged against CBR credit
c.95%share of investment-grade securities under reverse repo
Unpledged securities portfolio under reverse REPO64.7%
17.9%Own portfolio of
Lombard list securities free of pledge (on-
balance sheet)
OFZ received under DIA capitalization program in
20152.4%
Other15.0%
RUB 440 bln
Segment split
Unused liquidity sources
Loans to customers Deposits in credit inst. Securities
Source: IFRS Financial Statements; Company data. Notes: (1) Includes more than 20 other industries. (2) Investment grade. (3) High yield. (4) Not rated.
17.5%More than 20 other industries(1)
RUB902 Bn
*Share of oil & gas sector in Russian GDP is 15.2% as of 2020 according to Rosstat
Bonds: IG(1)
74.8%
Bonds: NR(3)
9.8%
Equity4.2%
6.0%Derivatives
5.2%Bonds: HY(2)

21
Total liabilities and equity composition
16 1745
128
38
40
2021 2022 2023 2024 2025+
59% 23% 9% 1% 8%
Customer deposits Due to credit institutions Debt(1) Other(2) Equity
Customer deposits
RUB 1,939 bn
Eurobonds repayment schedule
Due to credit institutions
RUB 283bn As of 30 September 2021
Individuals27.9%
Corporates72.1%
REPO91.9%
Current accounts5.0%
3.1%Term deposits
Bonds currency split
19.0%RUB
USD53.0% EUR
28.0%
Senior
Tier 2(4)
Tier 1(3)
RUB 3,286bnAs of 30 September 2021
Source: IFRS Financial Statements; Company data; public sources.Notes: (1) Includes debt securities issued. (2) Includes deferred tax liability and other liabilities. (3) With a call option embedded: first call date in Nov 2022, and then at every coupon date at the issuer’s discretion. (4) With a call option embedded: first call date in Oct 2022, and then at every coupon date at the issuer’s discretion.
Charge for credit losses and cost of risk NPLs and NPL share
Stage 2, 3 & POCI ratio and coverage
%, bln RUB
%
Highlights:
(1)
6.4 8.0
0.23.0
7.3
7.89.0
0.9 0.6
1.3
14.217.0
1.1
3.68.6
2.1% 1.8%
0.4% 0.6% 1.0%
-10,0%
-8,0%
-6,0%
-4,0%
-2,0%
0,0%
2,0%
4,0%
6,0%
0,0
5,0
10,0
15,0
20,0
25,0
30,0
35,0
9m'20 12m'20 3m'21 6m'21 9m'21
Charge (Corp.) Charge (Retail) CoR (Total)
23.3 24.4 24.2 20.714.6
8.0 7.9 10.59.5
10.2
3.1% 3.1% 3.1%2.5%
2.0%
-2%
-1%
0%
1%
2%
3%
4%
5%
-5
5
15
25
35
45
55
9m'20 12m'20 3m'21 6m'21 9m'21
NPLs (Corp.) NPLs (Retail) NPL ratio (Total)
4.6%5.0%
5.0%4.4% 3.6%
125.0%
101.8% 98.7% 101.6%
110,1%
0,0%
20,0%
40,0%
60,0%
80,0%
100,0%
120,0%
0,0%
1,0%
2,0%
3,0%
4,0%
5,0%
6,0%
7,0%
8,0%
9,0%
10,0%
9m'20 12m'20 3m'21 6m'21 9m'21
Stage 3 & POCI ratio (Total) Stage 3 & POCI coverage (Total)
Asset quality metrics
Source: IFRS financial statements; Company data
Notes: (1) Includes net gain/loss on loans to customers at FVTPL. 22
bln RUB, %
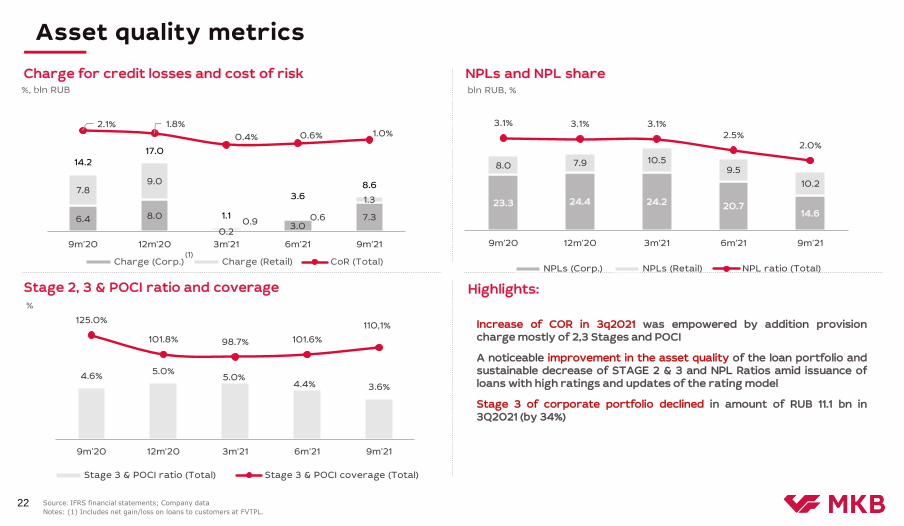
Increase of COR in 3q2021 was empowered by addition provisioncharge mostly of 2,3 Stages and POCI
A noticeable improvement in the asset quality of the loan portfolio andsustainable decrease of STAGE 2 & 3 and NPL Ratios amid issuance ofloans with high ratings and updates of the rating model
Stage 3 of corporate portfolio declined in amount of RUB 11.1 bn in3Q2021 (by 34%)
2.2% 0.8% 0.8% 0.8% 1.0%2.0% 4.6% 4.1%
3.3%2.1%
6.8% 2.1% 2.6%
5.3%1.9%
89.0%92.4%
92.6% 90.5%
95.0%
580
642
841
803
1,004
2018 2019 2020 9m'20 9m'21
Total gross corporate loan portfolio at amortized costRUB bn
Stage 1
Stage 2
Stage 3
POCI
Stages year-to-date dynamicsRUB bn
Total Allowance Coverage(1)
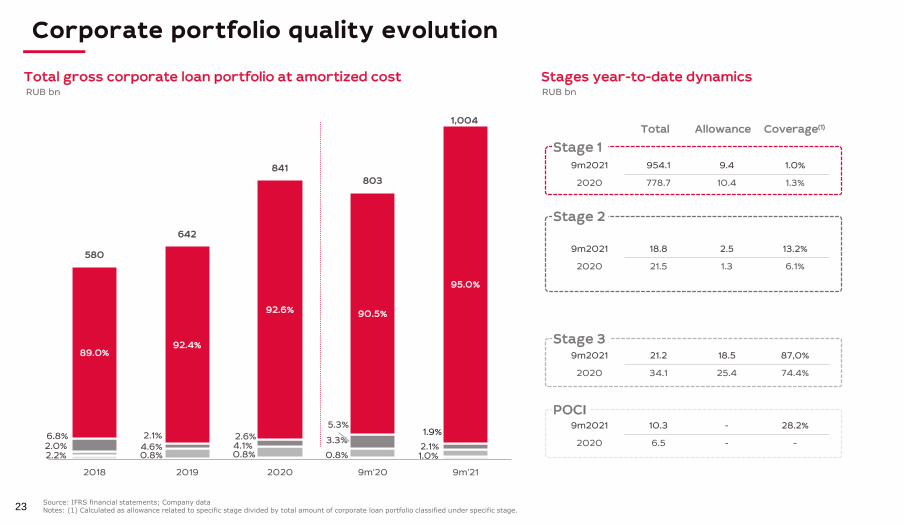
9m2021 954.1 9.4 1.0%
2020 778.7 10.4 1.3%
9m2021 18.8 2.5 13.2%
2020 21.5 1.3 6.1%
9m2021 21.2 18.5 87,0%
2020 34.1 25.4 74.4%
9m2021 10.3 - 28.2%
2020 6.5 - -
Corporate portfolio quality evolution
23Source: IFRS financial statements; Company dataNotes: (1) Calculated as allowance related to specific stage divided by total amount of corporate loan portfolio classified under specific stage.
Corporate portfolio quality evolution
4,5%
2,5%
1,0%
1,5%
2,0%
11,5%
Regulatory capital composition
24
Sound capital position
RAS capital adequacy requirements%
IFRS capital adequacy (Basel III)RUB bn
IFRS capital adequacy ratios (Basel III)%
RAS capital adequacy ratios%
145 170 191235
4738
42
38105 9599
82297 303
332355
2018 2019 2020 9m2021
10.7%11.9%
12.3%12.8%
14.1% 14.5% 15.0%14.9%
21.9% 21.2% 21.3%
19.3%
2018 2019 2020 9m2021
Total
CET18.0%
11.3% 11.5% 12.2% 11.8%
17.0%18.7%
16.5% 16.2%
8.9% 8.9% 9.1% 8.7%
2019 2020 2021 1 February 2022
Minimum Additional Tier 1
Minimum Tier 2
Systematic Risk Buffer
Capital Conservation Buffer
Minimum CET 1 (N1.1)
CET 1 Additional Tier 1 Tier 2 CET 1 Tier 1 Total CAR
N 1.1 N 1.2 N 1.0
Source: CBR; RAS and IFRS financial statements.
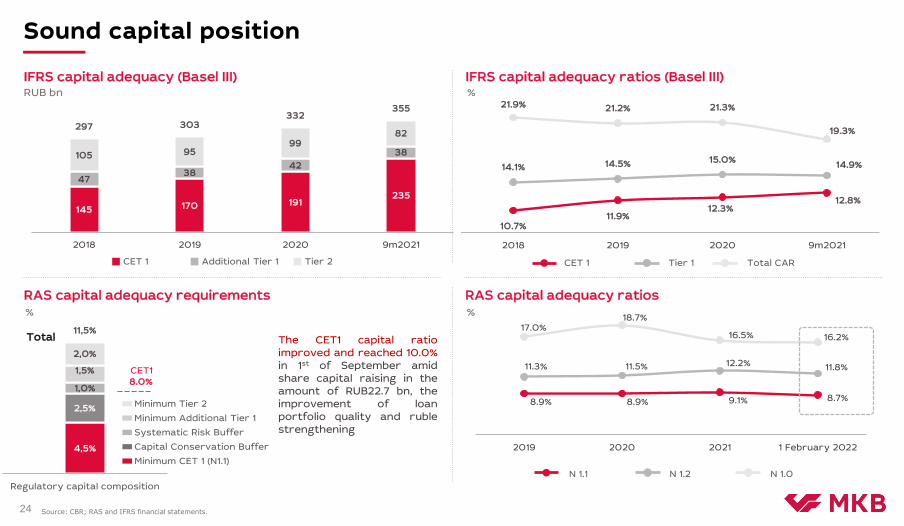
The CET1 capital ratioimproved and reached 10.0%in 1st of September amidshare capital raising in theamount of RUB22.7 bn, theimprovement of loanportfolio quality and rublestrengthening
Sound capital position

Introduction 4
Financial Performance 12
Strategy and Business Overview 18
Appendix 26

Sustainable Performance – Comparison with Russian PeersCOVID-19 risks and approach
15
Conservative approach to credit risk before COVID and proactive customer support measures allowed to minimize the negative impact of COVID
Retail segment
Quarterly CoR dynamics
• Focus on large corporates makes MKB potentially less vulnerable to economic shocks
• Wide support measures - mostly represented by the bank’s own programs - are favorable for the quality of loan portfolio
• Preventively created provisions during 1Q’20 in view of the COVID-19 outbreak
1,0%
3,3%
2,2%
0,8%1,1%
0,4% 0,9%
1,6%
0,6%
1,4% 1,3%
0,5% 0,7%0,1%
1,1%
1,6%
2019 1Q'20 2Q'20 3Q'20 4Q'20 1Q'21 2Q'21 3Q'21
CoR (Total) Corporate CoR
%
RUB 50.6bn total amount of COVID-related restructurings in 2020(2)
RUB
1.9bnrestructurings including COVID-related during 9m2021
Approved restructurings
RUB
13.4bnTotal amount of restructurings including COVID-related in 2020
Zero COVID-related restructurings during 9m2021
Portfolio focus on large corporates with strong credit
• Transport• Culture, leisure and
entertainment• Health and sport• Travel agencies and
tourism• Catering
• Additional education
• Conferences and exhibition
• Household services• Dental services
Corporate loan portfolio exposure to COVID-affected sectors(1)
98.4%Non-affected
1.6% - COVID-affected sectors(1)
• Hospitality industry
• Non-food consumer
With restructurings:
Without restructurings:
60
46
35
16 15
7,6%
5,7%
3,6%
1,6% 1,5%
0,00%
1,00%
2,00%
3,00%
4,00%
5,00%
6,00%
7,00%
8,00%
9,00%
10,00%
0
10
20
30
40
50
60
70
3m2020 6m2020 3m2021 6m2021 9m2021
Corporate loan exposure to
COVID-affected sectors, bn RUB
Corporate segment
> 90% of loans restructured return to the initial payment schedule
Source: Company data, IFRS financial statements, public sources Notes: (1) As of 30 September 2021, COVID-affected sectors as defined by the Order of the Government of Russia No. 434 (2) In Apr –Dec 2020
Sustainable Performance – Comparison with Russian PeersMacro environment overview
3Source: Bloomberg, CBR, Rosstat IMFNotes: (1) According to IMF https://www.imf.org/external/datamapper/profile/RUS (2) According to Bloomberg
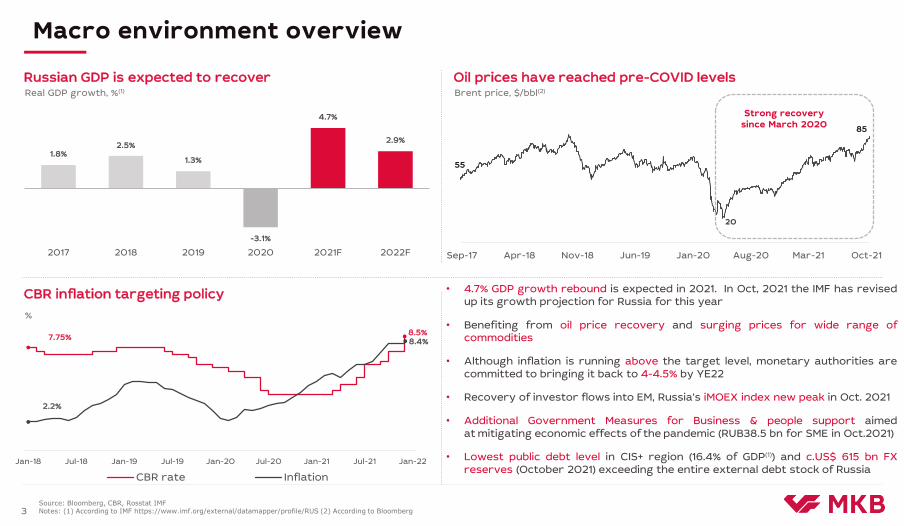
• 4.7% GDP growth rebound is expected in 2021. In Oct, 2021 the IMF has revisedup its growth projection for Russia for this year
• Benefiting from oil price recovery and surging prices for wide range ofcommodities
• Although inflation is running above the target level, monetary authorities arecommitted to bringing it back to 4-4.5% by YE22
• Recovery of investor flows into EM, Russia’s iMOEX index new peak in Oct. 2021
• Additional Government Measures for Business & people support aimedat mitigating economic effects of the pandemic (RUB38.5 bn for SME in Oct.2021)
• Lowest public debt level in CIS+ region (16.4% of GDP(1)) and c.US$ 615 bn FXreserves (October 2021) exceeding the entire external debt stock of Russia
Russian GDP is expected to recoverReal GDP growth, %(1)
1.8%2.5%
1.3%
-3.1%
4.7%
2.9%
2017 2018 2019 2020 2021F 2022F
Oil prices have reached pre-COVID levelsBrent price, $/bbl(2)
20
Sep-17 Apr-18 Nov-18 Jun-19 Jan-20 Aug-20 Mar-21 Oct-21
85
55
Strong recovery since March 2020
CBR inflation targeting policy
%
Jan-18 Jul-18 Jan-19 Jul-19 Jan-20 Jul-20 Jan-21 Jul-21 Jan-22
CBR rate Inflation
7.75%
2.2%
8.5%8.4%
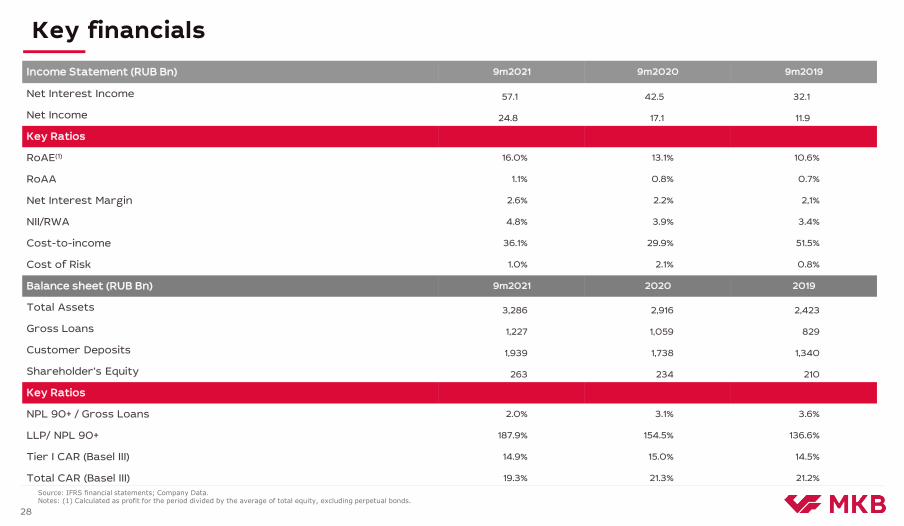
Sustainable Performance – Comparison with Russian PeersKey financials
Income Statement (RUB Bn) 9m2021 9m2020 9m2019
Net Interest Income 57.1 42.5 32.1
Net Income 24.8 17.1 11.9
Key Ratios
RoAE(1) 16.0% 13.1% 10.6%
RoAA 1.1% 0.8% 0.7%
Net Interest Margin 2.6% 2.2% 2,1%
NII/RWA 4.8% 3.9% 3.4%
Cost-to-income 36.1% 29.9% 51.5%
Cost of Risk 1.0% 2.1% 0.8%
Balance sheet (RUB Bn) 9m2021 2020 2019
Total Assets 3,286 2,916 2,423
Gross Loans 1,227 1,059 829
Customer Deposits 1,939 1,738 1,340
Shareholder’s Equity 263 234 210
Key Ratios
NPL 90+ / Gross Loans 2.0% 3.1% 3.6%
LLP/ NPL 90+ 187.9% 154.5% 136.6%
Tier I CAR (Basel III) 14.9% 15.0% 14.5%
Total CAR (Basel III) 19.3% 21.3% 21.2%
28
Source: IFRS financial statements; Company Data. Notes: (1) Calculated as profit for the period divided by the average of total equity, excluding perpetual bonds.