investor presentation - natco pharma · 2018-02-08 · adopted and successfully implemented...
TRANSCRIPT
INVESTOR PRESENTATION
February 2018

Disclaimer / Important Disclosure
THIS PRESENTATION (PRESENTATION) IS NOT AN OFFER TO SELL ANY SECURITIES OR A SOLICITATION TO BUY ANY SECURITIES OF NATCO PHARMA LIMITED OR
ITS SUBSIDIARIES OR JOINT VENTURES (TOGETHER, THE “COMPANY”).
The material that follows is a Presentation of general background information about the Company’s activities as at the date of the Presentation or as otherwise indicated. It is
information given in summary form and does not purport to be complete and it cannot be guaranteed that such information is true and accurate. This Presentation has been prepared
by and is the sole responsibility of the Company. By accessing this Presentation, you are agreeing to be bound by the trading restrictions. It is for general information purposes only
and should not be considered as a recommendation that any investor should subscribe / purchase the Company shares.
This Presentation includes statements that are, or may be deemed to be, “forward-looking statements”. These forward-looking statements can be identified by the use of forward-
looking terminology, including the terms “believes”, “estimates”, “anticipates”, “projects”, “expects”, “intends”, “may”, “will”, “seeks” or “should” or, in each case, their negative or other
variations or comparable terminology, or by discussions of strategy, plans, aims, objectives, goals, future events or intentions. These forward-looking statements include all matters
that are not historical facts. They appear in a number of places throughout this Presentation and include statements regarding the Company’s intentions, beliefs or current expectations
concerning, amongst other things, its results or operations, financial condition, liquidity, prospects, growth, strategies and the industry in which the Company operates.
By their nature, forward-looking statements involve risks and uncertainties because they relate to events and depend on circumstances that may or may not occur in the future.
Forward-looking statements are not guarantees of future performance including those relating to general business plans and strategy of the Company, its future outlook and growth
prospects, and future developments in its businesses and its competitive and regulatory environment. No representation, warranty or undertaking, express or implied, is made or
assurance given that such statements, views, projections or forecasts, if any, are correct or that the objectives of the Company will be achieved. There are some important factors that
could cause material differences to Company’s actual results. These include (i) our ability to successfully implement our strategy (ii) our growth and expansion plans (iii) changes in
regulatory norms applicable to the Company (iv) technological changes (v) investment and business income (vi) cash flow projections etc. (vii) exposure to market as well as other
risks.
The Company, as such, makes no representation or warranty, express or implied, as to, and does not accept any responsibility or liability with respect to, the fairness, accuracy,
completeness or correctness of any information or opinions contained herein. The information contained in this Presentation, unless otherwise specified is only current as of the date of
this Presentation. The Company assumes no responsibility to publicly amend, modify or revise any forward looking statements, on the basis of any subsequent development,
information or events, or otherwise. Unless otherwise stated in this Presentation, the information contained herein is based on management information and estimates.
Any opinions expressed in this presentation are subject to change without notice. The presentation should not be construed as legal, tax, investment or other advice. None of the
Company or any of its affiliates, advisers or representatives accepts any liability whatsoever for any loss howsoever arising from any information presented or contained in this
presentation. The information contained in this presentation has not been independently verified. Furthermore, no person is authorized to give any information or make any
representation which is not contained in, or is inconsistent with, this presentation. Any such extraneous or inconsistent information or representation, if given or made, should not be
relied upon as having been authorized by or on behalf of the Company. Further, past performance is not necessarily indicative of future results.
This document is just a Presentation for information purposes and private circulation only and is not intended to be a “prospectus” or “offer document” or a “private placement offer
letter” (as defined or referred to, as the case may be, under the Companies Act, 2013). It is clarified that this Presentation is not intended to be a document offering for subscription or
sale of any securities or inviting offers from the Indian public (including any section thereof) or from persons residing in any other jurisdiction including the United States for the
subscription to or sale of any securities including the equity shares of the Company or any of its subsidiaries. No part of it should form the basis of or be relied upon in connection with
any investment decision or any contract or commitment to purchase or subscribe for any securities. None of the Company’s securities may be offered or sold in the United States
without registration under the U.S. Securities Act of 1933, as amended, except pursuant to an exemption from registration there from.
This document has not been and will not be reviewed or approved by a regulatory authority in India or by any stock exchange in India. This presentation is confidential and this
presentation or any part thereof should not be used or relied upon by any other party or for any other purpose and should not be copied, reproduced, recirculated, redistributed,
published in any media, website or otherwise, in any form or manner, in part or as a whole, without the express consent in writing of the Company. Any unauthorized use, disclosure or
public dissemination of information contained herein is prohibited. The distribution of this presentation in certain jurisdictions may be restricted by law. Accordingly, any persons in
possession of the aforesaid should inform themselves about and observe any such restrictions.
2
Natco Pharma at a Glance
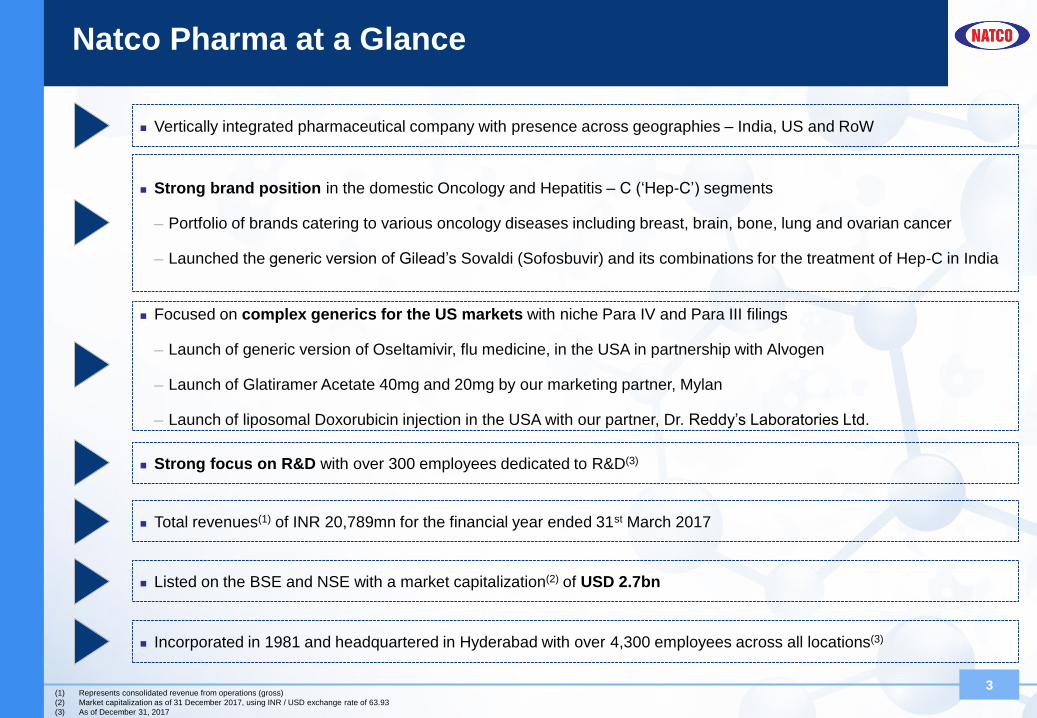
Vertically integrated pharmaceutical company with presence across geographies – India, US and RoW
3(1) Represents consolidated revenue from operations (gross)
(2) Market capitalization as of 31 December 2017, using INR / USD exchange rate of 63.93
(3) As of December 31, 2017
Strong brand position in the domestic Oncology and Hepatitis – C (‘Hep-C’) segments
─ Portfolio of brands catering to various oncology diseases including breast, brain, bone, lung and ovarian cancer
─ Launched the generic version of Gilead’s Sovaldi (Sofosbuvir) and its combinations for the treatment of Hep-C in India
Focused on complex generics for the US markets with niche Para IV and Para III filings
─ Launch of generic version of Oseltamivir, flu medicine, in the USA in partnership with Alvogen
─ Launch of Glatiramer Acetate 40mg and 20mg by our marketing partner, Mylan
─ Launch of liposomal Doxorubicin injection in the USA with our partner, Dr. Reddy’s Laboratories Ltd.
Strong focus on R&D with over 300 employees dedicated to R&D(3)
Total revenues(1) of INR 20,789mn for the financial year ended 31st March 2017
Listed on the BSE and NSE with a market capitalization(2) of USD 2.7bn
Incorporated in 1981 and headquartered in Hyderabad with over 4,300 employees across all locations(3)
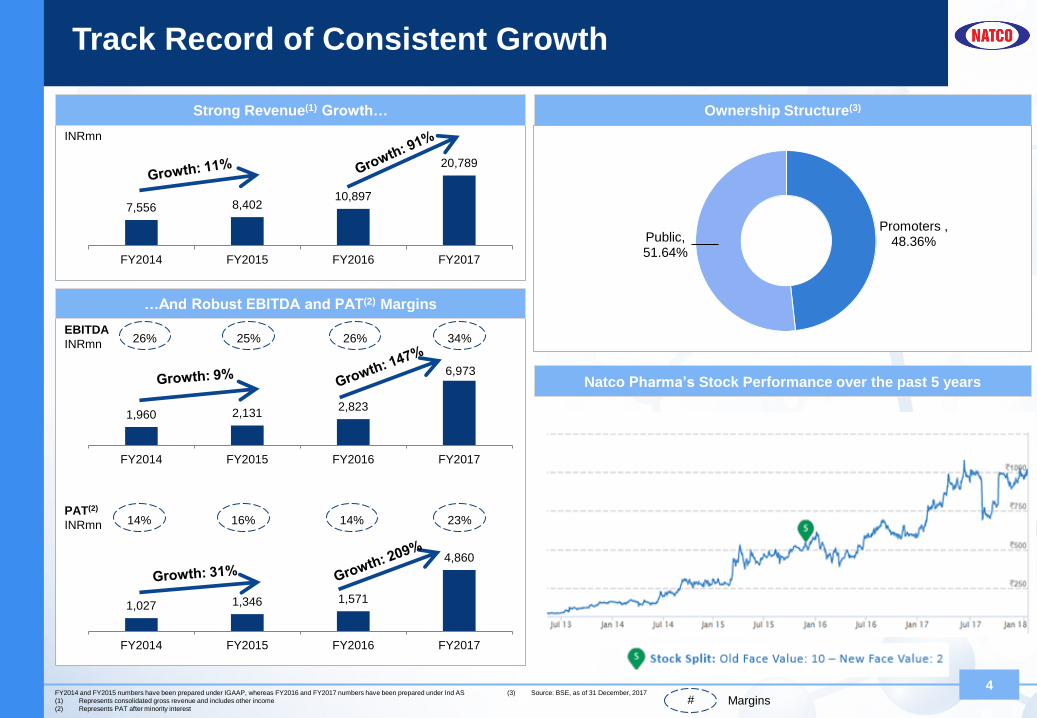
FY2014 and FY2015 numbers have been prepared under IGAAP, whereas FY2016 and FY2017 numbers have been prepared under Ind AS
(1) Represents consolidated gross revenue and includes other income
(2) Represents PAT after minority interest
(3) Source: BSE, as of 31 December, 2017
Track Record of Consistent Growth
7,556 8,402 10,897
20,789
FY2014 FY2015 FY2016 FY2017
Strong Revenue(1) Growth…
4
1,960 2,131 2,823
6,973
FY2014 FY2015 FY2016 FY2017
…And Robust EBITDA and PAT(2) Margins
1,027 1,346 1,571
4,860
FY2014 FY2015 FY2016 FY2017
26% 25% 26% 34%
14% 16% 14% 23%
# Margins
INRmn
EBITDA
INRmn
PAT(2)
INRmn
Ownership Structure(3)
Natco Pharma’s Stock Performance over the past 5 years
Promoters , 48.36%Public,
51.64%
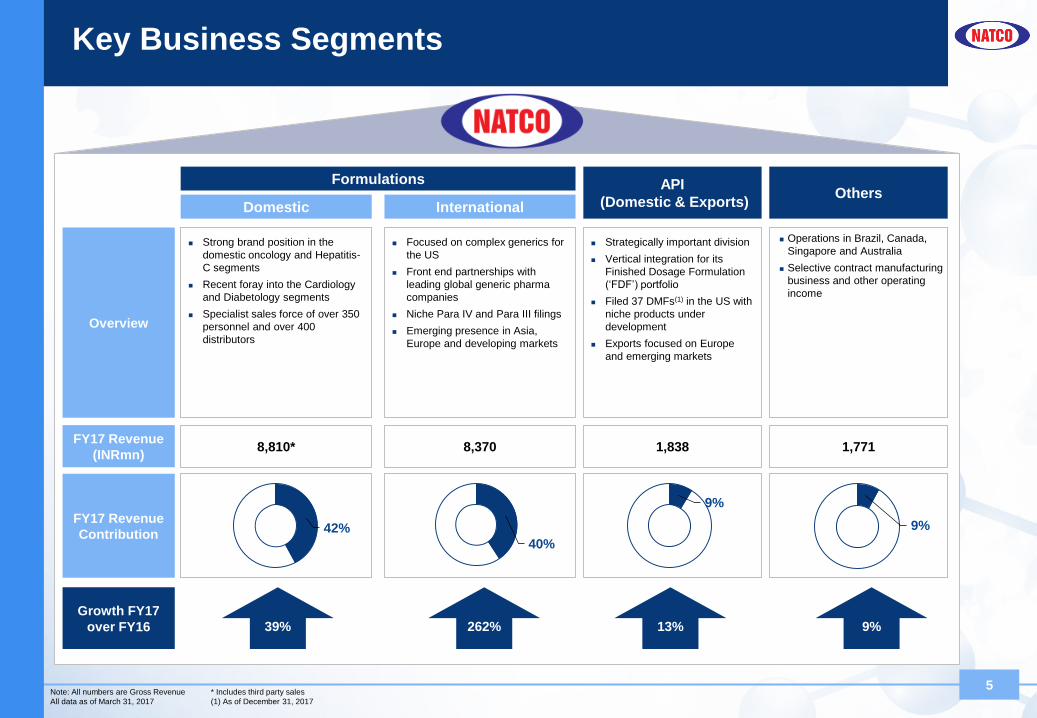
Key Business Segments
5
Strategically important division
Vertical integration for its
Finished Dosage Formulation
(‘FDF’) portfolio
Filed 37 DMFs(1) in the US with
niche products under
development
Exports focused on Europe
and emerging markets
Formulations
Operations in Brazil, Canada,
Singapore and Australia
Selective contract manufacturing
business and other operating
income
OthersAPI
(Domestic & Exports)
Overview
FY17 Revenue
(INRmn)1,838 1,771
FY17 Revenue
Contribution
Growth FY17
over FY16
International
Focused on complex generics for
the US
Front end partnerships with
leading global generic pharma
companies
Niche Para IV and Para III filings
Emerging presence in Asia,
Europe and developing markets
8,370
40%
262% 13% 9%
Note: All numbers are Gross Revenue
All data as of March 31, 2017
* Includes third party sales
(1) As of December 31, 2017
Strong brand position in the
domestic oncology and Hepatitis-
C segments
Recent foray into the Cardiology
and Diabetology segments
Specialist sales force of over 350
personnel and over 400
distributors
Domestic
8,810*
39%
42%
9%
9%

US Market - Focus on Complex Generics
6
Overview of Key Filings
Pipeline of niche and complex generics products in US
29 approved ANDAs(2)
16 Para IVs yet to be launched (2)
(1) Launch conditional on approval
(2) As of December 31, 2017. Approval received either by Natco or its marketing partner
Key Brand MoleculeTherapeutic Segment
/ IndicationDosage Form Para IV
Copaxone
20&40mgGlatiramer 20&40mg Multiple Sclerosis PFS
DoxilDoxorubicin
HydrochlorideOvarian cancer Injection
TamifluOseltamivir
SuspensionInfluenza Infection Suspension
Fosrenol Lanthanum CarbonateEnd stage renal
diseaseTablets
Revlimid(1) Lenalidomide Multiple Myloma Capsules
Nexavar Sorafenib Liver, Kidney Cancer Tablets
Lau
nch
ed
US FDF product portfolio is predominantly focused on high-barrier-to-entry products that are typically characterised by one or more of the following:
- Intricate chemistry
- Challenging delivery mechanism
- Difficult or complex manufacturing process
- May face complex legal and regulatory challenges
To
Be
Lau
nch
ed
Low Risk Business Model through Partnerships with
Global Pharmaceutical Players
Adopted and successfully implemented partnership strategy
for international formulation products
─ Has product specific partnerships with global generic
players at different stages of a potential ANDA filing
─ Low risk business model:
Marketing partner typically responsible for the litigation
and regulatory process to secure the ANDA approval
Multi-site approvals
Multi-sourcing arrangements
─ Profit sharing arrangements with the front end partners.
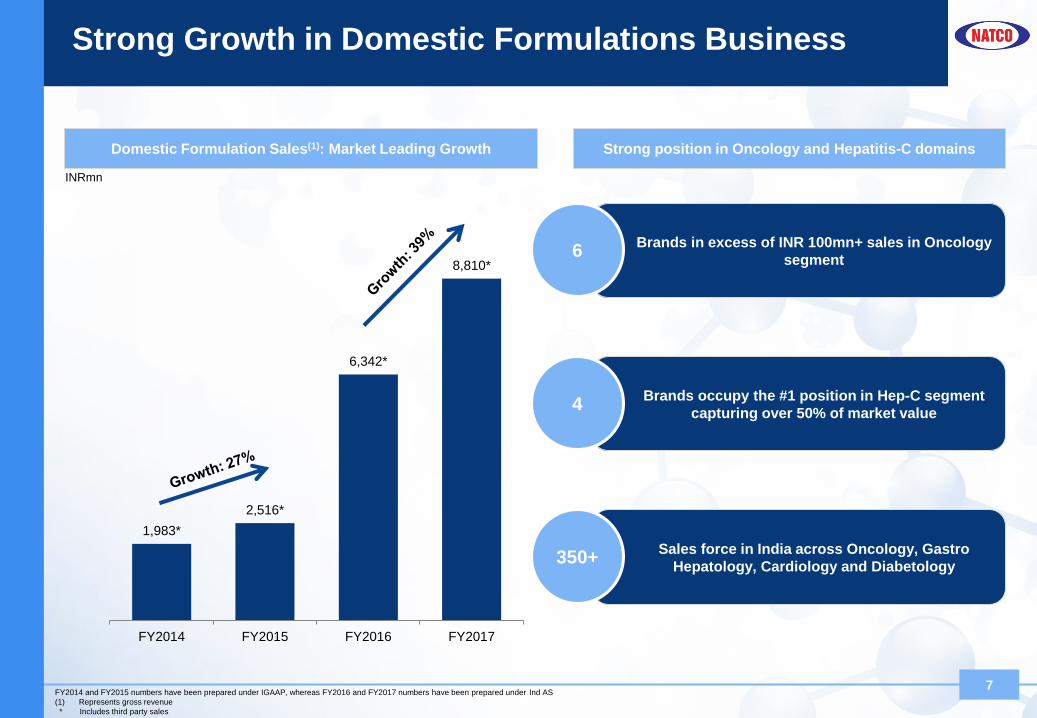
Strong Growth in Domestic Formulations Business
7
Domestic Formulation Sales(1): Market Leading Growth
1,983*
2,516*
6,342*
8,810*
FY2014 FY2015 FY2016 FY2017
Strong position in Oncology and Hepatitis-C domains
Brands in excess of INR 100mn+ sales in Oncology
segment6
Brands occupy the #1 position in Hep-C segment
capturing over 50% of market value4
Sales force in India across Oncology, Gastro
Hepatology, Cardiology and Diabetology 350+
INRmn
FY2014 and FY2015 numbers have been prepared under IGAAP, whereas FY2016 and FY2017 numbers have been prepared under Ind AS
(1) Represents gross revenue
* Includes third party sales
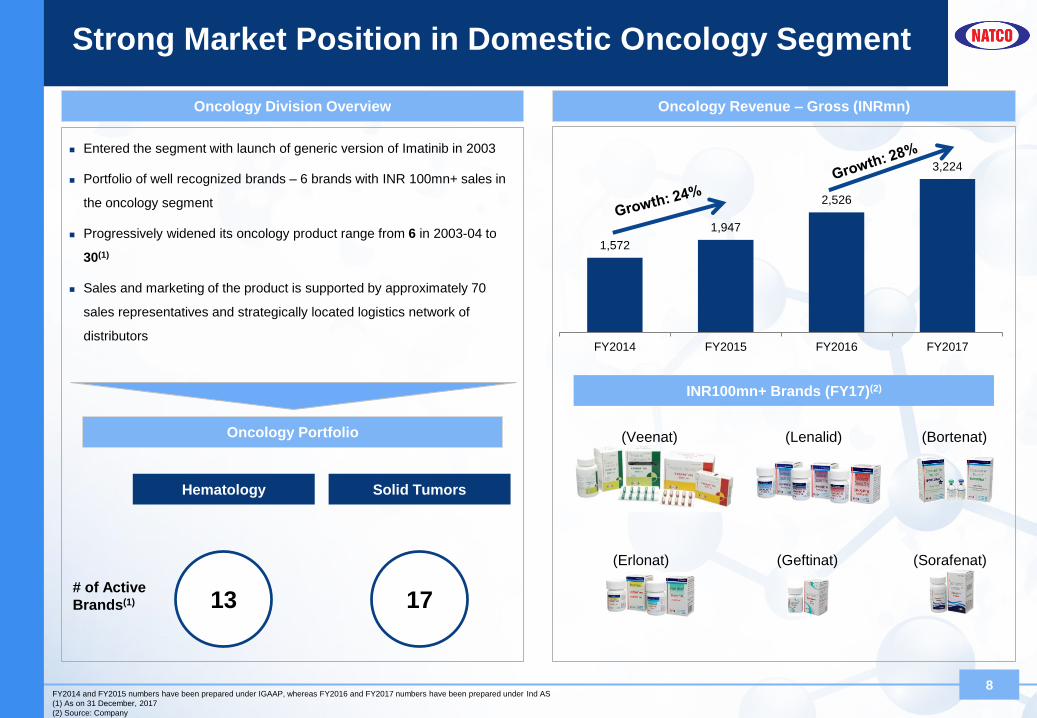
Strong Market Position in Domestic Oncology Segment
8
Entered the segment with launch of generic version of Imatinib in 2003
Portfolio of well recognized brands – 6 brands with INR 100mn+ sales in
the oncology segment
Progressively widened its oncology product range from 6 in 2003-04 to
30(1)
Sales and marketing of the product is supported by approximately 70
sales representatives and strategically located logistics network of
distributors
Oncology Portfolio
FY2014 and FY2015 numbers have been prepared under IGAAP, whereas FY2016 and FY2017 numbers have been prepared under Ind AS
(1) As on 31 December, 2017
(2) Source: Company
Oncology Revenue – Gross (INRmn)Oncology Division Overview
Hematology Solid Tumors
13# of Active
Brands(1) 17
INR100mn+ Brands (FY17)(2)
(Veenat) (Lenalid)
(Erlonat) (Geftinat) (Sorafenat)
(Bortenat)
1,572
1,947
2,526
3,224
FY2014 FY2015 FY2016 FY2017

Gastro Hepatology – Leading Market Position in Hep-C
9
272
3,535
5,407
FY15 FY16 FY17
Demonstrating Strong Revenue Growth (INRmn)Expanding Into Emerging Markets Of Asia And Africa
(1)
FY2014 and FY2015 numbers have been prepared under IGAAP, whereas FY2016 and FY2017 numbers have been prepared under Ind AS
(1) Represents partial year revenue with 1 month of operations.
(2) Source: AWACS, Market share for the month of December 2017
(3) Including India
Market
Leading
Hep-C
Franchise
Extending
the Hep-C
Franchise
Launched generic Sofosbuvir and its combinations for the treatment of
Hep-C in India & Nepal under its brand Hepcinat & Hepcinat LP
Non-exclusive licensing agreement with Gilead Sciences for 101 countries
including India
Launched generic Daclatasvir in India under its brand Natdac
Market leading positions across the Hep-C class of drugs in India
Sales and marketing of the product is supported by approximately 120
sales representatives
Launched an oral fixed-dose combination of Sofosbuvir and Velapatasvir
under its brand Velpanat
Foraying into RoW markets
Key B
ran
ds
Market Share(2)
Hepcinat
Hepcinat LP
Natdac
Velpanat59%
68%
53%
58%
Import Permits & Approvals Received
Access via Agreement with Gilead
Import permits and approvals received in 14 countries(3)
Note: Rounded off to zero decimal places
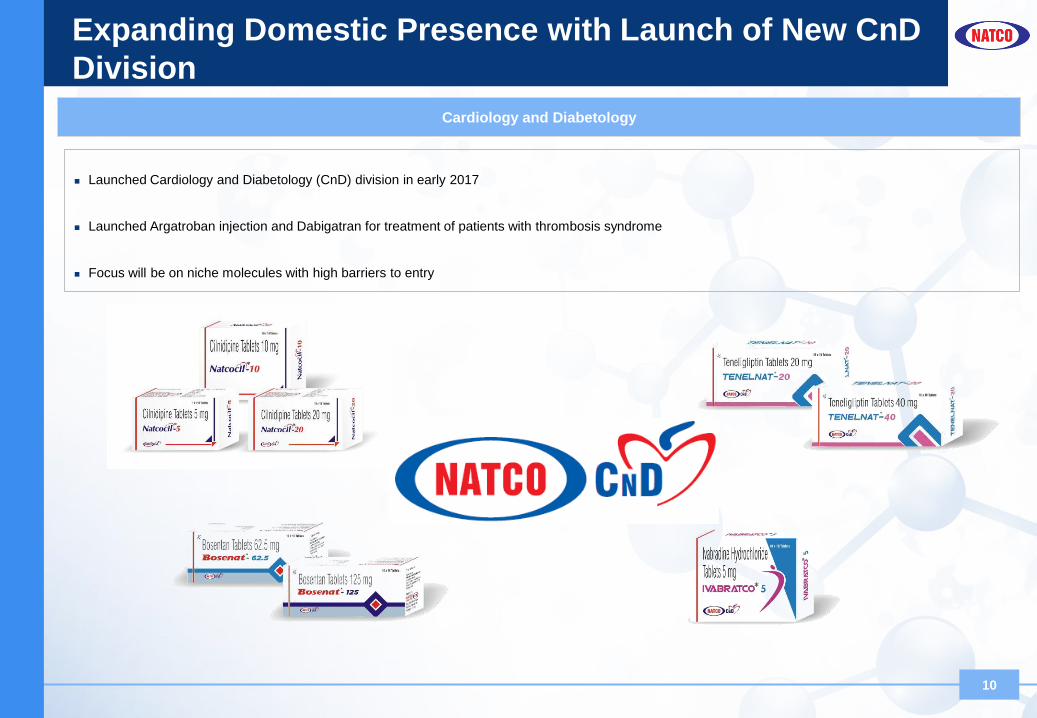
Expanding Domestic Presence with Launch of New CnD
Division
10
Cardiology and Diabetology
Launched Cardiology and Diabetology (CnD) division in early 2017
Launched Argatroban injection and Dabigatran for treatment of patients with thrombosis syndrome
Focus will be on niche molecules with high barriers to entry

Expanding RoW Presence
11
RoW growth led by Hep-C franchise expansion and continued business in LatAm and other Asian countries
Europe
Distribution arrangements with our
business partner to sell our products in
Eastern Europe, UK and Germany
Hep-C driven markets
Received approvals and import permits for
14 countries(1)
(1) Including India
Note: All data as of December 31, 2017
Launched Oseltamivir (generic drug of
Tamiflu) (75mg Capsule)
12 approvals
Successful listings in major provinces
and retail chains
Canada
Commenced operations in
2011
Filed multiple oncology
products
Brazil
Presence in Singapore (7 approvals) and
Australia
Asia Pacific
(Including Australia)
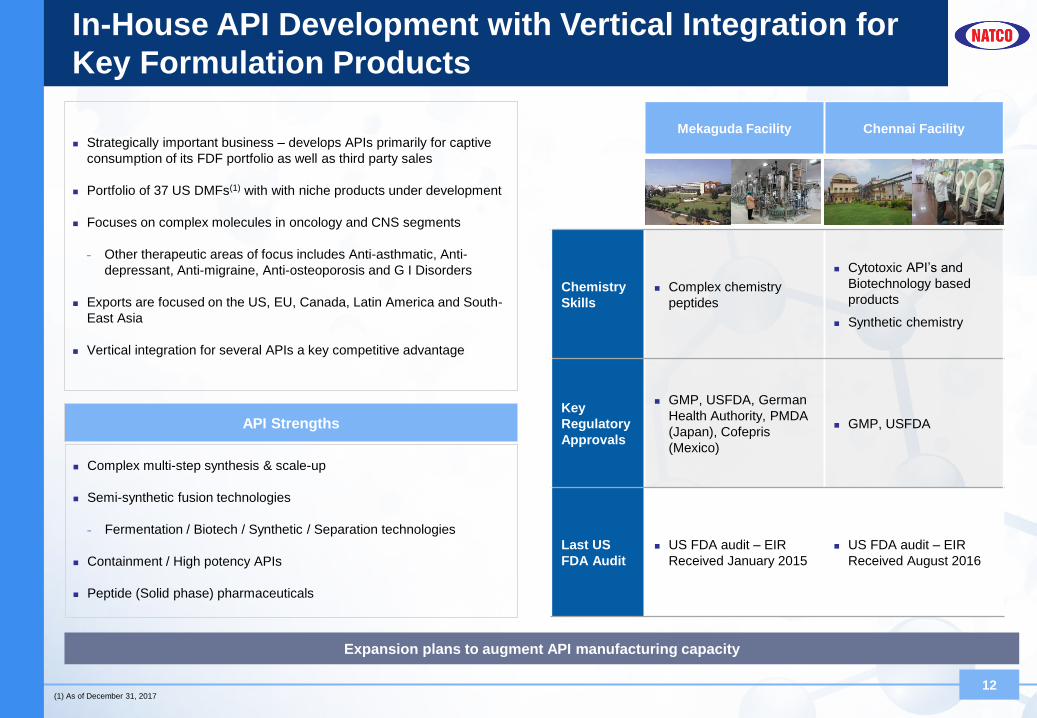
In-House API Development with Vertical Integration for
Key Formulation Products
Strategically important business – develops APIs primarily for captive
consumption of its FDF portfolio as well as third party sales
Portfolio of 37 US DMFs(1) with with niche products under development
Focuses on complex molecules in oncology and CNS segments
− Other therapeutic areas of focus includes Anti-asthmatic, Anti-
depressant, Anti-migraine, Anti-osteoporosis and G I Disorders
Exports are focused on the US, EU, Canada, Latin America and South-
East Asia
Vertical integration for several APIs a key competitive advantage
API Strengths
Complex multi-step synthesis & scale-up
Semi-synthetic fusion technologies
− Fermentation / Biotech / Synthetic / Separation technologies
Containment / High potency APIs
Peptide (Solid phase) pharmaceuticals
12
Expansion plans to augment API manufacturing capacity
Mekaguda Facility Chennai Facility
Chemistry
Skills
Complex chemistry
peptides
Cytotoxic API’s and
Biotechnology based
products
Synthetic chemistry
Key
Regulatory
Approvals
GMP, USFDA, German
Health Authority, PMDA
(Japan), Cofepris
(Mexico)
GMP, USFDA
Last US
FDA Audit
US FDA audit – EIR
Received January 2015
US FDA audit – EIR
Received August 2016
(1) As of December 31, 2017

Research & Development Capabilities
13
R&D Expense (INRmn) and as % of Standalone Revenue
407 517703
1,216
FY2014 FY2015 FY2016 FY2017
29 ANDAs Approved(2)
37 US DMFs Filed(2)
Several International and
Indian patents filed and
granted
Two research facilities with capabilities across synthetic chemistry, biotech & fermentation, nano
pharmaceuticals, new drug discovery & cell biology
R&D capabilities demonstrated by its complex and niche product filings in
formulations and API segments
FY2014 and FY2015 numbers have been prepared under IGAAP, whereas FY2016 and FY2017 numbers have been prepared under Ind AS
(1) As of September 30, 2017.
(2) As of December 31, 2017. Approval received either by Natco or its marketing partner
Talented Pool of Scientists (Total no: 314)(1)
Analytical Dev.26%
Chemistry, Formulations
& Fundamental
Research49%
Process Research
7%
Others18%
Ph.D.9%
Masters61%
Others30%
6.4% 7.1% 6.7% 6.0%
# % of standalone revenues
Over 35 R&D laboratories
Note: Rounded off to the nearest decimal Note: Rounded off to the nearest decimal
16 Para IVs to be Launched(2)

Commitment to Manufacturing Excellence with a Culture
of Quality and Compliance
14
International Markets Formulations
Kothur Facility Visakhapatnam Facility
Capability Tablets, Capsules, Pellets, Injectables Cytotoxic & other Oral Solid Dosages
Key
Regulatory
Approvals
GMP, USFDA, German Health Authority, ANVISA na
Other
Highlights US FDA audit – EIR Received July 2017
Targeted towards US & other International regulated markets
Located in a Special Economic Zone (SEZ)
Expect to be operationally ready by April 2018
Domestic Market Formulations
Nagarjuna Sagar Facility Dehradun Unit 6 Facility Dehradun Unit 7 Facility Guwahati Facility
Capability Ampoules, Vials, Lyophilized vials,
Parenterals, Sterile Dry Powders Tablets, Capsules, Injectables Tablets, Capsules Tablets, Capsules
Key
Regulatory
Approvals
GMP GMP GMP, Public Health Service of the
Netherlands (EU GMP) GMP Compliant Facility
Under development
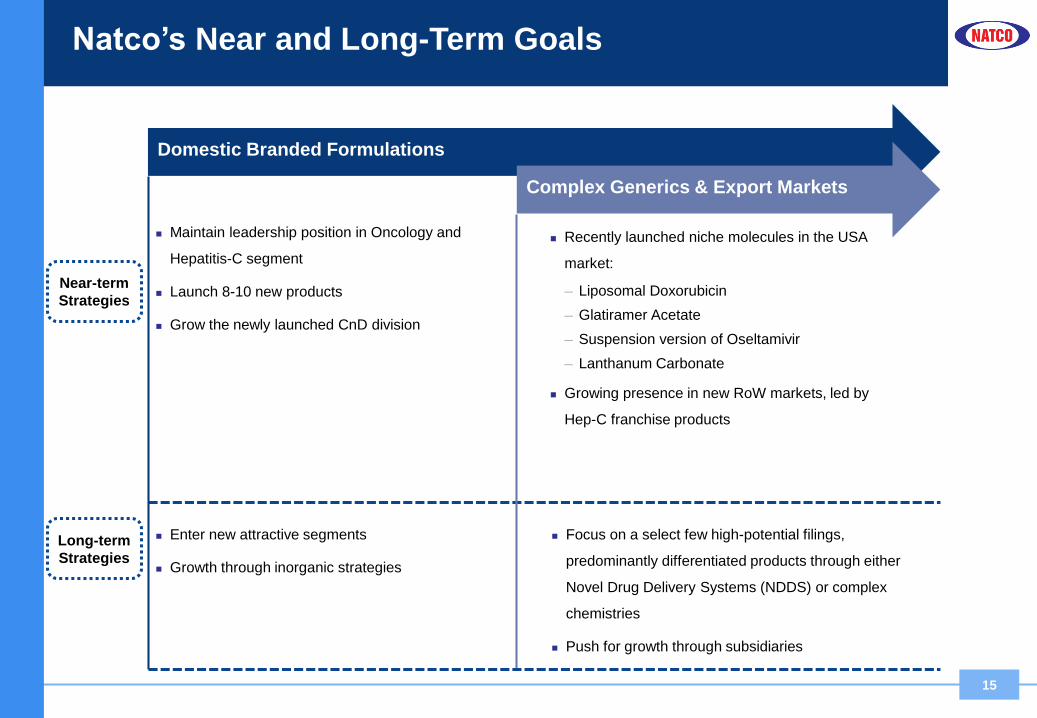
Natco’s Near and Long-Term Goals
15
Maintain leadership position in Oncology and
Hepatitis-C segment
Launch 8-10 new products
Grow the newly launched CnD division
Domestic Branded Formulations
Complex Generics & Export Markets
Near-term
Strategies
Long-term
Strategies
Enter new attractive segments
Growth through inorganic strategies
Recently launched niche molecules in the USA
market:
─ Liposomal Doxorubicin
─ Glatiramer Acetate
─ Suspension version of Oseltamivir
─ Lanthanum Carbonate
Growing presence in new RoW markets, led by
Hep-C franchise products
Focus on a select few high-potential filings,
predominantly differentiated products through either
Novel Drug Delivery Systems (NDDS) or complex
chemistries
Push for growth through subsidiaries
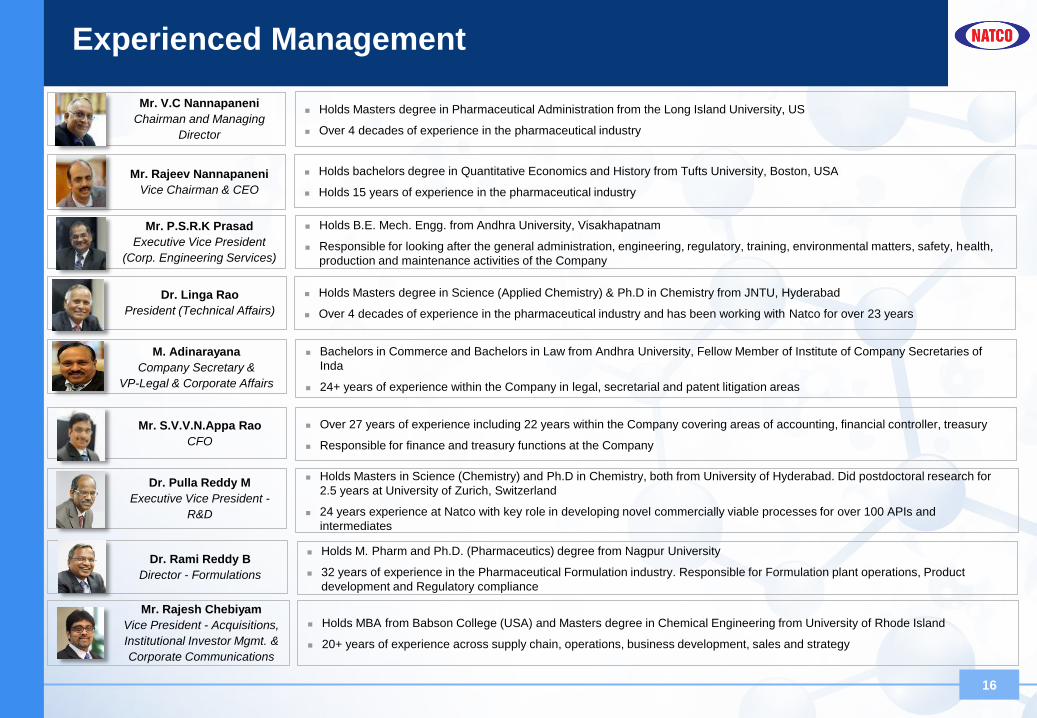
Experienced Management
16
Dr. Linga Rao
President (Technical Affairs)
Mr. V.C Nannapaneni
Chairman and Managing
Director
Holds Masters degree in Pharmaceutical Administration from the Long Island University, US
Over 4 decades of experience in the pharmaceutical industry
Mr. Rajeev Nannapaneni
Vice Chairman & CEO
Holds bachelors degree in Quantitative Economics and History from Tufts University, Boston, USA
Holds 15 years of experience in the pharmaceutical industry
Holds Masters degree in Science (Applied Chemistry) & Ph.D in Chemistry from JNTU, Hyderabad
Over 4 decades of experience in the pharmaceutical industry and has been working with Natco for over 23 years
Mr. P.S.R.K Prasad
Executive Vice President
(Corp. Engineering Services)
Holds B.E. Mech. Engg. from Andhra University, Visakhapatnam
Responsible for looking after the general administration, engineering, regulatory, training, environmental matters, safety, health,
production and maintenance activities of the Company
Mr. Rajesh Chebiyam
Vice President - Acquisitions,
Institutional Investor Mgmt. &
Corporate Communications
Mr. S.V.V.N.Appa Rao
CFO
Over 27 years of experience including 22 years within the Company covering areas of accounting, financial controller, treasury
Responsible for finance and treasury functions at the Company
Holds MBA from Babson College (USA) and Masters degree in Chemical Engineering from University of Rhode Island
20+ years of experience across supply chain, operations, business development, sales and strategy
Dr. Pulla Reddy M
Executive Vice President -
R&D
Holds Masters in Science (Chemistry) and Ph.D in Chemistry, both from University of Hyderabad. Did postdoctoral research for
2.5 years at University of Zurich, Switzerland
24 years experience at Natco with key role in developing novel commercially viable processes for over 100 APIs and
intermediates
Holds M. Pharm and Ph.D. (Pharmaceutics) degree from Nagpur University
32 years of experience in the Pharmaceutical Formulation industry. Responsible for Formulation plant operations, Product
development and Regulatory compliance
Dr. Rami Reddy B
Director - Formulations
Bachelors in Commerce and Bachelors in Law from Andhra University, Fellow Member of Institute of Company Secretaries of
Inda
24+ years of experience within the Company in legal, secretarial and patent litigation areas
M. Adinarayana
Company Secretary &
VP-Legal & Corporate Affairs

7,5568,402
10,897
FY2014 FY2015 FY2016 FY2017
Demonstrated Track Record of Topline and Earnings
Growth
Total Gross Revenue(1) (INRmn) EBITDA (INRmn) and EBITDA Margin (%)
PAT(2) (INRmn) and PAT Margin (%)
17
1,960 2,1312,823
6,973
FY2014 FY2015 FY2016 FY2017
25.9% 25.4% 25.9%
ROE (%) ROCE (%)
1,027 1,346 1,571
4,860
FY
201
4
FY
201
5
FY
201
6
FY
201
7
13.6% 16.0% 14.4%
14.2%15.9%
12.0%
29.5%
FY
201
4
FY
201
5
FY
201
6
FY
201
7
18.7% 17.1% 16.9%
38.0%
FY
201
4
FY
201
5
FY
201
6
FY
201
7
(1) Represents consolidated gross revenue and includes other income
(2) Represents PAT after minority interest
23.4%
33.5%
20,789
FY2014 and FY2015 numbers have been prepared under IGAAP, whereas FY2016 and FY2017 numbers have been prepared under Ind AS

Historical Financials
Consolidated Profit & Loss Statement
(INRmn)
18
Consolidated Balance Sheet
(INRmn)
FY2014 and FY2015 numbers have been prepared under IGAAP, whereas FY2016 and FY2017 numbers have been prepared under Ind AS
Particulars 31-Mar-17 31-Mar-16
Equity share capital 349 348
Other equity 16,144 12,609
Non-controlling interest 40 49
Total of Equity 16,533 13,007
Financial Liabilities
Borrowings - -
Other financial liabilities 8 8
Employee benefit obligations 219 125
Deferred tax liabilities 150 146
Total Non-current liabilities 377 279
Financial liabilities
Borrowings 2,216 984
Trade payables 2,627 2,755
Other financial liabilities 1,014 815
Current tax liabilities, net 133 34
Other current liabilities 258 327
Employee benefit obligations 18 15
Total Non-current liabilities 6,265 4,929
Total equity and liabilities 23,175 18,215
Property, plant and equipment 8,272 7,046
Capital work-in-progress 3,362 2,118
Other intangible assets 58 55
Investments 1 1
Other financial assets 131 106
Other non-current assets 478 521
Total Non-current assets 12,302 9,847
Inventories 3,489 3,573
Financial Assets
Investments 321 221
Trade receivables 4,751 2,616
Cash and cash equivalents 235 242
Other bank balances 123 210
Loans 34 28
Other financial assets 752 770
Income tax asset - 34
Other current assets 1,166 676
Total current assets 10,873 8,368
Total assets 23,175 18,215
Particulars 31-Mar-17 31-Mar-16
Revenue from operations (gross) 20,650 10,804
Less : Excise duty
Revenue from operations (net) 20,650 10,804
Other income 139 94
Total revenue 20,789 10,897
Expenses
Cost of material consumed 5,208 3,037
Purchase of stock in trade 971 152
Change in Inventory (188) (483)
Employee benefits 2,432 1,798
Finance costs 185 229
Depreciation 544 508
Other expenses 5,393 3,641
Prior period expenses 0 0
Total expenses 14,545 8,882
Profit before exceptional items and tax 6,244 2,015
Exceptional item 0 0
Profit before tax 6,244 2,015
Current Tax 1,393 441
Deferred Tax Benefit 1 38
PAT (Before Minority interest) 4,849 1,536
Profit from discontinued operations, net of tax 22
Minority Interest (11) (13)
PAT (After Minority interest) 4,860 1,571

Segmental Breakdown (INR Mn)
Historical Financials (contd.)
Consolidated Financial Results (INR Mn)
Note: The Company adopted Indian Accounting Standards ("Ind AS") from 1 April 2016 and prior period figures have been reclassified wherever required to conform to the classification of the current period.
19
Revenue Division
Quarter Ended
Q3 – FY18 Q2 – FY18 Q1 – FY18 Q3 – FY17
API, Domestic 87.9 118.2 67.2 186.3
API, Exports 722.6 465.5 795.9 320.9
API Gross Revenue 810.6 583.7 863.1 507.2
Formulations, Exports 350.8 673.7 436.1 1,738.0
Income from Profit Sharing/Service
Income2,539.6 594.5 901.8 1,870.9
Formulations Onco (including CnD) 848.4 973.0 731.0 882.7
Formulations, Brand Pharma
Non-Onco685.7 948.9 844.7 1,121.4
Formulations, 3rd party, & miscel 125.7 213.2 246.2 184.4
Formulations Gross Revenue 4,550.1 3,403.3 3,159.8 5,797.5
Stand-Alone Total Net Revenue 5,515.5 4,132.7 4,334.8 6727.6
Total Revenue, all subsidiaries 220.5 189.7 152.2 123.7
Consolidated Total Net Revenue 5,736.0 4,322.3 4,487.0 6,851.3
Quarter ended
Q3 – FY18 Q2 – FY18 Q1 – FY18 Q3 – FY17
Total Revenues 5,736 4,322 4,487 6,851
EBITDA 2,979 1,274 1401 2,663
EBITDA Margin (%) 51.9% 29.5% 31.2% 38.9%
PAT 2,174 844 937 1,949
PAT Margin (%) 37.9% 19.5% 20.9% 28.4%