investor presentation - norsk hydro · pdf fileinvestor presentation ... presentation of what...
TRANSCRIPT

www.hydro.com
Investor presentation
July 2007
2
Certain statements contained in this announcement constitute “forward-looking information” within the meaning of Section 27A of the US Securities Act of 1933, as amended, and Section 21E of the US Securities Exchange Act of 1934, as amended. In order to utilize the “safe harbors” within these provisions, Hydro is providing the following cautionary statement.
Certain statements included within this announcement contain (and oral communications made by or on behalf of Hydro may contain) forward-looking information, including, without limitation, those relating to (a) forecasts, projections and estimates, (b) statements of management’s plans, objectives and strategies for Hydro, such as planned expansions, investments, drilling activity or other projects, (c) targeted production volumes and costs, capacities or rates, start-up costs, cost reductions and profit objectives, (d) various expectations about future developments in Hydro’s markets, particularly prices, supply and demand and competition, (e) results of operations, (f) margins, (g) growth rates, (h) risk management, as well as (i) statements preceded by “expected”, “scheduled”, “targeted”, “planned”, “proposed”, “intended” or similar statements.
Although Hydro believes that the expectations reflected in such forward-looking statements are reasonable, these forward-looking statements are based on a number of assumptions and forecasts that, by their nature, involve risk and uncertainty. Various factors could cause Hydro’s actual results to differ materially from those projected in a forward-looking statement or affect the extent to which a particular projection is realized. Factors that could cause these differences include, but are not limited to, world economic growth and other economic indicators, including rates of inflation and industrial production, trends in Hydro’s key markets, and global oil and gas and aluminium supply and demand conditions. For a detailed description of factors that could cause Hydro’s results to differ materially from those expressed or implied by such statements, please refer to the risk factors specified under “Risk review – Risk factors” on page 134 of Hydro’s Annual Report 2006 (including Form 20-F) and subsequent filings on Form 6-K with the US Securities and Exchange Commission.
No assurance can be given that such expectations will prove to have been correct. Hydro disclaims any obligation to update or revise any forward-looking statements, whether as a result of new information, future events or otherwise.
Cautionary note in relation to certain forward-looking statements
With respect to each non-GAAP financial measure Hydro uses in connection with its financial reporting and other public communications, Hydro provides a presentation of what Hydro believes to be the most directly comparable GAAP financial measure and a reconciliation between the non-GAAP and GAAP measures. This information can be found in Hydro's earnings press releases, quarterly reports and other written communications, all of which have been posted to Hydro's website (www.hydro.com).
The United States Securities and Exchange Commission permits oil and gas companies, in their filings with the SEC, to disclose only proved reserves that a company has demonstrated by actual production or conclusive formation tests to be economically and legally producible under existing economic and operating conditions. We use certain terms in this presentation material, such as expected recoverable resources, that the SEC’s guidelines strictly prohibit us from including in filings with the SEC. Investors are urged to consider closely the disclosure in our Form 20-F, SEC File No. 1-9159, available from us at our Corporate Headquarter: Norsk Hydro, N-0240 Oslo, Norway. You can also obtain this form from the SEC by calling 1-800-SEC-0330.
Use of non-GAAP financial measures/Cautionary note in relation to oil and gas reserves

3
Table of contents
A brief company overview 5
Business area presentation- Bauxite & Alumina- Aluminium Metal- Aluminium Products- Power- Oil & Gas
Second quarter results 2007 - Oil & Energy - Aluminium Metal- Aluminium Products
Additional financial information
2633465966
7982889195
110Investor Relations in Hydro

4
A brief company overview

5
Hydro – a focused aluminium and power company
Aluminium MetalsAluminium Metals Aluminium ProductsPower
Streamlining “new” Hydro
Implementing merger of Hydro’s oil and gas activities with Statoil
Oil Gas
Polymers
Sold
Divesting Polymers
Aluminium Metals

6
Significant value creation through restructuring
61
46
49
99
195
2007 1)
NOK billion
1) 20 July 2007 close. Aluminium and Oil & Gas based on transaction equation2) 4 January 1999 close, nominal value
389
Oil & Gas
Aluminium& Power
1999 2)
Dividends& Buybacks
Conglomerate
Fertilizer
7
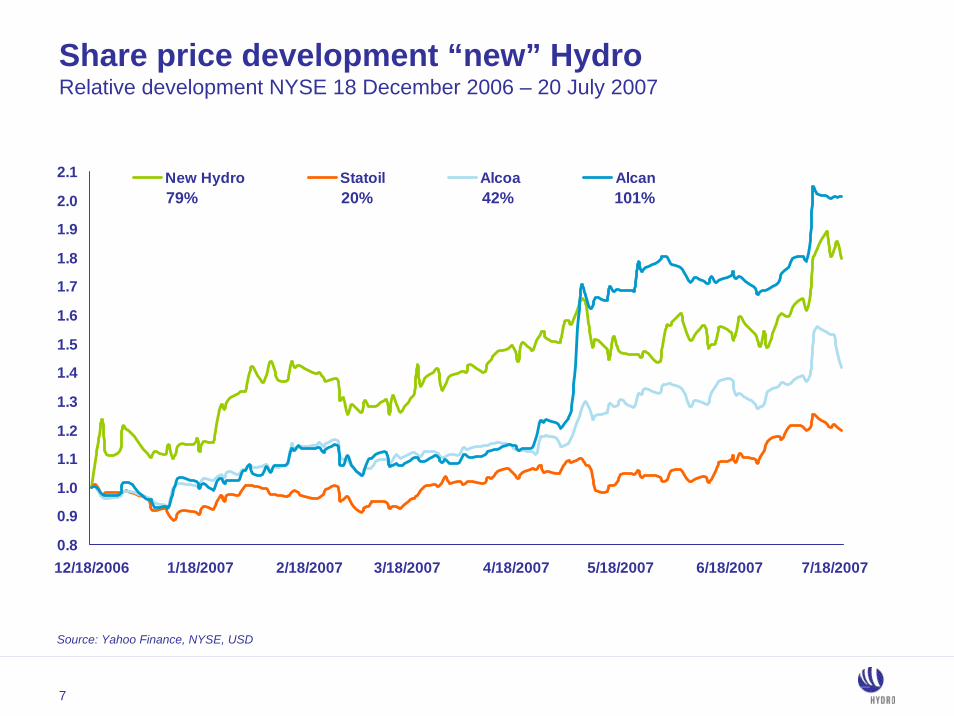
Share price development “new” Hydro
0.8
0.9
1.0
1.1
1.2
1.3
1.4
1.5
1.6
1.7
1.8
1.9
2.0
2.1
12/18/2006 1/18/2007 2/18/2007 3/18/2007 4/18/2007 5/18/2007 6/18/2007 7/18/2007
New Hydro Statoil Alcoa Alcan79% 42%20% 101%
Source: Yahoo Finance, NYSE, USD
Relative development NYSE 18 December 2006 – 20 July 2007

8
Status merger of oil and gas activities with Statoil
All regulatory approvals received
Approved by the Extraordinary General Meetings of Hydro andStatoil 5 July 2007
Expected completion 1 October 2007
Hydro shareholders will receive 0.8622 shares in StatoilHydro for each Hydro share they hold at closing
Hydro shareholders will retain the current number of shares in Hydro

9
Hydro – a resourceful aluminium and power company
Automotive
25 000 employees, 7 000 in Norway 1)
Operations in more than 30 countries
Annual turnover above NOK 100 billion
Operating income NOK 7.8 billion in 2006
Market capitalization NOK 99 billion 2)
1) Excluding Hydro Petroleum, Hydro Polymers, Meridian Technologies and Automotive Castings2) 20 July 2007 close
Aluminium Products
Power
AluminiumAluminium MetalMetal

10
Strong aluminium industry position
2. Pro forma figures for acquisition of Corus Aluminium’s rolled and extrusions businesses3. Pro forma figures for acquisition of Novelis rolled businesses
915 1
040
3 15
1
930
260
230
616
985
163
3 55
2
3 40
6
1 79
9
3 90
0
1 93
0
1 35
9
845
270 4
29
2 50
0
1100
Alcoa¹ Alcan Hydro United Rusal
Chalco BHP Billiton
Rio Tinto
CVRD Novelis/Hindalco
Aleris Sapa/Alcoa
JV
Pro
duct
ion
in 1
000
tonn
es in
200
6
Primary Rolled Extrusions Other
1. Alcoa pro forma for SAPA JV on extrusion
Emerging Market Mining & Metal Manufacturing
23
Integrated

11
Peer comparison 2006
Alumina ownership coverage
55%
74%
218%
Hydro
Alcan
Alcoa
Captive power *
34 %
43 %
21 %
Hydro
Alcan
Alcoa
Metal sales vs primary production (tons)
156%
127%
198%Hydro
Alcan
Alcoa
Downstream in % of primary production
95%
39%
98%
Hydro
Alcan
Alcoa
Source: Company figures. CRU 2006 for Alcan and Alcoa
100%
100%
100%
100%

12
Aluminium Metal and Products 2006
Sourcing & Trading (optimization of total alumina and ingot portfolio)
Rolled products
Extruded products
Bauxite
Carbon
Electrolysis
CasthouseSmelter base
Remelter baseAlloys
Ingot
Scrap
Casthouse volumes (million tons) Smelter based 1.8 Remelt based 1.43rd party 0.3Inventory 0.1
Sales volumes (million tons)Internal customers 1.8External customers 1.7
Sourcing & Trading (million tons)3rd party trading of alumina 1.53rd party trading of Ingot: 0.5
Alumina
Aluminium Metal Aluminium Products
3.6
3rd party

13
Million tons
Aluminium value chain 2006
1.8
1.0
0.5
0.8
1.4
1.8
1.4 0.3
1.0 0.6 0.1Aluminium Products
Metal products
Primary aluminium
Alumina**
Bauxite*
Equity Long term contracts Remelt Third party sales
Rolled Extrusion Automotive***
* Bauxite volume relative to equivalent primary aluminium volume: approx. 4.5 tons bauxite per ton primary aluminium** Alumina volume relative to equivalent primary aluminium volume: approx. 2 tons alumina per ton aluminium*** Excluding Automotive Castings and Magnesium Castings volumes – Divestments
Aluminium Metal
BauxiteMRN equity production – Brazil: 0.9 million tons Alpart equity production – Jamaica: 1.3 million tons
Alumina Alunorte – Brazil: 1.3 million tonsAlpart – Jamaica: 0.6 million tons

14
Primary metal production versus remelting
Remelting
Only 5% of energy required to produce primary metalMargin business
- More labor intensive
High RoaCE business- Less capital intensive
Cost of scrap/remelt ingot closely linked to price of the LME quoted productsLME sensitivity
- Related to value of metal- Relative value of alloy elements and
working capital
Primary production
Commodity business
Cyclical
Capital and energy intensive
Full LME exposure
High USD exposure

15
Earnings distribution 2006
Metal 64%
Alumina 8%
Other 4%
Products14%
Power11%
HydroEBITDA
AlcoaATOI adding back Tax & Depreciation
AlcanBusiness Group Profit
Source: Company filings
Packaging4%
Alumina27%
Products22%
Metal47%
Packaging12%
Alumina & Bauxite
13%Products12%
Metal63%
Alcoa: After Tax Operating Income – ATOI. Alcoa 2006 ATOI distribution: Alumina 30%, Metal 50%, Products 18%, Packaging 3%Alcan: Business Group Profit – BGP which is earnings before tax and depreciationHydro: Net income figures for Alumina represents 8% of EBITDA (Alunorte 34% owned and Alpart 35% owned are associated companies)
16
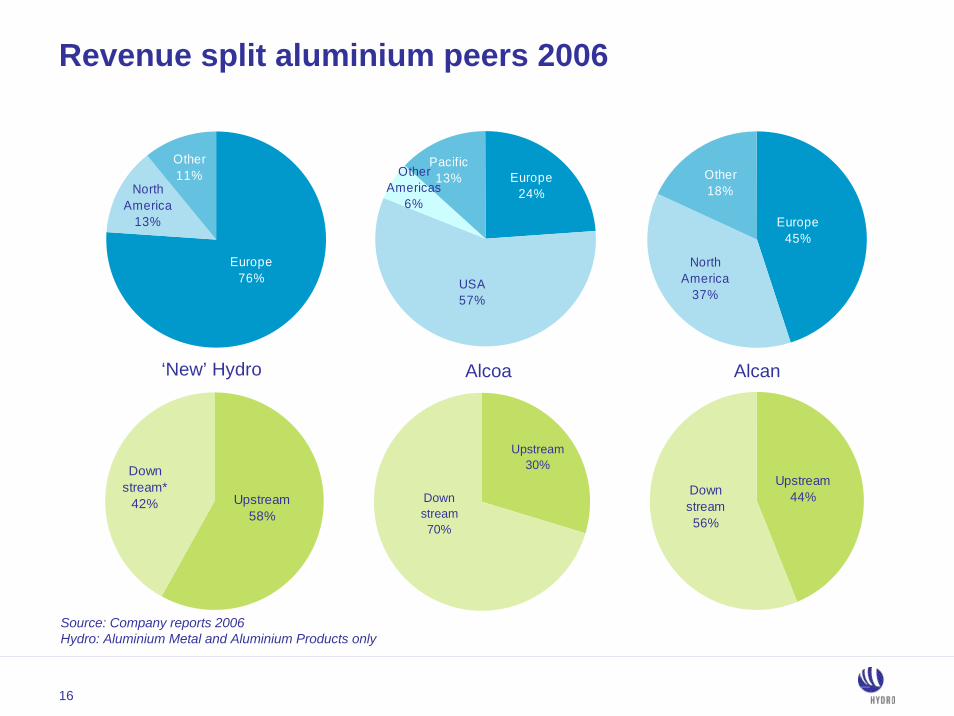
Upstream58%
Down stream*
42%
Revenue split aluminium peers 2006
Europe76%
Other11%
North America
13%
‘New’ Hydro
Pacific13% Europe
24%
Other Americas
6%
USA57%
Alcoa
Europe45%
Other18%
North America
37%
Alcan
Downstream70%
Upstream30%
Upstream44%Down
stream56%
Source: Company reports 2006 Hydro: Aluminium Metal and Aluminium Products only

17
Competitive return on capital
Source: Bloomberg return on capital methodology. 12 month rolling Q1 2003-Q1 2007. Hydro figures are approximations to Bloomberg methodology.* Alcoa and Alcan
0%
2%
4%
6%
8%
10%
12%
14%
2003 2004 2005 2006 2007
Peer range * Aluminium (Metal & Products)
RoaCE

18
NOK billion
6.5
15.2
23.2
34.0
42.6
5.6
11.8
15.518.8 20.2
2003 2004 2005 2006 Q2 2007
Accumulated EBITDA 2003-Q2 2007
Accumulated investments 2003-Q2
22.4
Accumulated EBITDA net of accumulated investments
Strong Aluminium cash flow

19
0.11
0.31
0.23
0.15
2004 2005 2006 June 30 - 2007
Interest-bearing debt + net pension liability (tax adjusted) + operating lease commitments (discounted) –cash and cash equivalents – short term investments divided by shareholders’ equity + minority interest
0.50
IFRSUS GAAP* IFRSUS GAAP*
Hydro – adjusted net debt/equity ratio
* US GAAP figures are not adjusted for reclassification of Polymers as discontinued operations and 2007 changes in US GAAP accounting principles

20
Payout to shareholders 2000-2006: NOK 37 billion
Dividend allocated to the year for which the dividend was paid. The (actual) payment of the dividend is done the year after. Buyback allocated to the year when the buyback transactions were executed.
2 470 2 576 2 711 2 811
5 0215 500
6 100
7631 155
1 6841 589
3 949
555
2000 2001 2002 2003 2004 2005 2006
Dividend Buyback
NOK million
10 0497 0896 6853 3663 7113 243 2 711
Average payout ratio 2004 – 2006: ~50 percent

21
Dividend policy
High commodity prices have supported current dividend payout and share buy backs
Revised dividend policy for “new”Hydro
- Hydro will continue existing dividend policy with an average payout ratio of 30 percent of net earnings
- Share buy-backs or extraordinary dividends will supplement dividends during periods of strong financials
18%
33%31%
26%
44%
35% 36%
2000 2001 2002 2003 2004 2005 2006
1 Year 5 year Target
30% payout ratio over time

22
Share price development (NYSE)
Source: Yahoo Finance, NYSE, USD
574%
63%
101%
117%
125%
134%
153%
175%
182%
222%
262%
301%
BP
Shell
RepsolYPF
Chevron
Alcoa
ExxonMobil
ENI
BG Group
Total
Alcan
ConocoPhillips
Hydro
1 January 1999 to 20 July 2007

23
Operational excellence in all businessesWorld-class project execution of QatalumPursue new upstream growth initiativesBuild on leading downstream market positionsFinal integration with StatoilLaunch “new” Hydro – Capital Markets Day 6 September
Priorities 2007

24
Build on a leading, global position in upstream aluminium
Pursue attractive opportunities in alumina, bauxite and primary aluminium
Leverage strong platforms in Extrusion, Precision Tubing, Building Systems and Rolled Products
Captive hydro power production a strategic asset
Exciting prospects within Solar
Strategy for long-term growth

25
Bauxite & Alumina

26
Good bauxite equity coverage for Hydro
73% 74% 74% 75%
25%26%26%27%55%
45%
0%
20%
40%
60%
80%
100%
2000 2005 2006 2007E 2010E
Equity coverage Long term evergreen contract coverage
million tons
8.13.3
2.21.8ProductionConsumption 8.4
2.2
8.4
2.2
9.6
2.4
Relative to primary aluminium
* Equity production: (i) Mineracao Rio do Norte (MRN) Brazil 5% share and (ii) Alpart, Jamaica 35% share. Non-equity bauxite from Companiha Vale do Rio Doce (CVRD) evergreen contracts.

27
Latin America21%
China 19%
North America9%
CIS9%
Australia27%
Other6%Europe
8%
2005 alumina production: 61 million tons. Only 5% of Alumina market traded spot – mainly to ChinaSource: CRU and Company data
Alumina 2006 production
Hydro3%
CVRD2%
BHP Billiton6%
Alcan8%
Chin
AlcoOthers32%
Geography Company
ese owned13%
UC Rusal16%
a/WMC20%
Global market 68 million tons

28
Alumina spot price
PercentUSD/ton
Source: LME, Metal Bulletin, CRU, Macquarie Research
0
200
400
600
800
1999 2000 2001 2002 2003 2004 2005 2006 20070
10
20
30
% of LME 3-month aluminium price Spot alumina price
Percentage of aluminium LME 3-month price

29
Alunorte alumina refinery – key asset in repositioning
Targeting 6.5 million tons production capacity by 2009, up from 4.6 million tons in 2006
Hydro stake 34 percent of world’s largest refinery
Bauxite supplies from CVRD
First-quartile investment costs and highly competitive conversion costs
Platform for pursuing new opportunities in Brazil and other bauxite rich areas

30
Strengthening captive alumina coverage
45%63%
55%
71%
43%
23%
77%
57%
37%29%
0%
25%
50%
75%
100%
1998 2002 2006 2007E 2010E
Own production coverage Long-term contracts
million tons
Relative to primary aluminium
2.82.4
1.20.5ProductionConsumption 3.5
1.9
3.3
2.1
3.9
2.8

31
Agreement with Brazilian mining group CVRD, Hydro share 20 percent
Alumina refinery to be located 5 km from Alunorte- Bauxite supply from CVRD’s operation in Paragominas through existing pipeline- Hydro and CVRD already partners in Alunorte, the world’s largest alumina refinery
Final production 7.4 million tons alumina annual capacity- Four-stage development, each 1.85 million tons
Investment estimate first stage USD 1.5 billion (100 percent)- Final build decision expected Q1 2008- Production start-up scheduled first half 2011
Hydro joins alumina project in Brazil

32
Aluminium Metal

33
Strong focus on return on capital
Restructuring on track
Operational excellence and production creep
Long-term profitable growth
Expected primary production 2010: 2 000 000 tons
Qatalum smelter project (Qatar) on stream end 2009
Aluminium Metal

34
Europe15%
CIS13%
North America16%
China28%
Other4%Africa
5%
Middle East5%
Australasia7%
Latin America7%
Geography Company
Chalco 3 %
Other53%
BHP Billiton 4%
Hydro5%
Alcoa10%
Rusal12%
Alcan10%
Source: CRU / Hydro
Primary aluminium 2006 productionGlobal market 34 million tons

35
China driving the demand for primary aluminium
0
10
20
30
40
50
60
70
2000 2005 2010E 2015E 2020E
OtherChina
13%
22%
31%
35%
87% 78% 69% 65%
34%
66%
Million ton
Source: CRU 2006
4 percent annual growth rate 2005-2020

36
Estimated metal flow to and from China
-5 000
-3 000
-1 000
1 000
3 000
2005 2006 2007 2008 2009 2010 2011
1 000 tons
Source: Company estimate May 2007
Net
scr
ap m
etal
impo
rtN
et e
xpor
t
Primary / alloyed
Fabricated Scrap metalNet
Semi-fabricated

37
Aluminium market price – 3 month LME
0
200
400
600
800
1 000
1 200
1 400
1 600
1 800
2 000
2 200
2 400
2 600
2 800
3 000
2000 2002 2004 2006 2008 2010 2012
LME (3-month avg.)
LME forward
USD per mt
Source: Reuters Ecowin / Bloomberg, weekly average, forward curve as of 20 July 2007
Primary aluminium LME USD/ton
Q2 2007 average
Q2 2007 end
2 799
2 725
Average 2006 (year) 2 594
Q1 2007 average
Q1 2007 end
2 746
2 780
Average 2007 (1st half) 2 772
Forward curve average
2009
2010
2011
2 750
2 600
2 450

38
2000 2005 2006 2010E
Rest EuropeNorwayOutside Europe
Repositioning enhances smelter portfolio
2000 2005 2006 2010E
Above 300 000 tonsBelow 300 000 tons
780
1 825
2 000
100% 71% 57%
29% 43%
Smelter size
1 799
70%
30%
780*
1 8252 000
100%
56% 43%
38%17%
19%27%1 799
57%
24%
19%
Smelter geography
All figures in 1 000 tons per year. * 2000: Excluding non-consolidated Slovalco equity stake of 20% ~ 25 000 tons

39
50/50 joint venture between Qatar Petroleum and Hydro
585 000 tons annually – expansion potential to 1.2 million tons annually- Production start-up Q4 2009
First quartile operating cost – captive gas power
Proprietary smelting technology
Investment cost USD 4.8 billion (100 percent)- Including 1 250 MW gas fired power plant of USD 1 billion
Qatalum – mega smelter in key region

40
Industry costs rising – Hydro’s position improved
0
250
500
750
1 000
1 250
1 500
1 750
2 000
2 250
2 500
0% 25% 50% 75% 100%
Cumulative production
2003: Industry and Hydro average: 1 120
2006: Industry average: 1 640Hydro average: 1 547
Cost (USD/ton) Alumina- Two thirds of cost increase- Coming down from peak
Energy- Oil and gas prices - Coal prices- CO2 emission trading- Supply/demand for electricity
Other raw materials
Freight
Alcan, incl. captive powerHydro, excl. captive power
Alcoa, incl. captive power
Qatalum 1st quartile
* Source: CRU (Corporate operating cost definition) Assumptions: LME 3m 2 635 USD/ton, Alumina spot USD 472/ton, USD 6.57
Hydro’s position including captive power: USD 80-100 lower than indicated

41
2002 2003 2004 2005 2006
Other cost Power Alumina
Aluminum industry operating cost increasing
Source: CRU 2006 (Corporate operating cost definition)
USD per ton
37% 36% 31% 31% 29%
28% 28% 28% 28% 26%
35% 36% 41% 41% 45%
1 090 1 120
1 290
1 450
1 640

42
CRU industry cost for Hydro
Source: 2006 CRU industry cost model figures for Hydro
44
11498 10010
30
10
13
715
2
0
20
40
60
80
100
120
Alu
min
a
Car
bon
Pow
er
Labo
ur
Oth
er
Cas
thou
seco
sts SO
C
Net
Rea
lisat
ions
BO
C
Ove
rhea
dco
st CO
C
30%
National/regional markets
Input factors depending on local/regional
conditions, efficiency etc.
Global market prices
54% 30%
Technology Contracts
Economy of scaleEfficient work processesLocal cost level
Regulatory &
Tax frames
Weighted average, percent

43
Long-term power supply at competitive cost
Contract portfolio Aluminium Metal
Power figures indicate Hydro ownership share of power consumption 1) excl. Søral2) excl. Stade
2006 2010 2015 2020
Norway 1)
Australia
Canada
Slovakia
Germany 2) 3.3 TWh
1.0 TWh
1.6 TWh
3.5 TWh
7 TWh captive production Power supply and price secured
Norway: gradual increase in power price until 2010 as new contracts replace old
Germany: moderately increasing power prices
Other portfolio: stable real prices
7 TWh long-term contracts

44
Aluminium Metal financials
NOK million 2006 2005Operating revenues 68 405 54 579 51 957
Depreciation 1 728 1 687 3 798
Investments 1) 1 979 1 792 4 244
Global production of primary aluminium (million tons) 33.8 32.0 –
Aluminium prices
LME 3 month average (USD/ton) 2 594 1 900 1 721
Global consumption of primary aluminium (million tons) 34.2 31.9 –
Reported primary aluminium inventories (million tons) 2.72 2.93 –
Realized aluminium price LME (USD/ton) 2 352 1 812 1 629
LME 3 month average (NOK/ton) 16 628 12 236 –
Realized aluminium price LME (NOK/ton) 15 371 11 813 11 403
Operating & market statistics
Primary aluminium production (million tons) 1 799 1 826 1 720
Operating income 6 362 2 694 785
Non-consolidated investees 837 272 281
Adjusted EBITDA 9 134 4 821 5 297
2004
1) Includes non-cash element of NOK 186 million in 2005 and NOK 1 275 million in 2004 related to change in accounting principles (FIN47 and FIN46R)

45
Aluminium Products

46
Continued strong profitability in Extrusion and Building SystemsAll time high shipments in Rolled Products Divestment of Aluminium Castings and Meridian for NOK 4.3 billion completedDivestments in process
- Magnesium remelters and smaller businessesClosures
- Magnesium Canada, extrusion capacity UK and US, remelting capacity USSelective growth initiatives going forward
Aluminium Products

47
World leader
- Europe
- North America
- Asia
65 000 tons
Number one in Europe
Leading brands
80 000 tons
Leading position in downstream niches
Building SystemsExtrusion Precision Tubing
Number two global player
Innovative solutions
Added value activities
450 000 tons
Rolled Products
World’s largest mills
- Alunorf (hot)
- Grevenbroich (cold)
Number one in lithographic plates and thin gauge foils
1 000 000 tons

48
Strengthened profitability
1) Including Extrusion Europe, Extrusion Overseas, Building Systems and Precision Tubing, 2) Including Automotive Structures only
Extrusion 1) Rolled Products Automotive 2)
9.5%
4%
NOK 8.9 billion
Capital employed: NOK 15.7 billion
NOK 0.9 billionNOK 5.9 billion
Adjusted profitability 2006
RoaCE

49
Extrusion – key figures 2006
Europe73%
Other6%
North America
21%
Revenues by region 1)
NOK 22.7 billion
Extrusion Europe
52%Building Systems
13%
Extrusion Americas
24%
Precision Tubing11%
Volume split 2)
605 000 tons
1) Revenues include Extrusion and Precision Tubing, internal sales not eliminated. Volumes include soft alloys2) External sales (in addition comes the sales to Building Systems)
**
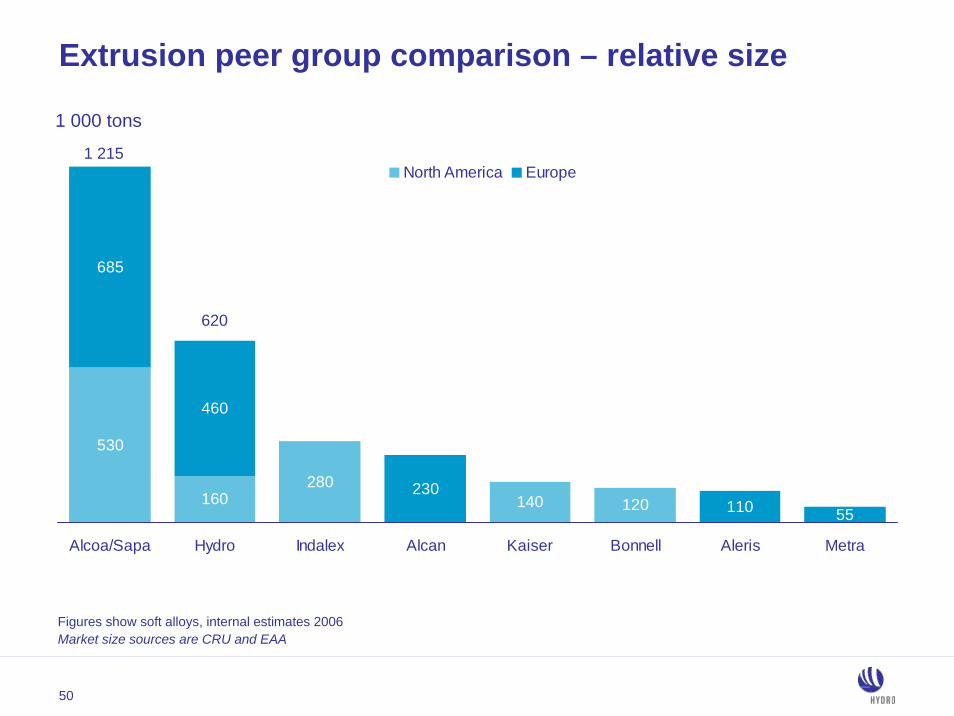
50
530
160 140
685
460
110 55120280 230
Alcoa/Sapa Hydro Indalex Alcan Kaiser Bonnell Aleris Metra
North America Europe1 215
620
1 000 tons
Extrusion peer group comparison – relative size
Figures show soft alloys, internal estimates 2006Market size sources are CRU and EAA
51
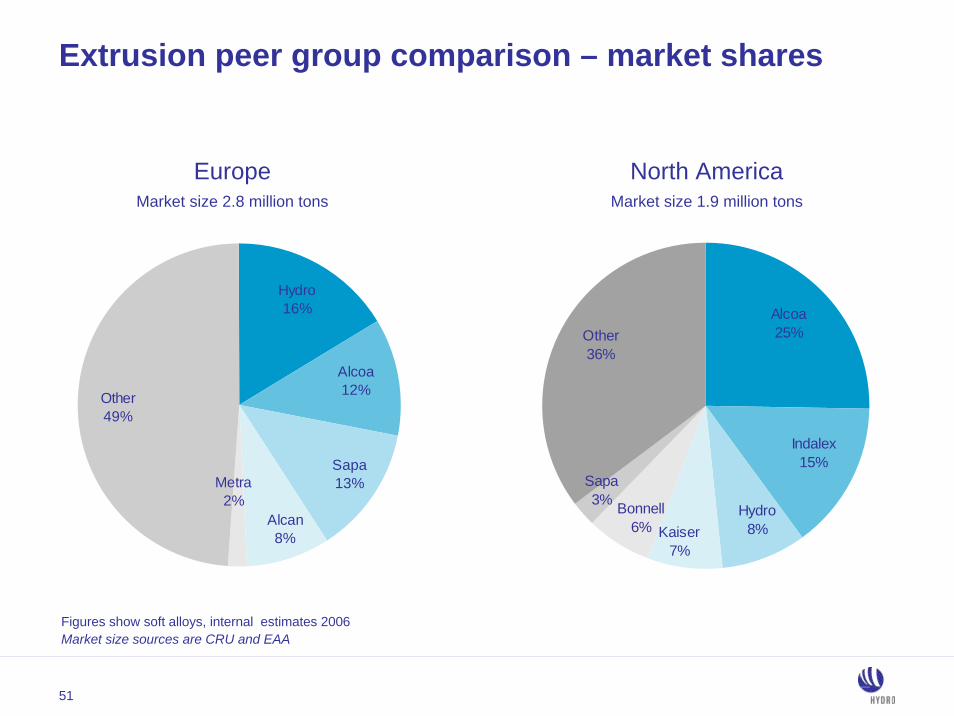
Extrusion peer group comparison – market shares
North AmericaMarket size 1.9 million tons
EuropeMarket size 2.8 million tons
Figures show soft alloys, internal estimates 2006Market size sources are CRU and EAA
Other49%
Metra2%
Alcan8%
Sapa13%
Alcoa12%
Hydro16% Alcoa
25%
Indalex15%
Hydro8%Kaiser
7%
Bonnell6%
Sapa3%
Other36%

52
Well invested portfolioLeading rolling mills in Europe – 50% AluNorf ownership, the flagshipExcellent technology and market positionStrong organizationMain challenge in the mid-term is ChinaEurope: shift in ownership in the industry is ongoingHome market with moderate but stable growth
Rolled Products – portfolio evaluation concluded

53
Rolled Products – key figures 2006
Europe80%
Other12%North
America8%
Revenues by regionNOK 23 billion
Strip67%
Foil16%
Litho17%
Volume split 1 million tons

54
Rolled Products peer group comparison – relative size
470
* 12 Feb 07: Hindalco agreement to acquire Novelis for USD 6 billion: Chart incl. Hindalco rolled products production of 221 000 tons per year. Rolled products production only for Novelis – Hindalco at 3 094 million tons
** Alcoa annual report 2006: Third party Aluminium shipments, flat-rolled products*** CRU, Alcan does not report numbers
2 436
1 000 910
0
1 000
2 000
3 000
4 000
Novelis - Hindalco * Alcoa** Hydro Alcan***
Europe North America Other Total
1 000 tons
3 094

55
Rolled Products peer group comparison – market shares
470
North American market5.3 million tons
European market4.6 million tons
Market sources are CRU and EAA
16%
59% 76%
1%
25%
23%
Other76.5%
Novelis22%
Hydro1.5%Hydro
17%
Novelis23%
Other60%

56
Aluminium Products financials 1)
NOK million 2006 2005Operating revenues 49 844 42 477 43 533
Depreciation 1 666 2 913 1 848
Investments 2) 1 250 1 970 1 951
Extrusion sales volumes, tons 640 000 600 000 635 000
Rolled Products sales volumes, tons 1 000 000 950 000 945 000
Operating income (83) (370) 1 072
Non-consolidated investees (179) 47 68
Adjusted EBITDA 1 715 2 670 3 058
50 00040 000
2004
Automotive structures sales volumes, tons 65 000
1) Excluding Automotive Castings which is reported as discontinued operations2) Includes non-cash element of NOK 9 million in 2005 related to change in accounting principles (FIN47)3) Extrusion volumes include Extrusion, Precision Tubing and Automotive Structures business sectors

57
1 967
1 440
1 6091 769
1 376
2 304
1 647
1 319
2004 2005 2006 1st half 2007
Extrusion Rolled Products
US GAAP US GAAP IFRS IFRS
EBITDA per ton: Extrusion and Rolled Products

58
Power

59
Power production has built Hydro’s industry
Energy competence is an integral part of aluminium growth ambitions
Well-developed production assets provide stable cash-flow
Power competence to support growth strategy
Renewable energy will increase in value due to emission challenges
Captive hydropower – a solid basis for aluminium smelting

60
Norway’s second largest hydroelectric power producer
1 860 MW installed capacity
All capacity connected to the grid
~9 TWh production in a normal year
Low production costs and investment levels
Production volume and year for potential reversion to the state
2.7
3.6
2.7
Telemark
Sogn*
RøldalSuldal Reversion in 2022
Reversion in 2044-2057
No reversion
TWh
TWh
TWh
* Includes the Fortun plants (1.6 TWh) where the current concession expires in 2017. Hydro has applied for renewal of the concession and it is expected that the new concession will expire in 2057.

61
The market value of the power portfolio is optimized continuously
Actual spot exposure will vary from hour to hour based on own production
~2 TWh exposed to prevailing spot prices
The hydro power portfolio is flexible

62
The power portfolio
Long-term contractsAluminium Metal
13.5 TWhOwn production
7- 11 TWh
Long-term contracts7 TWh
Power portfolio 16 – 20 TWh
Short-term contractsOther (mainly internal)
1.5 TWh
Market salesDry year reserve
0 – 4 TWhMarket contracts~ 2 TWh
Concession power~ 1 TWh
Sources
Uses
Based on the period 2007-2009

63
Nordic power market – forward curves
NOK/MWh
150
200
250
300
350
400
450
500
End Q2 2006 End Q4 2006 End Q1 2007 End Q2 2007

64
Power financials
NOK million 2006 2005Operating revenues 1) 6 292 6 614 4 108
Depreciation 120 142 121
Investments 2) 42 98 241
Acquired under long-term contracts for Hydro’s industrial use, TWh 7.3 7.0 7.0
Power production, TWh 8.3 10.8 8.1
Operating income 1 185 1 123 741
Non-consolidated investees 22 10 2
Adjusted EBITDA 1 337 1 283 875
2004
1) Operating revenues are influenced by trading volumes and amount of power sourced on behalf of Aluminium. 2) Higher investments in 2003 and 2004 related to Tyin development.

65
Oil & Gas

66
Profitable production growth
0
200
400
600
800
1 000
2001 2002 2003 2004 2005 2006 2007E 2010E
573
700
1 000 boe/day
Historical performance Target Expected
563 585
2007 target 585 000 boed
2010 expected 700 000 boed- Capacity constraints lead to project delays
Growth from high-quality portfolio
Improved growth prospects beyond 2010

67
New fields on stream 2007 – 2010
Start year Field name
Hydro share at peak production
(boed)Country Type Operator
2007 Ormen Lange
Rosa
Independence Hub Area
Vilje 10 000 Norway Oil Hydro
Volve 6 000 Norway Oil/gas Statoil
Njord Gas
Rimfaks/Skinfaks
Murzuk NC-186: B&H fields
Oseberg Delta
Gimboa
Oseberg East Drilling
Alve 3 000 Norway Gas/condensate Statoil
2009 Tyrihans 14 000 Norway Oil Statoil
Thunder Hawk 10 700 US GoM Oil/gas Murphy
2010 Vega 18 000 Norway Gas/oil Hydro
Tune South 4 500 Norway Oil/gas Hydro
Peregrino
Hydro, ShellGas/condensateNorway70 000
14 000
12 500
7 800
3 000
TBD
13 200
Total
5 500
Oil
5 600
Angola
US GoM
Norway Gas Hydro
47 000
2008 Norway Oil/gas Hydro
Norway
Libya
Angola
Hydro, Dominion, Anadarko
Oil Sonangol/Hydro technical assistant
Gas
Norway
Brazil
Oil/gas
Oil
Oil
Oil
Statoil
Repsol
Hydro
Hydro, Anadarko
68
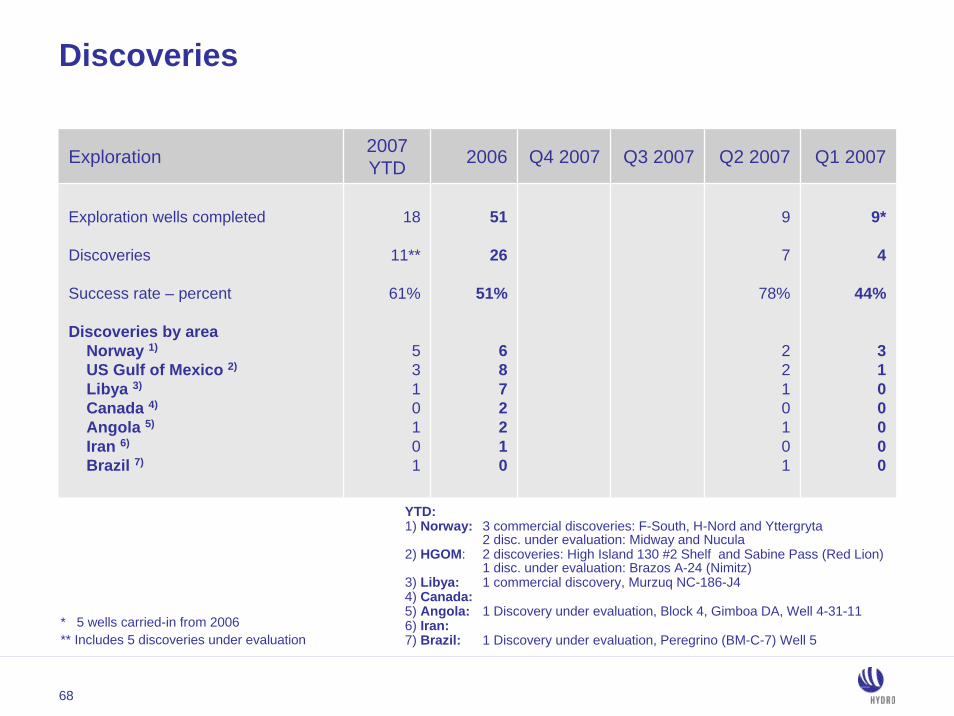
Discoveries
Exploration 2007 YTD 2006
18
11**
61%
5310101
51
26
51%
6872210
Q4 2007 Q3 2007 Q2 2007 Q1 2007
9*
4
44%
3100000
9
7
78%
2210101
Exploration wells completed
Discoveries
Success rate – percent
Discoveries by areaNorway 1)
US Gulf of Mexico 2)
Libya 3)
Canada 4)
Angola 5)
Iran 6)
Brazil 7)
YTD:1) Norway: 3 commercial discoveries: F-South, H-Nord and Yttergryta
2 disc. under evaluation: Midway and Nucula2) HGOM: 2 discoveries: High Island 130 #2 Shelf and Sabine Pass (Red Lion)
1 disc. under evaluation: Brazos A-24 (Nimitz)3) Libya: 1 commercial discovery, Murzuq NC-186-J44) Canada: 5) Angola: 1 Discovery under evaluation, Block 4, Gimboa DA, Well 4-31-116) Iran:7) Brazil: 1 Discovery under evaluation, Peregrino (BM-C-7) Well 5
* 5 wells carried-in from 2006** Includes 5 discoveries under evaluation

69
Oil and gas production per quarter
442 422391 415 406 385 399 405 402
368 381 398 418 394
173147
123
176 178154 142
184 208
169 168197
192164
Oil Gas1 000 boe/day
2004 2005 2006
Average572 563 573 584
2007
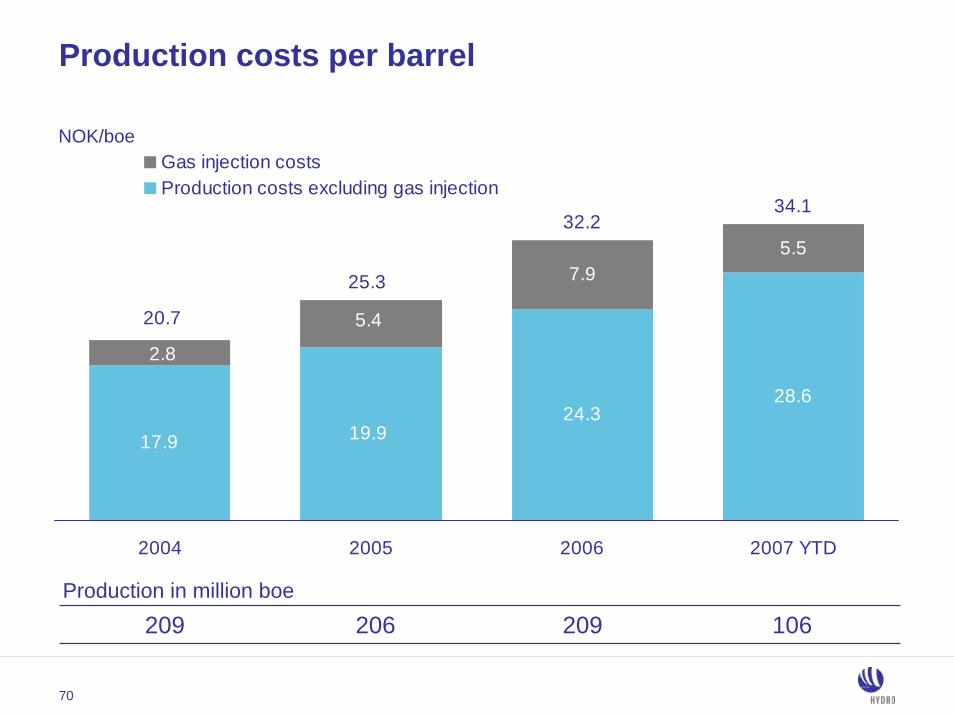
70
Production costs per barrel
NOK/boe
Production in million boe209 206 209 106
17.9 19.924.3
28.6
7.95.5
2.8
5.4
25.3
20.7
34.132.2
2004 2005 2006 2007 YTD
Gas injection costsProduction costs excluding gas injection

71
Average prices and exchange rates
Oil Oil Gas
Q1 2005 46.4 291.7 6.29 1.47
Avg. 2005 53.1 342.2 6.44 1.52
Avg. 2006 63.1 404.0 6.40 1.93
Q2 2007 67.2 403.3 6.00 1.62Q1 2007 55.9 347.8 6.22 1.90
Avg. 2007 61.5 375.6 6.11 1.77
Q2 2005 49.8 317.9 6.39 1.31Q3 2005 60.4 390.6 6.47 1.36Q4 2005 55.6 368.8 6.63 1.85
USD/boe NOK/boe NOK/USD NOK/Sm3
Q1 2006 60.667.9
Q3 2006 66.6 420.6 6.32 1.73
6.67 2.16
57.8
403.5422.2Q2 2006 6.22 1.79
369.2Q4 2006 6.39 1.97
0
50
100
150
200
250
300
350
400
450
2001 20070
10
20
30
40
50
60
70
80
NOK/boe USD/boe
72
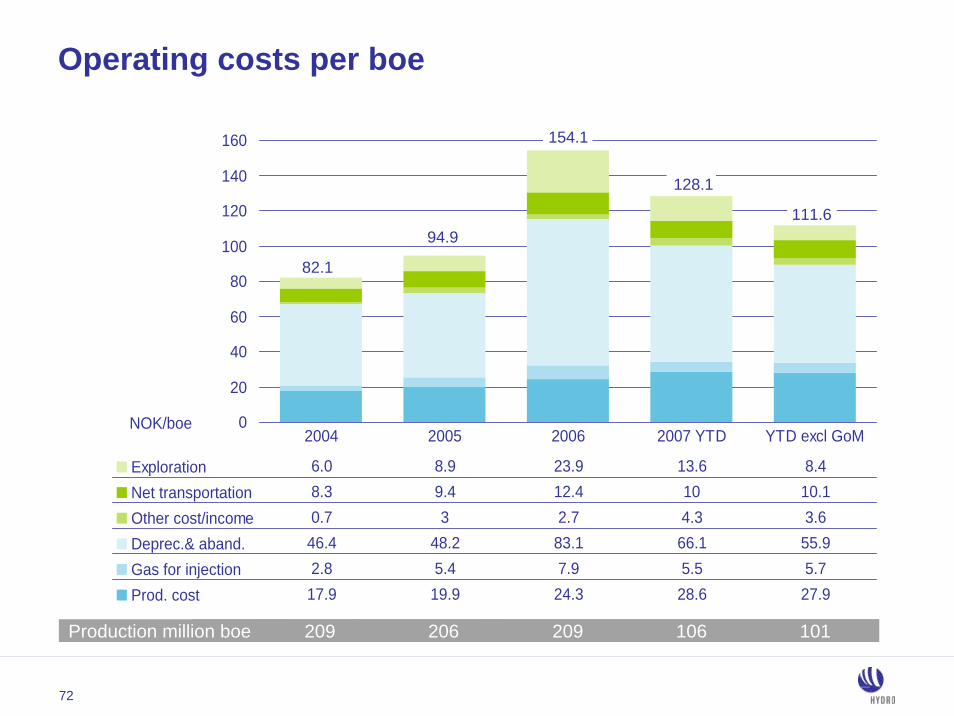
0
20
40
60
80
100
120
140
160
NOK/boe
Exploration 6.0 8.9 23.9 13.6 8.4Net transportation 8.3 9.4 12.4 10 10.1Other cost/income 0.7 3 2.7 4.3 3.6Deprec.& aband. 46.4 48.2 83.1 66.1 55.9Gas for injection 2.8 5.4 7.9 5.5 5.7Prod. cost 17.9 19.9 24.3 28.6 27.9
2004 2005 2006 2007 YTD YTD excl GoM
82.1
209 106 101206209Production million boe
94.9
Operating costs per boe
154.1
128.1
111.6

73
Exploration activity and costs
-1 000- 800- 600- 400- 200
0 200 400 600 800
1 0001 2001 4001 6001 8002 0002 2002 400
Expensed Expensed old wells Refund insurance Iran Seismic Spinnaker
Expensedshare
Capitalizedshare
NOK million
2003 2004 2005 2006 2007

74
UK gas prices – NBP forward curves
Pence/th
5
15
25
35
45
55
65
75
85
95
105
End Q2 2006 End Q4 2006 End Q1 2007 End Q2 2007

75
EmdenBacton
St.Fergus
NBP*
Zeebrugge/Hub
PEG****
TTF**
Abreviations: * NBP: National Balancing Point, ** TTF: Dutch Title Transfer Facility *** Langeled South Pipeline landfall **** PEG: Points d'Exchange de Gaz
Dunkerque
Norwegian Continental ShelfStrong reserve baseExcellent Operator
Basin MasterAccess to Infrastructure
Gas Market PresenceLong-term sales
Spot salesDownstream marketing
Swap deals
Easington***
Flexibility – increased value of gas portfolio

76
Norway’s largest industrial project. Largest gas development in Europe
Hydro 18 percent equity
Supply 20 percent of UK gas demand
Langeled South gas export to UK began 1 October 2006
Ormen Lange start-up October 2007
Ormen Lange/Langeled 97 percent complete

77
Oil and gas reserves and resources*
0
1 000
2 000
3 000
4 000
Proven reservesyear-end 2005
(SEC)
Additional expectedreserves year-end
2005
2006 Production Added expectedreserves 2006*
Additional expectedresources in
portfolio**
Million boe
CMD 2005
Added total ~350 mboe in new resources in 2006Few sanctioned fields in 20062006 production 209 mboeTotal reserve/resource base up 120 mboe
* CMD Dec. 2006 : Fields sanctioned in 2006 and revisions of former sanctioned fields, expected reserves (P50), ** Non-sanctioned projects

78
Second quarter results 2007

79
Highlights second quarter
Strong results in all businesses
Favorable market conditions
Final approval of Qatalum
Agreement to develop new alumina refinery in Brazil
Ormen Lange 97 percent complete, on track for October start-up
Shareholders’ and regulatory approval of oil and gas merger

80
For calculation of EPS Q2 2007: 1 226 647 365, Q1 2007: 1 226 175 885, Q2 2006: 1 247 199 793 shares
Consolidated income statementsNOK million Q2 2007 Q1 2007 Q2 2006
RevenueShare of the profit in equity accounted investmentsOther income, net
46 529350301
46 865283
1 075
48 224
Depreciation, amortization and impairmentOther expenses
(4 651)(28 331)
(4 593)(28 986)
(4 000)(29 196)
Income from continuing operationsIncome from discontinued operations
5 903157
5 456137
5 769164
Net income 6 060 5 594 5 932
Earnings before financial items and tax (EBIT) 14 198 14 644 15 620
742
15 386(9 930)
Net income attributable to minority interestNet income attributable to parent
1085 952
1035 491
1035 829
4.50
Revenues and income 47 180
48 026358432
48 816
785
16 405(10 636)
Financial income (expense), net 820
Income from continuing operations before taxIncome tax expense
15 018(9 115)
4.70Earnings per share attributable to parent – NOK 4.90

81
NOK million Q2 2007 Q1 2007
10 857987
(389)
10 1461 310(290)
11 166
2 5341 315
27(398)
14 644
11 455
2 465355
32(109)
14 198
Q2 2006
Exploration and ProductionEnergy and Oil MarketingEliminations
11 6751 178
344
13 196
2 333326
32(267)
15 620
Oil & Energy
Aluminium MetalAluminium ProductsOther ActivitiesCorporate and Eliminations
Total
Earnings before financial items and tax (EBIT)

82
Oil & Energy highlights
Oil and gas production 558 000 boed
Record-high international production
Ormen Lange phase I on time and budget
Vega and Vega South development plan approved
StatoilHydro preparation on schedule

83
Oil & Energy key figures
Operational data Q2 2007 Q1 2007
55867.2
403.31.62653
61055.9
347.81.90786
Q2 2006
Oil and gas production (1 000 boe/day)Realized oil price, USD/boeRealized oil price, NOK/boeRealized gas price, NOK/Sm³Exploration expense, NOK million
53767.9
422.21.79618
EBIT, NOK million Q2 2007 Q1 2007
10 857987
(389)
10 1461 310(290)
11 16611 455
Q2 2006
Exploration and ProductionEnergy and Oil MarketingEliminations
11 6751 178
34413 196Oil & Energy

84
Nine wells completed in Q2
Seven new discoveries in Q2- Four commercial – two in Norway, one in Libya and one in GoM - Three under evaluation- In addition one discovery in Norway from Q1 declared commercial
Activity of NOK 904 million
Exploration activity

85
Oil & Energy prospects
Continued high oil price
2007 production target 585 000 boed maintained
High exploration activity
Merger with Statoil to be completed 1 October
Official opening of Ormen Lange 6 October

86
Another strong quarter for “new” Hydro
NOK million Q2 EBIT (est) Q2 EBITDA (est)
Aluminium Metal 2 465 3 124
Power 395 415
Corporate and other (50) (35)
Total 3 165 4 175
Special items (245) (389)
Total after special items 2 920 3 786
Aluminium Products 355 671

87
Significant restructuring of Aluminium executed
180 000 tons of high-cost primary capacity closed- Final cost NOK 900 million vs estimated NOK 1 000 million
Majority of automotive component business divested- New management in place to turn around Automotive Structures
Magnesium business exit completed
Underperforming extrusion units closed or turned around
Cost-improvement measures in the United States continue

88
Record results in first half
Realized aluminium price USD 2 606 per ton in Q2
Smelter production 435 000 tons in Q2 as projected
Impairment write-down US remelters NOK 144 million
Final Qatalum approval
New alumina growth initiative in Brazil
Aluminium Metal highlights

89
1 812
2 2452 399
1 9282 120
1 832
2006 2007
NOK million
Adjusted EBIT7 692 4 644
Reported EBIT7 302 4 999
Aluminium Metal EBIT
Realized aluminium price- USD 2 606 per ton
- +1% vs Q1 2007, +10% vs Q2 2006- NOK 16 174 per ton
- -2% vs Q1 2007, +5% vs Q2 2006
Reduced price in NOK main reason for lower Q2 EBIT
Primary production 435 000 tons
Strong casthouse product premiums in Europe
Strong contribution from Alunorte
Adjusted for special items

90
Aluminium Metal prospects
Continued high aluminum prices
83 percent of Q3 production sold at 2 606 USD/ton end June- Including full effect of strategic hedges
Continued weak USD will have negative impact
European market conditions remain strong
2007 production target 1 730 000 tons maintained

91
Underlying results remain strong
Solid markets for Extrusion and Rolled Products in Europe
Continued portfolio restructuring
Challenging US markets
- Cost-improvement measures implemented
Aluminium Products highlights

92
260
492498
269
398367
2006 2007
NOK million
Adjusted EBIT1 294 990
Reported EBIT(104) 1 670
Aluminium Products EBIT
Rolled Products- Margin and volume improvement
Extrusion- Positive margin development- Volumes stable- Weak results in the US
Automotive- Weak results- Divested activities (Castings) included
in Q1 with EBIT of NOK 79 million
Focus on cash generation first half- EBITDA* NOK 1 652 million- Investments NOK 166 million
Adjusted for special items
* Excluding special items

93
Aluminium Products prospects
Favorable outlook for main European markets
Weak US markets
Seasonal reduction in volumes in second half of 2007
Ensure value creation from restructured portfolio

94
Additional financial information

95
Conversion to IFRS
Hydro will use IFRS as primary GAAP from 2007Comparable IFRS figures for 2006US GAAP figures for 2005 and earlierLimited impact on results
- Net income 2006- US GAAP NOK 17.4 billion- IFRS NOK 17.7 billion
Main differences compared with US GAAP- Presentation and classification- Pensions- Financial instruments- Property, plant and equipment
Future reporting to US Securities and Exchange Commission based on IFRS with a reconciliation to US GAAP

96
1) Estimated tax effect on income statement adjustments using the quarterly marginal tax rate of 60.7%
Adjusted income Q2 2007
NOK million Reported income Adjustments Adjusted income
Exploration and ProductionEnergy and Oil MarketingEliminations
10 857987
(389)
(323)117390
184
(220)137
–(135)
Total EBIT 14 198 (34) 14 164
Income continuing operations before tax and minority interestIncome tax expense 1)
15 018(9 115)
(747)453
14 271(8 661)
Income from continuing operations 5 903 (294) 5 610
Financial income (expense), net 820 (713) 107
10 5341 104
1
Oil & Energy 11 455 11 639
Aluminium MetalAluminium ProductsOther activitiesCorporate and eliminations
2 46535532
(109)
2 24549232
(244)

97
Special items impacting income statement Q2 2007
1) Estimated tax effect on income statement adjustments using the quarterly marginal tax rate of 60.7%
NOK millionUnrealized (gains)/losses on oil and gas derivatives, Spinnaker Exploration & Production (9)Unrealized (gains)/losses on gas contracts Exploration & Production (314)
Unrealized (gains)/losses on power contracts Energy and Oil Marketing (27)Unrealized (gains)/losses on gas and power contracts Eliminations Oil & Energy 390Total impact Oil & Energy 184Closure costs Aluminium Metal 66Impairment Ellenville and St. Augustine Aluminium Metal 144
Rationalization costs US Extrusion 63
Unrealized (gains)/losses on LME contracts Aluminium Metal (193)Unrealized (gains)/losses on power contracts Aluminium Metal (175)Associates/JVs – unrealized currency (gains)/losses Alunorte Aluminium Metal (77)Associates/JVs – unrealized (gains)/losses on LME contracts Alunorte Aluminium Metal 40Associates/JVs – unrealized (gains)/losses power contracts Søral Aluminium Metal (25)Total impact Aluminium Metal (220)Inventory (gains)/losses Rolled Products 28
Unrealized (gains)/losses on LME contracts Other and Eliminations 31Total impact Aluminium Products 137Unrealized (gains)/losses on power and NGL contracts Corporate and Eliminations (135)Total impact Corporate and Eliminations (135)Net impact on EBIT Hydro (34)
Net gain on disposed business Automotive 15
Net foreign exchange (gain)/loss Hydro (713)Net impact on income continuing operations before tax and minority interest Hydro (747)Marginal tax rate 1) Hydro 60.7%
Unrealized (gains)/losses on gas contracts Energy and Oil Marketing 144
Estimated impact on income tax expense Hydro 453Net impact on income from continuing operations Hydro (294)

98
Estimated EBIT and EBITDA for “new” Hydro 2007
EBIT (est) Reported Special items Adjusted
Aluminium Metal 2 465 (220) 2 245 137 (27)
(135)(245)
492 368
(185)2 920
Aluminium Products 355
Corporate and other (50)Total 3 165
Power 395
EBITDA (est) Reported Special items Adjusted
Aluminium Metal 3 124 (364) 2 760 137 (27)
(135)(389)
808 388
(170)3 786
Aluminium Products 671
Corporate and other (35)Total 4 175
Power 415
Q2
EBIT (est) Reported Special items Adjusted
Aluminium Metal 2 534 (135) 2 399 (817)(22)207
(767)
498 278 (43)
3 132
Aluminium Products 1 315
Corporate and other (250)Total 3 899
Power 300
EBITDA (est) Reported Special items Adjusted
Aluminium Metal 3 074 (135) 2 939 (817)(22)207
(767)
844 306 (26)
4 063
Aluminium Products 1 661
Corporate and other (233)Total 4 830
Power 328
Q1

99
NOK million First half Q220072006
28 84232 404
(3 562)
(624)(691)2 635
(1 514)
(1 865)1 175(370)
(1 469)–
151(126)
(1 382)517
(3 562)
14 19815 620
Variance EBIT (1 422)
Prices and currency- Oil- Gas- LME- Currency
- Margin- Volume- Strategic hedges- Derivatives- Associates and JCE- Exploration and production costs- Other operational costs, net- Depreciation incl. impairment- Portfolio
(5)(173)1 604(511)
(2 230)1 579(109)
22223
(269)(705)(730)(120)
Variance EBIT (1 422)
Variance analysis Hydro

100
NOK million 30 June 2007 31 March 2007
20 8966 274
42 09215 6397 167
139 163
21 88114 98244 37716 564
–145 574
243 377
3 62966 426
–19 04329 78723 634
848100 011
243 377
231 232
3 39156 0851 956
18 47928 57022 975
82598 952
231 232
30 June 2006
Cash and cash equivalentsShort-term investmentsReceivables and other current assetsInventoriesAssets held for saleNon-current assets
7 72512 66947 02115 985
–150 454
233 854
3 54565 381
–19 94227 48026 370
70090 436
233 854
Total assets
Short-term interest-bearing debtOther current liabilitiesLiabilities included in disposal groupsLong-term interest-bearing debtOther long-term liabilitiesDeferred tax liabilitiesMinority interestEquity attr. to equity holders of the parent
Total liabilities and equity
Consolidated balance sheets

101
Statement of cash flows
NOK million Six months ended 30 June 2007
Six months ended 30 June 2006
Operating activities:Net incomeDepreciation, amortization and impairment lossesOther adjustments
11 6549 245
(4 091)
16 808
(7 100)(1 540)(4 250)
304 199
12 950
4 289
15(739)
–30
(6 134)
(6 828)8
38014 657
(555)6 674
20 776
10 7157 8604 405
Net cash provided by operating activities 22 980
Investing activities:Purchases of property, plant and equipmentPurchases of other long-term investmentsPurchases of short-term investmentsProceeds from sales of property, plant and equipmentProceeds from sales of other long-term investmentsProceeds from sales of short-term investments
(7 171)(1 546)
(10 700)89
4171 850
Net cash provided (used) in investing activities (17 061)
Net cash provided by (used in) financing activities (8 297)Foreign currency effect on cash and bank overdraftNet cash provided (used) by discontinued operations
(8)(305)
Net increase (decrease) in cash, cash equivalents and bank overdraftCash, cash equivalents and bank overdraft reclassified to assets held for saleCash, cash equivalents and bank overdraft at beginning of period
(2 691)–
9 964
Cash, cash equivalents and bank overdraft at end of period 7 273
Financing activities:Loan proceedsPrincipal repaymentsOrdinary shares purchasedOrdinary shares issuedDividends paid
79(1 553)(1 347)
30(5 506)

102
Adjusted income 2006
* Estimated actual tax effect on income statement adjustments using a tax rate of 36.4 %
NOK million Reported income Adjustments Adjusted income
Exploration and ProductionEnergy and Oil MarketingEliminations
41 3523 5781 323
4 99350
(1 323)
3 720
2321 064(591)
236
Total operating income 52 224 4 661 56 885
Income continuing operations before tax and minority interestIncome tax expenseMinority interest
55 024(37 598)
(202)
3 906*(1 422)
–
58 930(39 020)
(202)
Income from continuing operations 17 224 2 485 19 710
Non-consolidated investeesFinancial income (expense), netOther income (loss), net
9621 785
53
355(1 057)
(53)
1 317728
–
46 3453 628
–
Oil & Energy 46 253 49 973
Aluminium MetalAluminium ProductsOther activitiesCorporate and eliminations
6 362(83)
1 277(1 584)
6 594981686
(1 348)
US GAAP

103
Special items impacting income statement 2006
NOK millionUnrealized (gains)/losses on oil and gas derivatives, Spinnaker Exploration & Production (222)Impairment loss Gulf of Mexico Exploration & Production 5 240
Unrealized (gains)/losses on gas contracts Energy and Oil Marketing (137)Unrealized (gains)/losses on power contracts Energy and Oil Marketing 257 Business combination acquisition cost adjustment Energy and Oil Marketing (70)
Closure costs Aluminium Metal 559 Unrealized (gains)/losses on LME contracts Aluminium Metal (597)Unrealized (gains)/losses on power contracts Aluminium Metal 270 Inventory (gains)/losses Rolled Products (261)UK defined pension plan Rolled Products 15 Impairment loss Extrusion Ellenville operations Extrusion 116 UK defined pension plan Extrusion 340 Rationalization costs UK and US Extrusion 103 Closure costs Magnesium Automotive 462 UK defined pension plan Automotive 25 Impairment losses Automotive 133 Rationalization costs Automotive 29 Unrealized (gains)/losses on LME contracts Other and Eliminations 102 Unrealized (gains)/losses on power contracts in Polymers Other Activities (380)Reversal of insurance loss provision Other Activities (211)Unrealized (gains)/losses on power and NGL contracts Corporate and Eliminations 681 Elimination of demanning costs Magnesium operations Porsgrunn Corporate and Eliminations (65)Elimination of UK defined pension plan Corporate and Eliminations (380)Net impact operating income Hydro 4 661
Unrealized (gains)/losses on gas and power contracts Eliminations Oil & Energy (1 323)
Unrealized (gains)/losses on gas contracts Exploration & Production (25)
US GAAP

104
Special items impacting income statement 2006
NOK millionNet impact operating income Hydro 4 661 Non-cons. investees - unrealized currency (gains)/losses Alunorte Aluminium Metal (94)Non-cons. investees - unrealized (gains)/losses on LME contracts Alunorte Aluminium Metal 143
Non-cons. investees - unrealized (gains)/losses power contracts Aluminium Metal 24 Non-cons investees - write-down Meridian Technologies Inc Automotive 239
Other income - gains on divestments Other Activities (53)
Net impact on income continuing operationsbefore tax and minority interest Hydro 3 906
Marginal tax rate Hydro 36.4%
Non-cons investees - write-down Cires Other Activities 43
Net foreign exchange (gains)/losses Hydro (1 057)
Calculated tax Hydro *(1 422)Total effect income from continuing operations Hydro 2 485
* Estimated actual tax effect on income statement adjustments using a tax rate of 36.4 %
US GAAP

105
Indicative price and currency sensitivities 2007
Based on approximate average 2006 prices and expected business volumes for 2007:Oil 65 USD/bblAluminium 2 575 USD/tonNOK/USD 6.45
USD sensitivity for Oil & Energy and Aluminium business areas includes both USD revenues and USD costsTotal USD sensitivity of financial positions is NOK 4 600 million negative and consists of assets and liabilities in various financial instruments. Positive net working capital of USD 1 000 million reduces the total sensitivity to NOK 3 600 million.
NOK million Income before tax Net income Change
Oil price per barrel
Aluminium price per tonne
1 190
1 000
345
655
NOK million Income before tax Net income Change
3 780
2 130
(60)
5 850
(2 500)
3 350
1 USD
100 USD
1 NOK
1 NOK
1 NOK
1 NOK
1 NOK
1 NOK
USD Oil & Energy
USD Aluminium Metal
USD Aluminium Products
10 340
3 280
(90)
USD before financial items 13 530
USD financial items (3 600)
USD Net income 9 930

106
Primary aluminium production 2003-2006
Smelter site Country Interest 2006
100.0% 357
288
232
226
158
164
114
60
82
64
54
-
1 799
100.0%
100.0%
100.0%
20.0%
100.0%
20.0%
100.0%
49.9%
Tomago Australia 12.4% 63 60 59
100.0%
33.3%
2005
Norway 362
277
233
225
159
152
96
78
81
60
40
1 826
Norway
Norway
Germany
Slovakia
Australia
Canada
Norway
Norway
Germany
Germany
2004 2003
Sunndal 306
278
222
223
157
155
48
76
82
69
44
Karmøy
1 720
210
271
215
221
27
156
49
74
79
69
Årdal
Neuss
43
Kurri-Kurri
Slovalco 1)
Høyanger
Søral 2)
Stade 3)
Alouette
HAW 4)
1 473Total
1) Full consolidation of Slovalco from 2004, introduced 100% from 2004. Interest increased to 55% in Q3 20062) Operated by Alcan3) Closed end 20064) Closed end 2005
1 000 tons

107
1) All hedges are designated as cash flow hedges of forecasted sales of primary metal production. Realized gains and losses on the hedges are recognized in earnings when the actual sales are made. All unrealized gains and losses on the hedges are booked directly to shareholders’ equity.
2) Volumes are spread evenly throughout the year. The hedge program is aimed at mitigating the effects of higher power prices.
3) Volumes are spread evenly throughout the year. The Sunndal hedge program was implemented in connection with the Sunndalmetal plant expansion which was completed in 2004. 2007 amount is 45 000 tons in each of the three first quarters,down to 28 000 tons in the fourth quarter. 2007 currency hedge amount is USD 45 million in each of the three first quarters, down to USD 27 million in the fourth quarter.
2007 2008
163 8002 300
167 1002 200
–––
–
2003-2007 program (Sunndal) – volume ton 3)
2003-2007 program (Sunndal) – LME price USD/ton2003-2007 program (Sunndal) – LME price NOK/ton
108 9001 500
14 220
Hedged volume in percent of primary aluminium production volume 16%
2006-2008 program – volume ton 2)
2006-2008 program – LME price USD/ton
Aluminium Metal hedge programs 1)

108
Aluminium – operational data
Volumes and prices Q22007
Q1 2007
Q4 2006
Q3 2006
Q2 2006
Q1 2006
Q4 2005
Q3 2005
Q2 2005
Primary production (1 000 mt) 435
2 606
6.21
16 174
2 762
6.07
16 780
767
264
165
LME realized (USD/mt) including hedges
457461464449451449450433
2 588
NOK/USD realized including hedges * 6.37
1 842
16 480
1 770
2 734
1 851
6.25
2 146
17 082
2 368
788
6.51
2 462
266
6.47
2 430
6.50 6.56
15 793
2 560
6.85
6.46
16 536
6.47
775
247
6.36
LME realized (NOK/mt) including hedges 15 662 15 331 14 697 12 145 11 453 11 992
LME realized (NOK/mt) excluding hedges 16 537 15 638 14 591 12 257 11 468 11 865
164 153
2 614
6.33
1 883
Total metal products sales excluding trading (1 000 mt) 783 856
2 192
869 736 741
2 476
6.32
835
6.66
251
155
252
171
254
167
6.51
227
146
1 796
6.39
244
146
1 886
6.29
243
LME realized (USD/mt) excluding hedges
164
NOK/USD realized excluding hedges *
Rolled Products external shipment(1 000 mt)
Extrusion external shipment (1 000 mt)
* Difference between realized exchange rate and spot rate at the transaction date is reported as currency gain/loss and not included in EBITDA (except currency hedges where hedge accounting is applied)

109
Investor Relations in Hydro

110
For more information see: www.hydro.com/ir
Ada Christiane Rieker Vice President
t: +47 22 53 84 83
m: +47 951 82 718
t: +47 22 53 92 80
m: +47 917 27 528
Investor Relations Officer
Investor Relations Secretary
t: +47 22 53 92 24
m: +47 414 02 174
Stefan Solberg
Irene Raposo
Investor Relations in Hydro