investor presentation november 2015 - global...
TRANSCRIPT
Investor Presentation November 2015
Investor Presentation © Global Telecom Holding S.A.E. 2015
This presentation is for information purposes only and does not constitute an offer to sell or the solicitation of an offer to buy shares
in Global Telecom Holding (the "Company"). Further, it does not constitute a recommendation by the Company or any other party to
sell or buy shares in the Company or any other securities. This presentation includes statements that are, or may be deemed to be,
"forward-looking statements". These forward-looking statements can be identified by the use of forward-looking terminology,
including the terms "believes", "estimates", "anticipates", "expects", "intends", "plans", "goal", "target", "aim", "may", "will", "would",
"could" or "should" or, in each case, their negative or other variations or comparable terminology. All statements other than
statements of historical facts included in this presentation, including, without limitation, those regarding the Company’s strategic
priorities and objectives and the anticipated benefits therefrom, exploration of various funding options to refinance the shareholder
loan, and prospects are forward-looking statements. By their nature, such forward-looking statements involve known and unknown
risks, uncertainties and other factors which may cause the actual results, financial condition, performance, liquidity, dividend policy or
achievements of the Company, or industry results, to be materially different from any future results, performance or achievements
expressed or implied by such forward-looking statements. Such forward-looking statements are based on numerous assumptions
regarding the Company's present and future business strategies and the environment in which the Company will operate in the
future. Important factors that could cause the Company's actual results, performance or achievements to differ materially from those
in the forward-looking statements include, among others, the prices of the Company's products and services, the actions of
competitors, the availability of credit, governmental regulation of the telecommunications industry in countries in which the Company
operates, the effects of political uncertainty and economic conditions in the relevant areas in the world, the impact of foreign currency
rates, taxation and unforeseen litigation. Forward-looking statements should, therefore, be construed in light of such factors and
undue reliance should not be placed on forward-looking statements. These forward-looking statements speak only as of the date of
this presentation. The Company expressly disclaims any obligation or undertaking (except as required by applicable law or
regulatory obligation including under the rules of the Egyptian Exchange and the UK Listing Rules and the Disclosure and
Transparency Rules of the Financial Conduct Authority), to release publicly any updates or revisions to any forward-looking
statement, whether as a result of new information, future events or otherwise.
2
Disclaimer
Investor Presentation © Global Telecom Holding S.A.E. 2015
Algeria
52%Pakistan
30%
Bangladesh
18%
Algeria
68%
Pakistan
19%
Bangladesh
13%
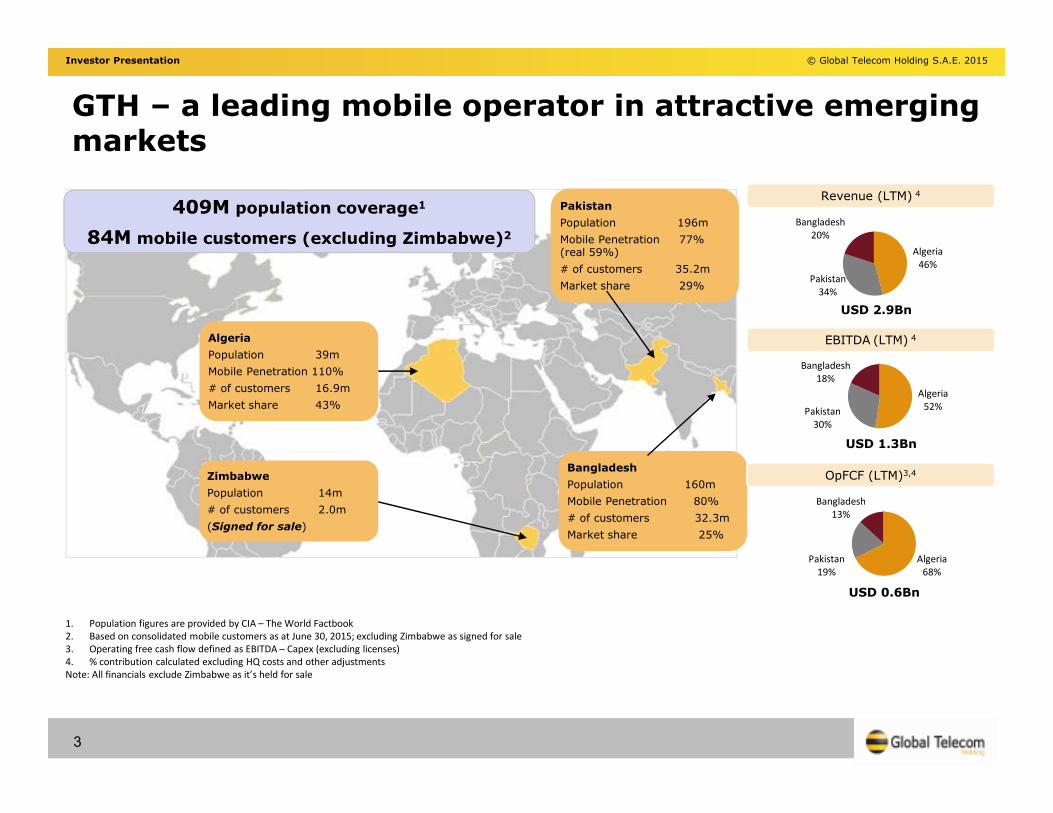
1. Population figures are provided by CIA – The World Factbook
2. Based on consolidated mobile customers as at June 30, 2015; excluding Zimbabwe as signed for sale
3. Operating free cash flow defined as EBITDA – Capex (excluding licenses)
4. % contribution calculated excluding HQ costs and other adjustments
Note: All financials exclude Zimbabwe as it’s held for sale
Pakistan
Population 196m
Mobile Penetration 77% (real 59%)
# of customers 35.2m
Market share 29%
Bangladesh
Population 160m
Mobile Penetration 80%
# of customers 32.3m
Market share 25%
Zimbabwe
Population 14m
# of customers 2.0m
(Signed for sale)
Algeria
Population 39m
Mobile Penetration 110%
# of customers 16.9m
Market share 43%
409M population coverage1
84M mobile customers (excluding Zimbabwe)2Algeria
46%
Pakistan
34%
Bangladesh
20%
USD 2.9Bn
USD 1.3Bn
Revenue (LTM) 4
EBITDA (LTM) 4
OpFCF (LTM)3,4
USD 0.6Bn
GTH – a leading mobile operator in attractive emerging markets
3
Investor Presentation © Global Telecom Holding S.A.E. 2015
Algeria: Algeria: Djezzy remains a profitable market leader with significant mobile data potential and lowpenetration of broadband technologies
Pakistan: Mobilink leads the market and has great potential for revenue growth through mobile data, MFS and VAS
Bangladesh:Bangladesh:Banglalink is a leading operator with strong focus on increasing value share in a rapidly large and growing market with relatively low penetration level
Market Position
4
Investor Presentation © Global Telecom Holding S.A.E. 2015
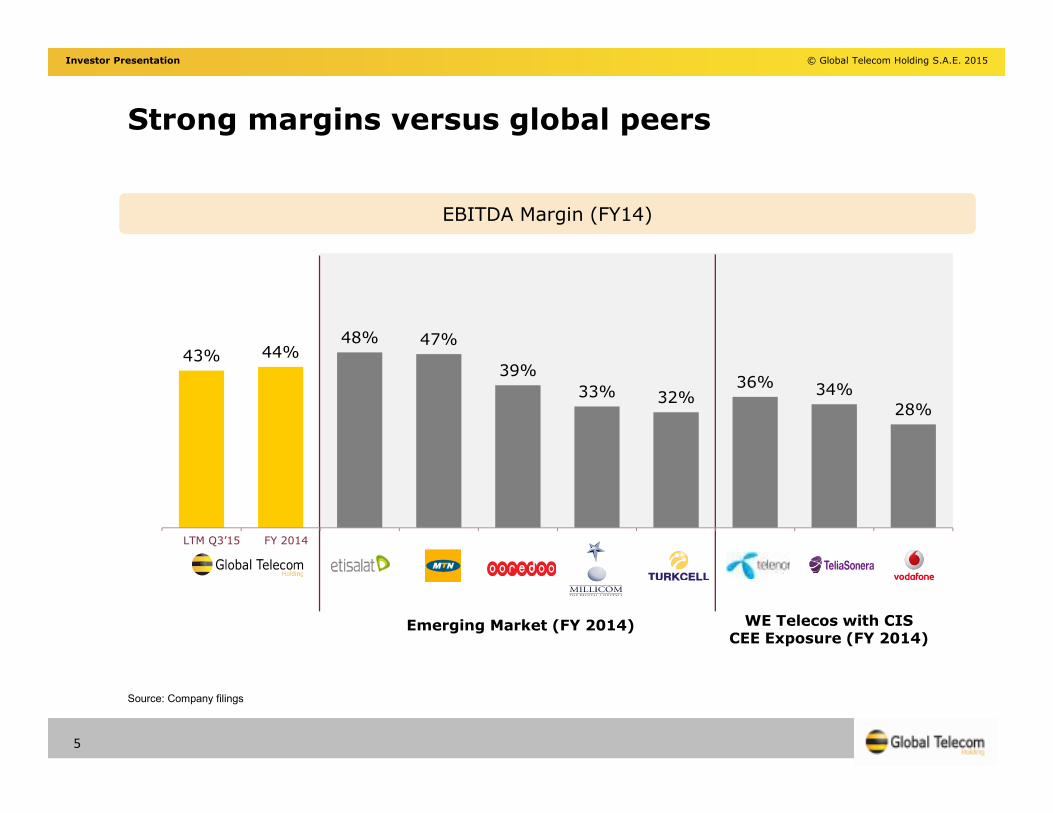
Strong margins versus global peers
EBITDA Margin (FY14)
WE Telecos with CIS CEE Exposure (FY 2014)
Emerging Market (FY 2014)
LTM Q3’15 FY 2014
Source: Company filings
43% 44%48% 47%
39%
33% 32% 36% 34%
28%
5
Investor Presentation © Global Telecom Holding S.A.E. 2015
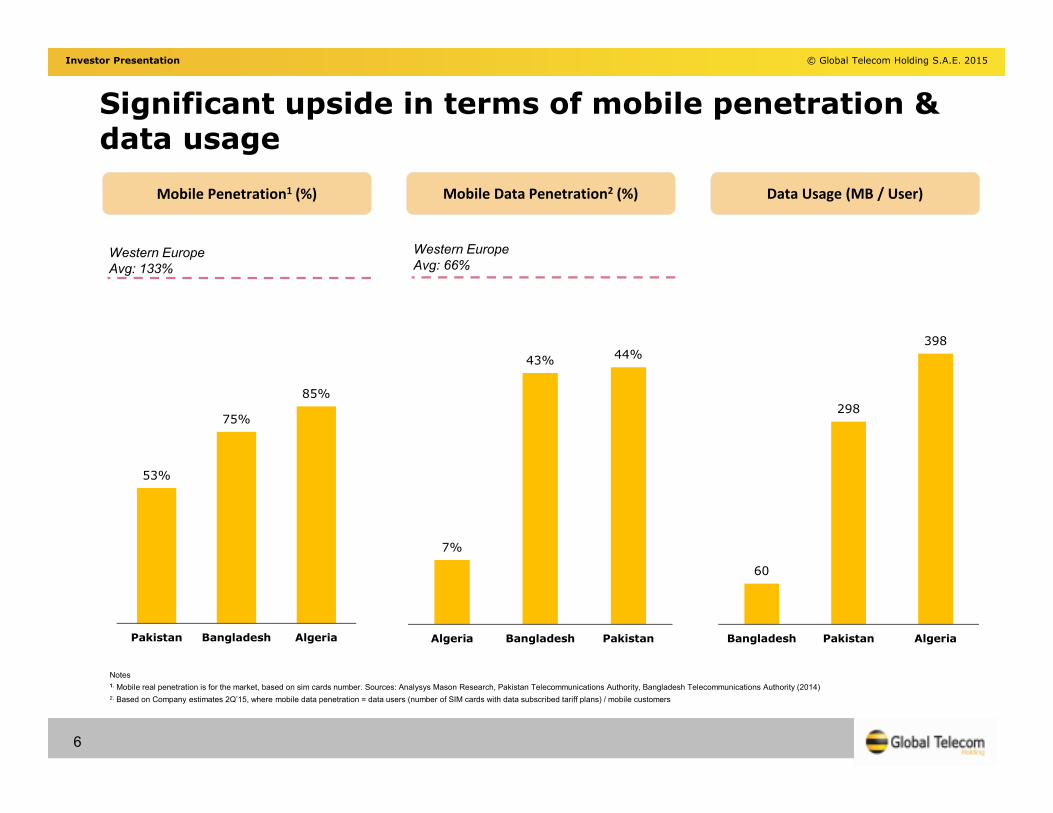
60
298
398
Bangladesh Pakistan Algeria
53%
75%
85%
Pakistan Bangladesh Algeria
7%
43%44%
Algeria Bangladesh Pakistan
Mobile Data Penetration2 (%) Data Usage (MB / User)Mobile Penetration1 (%)
Western Europe
Avg: 133%
Western Europe
Avg: 66%
Significant upside in terms of mobile penetration & data usage
Notes
1. Mobile real penetration is for the market, based on sim cards number. Sources: Analysys Mason Research, Pakistan Telecommunications Authority, Bangladesh Telecommunications Authority (2014)
2. Based on Company estimates 2Q’15, where mobile data penetration = data users (number of SIM cards with data subscribed tariff plans) / mobile customers
6
Investor Presentation © Global Telecom Holding S.A.E. 2015
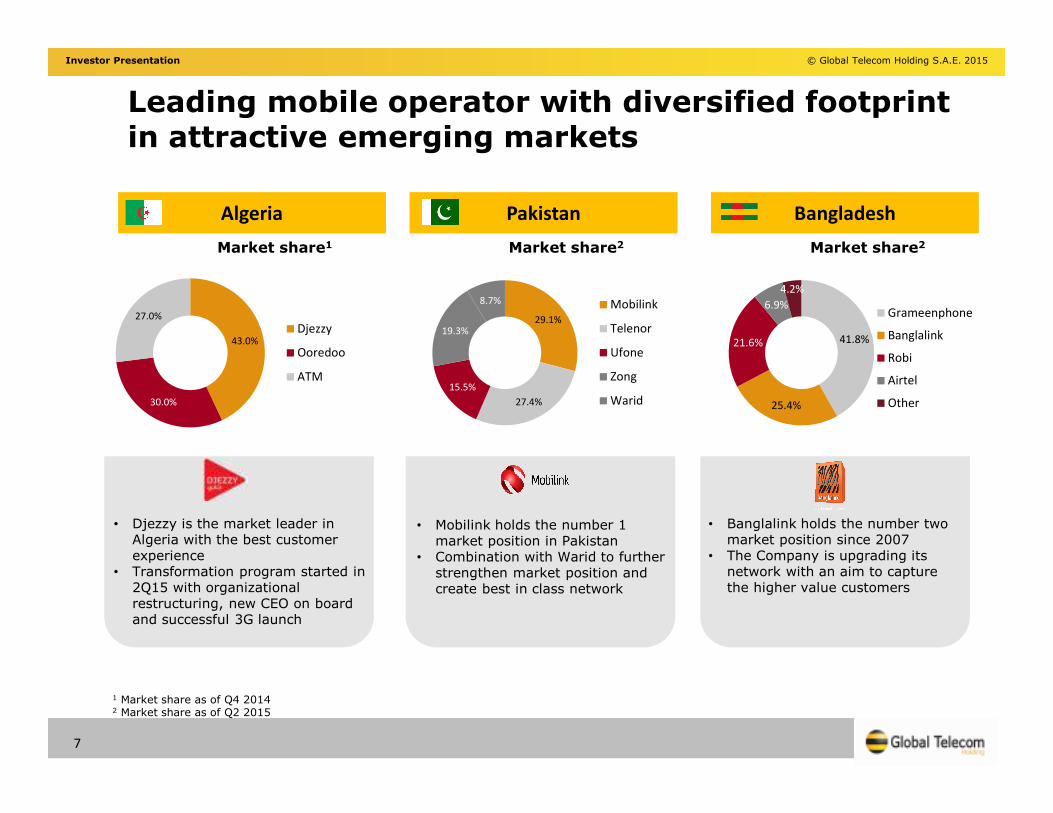
Leading mobile operator with diversified footprint in attractive emerging markets
Pakistan BangladeshAlgeria
Market share1 Market share2 Market share2
43.0%
30.0%
27.0%
Djezzy
Ooredoo
ATM
29.1%
27.4%
15.5%
19.3%
8.7% Mobilink
Telenor
Ufone
Zong
Warid
41.8%
25.4%
21.6%
6.9%
4.2%
Grameenphone
Banglalink
Robi
Airtel
Other
• Djezzy is the market leader in Algeria with the best customer experience
• Transformation program started in 2Q15 with organizational restructuring, new CEO on board and successful 3G launch
• Mobilink holds the number 1 market position in Pakistan
• Combination with Warid to further strengthen market position and create best in class network
• Banglalink holds the number two market position since 2007
• The Company is upgrading its network with an aim to capture the higher value customers
1 Market share as of Q4 20142 Market share as of Q2 2015
7
Investor Presentation © Global Telecom Holding S.A.E. 2015
8
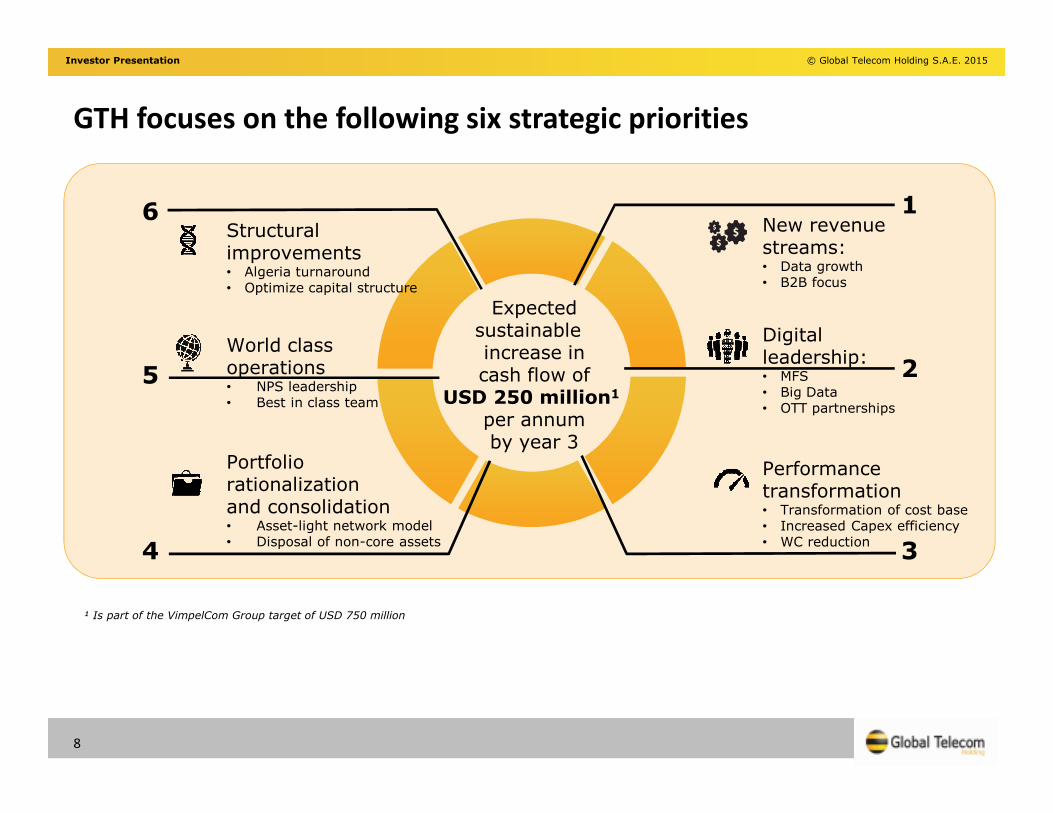
GTH focuses on the following six strategic priorities
1
Performancetransformation• Transformation of cost base• Increased Capex efficiency• WC reduction
Digitalleadership:• MFS• Big Data• OTT partnerships
New revenuestreams:• Data growth• B2B focus
Portfoliorationalizationand consolidation• Asset-light network model• Disposal of non-core assets
World classoperations• NPS leadership• Best in class team
Structuralimprovements• Algeria turnaround• Optimize capital structure
3
2
6
4
5
Expectedsustainable increase incash flow of
USD 250 million1
per annumby year 3
¹ Is part of the VimpelCom Group target of USD 750 million
Investor Presentation © Global Telecom Holding S.A.E. 2015
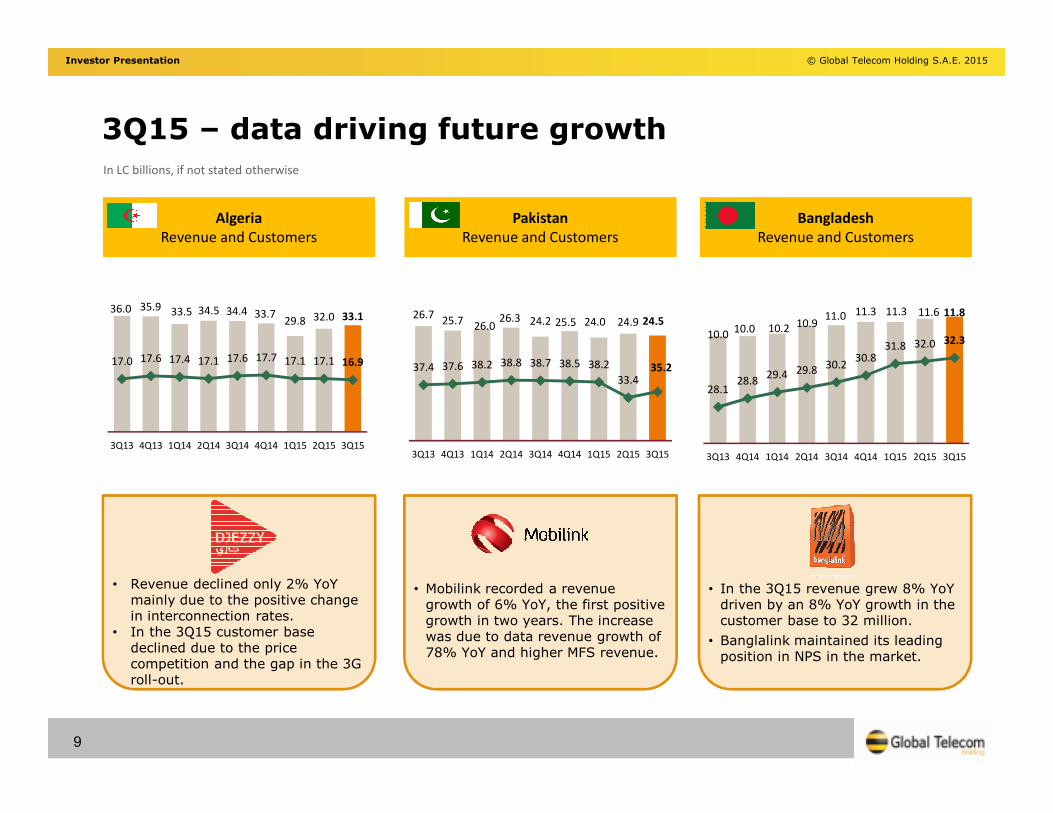
3Q15 – data driving future growth
36.0 35.9 33.5 34.5 34.4 33.729.8 32.0 33.1
17.0 17.6 17.4 17.1 17.6 17.7 17.1 17.1 16.9
3Q13 4Q13 1Q14 2Q14 3Q14 4Q14 1Q15 2Q15 3Q15
26.725.7
26.026.3 24.2 25.5 24.0 24.9 24.5
37.4 37.6 38.2 38.8 38.7 38.5 38.2
33.435.2
3Q13 4Q13 1Q14 2Q14 3Q14 4Q14 1Q15 2Q15 3Q15
10.010.0 10.2 10.9
11.0 11.3 11.3 11.6 11.8
28.128.8
29.4 29.830.2
30.831.8 32.0 32.3
3Q13 4Q14 1Q14 2Q14 3Q14 4Q14 1Q15 2Q15 3Q15
• Revenue declined only 2% YoYmainly due to the positive change in interconnection rates.
• In the 3Q15 customer base declined due to the price competition and the gap in the 3G roll-out.
• Mobilink recorded a revenue growth of 6% YoY, the first positive growth in two years. The increase was due to data revenue growth of 78% YoY and higher MFS revenue.
• In the 3Q15 revenue grew 8% YoYdriven by an 8% YoY growth in the customer base to 32 million.
• Banglalink maintained its leading position in NPS in the market.
In LC billions, if not stated otherwise
Bangladesh
Revenue and Customers
Algeria
Revenue and Customers
Pakistan
Revenue and Customers
9
Investor Presentation © Global Telecom Holding S.A.E. 2015
Bangladesh
EBITDA & EBITDA Margin
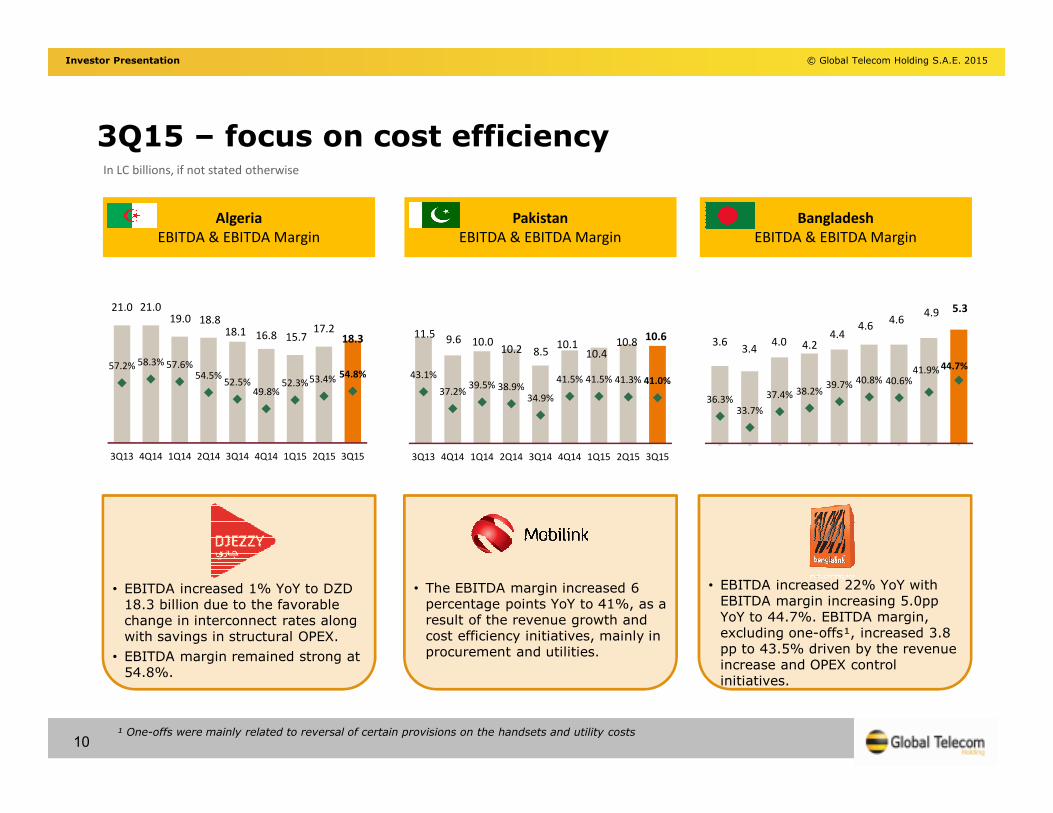
3Q15 – focus on cost efficiency
Algeria
EBITDA & EBITDA Margin
Pakistan
EBITDA & EBITDA Margin
21.0 21.019.0 18.8
18.1 16.8 15.717.2
18.3
57.2% 58.3% 57.6%54.5%
52.5%49.8%
52.3%53.4%54.8%
3Q13 4Q14 1Q14 2Q14 3Q14 4Q14 1Q15 2Q15 3Q15
11.59.6 10.0
10.2 8.510.1
10.410.8
10.6
43.1%
37.2%39.5% 38.9%
34.9%
41.5% 41.5% 41.3% 41.0%
3Q13 4Q14 1Q14 2Q14 3Q14 4Q14 1Q15 2Q15 3Q15
3.63.4
4.0 4.24.4
4.64.6
4.9 5.3
36.3%33.7%
37.4% 38.2%39.7% 40.8% 40.6%
41.9% 44.7%
3Q13 4Q14 1Q14 2Q14 3Q14 4Q14 1Q15 2Q15 3Q15
• EBITDA increased 1% YoY to DZD 18.3 billion due to the favorable change in interconnect rates along with savings in structural OPEX.
• EBITDA margin remained strong at 54.8%.
• The EBITDA margin increased 6 percentage points YoY to 41%, as a result of the revenue growth and cost efficiency initiatives, mainly in procurement and utilities.
• EBITDA increased 22% YoY with EBITDA margin increasing 5.0pp YoY to 44.7%. EBITDA margin, excluding one-offs¹, increased 3.8 pp to 43.5% driven by the revenue increase and OPEX control initiatives.
In LC billions, if not stated otherwise
10¹ One-offs were mainly related to reversal of certain provisions on the handsets and utility costs
Investor Presentation © Global Telecom Holding S.A.E. 2015
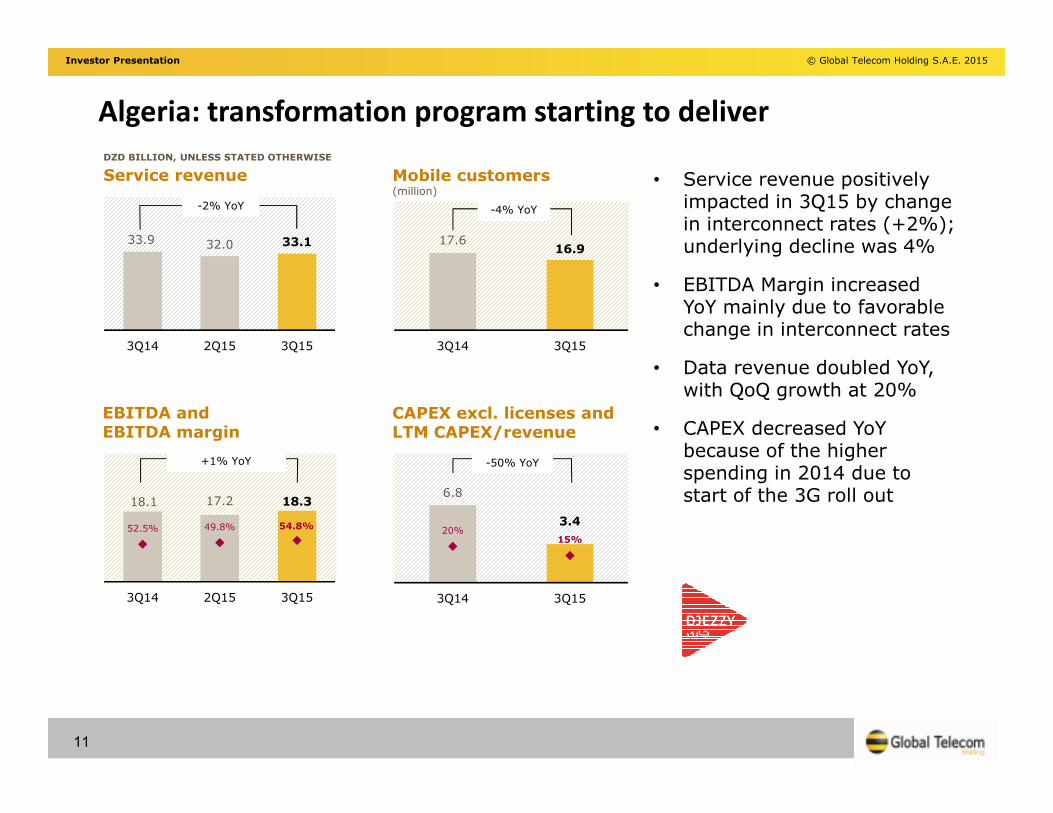
Algeria: transformation program starting to deliver
11
18.1 17.2 18.3
52.5% 49.8% 54.8%
3Q14 2Q15 3Q15
33.9 32.0 33.1
3Q14 2Q15 3Q15
17.616.9
3Q14 3Q15
6.8
3.420%
15%
3Q14 3Q15
-4% YoY
DZD BILLION, UNLESS STATED OTHERWISE
Service revenue Mobile customers (million)
EBITDA andEBITDA margin
CAPEX excl. licenses and LTM CAPEX/revenue
-2% YoY
-50% YoY+1% YoY
• Service revenue positively impacted in 3Q15 by change in interconnect rates (+2%); underlying decline was 4%
• EBITDA Margin increased YoY mainly due to favorable change in interconnect rates
• Data revenue doubled YoY, with QoQ growth at 20%
• CAPEX decreased YoY because of the higher spending in 2014 due to start of the 3G roll out
Investor Presentation © Global Telecom Holding S.A.E. 2015
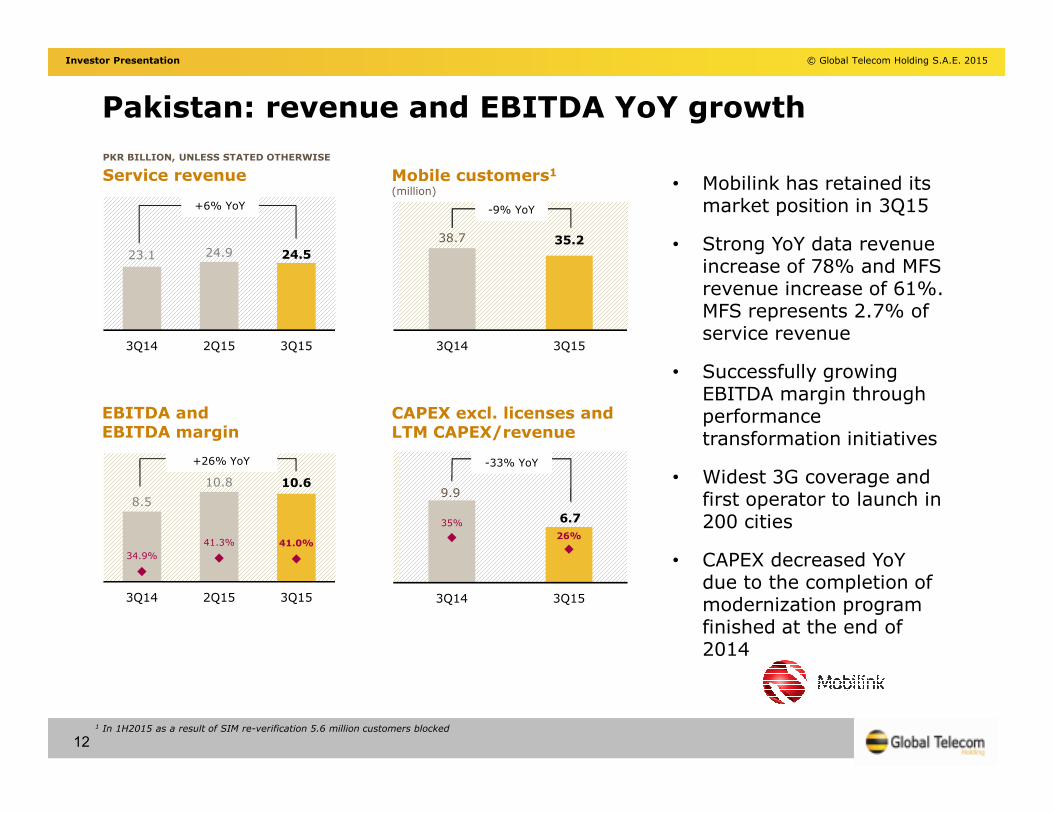
• Mobilink has retained its market position in 3Q15
• Strong YoY data revenue increase of 78% and MFS revenue increase of 61%. MFS represents 2.7% of service revenue
• Successfully growing EBITDA margin through performance transformation initiatives
• Widest 3G coverage and first operator to launch in 200 cities
• CAPEX decreased YoY due to the completion of modernization program finished at the end of 2014
Pakistan: revenue and EBITDA YoY growth
12
9.9
6.735%
26%
3Q14 3Q15
23.1 24.9 24.5
3Q14 2Q15 3Q15
8.5
10.8 10.6
34.9%
41.3% 41.0%
3Q14 2Q15 3Q15
38.7 35.2
3Q14 3Q15
-33% YoY
-9% YoY
+26% YoY
PKR BILLION, UNLESS STATED OTHERWISE
Service revenue Mobile customers1(million)
EBITDA andEBITDA margin
CAPEX excl. licenses and LTM CAPEX/revenue
1 In 1H2015 as a result of SIM re-verification 5.6 million customers blocked
+6% YoY
Investor Presentation © Global Telecom Holding S.A.E. 2015
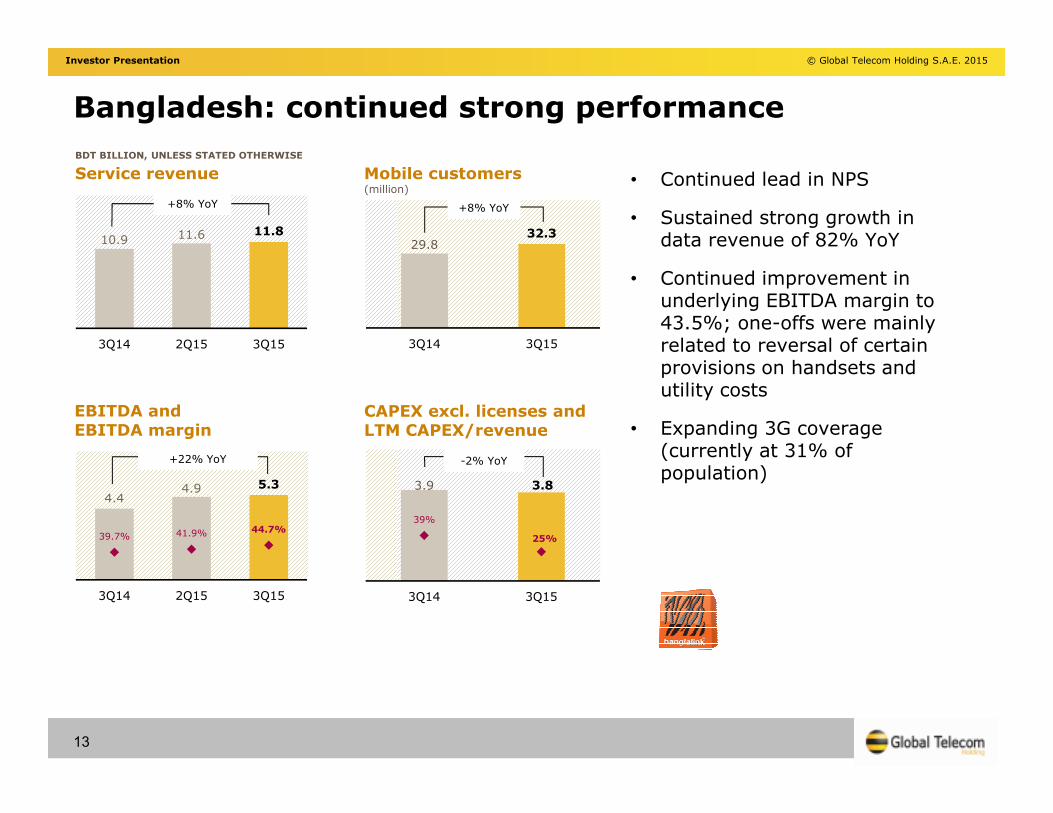
Bangladesh: continued strong performance
13
3.9 3.8
39%
25%
3Q14 3Q15
29.832.3
3Q14 3Q15
4.44.9 5.3
39.7% 41.9% 44.7%
3Q14 2Q15 3Q15
10.9 11.6 11.8
3Q14 2Q15 3Q15
-2% YoY
+8% YoY
BDT BILLION, UNLESS STATED OTHERWISE
Service revenue
EBITDA andEBITDA margin
CAPEX excl. licenses and LTM CAPEX/revenue
Mobile customers (million)
+8% YoY
+22% YoY
• Continued lead in NPS
• Sustained strong growth in data revenue of 82% YoY
• Continued improvement in underlying EBITDA margin to 43.5%; one-offs were mainly related to reversal of certain provisions on handsets and utility costs
• Expanding 3G coverage (currently at 31% of population)
Strengthening our leadership position in Pakistan
Investor Presentation © Global Telecom Holding S.A.E. 2015
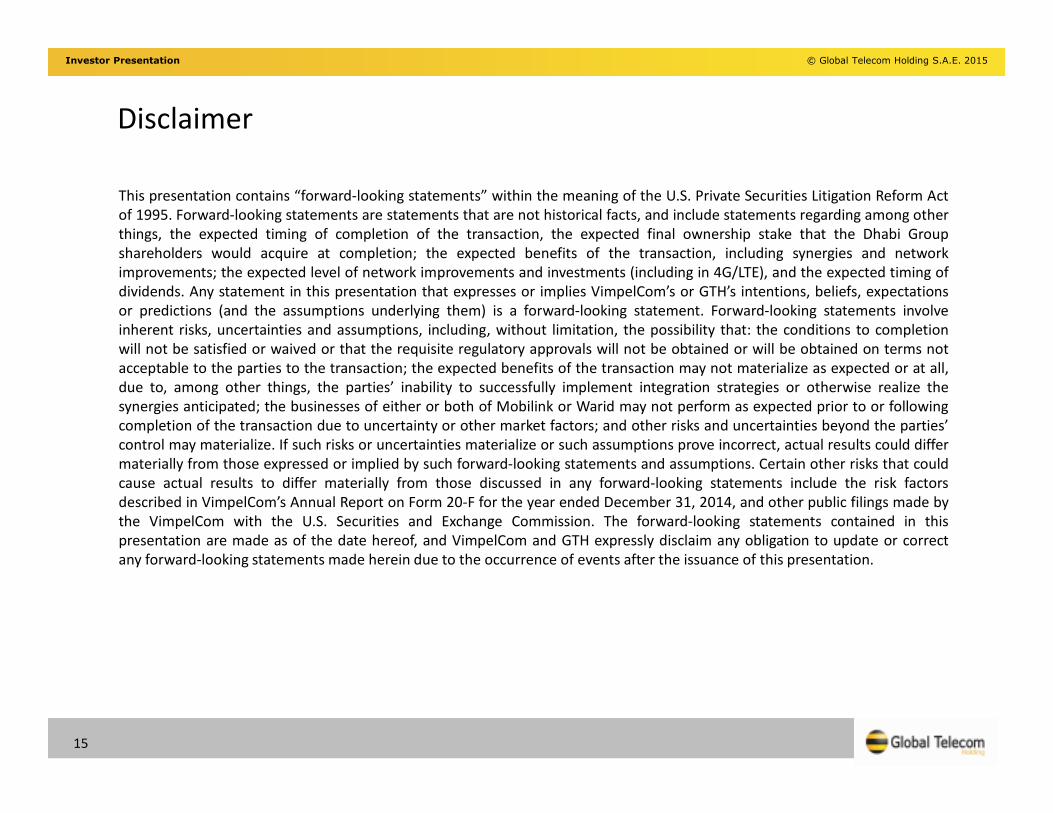
Disclaimer
This presentation contains “forward-looking statements” within the meaning of the U.S. Private Securities Litigation Reform Act
of 1995. Forward-looking statements are statements that are not historical facts, and include statements regarding among other
things, the expected timing of completion of the transaction, the expected final ownership stake that the Dhabi Group
shareholders would acquire at completion; the expected benefits of the transaction, including synergies and network
improvements; the expected level of network improvements and investments (including in 4G/LTE), and the expected timing of
dividends. Any statement in this presentation that expresses or implies VimpelCom’s or GTH’s intentions, beliefs, expectations
or predictions (and the assumptions underlying them) is a forward-looking statement. Forward-looking statements involve
inherent risks, uncertainties and assumptions, including, without limitation, the possibility that: the conditions to completion
will not be satisfied or waived or that the requisite regulatory approvals will not be obtained or will be obtained on terms not
acceptable to the parties to the transaction; the expected benefits of the transaction may not materialize as expected or at all,
due to, among other things, the parties’ inability to successfully implement integration strategies or otherwise realize the
synergies anticipated; the businesses of either or both of Mobilink or Warid may not perform as expected prior to or following
completion of the transaction due to uncertainty or other market factors; and other risks and uncertainties beyond the parties’
control may materialize. If such risks or uncertainties materialize or such assumptions prove incorrect, actual results could differ
materially from those expressed or implied by such forward-looking statements and assumptions. Certain other risks that could
cause actual results to differ materially from those discussed in any forward-looking statements include the risk factors
described in VimpelCom’s Annual Report on Form 20-F for the year ended December 31, 2014, and other public filings made by
the VimpelCom with the U.S. Securities and Exchange Commission. The forward-looking statements contained in this
presentation are made as of the date hereof, and VimpelCom and GTH expressly disclaim any obligation to update or correct
any forward-looking statements made herein due to the occurrence of events after the issuance of this presentation.
15
Investor Presentation © Global Telecom Holding S.A.E. 2015
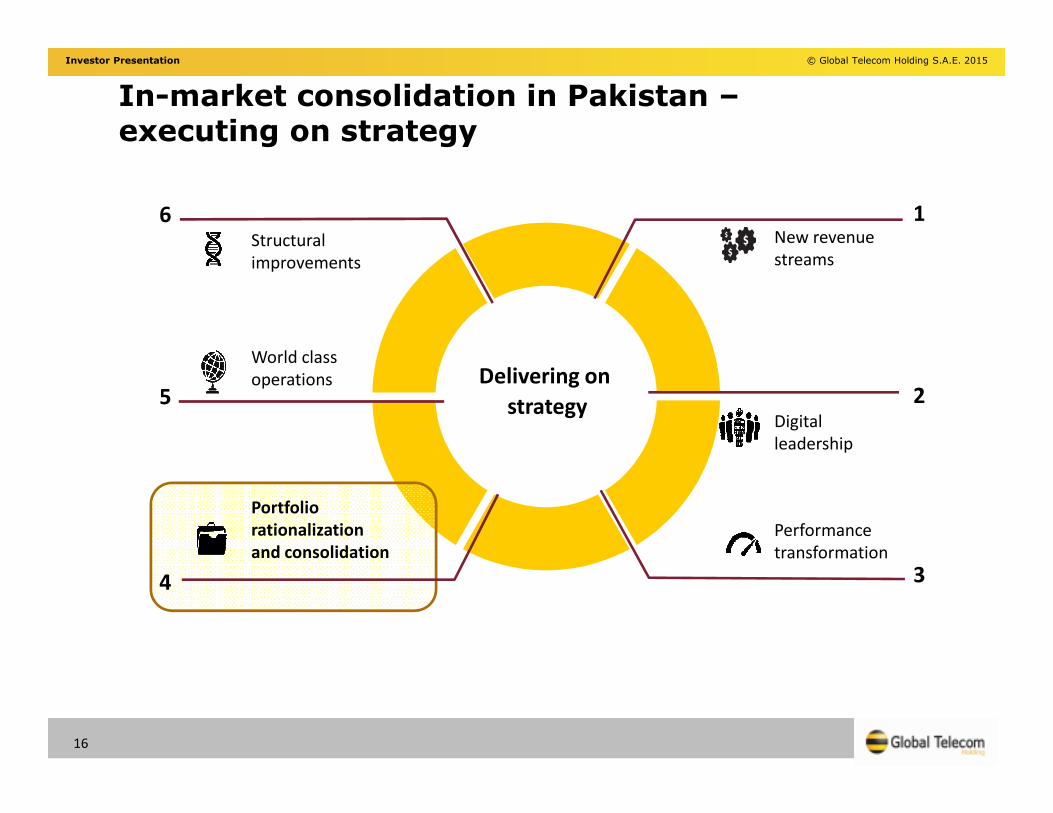
Delivering on
strategy
1
Performance
transformation
Digital
leadership
New revenue
streams
World class
operations
Structural
improvements
3
2
6
5
Portfolio
rationalization
and consolidation
4
In-market consolidation in Pakistan –executing on strategy
16
Investor Presentation © Global Telecom Holding S.A.E. 2015
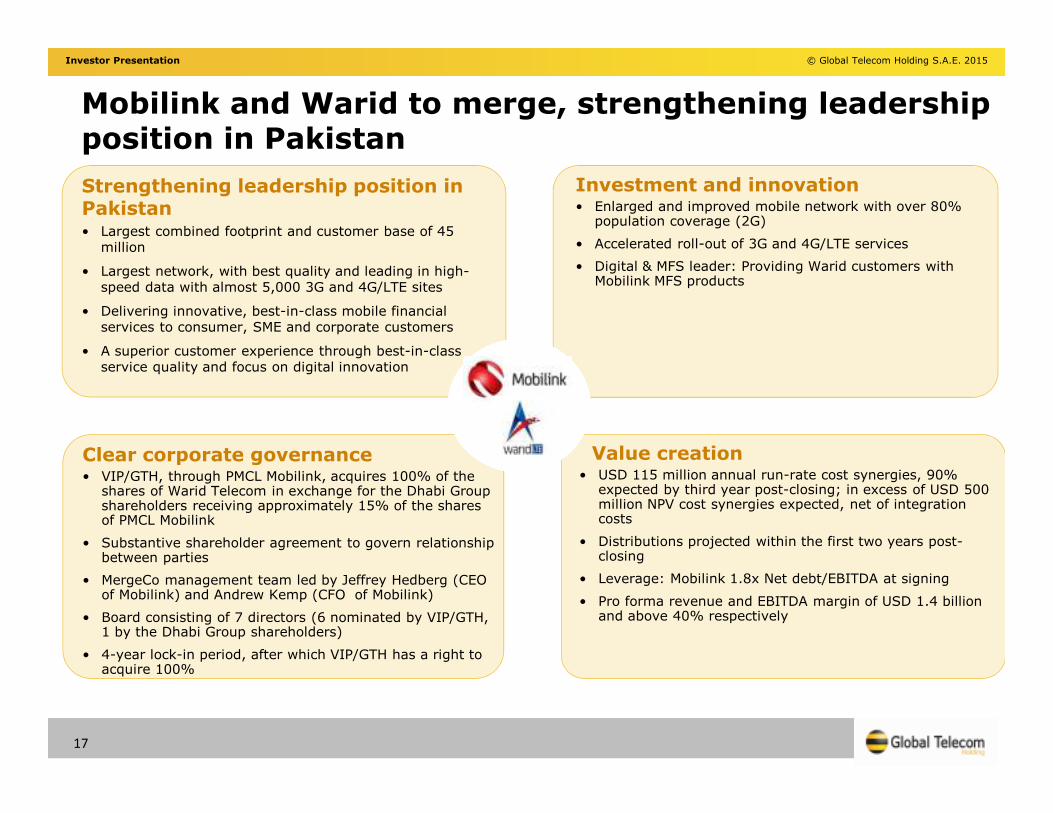
Strengthening leadership position in Pakistan• Largest combined footprint and customer base of 45
million
• Largest network, with best quality and leading in high-speed data with almost 5,000 3G and 4G/LTE sites
• Delivering innovative, best-in-class mobile financial services to consumer, SME and corporate customers
• A superior customer experience through best-in-class service quality and focus on digital innovation
Value creation• USD 115 million annual run-rate cost synergies, 90%
expected by third year post-closing; in excess of USD 500 million NPV cost synergies expected, net of integration costs
• Distributions projected within the first two years post-closing
• Leverage: Mobilink 1.8x Net debt/EBITDA at signing
• Pro forma revenue and EBITDA margin of USD 1.4 billion and above 40% respectively
Clear corporate governance• VIP/GTH, through PMCL Mobilink, acquires 100% of the
shares of Warid Telecom in exchange for the Dhabi Group shareholders receiving approximately 15% of the shares of PMCL Mobilink
• Substantive shareholder agreement to govern relationship between parties
• MergeCo management team led by Jeffrey Hedberg (CEO of Mobilink) and Andrew Kemp (CFO of Mobilink)
• Board consisting of 7 directors (6 nominated by VIP/GTH, 1 by the Dhabi Group shareholders)
• 4-year lock-in period, after which VIP/GTH has a right to acquire 100%
Investment and innovation• Enlarged and improved mobile network with over 80%
population coverage (2G)
• Accelerated roll-out of 3G and 4G/LTE services
• Digital & MFS leader: Providing Warid customers with Mobilink MFS products
Mobilink and Warid to merge, strengthening leadership position in Pakistan
17
Investor Presentation © Global Telecom Holding S.A.E. 2015
Transaction rationale
Best-in-class mobile
network
New revenueopportunities
Costsynergies
Superiorcustomer
experience
A leading operator in Pakistan telecom market
+ -
18
Investor Presentation © Global Telecom Holding S.A.E. 2015
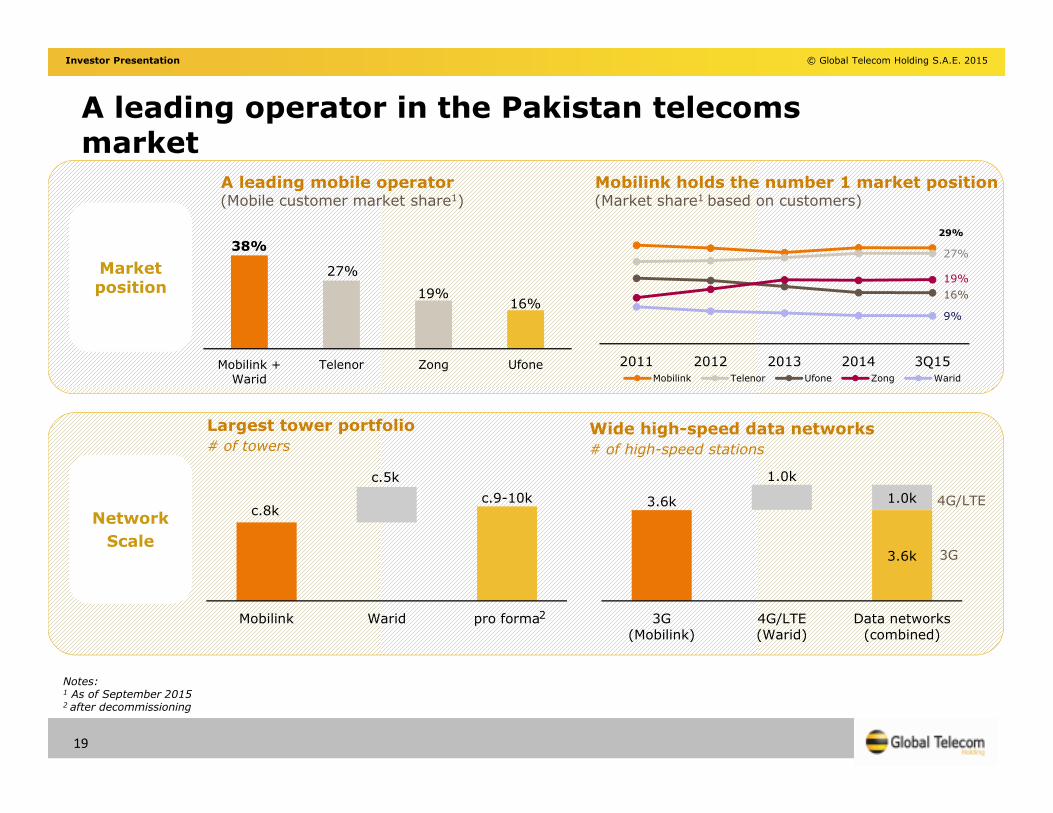
A leading operator in the Pakistan telecoms market
MarketpositionMarketposition
A leading mobile operator(Mobile customer market share1)
38%
27%
19%16%
Mobilink +
Warid
Telenor Zong Ufone
Network
Scale
Network
Scale
29%
27%
16%
19%
9%
2011 2012 2013 2014 3Q15Mobilink Telenor Ufone Zong Warid
Notes:1 As of September 20152 after decommissioning
3.6k
3.6k
1.0k
1.0k
3G
(Mobilink)
4G/LTE
(Warid)
Data networks
(combined)
4G/LTE
3G
Largest tower portfolio
# of towers
c.8kc.9-10k
c.5k
Mobilink Warid pro forma
Mobilink holds the number 1 market position(Market share1 based on customers)
Wide high-speed data networks
# of high-speed stations
2
19
Investor Presentation © Global Telecom Holding S.A.E. 2015
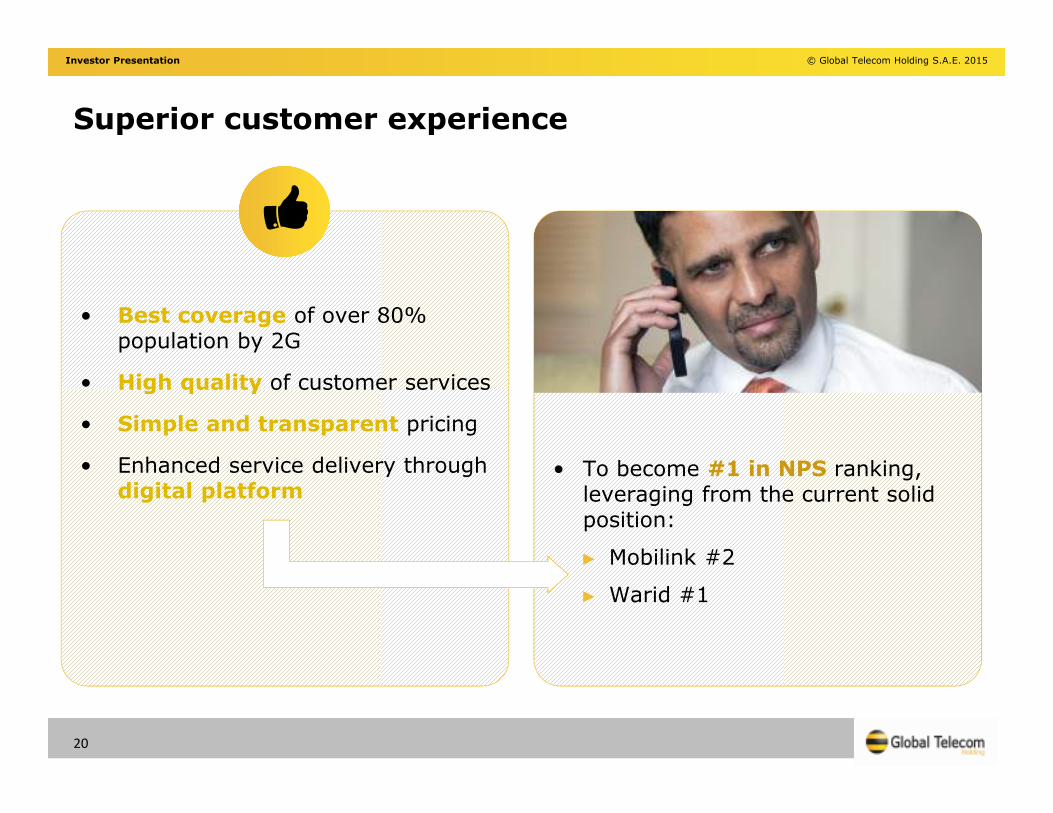
Superior customer experience
• To become #1 in NPS ranking, leveraging from the current solid position:
► Mobilink #2
► Warid #1
• Best coverage of over 80% population by 2G
• High quality of customer services
• Simple and transparent pricing
• Enhanced service delivery through digital platform
20
Investor Presentation © Global Telecom Holding S.A.E. 2015
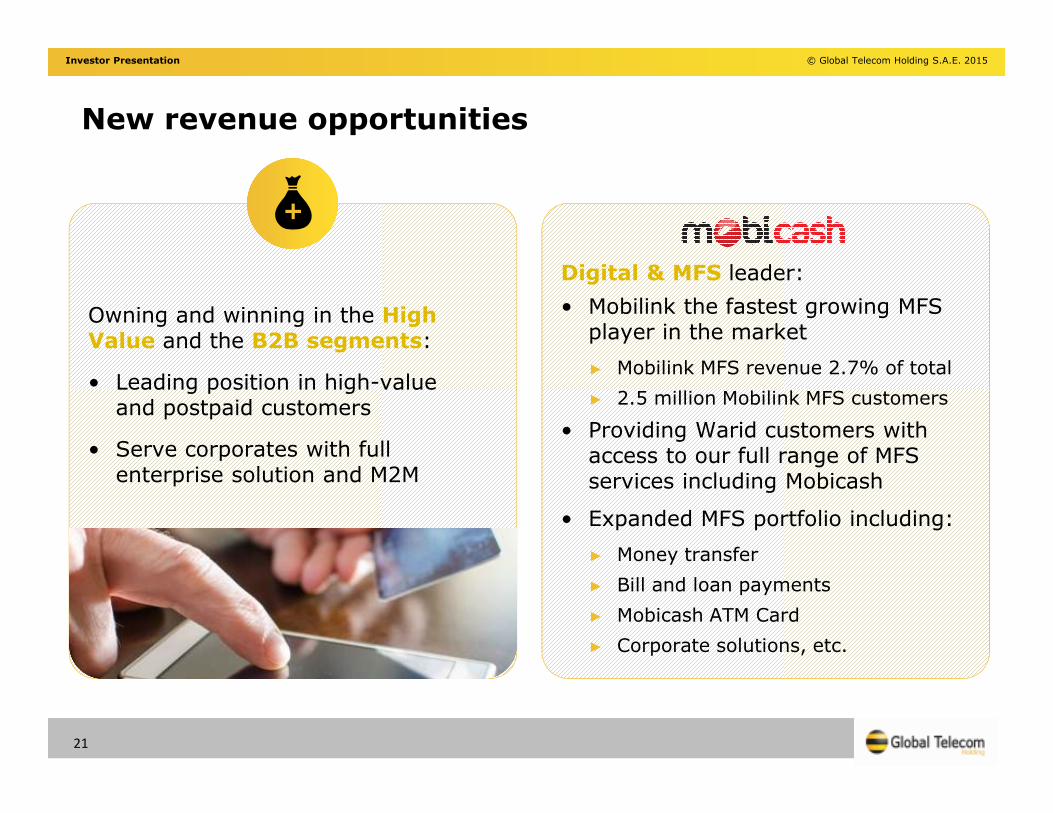
New revenue opportunities
Digital & MFS leader:
• Mobilink the fastest growing MFS player in the market
► Mobilink MFS revenue 2.7% of total
► 2.5 million Mobilink MFS customers
• Providing Warid customers with access to our full range of MFS services including Mobicash
• Expanded MFS portfolio including:
► Money transfer
► Bill and loan payments
► Mobicash ATM Card
► Corporate solutions, etc.
Owning and winning in the High Value and the B2B segments:
• Leading position in high-value and postpaid customers
• Serve corporates with full enterprise solution and M2M
+
21
Investor Presentation © Global Telecom Holding S.A.E. 2015
Best-in-class mobile network
• Our plan is to enhance network capacity and quality of service
• Targeted network investments in quality and coverage
• Network consolidation through migration of customers and integration of network elements
• Decommissioning of overlapping sites within two years of closing
• Accelerated expansion of 4G/LTE services
22
Investor Presentation © Global Telecom Holding S.A.E. 2015
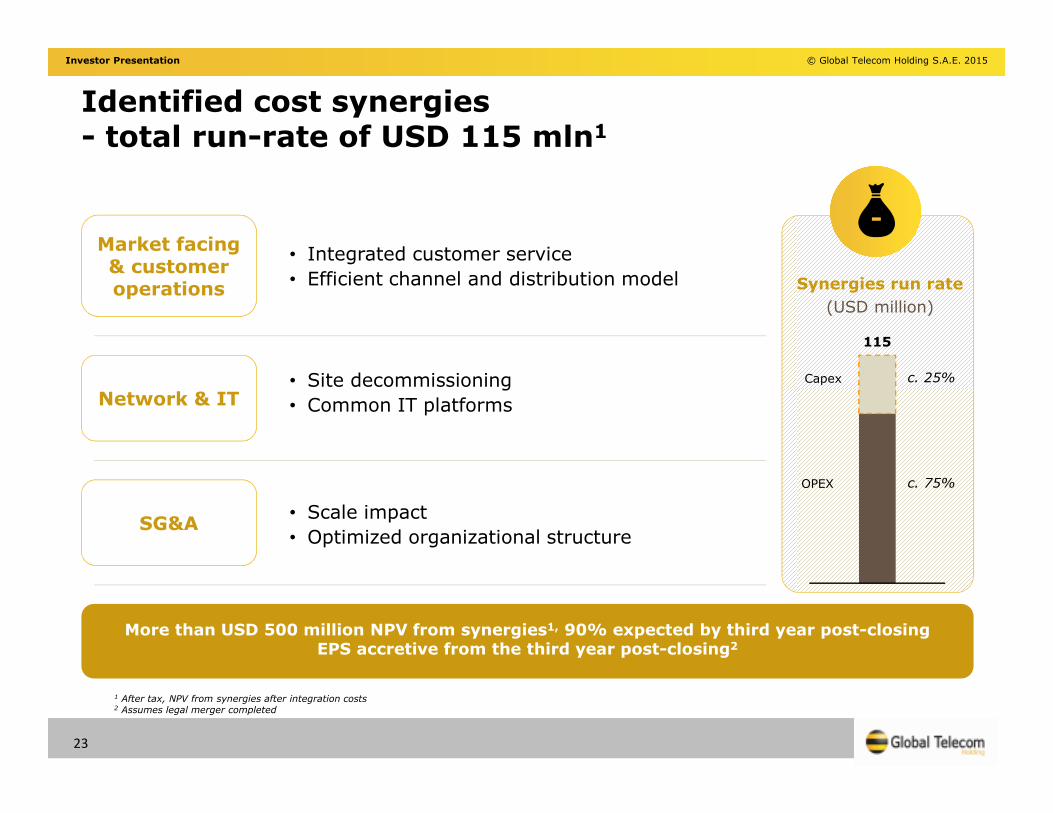
Identified cost synergies - total run-rate of USD 115 mln1
1 After tax, NPV from synergies after integration costs2 Assumes legal merger completed
More than USD 500 million NPV from synergies1, 90% expected by third year post-closingEPS accretive from the third year post-closing2
Market facing& customeroperations
• Integrated customer service
• Efficient channel and distribution model
Network & IT• Site decommissioning
• Common IT platforms
SG&A• Scale impact
• Optimized organizational structure
Synergies run rate
(USD million)
115
OPEX c. 75%
c. 25%Capex
-
23
Investor Presentation © Global Telecom Holding S.A.E. 2015
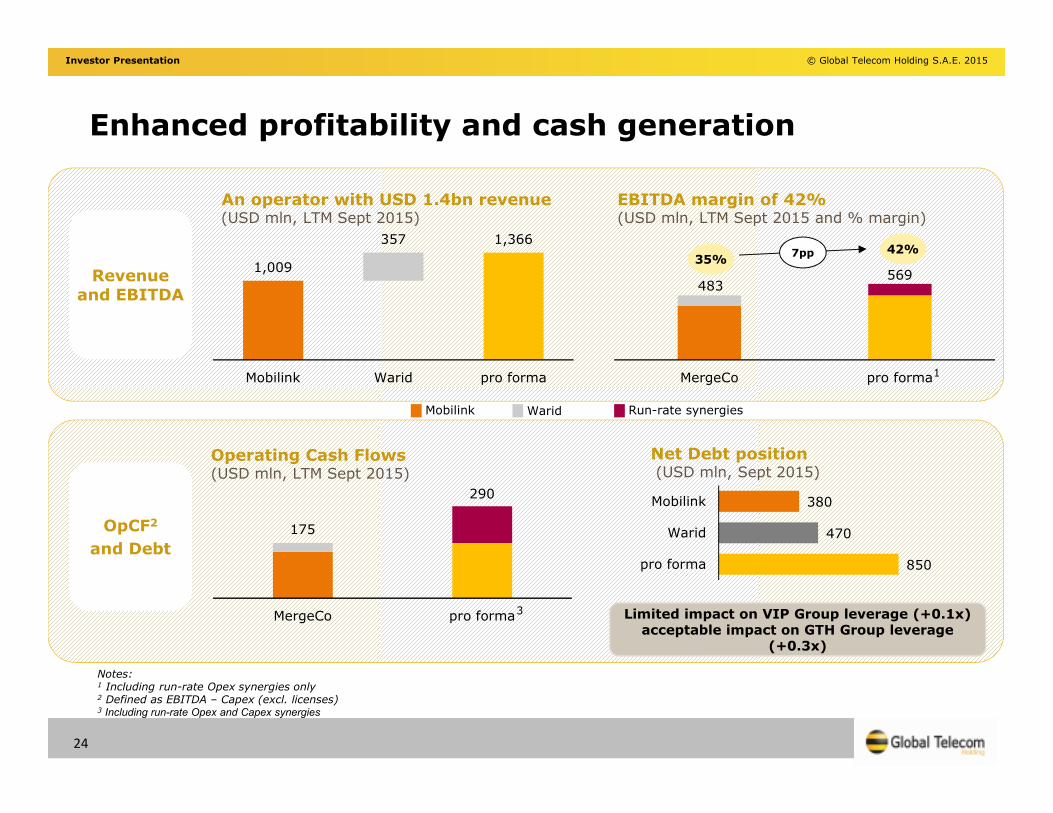
Enhanced profitability and cash generation
Notes:1 Including run-rate Opex synergies only2 Defined as EBITDA – Capex (excl. licenses)3 Including run-rate Opex and Capex synergies
Revenueand EBITDARevenue
and EBITDA
OpCF2
and Debt
OpCF2
and Debt
An operator with USD 1.4bn revenue(USD mln, LTM Sept 2015)
EBITDA margin of 42%(USD mln, LTM Sept 2015 and % margin)
1,009
357 1,366
Mobilink Warid pro forma
483569
MergeCo pro forma
35%42%7pp
1
Mobilink Warid Run-rate synergies
175
290
MergeCo pro forma
Operating Cash Flows(USD mln, LTM Sept 2015)
850
470
380
pro forma
Warid
Mobilink
Net Debt position(USD mln, Sept 2015)
3 Limited impact on VIP Group leverage (+0.1x)acceptable impact on GTH Group leverage
(+0.3x)
24
Investor Presentation © Global Telecom Holding S.A.E. 2015
Key transaction terms
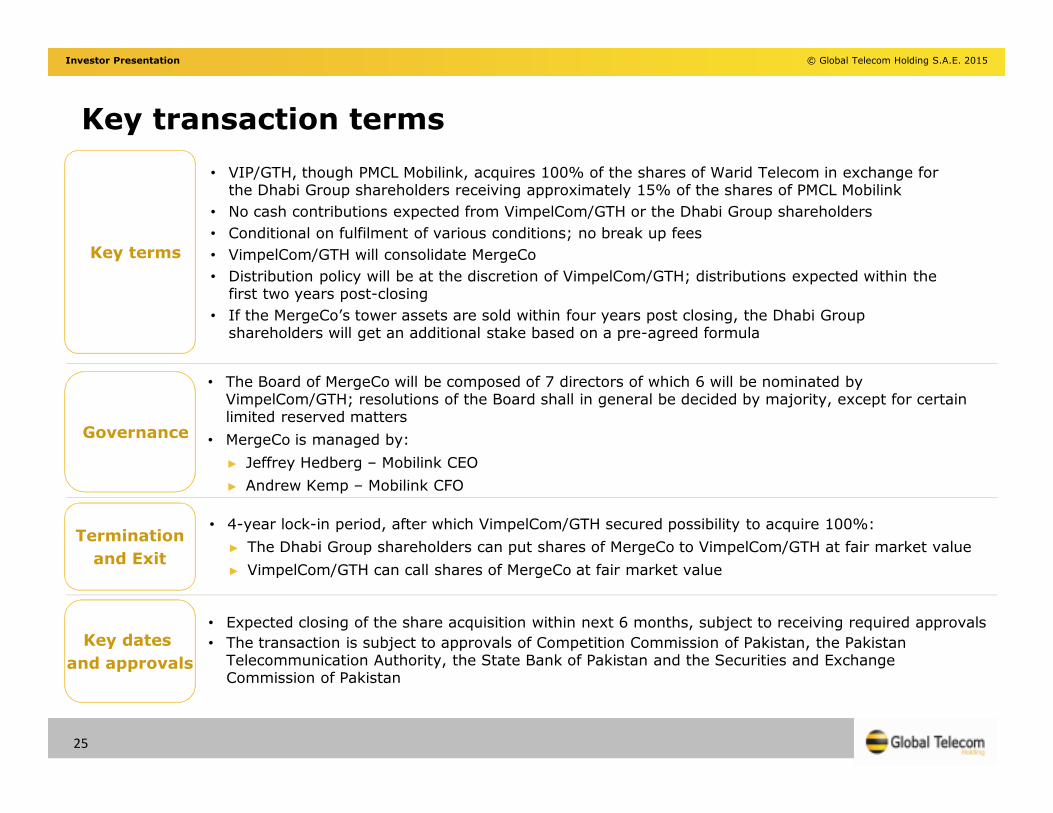
• VIP/GTH, though PMCL Mobilink, acquires 100% of the shares of Warid Telecom in exchange for the Dhabi Group shareholders receiving approximately 15% of the shares of PMCL Mobilink
• No cash contributions expected from VimpelCom/GTH or the Dhabi Group shareholders
• Conditional on fulfilment of various conditions; no break up fees
• VimpelCom/GTH will consolidate MergeCo
• Distribution policy will be at the discretion of VimpelCom/GTH; distributions expected within the first two years post-closing
• If the MergeCo’s tower assets are sold within four years post closing, the Dhabi Group shareholders will get an additional stake based on a pre-agreed formula
Key terms
• The Board of MergeCo will be composed of 7 directors of which 6 will be nominated by VimpelCom/GTH; resolutions of the Board shall in general be decided by majority, except for certain limited reserved matters
• MergeCo is managed by:
► Jeffrey Hedberg – Mobilink CEO
► Andrew Kemp – Mobilink CFO
Governance
• Expected closing of the share acquisition within next 6 months, subject to receiving required approvals
• The transaction is subject to approvals of Competition Commission of Pakistan, the Pakistan Telecommunication Authority, the State Bank of Pakistan and the Securities and Exchange Commission of Pakistan
Key dates
and approvals
• 4-year lock-in period, after which VimpelCom/GTH secured possibility to acquire 100%:
► The Dhabi Group shareholders can put shares of MergeCo to VimpelCom/GTH at fair market value
► VimpelCom/GTH can call shares of MergeCo at fair market value
Termination
and Exit
25
Investor Presentation © Global Telecom Holding S.A.E. 2015
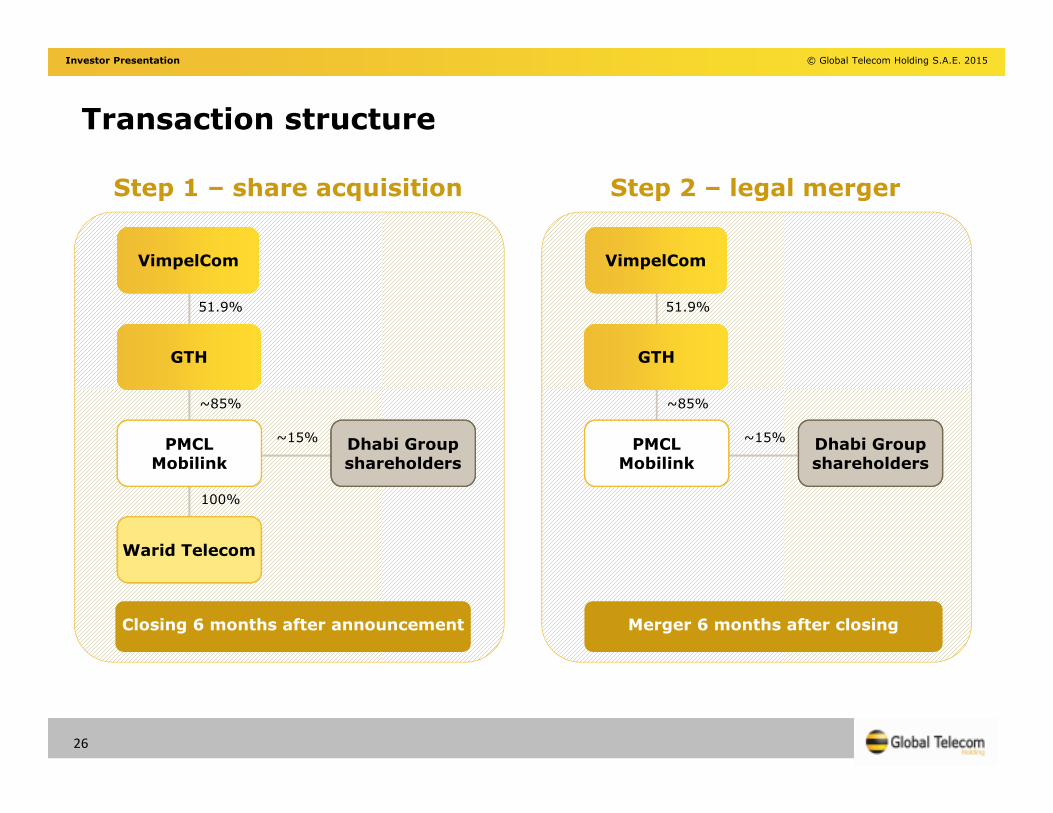
Transaction structure
Step 1 – share acquisition
51.9%
GTH
Warid Telecom
VimpelCom
Closing 6 months after announcement
PMCLMobilink
Dhabi Group shareholders
~85%
~15%
100%
Step 2 – legal merger
51.9%
GTH
VimpelCom
Merger 6 months after closing
PMCLMobilink
Dhabi Group shareholders
~85%
~15%
26
Investor Presentation © Global Telecom Holding S.A.E. 2015
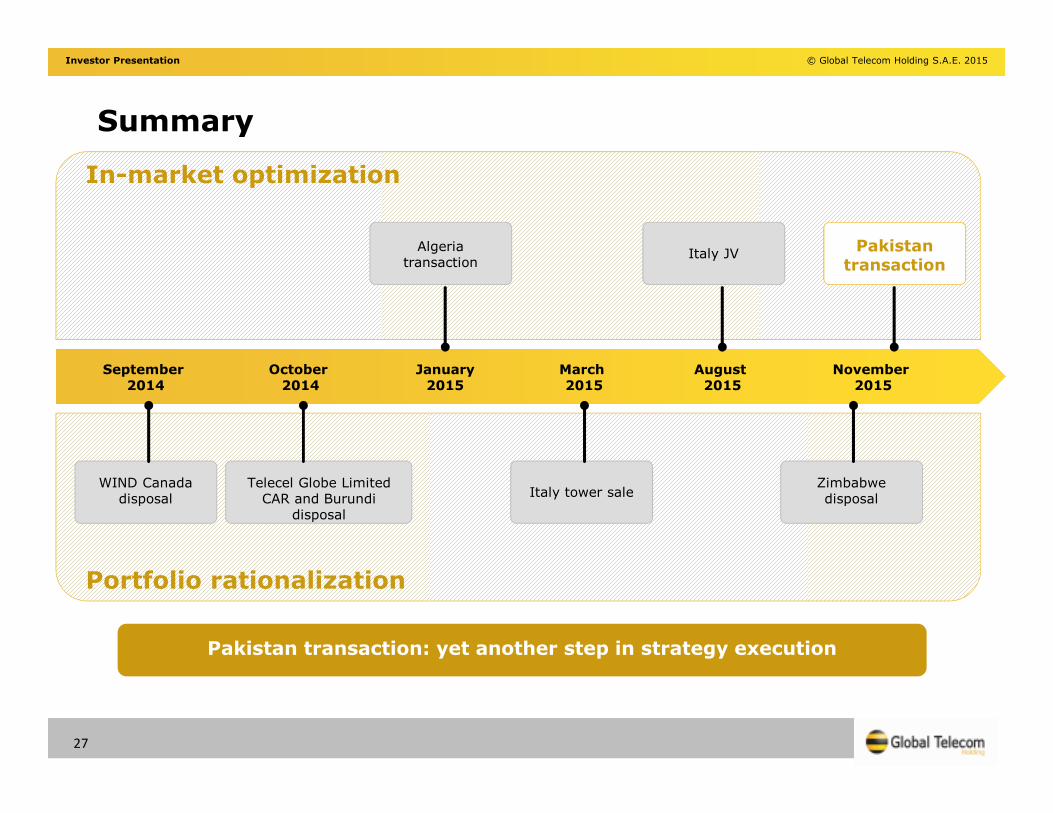
Summary
In-market optimization
Pakistan transaction: yet another step in strategy execution
September 2014
October 2014
January2015
March 2015
August 2015
November 2015
Portfolio rationalization
WIND Canada disposal
Telecel Globe Limited CAR and Burundi
disposal
Italy tower saleZimbabwe disposal
Algeria transaction
Italy JVPakistan
transaction
27
Investor Presentation © Global Telecom Holding S.A.E. 2015
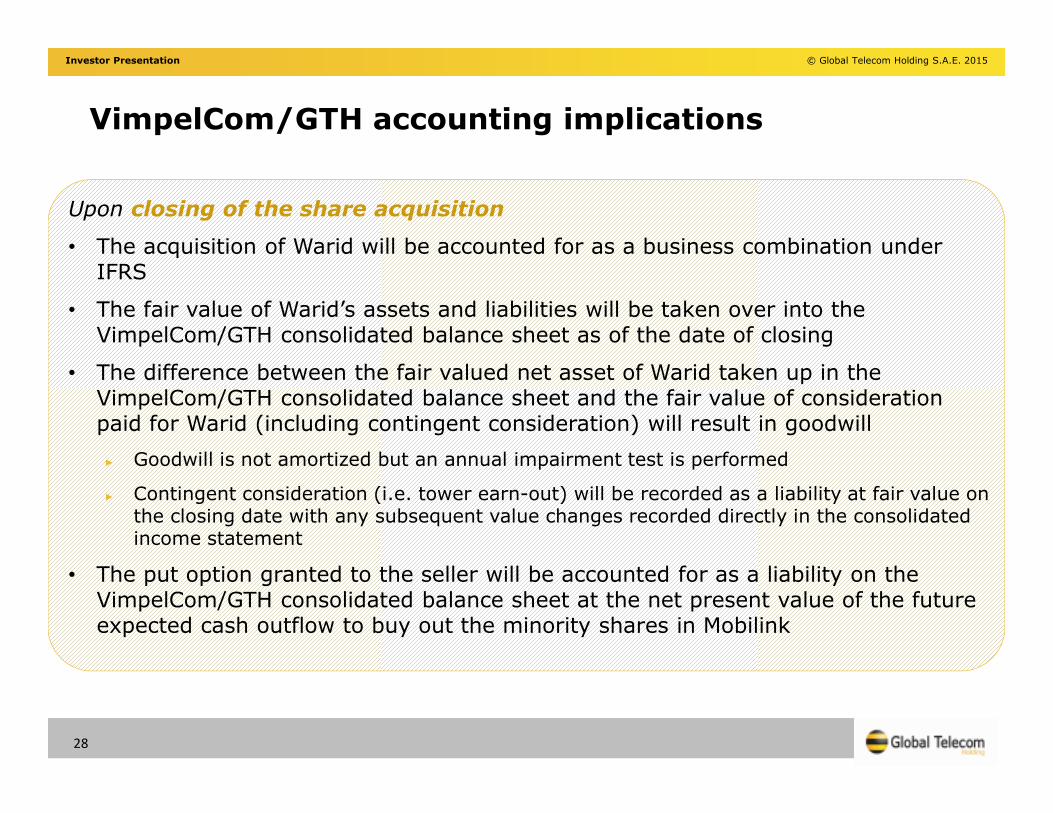
VimpelCom/GTH accounting implications
Upon closing of the share acquisition
• The acquisition of Warid will be accounted for as a business combination under IFRS
• The fair value of Warid’s assets and liabilities will be taken over into the VimpelCom/GTH consolidated balance sheet as of the date of closing
• The difference between the fair valued net asset of Warid taken up in the VimpelCom/GTH consolidated balance sheet and the fair value of consideration paid for Warid (including contingent consideration) will result in goodwill
► Goodwill is not amortized but an annual impairment test is performed
► Contingent consideration (i.e. tower earn-out) will be recorded as a liability at fair value on the closing date with any subsequent value changes recorded directly in the consolidated income statement
• The put option granted to the seller will be accounted for as a liability on the VimpelCom/GTH consolidated balance sheet at the net present value of the future expected cash outflow to buy out the minority shares in Mobilink
28
Appendix
Investor Presentation © Global Telecom Holding S.A.E. 2015
30
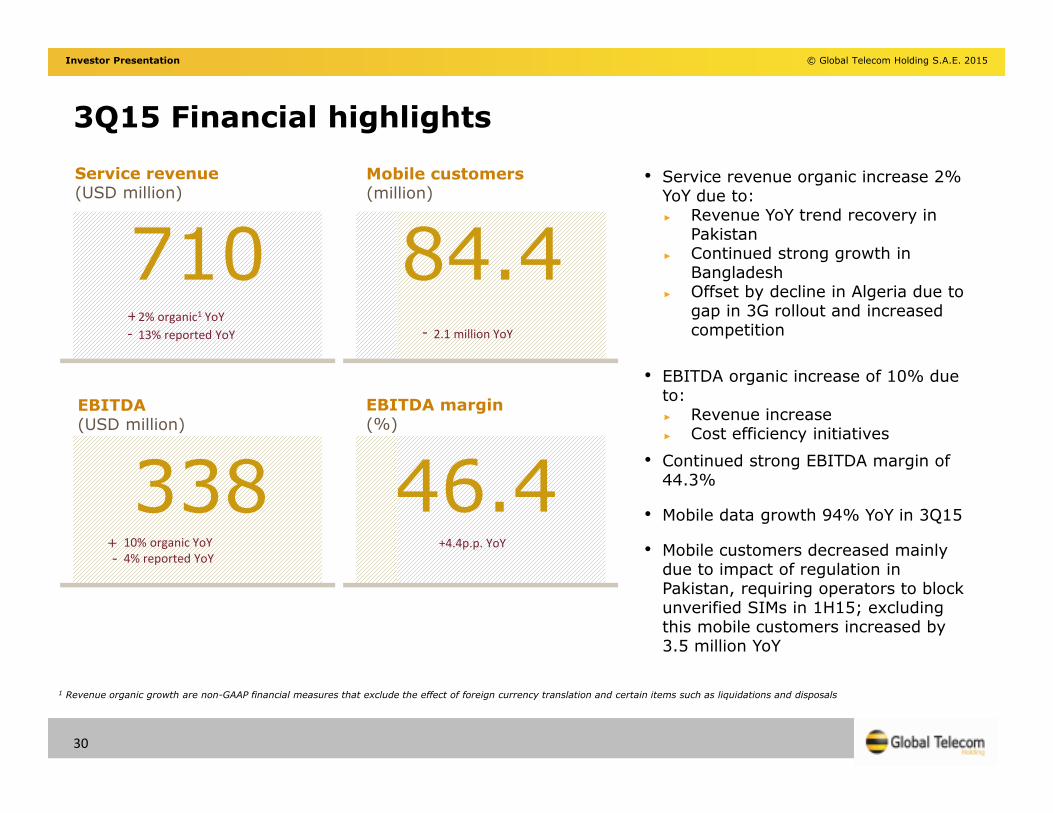
3Q15 Financial highlights
Service revenue(USD million)
710
46.4338
+2% organic1 YoY
- 13% reported YoY
+4.4p.p. YoY+-
10% organic YoY
4% reported YoY
84.4
Mobile customers(million)
EBITDA margin(%)
EBITDA (USD million)
- 2.1 million YoY
• Service revenue organic increase 2% YoY due to:► Revenue YoY trend recovery in
Pakistan► Continued strong growth in
Bangladesh► Offset by decline in Algeria due to
gap in 3G rollout and increased competition
• EBITDA organic increase of 10% due to:► Revenue increase► Cost efficiency initiatives
• Continued strong EBITDA margin of 44.3%
• Mobile data growth 94% YoY in 3Q15
• Mobile customers decreased mainly due to impact of regulation in Pakistan, requiring operators to block unverified SIMs in 1H15; excluding this mobile customers increased by 3.5 million YoY
1 Revenue organic growth are non-GAAP financial measures that exclude the effect of foreign currency translation and certain items such as liquidations and disposals
Investor Presentation © Global Telecom Holding S.A.E. 2015
31
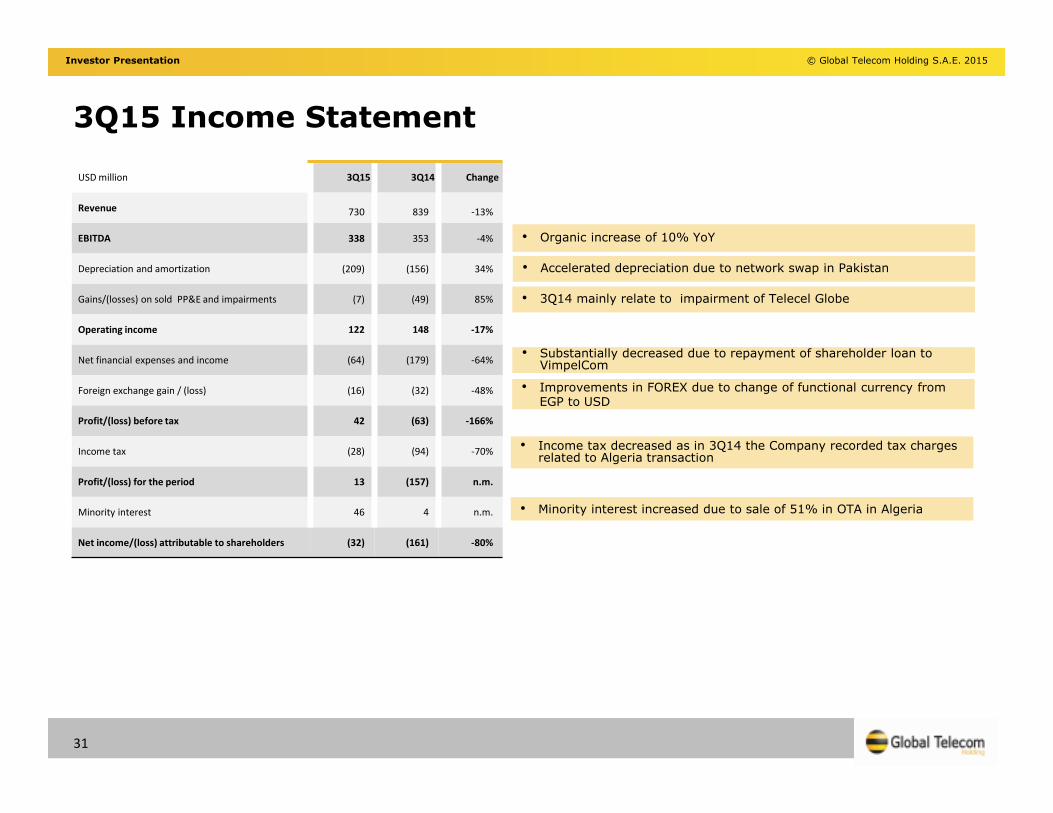
3Q15 Income Statement
• Organic increase of 10% YoY
• Substantially decreased due to repayment of shareholder loan to VimpelCom
• Improvements in FOREX due to change of functional currency from EGP to USD
• Income tax decreased as in 3Q14 the Company recorded tax charges related to Algeria transaction
• Minority interest increased due to sale of 51% in OTA in Algeria
USD million 3Q15 3Q14 Change
Revenue 730 839 -13%
EBITDA 338 353 -4%
Depreciation and amortization (209) (156) 34%
Gains/(losses) on sold PP&E and impairments (7) (49) 85%
Operating income 122 148 -17%
Net financial expenses and income (64) (179) -64%
Foreign exchange gain / (loss) (16) (32) -48%
Profit/(loss) before tax 42 (63) -166%
Income tax (28) (94) -70%
Profit/(loss) for the period 13 (157) n.m.
Minority interest 46 4 n.m.
Net income/(loss) attributable to shareholders (32) (161) -80%
• Accelerated depreciation due to network swap in Pakistan
• 3Q14 mainly relate to impairment of Telecel Globe
Investor Presentation © Global Telecom Holding S.A.E. 2015
32
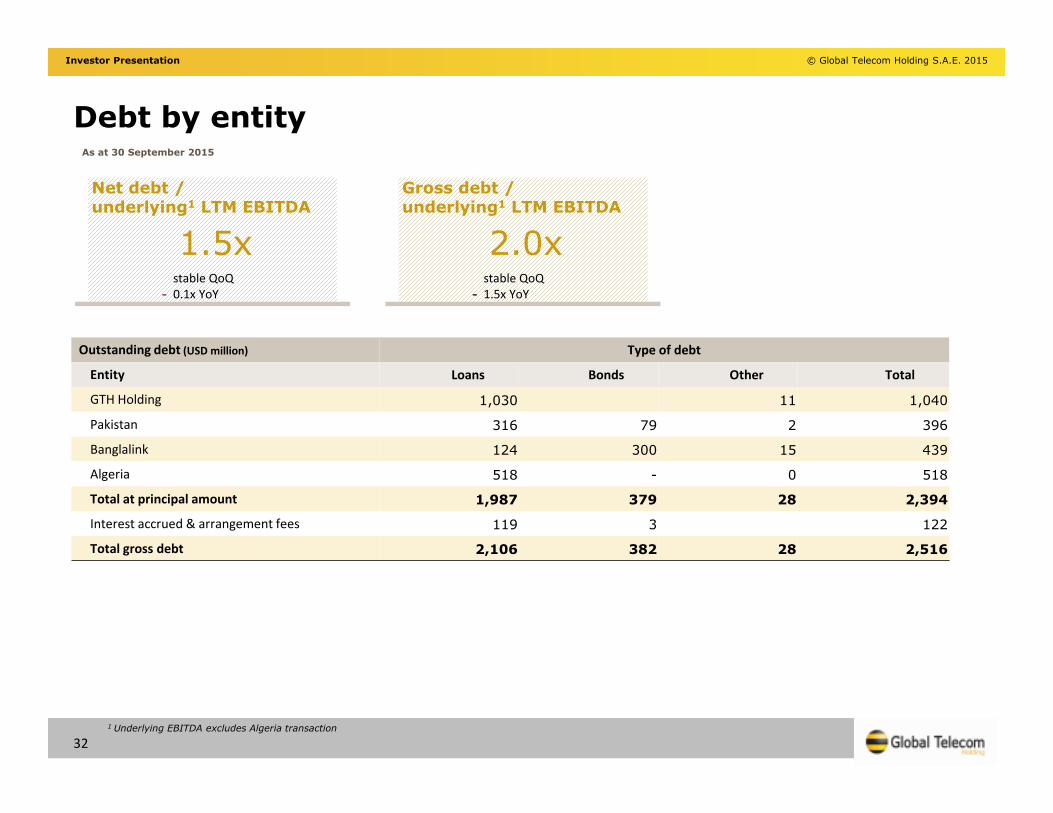
Debt by entity
Outstanding debt (USD million) Type of debt
Entity Loans Bonds Other Total
GTH Holding 1,030 11 1,040
Pakistan 316 79 2 396
Banglalink 124 300 15 439
Algeria 518 - 0 518
Total at principal amount 1,987 379 28 2,394
Interest accrued & arrangement fees 119 3 122
Total gross debt 2,106 382 28 2,516
1.5x
-
stable QoQ
0.1x YoY
Net debt / underlying1 LTM EBITDA
2.0x
-
stable QoQ
1.5x YoY
Gross debt / underlying1 LTM EBITDA
1 Underlying EBITDA excludes Algeria transaction
As at 30 September 2015
Investor Presentation © Global Telecom Holding S.A.E. 2015
For your inquiries, please contact:
Ola TayelInvestor Relations Manager
E: [email protected]: +202 2461 5120F: +202 2461 5055/54W: www.gtelecom.com
33
Contacts