investor presentation november 2015 - singapore exchange · investor presentation november 2015 . 2...
TRANSCRIPT

Investor Presentation
November 2015

2
Important Notice
This presentation shall be read in conjunction with Mapletree Industrial Trust’s (“MIT”) financial results for Second Quarter
Financial Year 2015/2016 in the SGXNET announcement dated 20 October 2015.
This presentation is for information only and does not constitute an offer or solicitation of an offer to sell or invitation to
subscribe for or acquire any units in Mapletree Industrial Trust (“Units”).
The past performance of the Units and MIT is not indicative of the future performance of MIT or Mapletree Industrial Trust
Management Ltd. (the “Manager”).
The value of Units and the income from them may rise or fall. Units are not obligations of, deposits in or guaranteed by the
Manager or any of its affiliates. An investment in Units is subject to investment risks, including the possible loss of the
principal amount invested. Investors have no right to request the Manager to redeem their Units while the Units are listed. It is
intended that unitholders may only deal in their Units through trading on the Singapore Exchange Securities Trading Limited
(“SGX-ST”). Listing of the Units on the SGX-ST does not guarantee a liquid market for the Units.
This presentation may also contain forward-looking statements that involve risks and uncertainties. Actual future
performance, outcomes and results may differ materially from those expressed in forward-looking statements as a result of
risks, uncertainties and assumptions. Representative examples of these factors include general industry and economic
conditions, interest rate trends, cost of capital, occupancy rate, construction and development risks, changes in operating
expenses (including employees wages, benefits and training costs), governmental and public policy changes and the
continued availability of financing. You are cautioned not to place undue reliance on these forward-looking statements, which
are based on current view of management on future events.
Nothing in this presentation should be construed as financial, investment, business, legal or tax advice and you should
consult your own independent professional advisors.

3
Contents
1 Overview of Mapletree Industrial Trust
2 Portfolio Highlights
3 2Q & 1HFY15/16 Financial Performance
4 Outlook and Strategy

OVERVIEW OF
MAPLETREE INDUSTRIAL TRUST
Hi-Tech Building,
Build-to-Suit Data Centre for Equinix

5
Overview of Mapletree Industrial Trust
Sponsor
Mapletree Investments Pte Ltd (“MIPL”)
Owns 33.2% of MIT
Investment
mandate
Focused on industrial real estate assets in Singapore, excluding properties primarily used for logistics purposes
Portfolio
84 properties valued at S$3.4 billion
19.7 million sq ft GFA
14.8 million sq ft NLA
Manager
Mapletree Industrial Trust Management Ltd.
100% owned by the Sponsor
Property
Manager
Mapletree Facilities Services Pte. Ltd.
100% owned by the Sponsor
Trustee DBS Trustee Limited
Public & Inst
Unitholders MIPL
Manager
Property
Manager
33.2% 66.8%
MIT Portfolio
Trustee
As at 31 Mar 2015
Flatted Factories
44.7%
Hi-Tech Buildings
23.5%
Business Park Buildings
16.1%
Stack-up/Ramp-up Buildings
12.9%
Light Industrial Buildings
2.8%
S$3.4 billion
Portfolio Value

6
Broad Spectrum of Industrial Facilities
FLATTED FACTORIES
High-rise multi-tenanted industrial buildings
with basic common facilities used for light
manufacturing activities.
HI-TECH BUILDINGS
High specification industrial space with higher
office content for tenants in technology and
knowledge-intensive sectors. Usually fitted
with air-conditioned lift lobbies and common
areas.
BUSINESS PARK BUILDINGS
Multi-storey suburban office buildings in
specially designated “Business Park zones”.
Serve as regional headquarters for MNCs as
well as space for R&D and knowledge-
intensive enterprises.
STACK-UP/RAMP-UP
BUILDINGS
Stacked-up factory space with vehicular
access to upper floors. Multi-tenanted space
suitable for manufacturing and assembly
activities.
LIGHT INDUSTRIAL
BUILDINGS
Multi-storey developments usually
occupied by an anchor tenant for light
manufacturing activities.
7
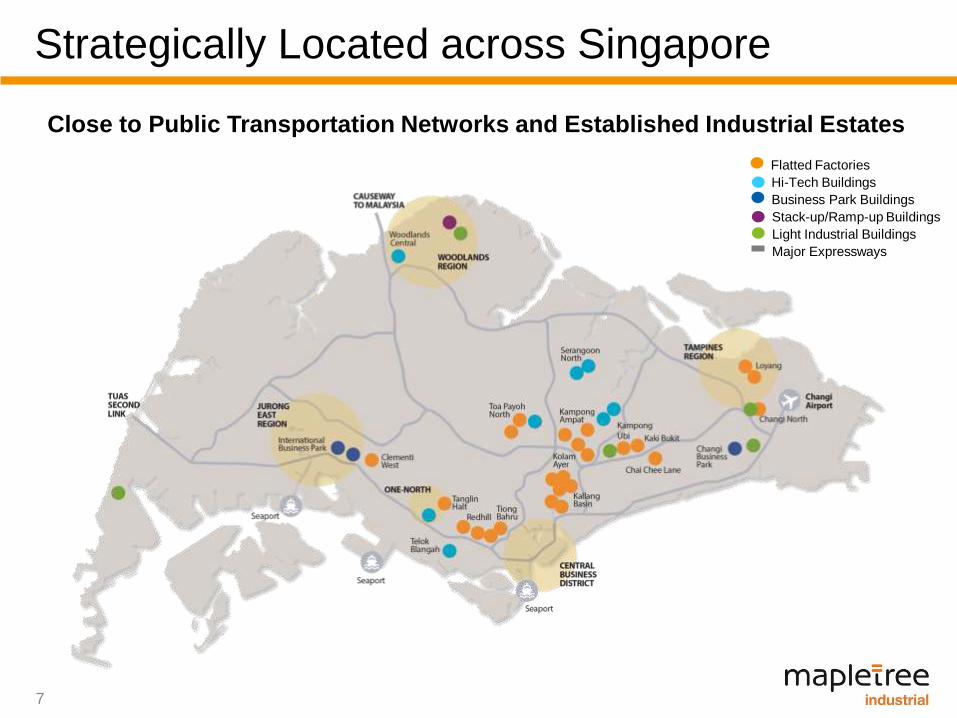
Strategically Located across Singapore
Close to Public Transportation Networks and Established Industrial Estates
Hi-Tech Buildings
Flatted Factories
Business Park Buildings
Stack-up/Ramp-up Buildings
Light Industrial Buildings
Major Expressways

8
22.3
28.3 29.0
31.6
35.2 35.8 36.9 37.5 37.7
38.9 40.2 41.1
42.2 42.6 42.8
45.4 46.0 46.7 48.2 48.9
1.52
1.93 1.98
2.05 2.16
2.22 2.26 2.29 2.32 2.37
2.43 2.47 2.51 2.51 2.51 2.60
2.67 2.65 2.73
2.79
0.00
0.50
1.00
1.50
2.00
2.50
3.00
0
10
20
30
40
50
60
3Q¹ 4Q 1Q 2Q 3Q 4Q 1Q 2Q 3Q 4Q 1Q 2Q 3Q 4Q 1Q 2Q 3Q 4Q 1Q 2Q
FY10/11 FY11/12 FY12/13 FY13/14 FY14/15 FY15/16
DPU (cents) Distributable Income (S$ million)
Distributable Income (S$ million) DPU (cents)
Sustainable and Growing Returns
¹ MIT was listed on 21 Oct 2010.

9
MIT Unit Price +62.9%
FTSE Straits Times Index -4.8%
FTSE ST REITs Index+6.2%
60%
80%
100%
120%
140%
160%
180%
200%
Oct 10 Oct 11 Oct 12 Oct 13 Oct 14 Oct 15
Rebased MIT Unit Price Rebased FTSE Straits Times Index Rebased FTSE ST REITs Index
Comparative Trading Performance since IPO¹
RETURN ON INVESTMENT (FROM LISTING DATE TO 30 SEP 2015)
Total Return 113.4%¹
Capital Appreciation 62.9%
Distribution Yield 50.5%
¹ Rebased MIT’s issue price of S$0.93 and opening unit prices of FTSE ST REITs Index and
FTSE Straits Times Index on 21 October 2010 to 100.
Source: Bloomberg

10
2013 TOP for AEI at
Toa Payoh
North 1 Cluster
(S$40 million)
Redevelopment of
the Telok Blangah
Cluster into a
build-to-suit (BTS)
facility for Hewlett-
Packard
(S$226 million)
Significant Events 2011
Jul
Acquired tranche 2
of JTC
Corporation’s
Second Phase
Divestment
Exercise Portfolio
(S$400 million)
S$176.9 million
Equity Fund
Raising Exercise
S$125 million
7-year Fixed Rate
Notes (Maiden
Issuance)
S$45 million
10-year Fixed
Rate Notes
Implemented
Distribution
Reinvestment
Plan (DRP)
Mar Sep Jan
TOP and BCA-
IDA Green Mark
Platinum Award
(New Data
Centres) for data
centre for Equinix
(S$108 million)
Temporary
Occupation
Permit (TOP)
for asset
enhancement
initiative (AEI)
at Woodlands
Central Cluster
(S$30 million)
Jul
TOP and BCA
Green Mark Gold
Award (Buildings)
for K&S
Corporate
Headquarters
(S$50 million)
Acquired Light
Industrial Building
at Changi North
(S$14 million)
S$75 million
8-year Fixed Rate
Notes
Oct
2014
Jan Mar May
2015
Jan May Oct
New AEI at
Kallang Basin 4
Cluster
(S$77 million)
2013
2012
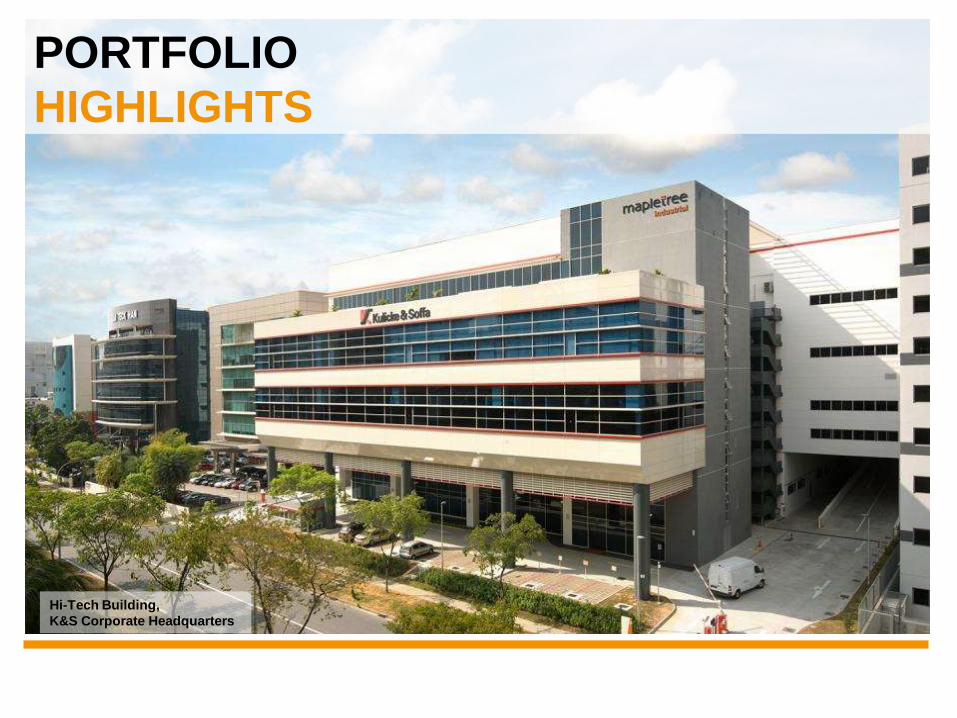
PORTFOLIO
HIGHLIGHTS
Hi-Tech Building,
K&S Corporate Headquarters

12
92.3% 93.2% 94.3% 94.5% 95.1% 95.0% 94.9% 95.0% 95.2% 95.4% 95.5%
93.9% 92.5%
91.3% 90.7% 91.5% 90.8% 90.2%
93.5% 93.8%
$1.45 $1.49
$1.52 $1.54 $1.53 $1.55 $1.56 $1.59 $1.61
$1.68 $1.71 $1.70
$1.73 $1.75 $1.77 $1.82 $1.83 $1.84
$1.86 $1.88
$0.00
$0.50
$1.00
$1.50
$2.00
0%
10%
20%
30%
40%
50%
60%
70%
80%
90%
100%
3Q 4Q 1Q 2Q 3Q 4Q 1Q 2Q 3Q 4Q 1Q 2Q 3Q 4Q 1Q 2Q 3Q 4Q 1Q 2Q
FY10/11 FY11/12 FY12/13 FY13/14 FY14/15 FY15/16
Occupancy (LHS) Rental Rate (RHS)
Resilient Portfolio Performance
Occupancy Gross Rental Rate
S$ psf/mth

13
94.4% 89.2%
86.2%
96.5% 100.0%
93.5% 94.6% 90.5% 89.0%
95.0% 100.0%
93.8%
Flatted Factories Hi-Tech Buildings Business ParkBuildings
Stack-Up/Ramp-UpBuildings
Light IndustrialBuildings
MITPortfolio
Left Bar(1QFY15/16)
Right Bar(2QFY15/16)
Segmental Occupancy Levels
14
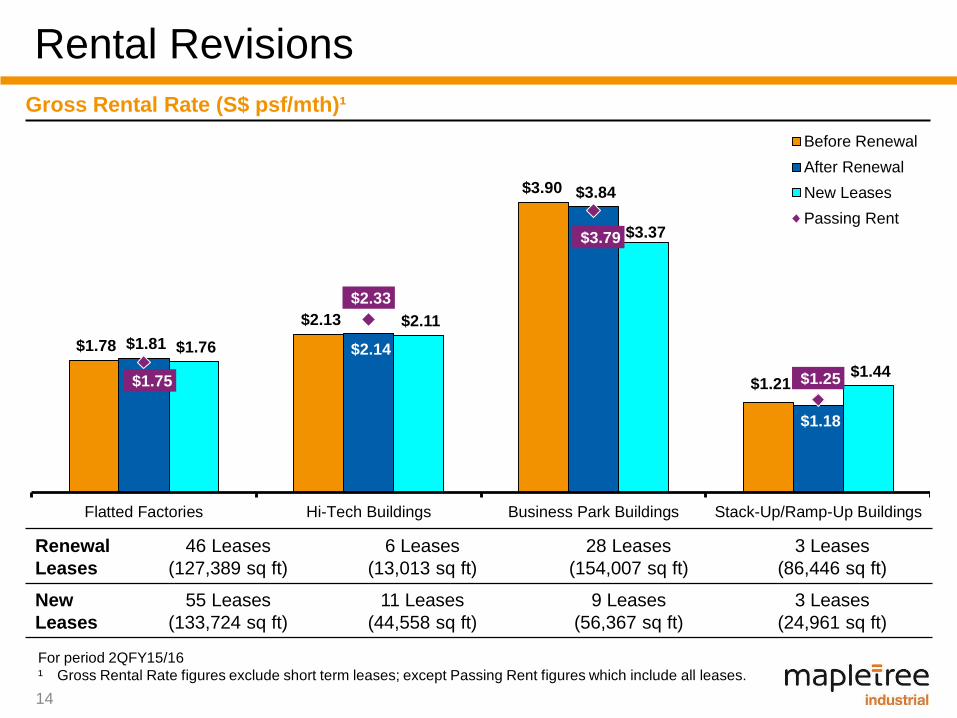
Rental Revisions
For period 2QFY15/16
¹ Gross Rental Rate figures exclude short term leases; except Passing Rent figures which include all leases.
Gross Rental Rate (S$ psf/mth)¹
Renewal
Leases
46 Leases
(127,389 sq ft)
6 Leases
(13,013 sq ft)
28 Leases
(154,007 sq ft)
3 Leases
(86,446 sq ft)
New
Leases
55 Leases
(133,724 sq ft)
11 Leases
(44,558 sq ft)
9 Leases
(56,367 sq ft)
3 Leases
(24,961 sq ft)
$1.78
$2.13
$3.90
$1.21
$1.81 $2.14
$3.84
$1.18
$1.76
$2.11
$3.37
$1.44 $1.75
$2.33
$3.79
$1.25
Flatted Factories Hi-Tech Buildings Business Park Buildings Stack-Up/Ramp-Up Buildings
Before Renewal
After Renewal
New Leases
Passing Rent

15
>1 yr 8.9%
>1 to 2 yrs 12.3%
> 2 to 3 yrs 11.7%
>3 to 4 yrs 7.8%
>4 to 5 yrs 12.0%
>5 to 10 yrs 31.6%
>10 yrs 15.7%
4 yrs or less,
40.7% More than
4 yrs, 59.3%
Healthy Tenant Retention
RETENTION RATE FOR 2QFY15/16
Based on NLA.
N.A. - Not applicable as no leases were due for renewal.
LONG STAYING TENANTS
As at 30 Sep 2015
By number of tenants.
59.3% of the tenants have leased the properties for more than 4 years
Tenant retention rate of 70.3% in 2QFY15/16
66.5%
45.1%
91.3%
55.5%
N.A.
70.3%
FlattedFactories
Hi-TechBuildings
BusinessPark
Buildings
Stack-Up /Ramp-UpBuildings
LightIndustrialBuildings
Portfolio

16
5.5%
23.1%
31.6%
20.5% 19.3%
FY15/16 FY16/17 FY17/18 FY18/19 FY19/20 & Beyond
Flatted Factories Hi-Tech Buildings Business ParkBuildings
Stack-up / Ramp-upBuildings
Light IndustrialBuildings
Lease Expiry Profile
EXPIRING LEASES BY GROSS RENTAL INCOME (%)
Portfolio WALE by Gross Rental Income = 3.1 years As at 30 Sep 2015

17
3.2%
2.6%
2.3%
1.8% 1.6%
1.4% 1.3% 1.1% 1.1%
0.8%
Large and Diversified Tenant Base
TOP 10 TENANTS (BY GROSS RENTAL INCOME)
Over 2,000 tenants
Largest tenant contributes <4% of Portfolio’s Gross Rental Income
Top 10 tenants forms only 17.2% of Portfolio’s Gross Rental Income
As at 30 Sep 2015

18
Tenant Diversification Across Trade Sectors
No single trade sector accounted >16% of Portfolio’s Gross Rental Income
By Gross Rental Income
As at 30 Sep 2015

19
New AEI – Kallang Basin 4 Cluster
Location 26, 26A, 28 and 30 Kallang Place
Existing GFA About 573,000 sq ft
Additional GFA About 317,000 sq ft
Land tenure 33 years (from 1 July 2008)
Expected cost S$77 million
Proposed AEI¹ New 11-storey Hi-Tech Building (at existing open car park)
Improvement works at existing buildings including the upgrading of
lobbies, lifts and toilets
Completion Date Planned for Fourth Quarter 2017
Artist’s impression of new Hi-Tech Building
¹ The proposed development is subject to approvals from the authorities.

20
Strategic Location and Easy Accessibility
Located at Kallang iPark, an upcoming
industrial hub for high value-add and
knowledge-based businesses
Well-served by major expressways with
convenient access to established
amenities in the vicinity
Near to Boon Keng MRT station and
upcoming Bendemeer MRT station
Development of new Hi-Tech Building at
existing open car park
Maps powered by Streetdirectory.com

21
Artist’s impression of completed development
BTS – Hewlett-Packard
Secured largest BTS project at S$226 million¹ with 100% commitment by
Hewlett-Packard
Income stability from lease term of 10.5² + 5 + 5 years with annual rental escalations
Phase 1 and Phase 2 are slated for completion in 2H2016 and 1H2017 respectively
Land tenure of 60 years (from 1 Jul 2008)
¹ Includes book value of S$56 million (as at 31 Mar 2014) for existing Telok Blangah Cluster.
² Includes a rent-free period of six months.
Property GFA Plot Ratio
Before Two 7-storey Flatted
Factories and a canteen 437,300 sq ft 1.3
After
Redevelopment Two Hi-Tech Buildings 824,500 sq ft 2.5
Completed foundation works

22
Leading Asia-focused real estate and
capital management company
Owns and manages S$28.4 billion1 of
office, logistics, industrial, residential and
retail/lifestyle properties
Manages 4 Singapore-listed real estate
investment trusts and 6 private equity real
estate funds with assets in Singapore and
across Asia
Operates out of 7 countries in Asia, with
assets in Australia, Europe and USA
Committed Sponsor with Aligned Interest
1. Leverage on Sponsor’s network
Leverage on Mapletree’s financial strength,
market reach and network
2. Alignment of Sponsor’s interest with
Unitholders
Mapletree’s stake of 33.2% demonstrates
support in MIT
3. In-house development capabilities
Able to support growth of MIT by providing
development capabilities
4. Right of First Refusal to MIT
Sponsor has granted right of first refusal to
MIT over future sale or acquisition of
industrial or business park properties in
Singapore²
Sponsor won the government tender for a
126,700 sq ft industrial site located next to
Tai Seng MRT Station
REPUTABLE SPONSOR BENEFITS TO MIT
¹ As at 31 Mar 2015
² Excluding Mapletree Business City.

Flatted Factory,
Kallang Basin 4 Cluster
2Q & 1HFY15/16
FINANCIAL PERFORMANCE

24
Robust results driven by year-on-year higher occupancies, stable rental
rates and contribution from BTS data centre for Equinix
2QFY15/16 Distributable Income: S$48.9 million ( 7.7% y-o-y)
2QFY15/16 DPU: 2.79 cents ( 7.3% y-o-y)
New AEI to grow Hi-Tech Buildings segment
S$77 million AEI at Kallang Basin 4 Cluster to be completed in the fourth
quarter of 2017
Development of a new 11-storey Hi-Tech Building at existing open car park
space and improvement works at existing buildings
Stable operational performance
Higher average portfolio occupancy of 93.8% and portfolio passing rental
rate of S$1.88 psf/mth
Only 5.5% of leases (by revenue) remain due for renewal in FY15/16
Prudent capital management
Hedged borrowings of 80% to minimise impact of interest rate volatility on
distributions
2Q & 1HFY15/16 Results Highlights
25
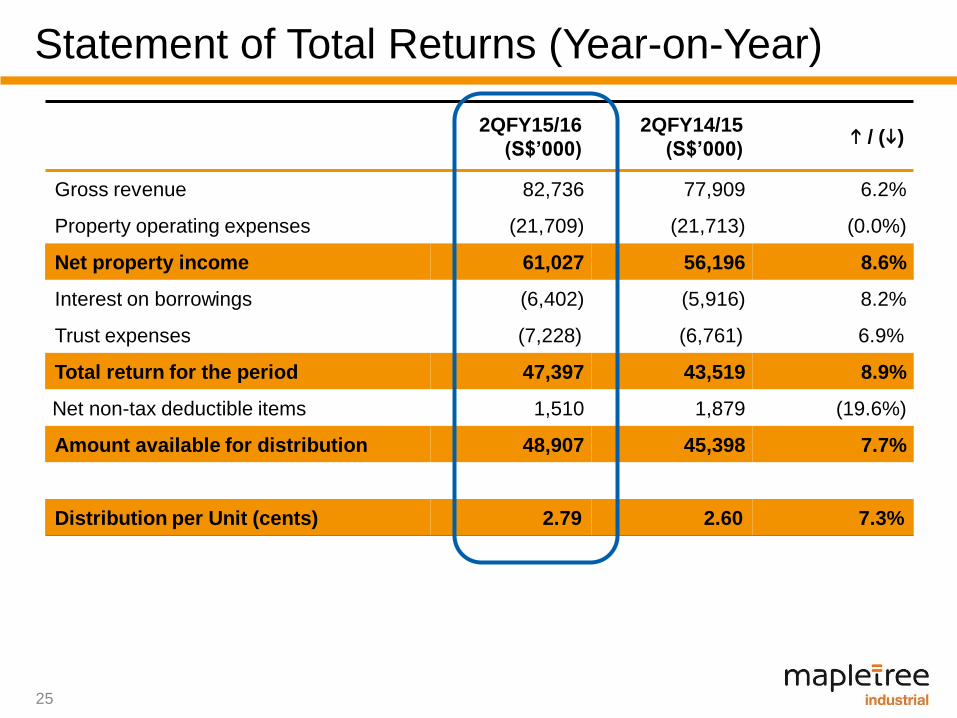
Statement of Total Returns (Year-on-Year)
2QFY15/16
(S$’000)
2QFY14/15
(S$’000) / ()
Gross revenue 82,736 77,909 6.2%
Property operating expenses (21,709) (21,713) (0.0%)
Net property income 61,027 56,196 8.6%
Interest on borrowings (6,402) (5,916) 8.2%
Trust expenses (7,228) (6,761) 6.9%
Total return for the period 47,397 43,519 8.9%
Net non-tax deductible items 1,510 1,879 (19.6%)
Amount available for distribution 48,907 45,398 7.7%
Distribution per Unit (cents) 2.79 2.60 7.3%

26
Statement of Total Returns (Year-on-Year)
1HFY15/16
(S$’000)
1HFY14/15
(S$’000) / ()
Gross revenue 164,355 156,334 5.1%
Property operating expenses (43,136) (43,468) (0.8%)
Net property income 121,219 112,866 7.4%
Interest on borrowings (12,847) (11,825) 8.6%
Trust expenses (14,301) (13,340) 7.2%
Total return for the period before tax 94,071 87,701 7.3%
Income tax expense - (1,083)1 N.M.*
Total return for the period after tax 94,071 86,618 8.6%
Net non-tax deductible items 3,068 1,542 99.0%
Amount available for distribution 97,139 88,160 10.2%
Distribution per Unit (cents) 5.52 5.11 8.0%
Footnote:
1 The income tax expense relates mainly to industrial building allowances claimed when MIT was a private trust,
which has been disallowed by by the Inland Revenue Authority of Singapore.
*N.M. – Not meaningful.

27
Statement of Total Returns (Qtr-on-Qtr)
2QFY15/16
(S$’000)
1QFY15/16
(S$’000) / ()
Gross revenue 82,736 81,619 1.4%
Property operating expenses (21,709) (21,427) 1.3%
Net property income 61,027 60,192 1.4%
Interest on borrowings (6,402) (6,445) (0.7%)
Trust expenses (7,228) (7,073) 2.2%
Total return for the period 47,397 46,674 1.5%
Net non-tax deductible items 1,510 1,558 (3.1%)
Amount available for distribution 48,907 48,232 1.4%
Distribution per Unit (cents) 2.79 2.73 2.2%
28
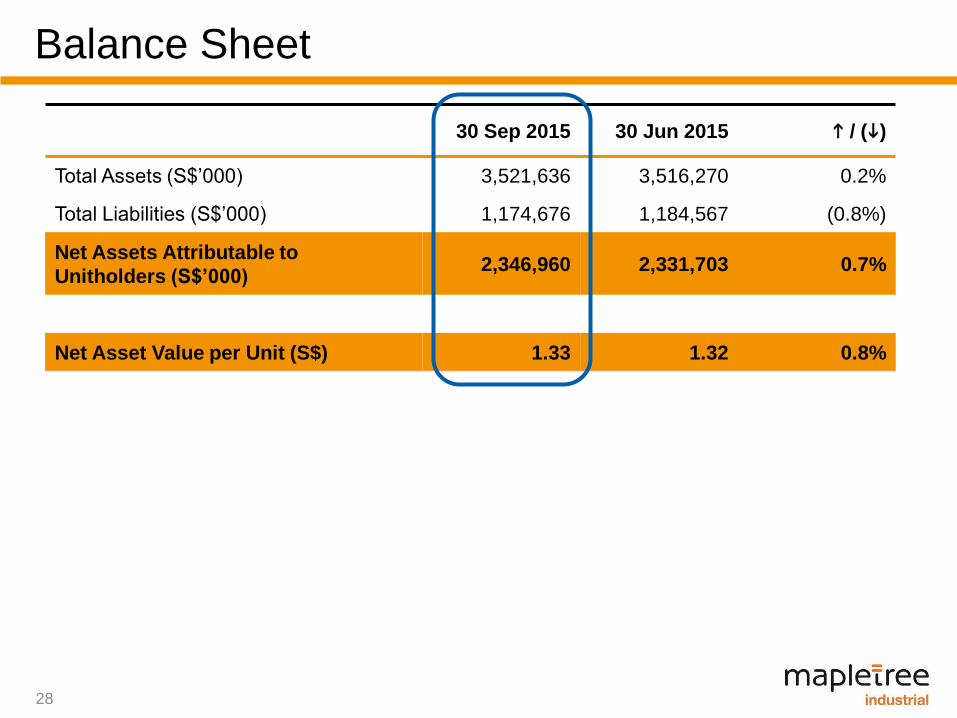
Balance Sheet
30 Sep 2015 30 Jun 2015 / ()
Total Assets (S$’000) 3,521,636 3,516,270 0.2%
Total Liabilities (S$’000) 1,174,676 1,184,567 (0.8%)
Net Assets Attributable to
Unitholders (S$’000) 2,346,960 2,331,703 0.7%
Net Asset Value per Unit (S$) 1.33 1.32 0.8%

29
Strong Balance Sheet
30 Sep 2015 30 Jun 2015
Total Debt S$1,049.7 million S$1,060.5 million
Aggregate
Leverage Ratio 29.7% 30.0%
Fixed as a % of
Total Debt 80% 88%
Weighted Average
Tenor of Debt 3.8 years 4.1 years
Strong balance sheet to
pursue growth opportunities
Proceeds of S$14 million
from DRP in 1QFY15/16
mainly used to repay loans
drawn previously to fund
completed projects
‘BBB+’ rating with Stable
Outlook by Fitch Ratings
100% of loans unsecured
with minimal covenants
2QFY15/16 1QFY15/16
Weighted Average
All-in Funding Cost 2.3% 2.3%
Interest Coverage
Ratio* 8.3 times 8.2 times
* Includes capitalised interest.
30
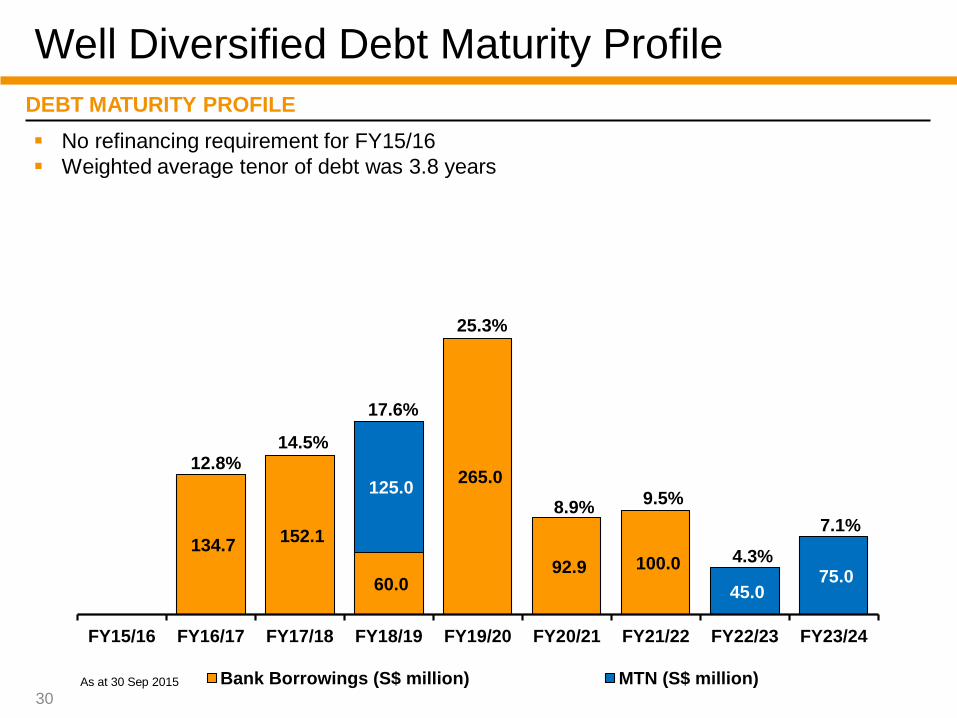
Well Diversified Debt Maturity Profile
DEBT MATURITY PROFILE
As at 30 Sep 2015
No refinancing requirement for FY15/16
Weighted average tenor of debt was 3.8 years
134.7 152.1
60.0
265.0
92.9 100.0
125.0
45.0 75.0
FY15/16 FY16/17 FY17/18 FY18/19 FY19/20 FY20/21 FY21/22 FY22/23 FY23/24
Bank Borrowings (S$ million) MTN (S$ million)
12.8%14.5%
17.6%
25.3%
8.9%
4.3%
9.5%
7.1%

Business Park Buildings,
The Strategy and The Synergy
OUTLOOK AND
STRATEGY

32
Market Outlook
DEMAND AND SUPPLY FOR MULTI-USER FACTORIES DEMAND AND SUPPLY FOR BUSINESS PARKS
The economy grew by 1.4% year-on-year in the quarter ended 30 Sep 2015, easing from the 2.0%
growth in preceding quarter¹
Average rents for industrial real estate for 2QFY15/16²
Multi-user Factory Space: S$1.88 psf/mth (-1.1% q-o-q)
Business Park Space: S$4.11 psf/mth (-1.4% q-o-q)
Rents for prime multi-user conventional industrial space are projected to ease further in 4Q2015, while
business park rents could experience a slight dip. However, rents of independent high-specs industrial
premises could remain stable for the rest of the year on the back of limited supply³
¹ Ministry of Trade and Industry (Advance Estimates), 14 Oct 2015
² URA/JTC Realis, 22 Oct 2015
³ Singapore industrial property market 3Q2015 report by Colliers International Research
94.6%
87.3%
60
65
70
75
80
85
90
95
100
-150
-50
50
150
250
350
450
550
650
2005 2006 2007 2008 2009 2010 2011 2012 2013 2014 3Q2015
Occupancy Rate (%)('000 sq m)
Net New Demand Net New Supply MIT 2QFY15/16 Flatted Factories Occupancy Occupancy Rate
89.0%
84.4%
60
65
70
75
80
85
90
95
100
-50
0
50
100
150
200
250
2005 2006 2007 2008 2009 2010 2011 2012 2013 2014 3Q2015
Occupancy Rate (%)('000 sq m)
Net New Demand Net New Supply MIT 2QFY15/16 Occupancy Rate Occupancy Rate

33
Proactive Asset
Management
Prudent Capital Management
Value-creating
Investment Management
To Deliver Sustainable and Growing Returns
IMPROVE competitiveness
of properties
Implement proactive
marketing and leasing
initiatives
Deliver quality service and
customised solutions
Improve cost effectiveness
to mitigate rising operating
costs
Unlock value through asset
enhancements
OPTIMISE capital structure to
provide financial flexibility
Maintain a strong balance sheet
Diversify sources of funding
Employ appropriate interest rate
management strategies
SECURE investments to
deliver growth and
diversification
Pursue DPU-accretive
acquisitions and
development projects
Secure BTS projects with
pre-commitments from
high-quality tenants
Consider opportunistic
divestments

End of Presentation
For enquiries, please contact Ms Melissa Tan, Vice President, Investor Relations,
DID: (65) 6377 6113, Email: [email protected]