investor presentation november 2017 -...
TRANSCRIPT
November 2017
Security and Intelligence Services (India) Ltd
INVESTOR PRESENTATION

2SAFE HARBOUR
This presentation and the accompanying slides (the “Presentation”), which have been prepared by Security and Intelligence Services (India) Limited(the “Company”), have been prepared solely for information purposes and do not constitute any offer, recommendation or invitation to purchase orsubscribe for any securities, and shall not form the basis or be relied on in connection with any contract or binding commitment whatsoever. Nooffering of securities of the Company will be made except by means of a statutory offering document containing detailed information about theCompany.
This Presentation has been prepared by the Company based on information and data which the Company considers reliable, but the Company makesno representation or warranty, express or implied, whatsoever, and no reliance shall be placed on, the truth, accuracy, completeness, fairness andreasonableness of the contents of this Presentation. This Presentation may not be all inclusive and may not contain all of the information that youmay consider material. Any liability in respect of the contents of, or any omission from, this Presentation is expressly excluded.
This presentation contains certain forward looking statements concerning the Company’s future business prospects and business profitability, whichare subject to a number of risks and uncertainties and the actual results could materially differ from those in such forward looking statements. Therisks and uncertainties relating to these statements include, but are not limited to, risks and uncertainties regarding fluctuations in earnings, ourability to manage growth, competition (both domestic and international), economic growth in India and abroad, ability to attract and retain highlyskilled professionals, time and cost over runs on contracts, our ability to manage our international operations, government policies and actionsregulations, interest and other fiscal costs generally prevailing in the economy. The Company does not undertake to make any announcement in caseany of these forward looking statements become materially incorrect in future or update any forward looking statements made from time to time byor on behalf of the Company.

3
SYSTEMS + CULTUREBUSINESS MODEL BUSINESS VERTICALS FUTURE AGENDA
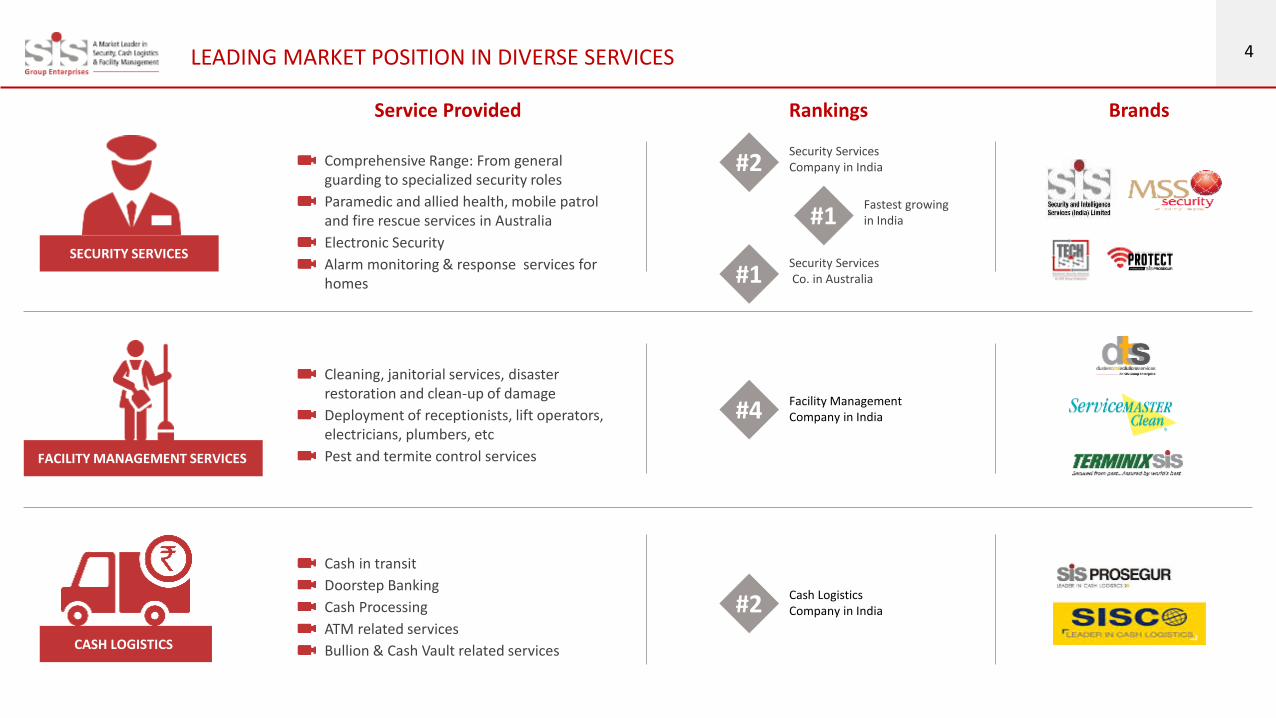
4LEADING MARKET POSITION IN DIVERSE SERVICES
Comprehensive Range: From general guarding to specialized security roles
Paramedic and allied health, mobile patrol and fire rescue services in Australia
Electronic Security
Alarm monitoring & response services for homes
SECURITY SERVICES
Service Provided Rankings Brands
CASH LOGISTICS
Cash in transit
Doorstep Banking
Cash Processing
ATM related services
Bullion & Cash Vault related services
FACILITY MANAGEMENT SERVICES
Cleaning, janitorial services, disaster restoration and clean-up of damage
Deployment of receptionists, lift operators, electricians, plumbers, etc
Pest and termite control services
Security ServicesCompany in India#2
Fastest growingin India#1
Security ServicesCo. in Australia#1
Facility Management Company in India#4
Cash Logistics Company in India#2
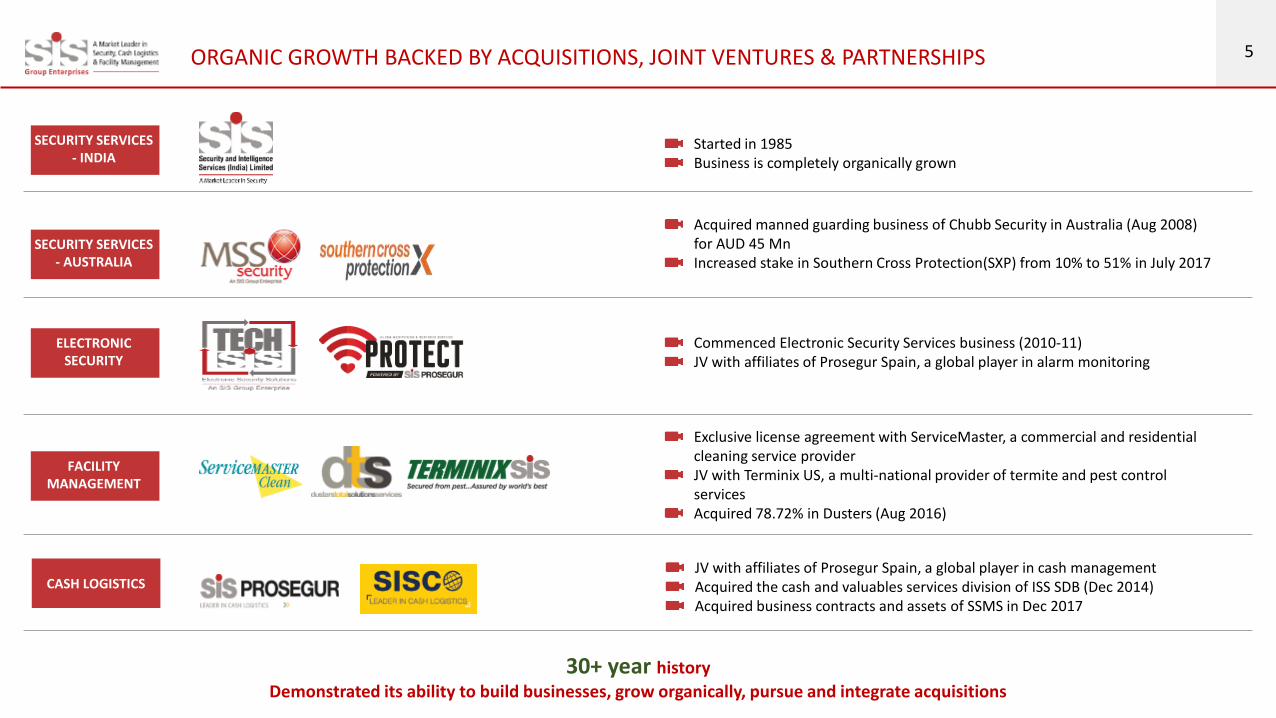
5ORGANIC GROWTH BACKED BY ACQUISITIONS, JOINT VENTURES & PARTNERSHIPS
SECURITY SERVICES - INDIA
SECURITY SERVICES - AUSTRALIA
FACILITY MANAGEMENT
CASH LOGISTICS
ELECTRONIC SECURITY
Started in 1985Business is completely organically grown
Acquired manned guarding business of Chubb Security in Australia (Aug 2008) for AUD 45 MnIncreased stake in Southern Cross Protection(SXP) from 10% to 51% in July 2017
Exclusive license agreement with ServiceMaster, a commercial and residential cleaning service providerJV with Terminix US, a multi-national provider of termite and pest control servicesAcquired 78.72% in Dusters (Aug 2016)
JV with affiliates of Prosegur Spain, a global player in cash managementAcquired the cash and valuables services division of ISS SDB (Dec 2014)Acquired business contracts and assets of SSMS in Dec 2017
Commenced Electronic Security Services business (2010-11)JV with affiliates of Prosegur Spain, a global player in alarm monitoring
30+ year history
Demonstrated its ability to build businesses, grow organically, pursue and integrate acquisitions
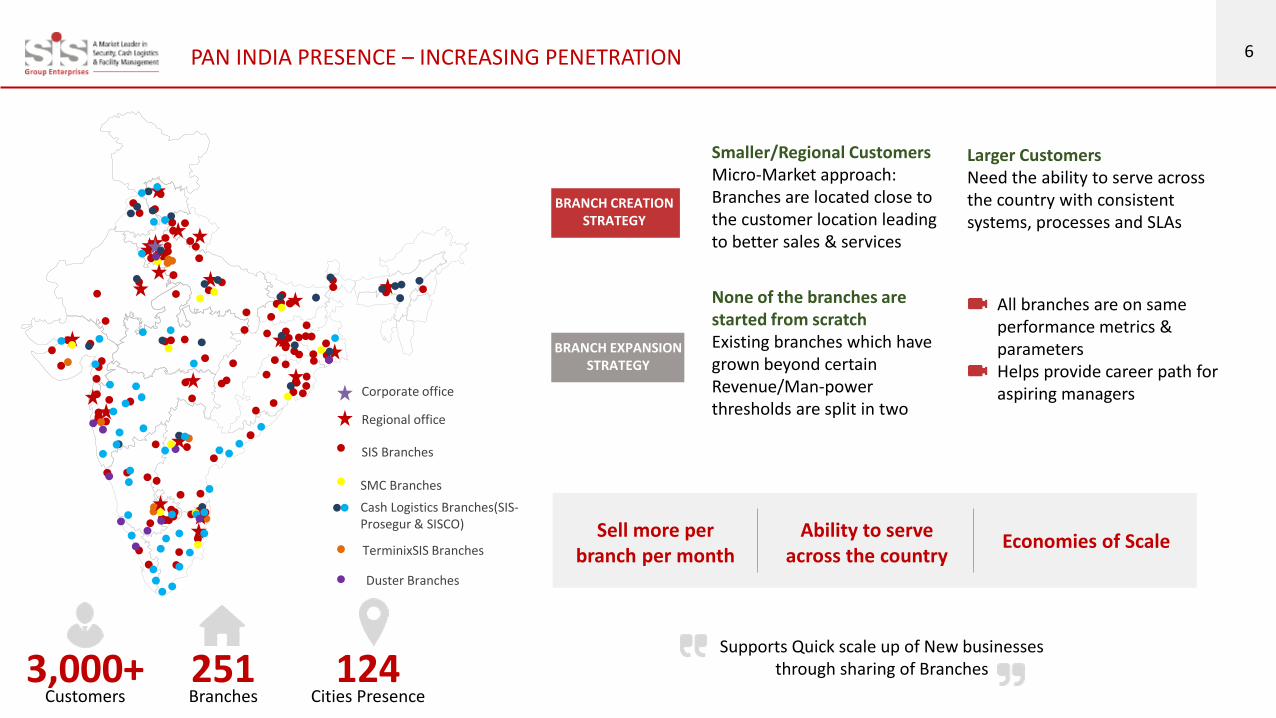
6PAN INDIA PRESENCE – INCREASING PENETRATION
Regional office
Corporate office
SMC Branches
Cash Logistics Branches(SIS-Prosegur & SISCO)
TerminixSIS Branches
Duster Branches
SIS Branches
3,000+Customers
251Branches
124Cities Presence
Smaller/Regional Customers Micro-Market approach: Branches are located close to the customer location leading to better sales & services
None of the branches are started from scratchExisting branches which have grown beyond certain Revenue/Man-power thresholds are split in two
Larger Customers Need the ability to serve across the country with consistent systems, processes and SLAs
All branches are on same performance metrics & parameters Helps provide career path for aspiring managers
BRANCH CREATIONSTRATEGY
BRANCH EXPANSIONSTRATEGY
Supports Quick scale up of New businessesthrough sharing of Branches
Sell more per branch per month
Ability to serve across the country
Economies of Scale

7DIVERSIFIED END USER SEGMENTS
14%
12%
9%
6%
8%6%5%
5%
5%
4%
26%
BFSI IT/ITES Telecom Automobile Steel, Heavy Industries
Government Hospitality & RE Utilities Education
Healthcare FMCG Others
India Security ServicesNo sector contributes >15% to the Revenues
30%
18%
11%
6%
4%
4%
4%
4%
3%
3%
12%
IT/ITES Healthcare Manufacturing BFSI
Government Hotels & Restaurants Retail Commercial / Offices
Education Railways Others
Facility Management Services
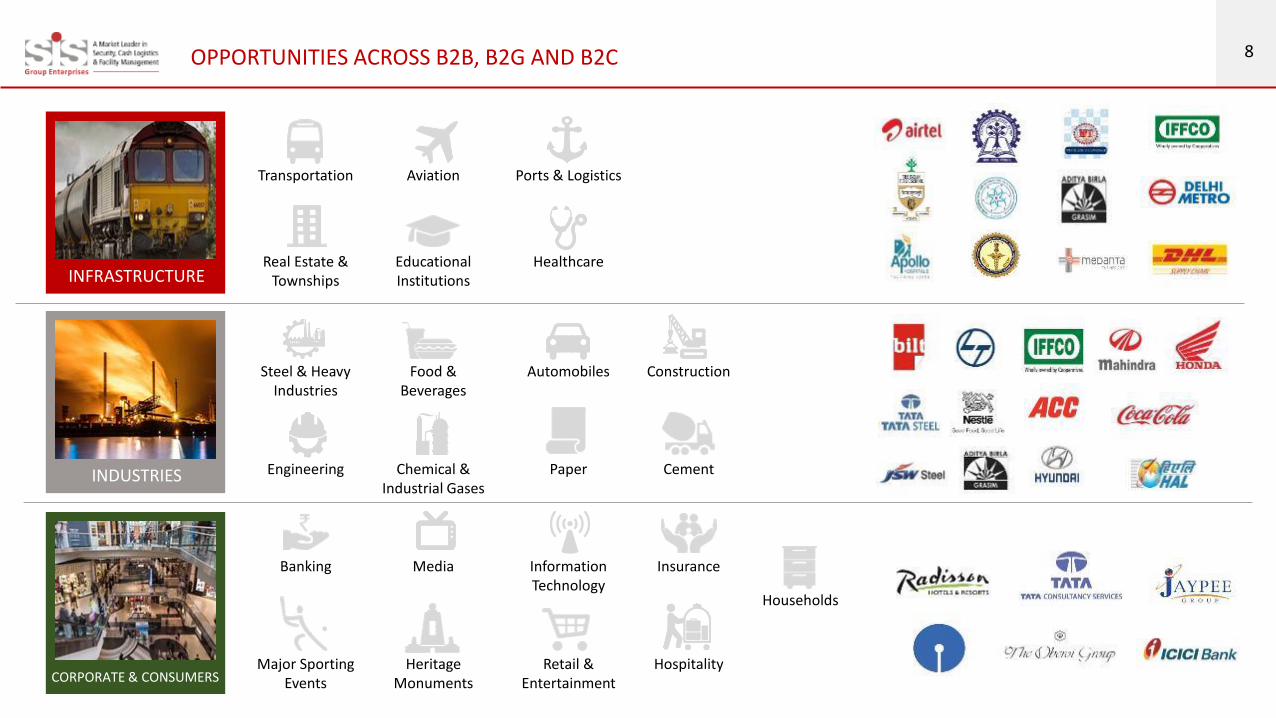
8OPPORTUNITIES ACROSS B2B, B2G AND B2C
INFRASTRUCTURE
Transportation Aviation Ports & Logistics
Real Estate & Townships
Educational Institutions
Healthcare
INDUSTRIES
Steel & Heavy Industries
Food & Beverages
Automobiles
Engineering Chemical & Industrial Gases
Paper
Construction
Cement
CORPORATE & CONSUMERS
Banking Media Information Technology
Major Sporting Events
Heritage Monuments
Retail & Entertainment
Insurance
Hospitality
Households
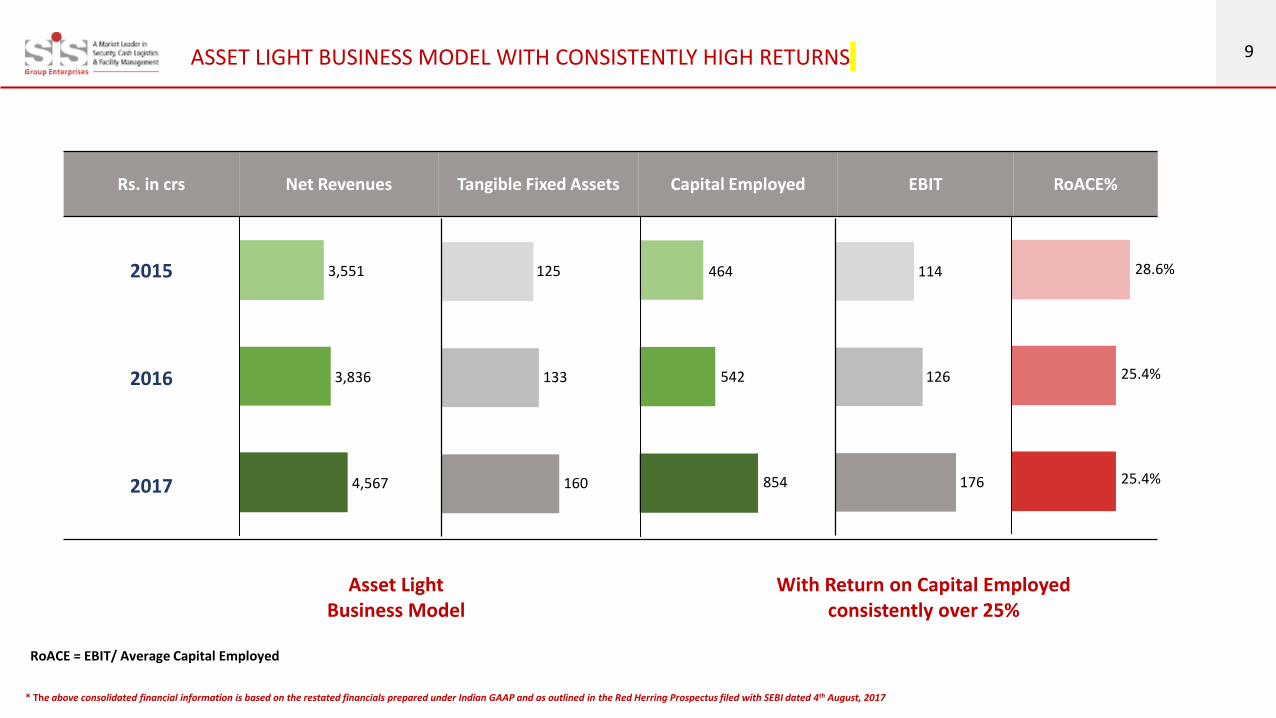
9ASSET LIGHT BUSINESS MODEL WITH CONSISTENTLY HIGH RETURNS
Rs. in crs Net Revenues Tangible Fixed Assets Capital Employed EBIT RoACE%
2015
2016
2017 4,567
3,551
3,836 133
160
125
542
464
854 176
114
126
25.4%
28.6%
25.4%
Asset Light Business Model
With Return on Capital Employed consistently over 25%
RoACE = EBIT/ Average Capital Employed
* The above consolidated financial information is based on the restated financials prepared under Indian GAAP and as outlined in the Red Herring Prospectus filed with SEBI dated 4th August, 2017

10RECESSION RESISTANT NATURE INCREASES REVENUE VISIBILITY
Strong Revenue growth of >30% despite Economic slowdown during FY09 & FY12-14
Revenue retention of more than 90% consistently over last decade
77 109 143198
283
401
567
807
1,035
1,274
1,615
9.3%
9.8%
3.9%
8.5%
10.3%
6.6%
5.5%
6.4%
7.5%
8.0%
7.1%
0.0%
2.0%
4.0%
6.0%
8.0%
10.0%
12.0%
FY07 FY08 FY09 FY10 FY11 FY12 FY13 FY14 FY15 FY16 FY17
0.0
200.0
400.0
600.0
800.0
1,000.0
1,200.0
1,400.0
1,600.0
1,800.0
India Security services Revenue growth India Real GDP growth (RHS)
Rs. in crs
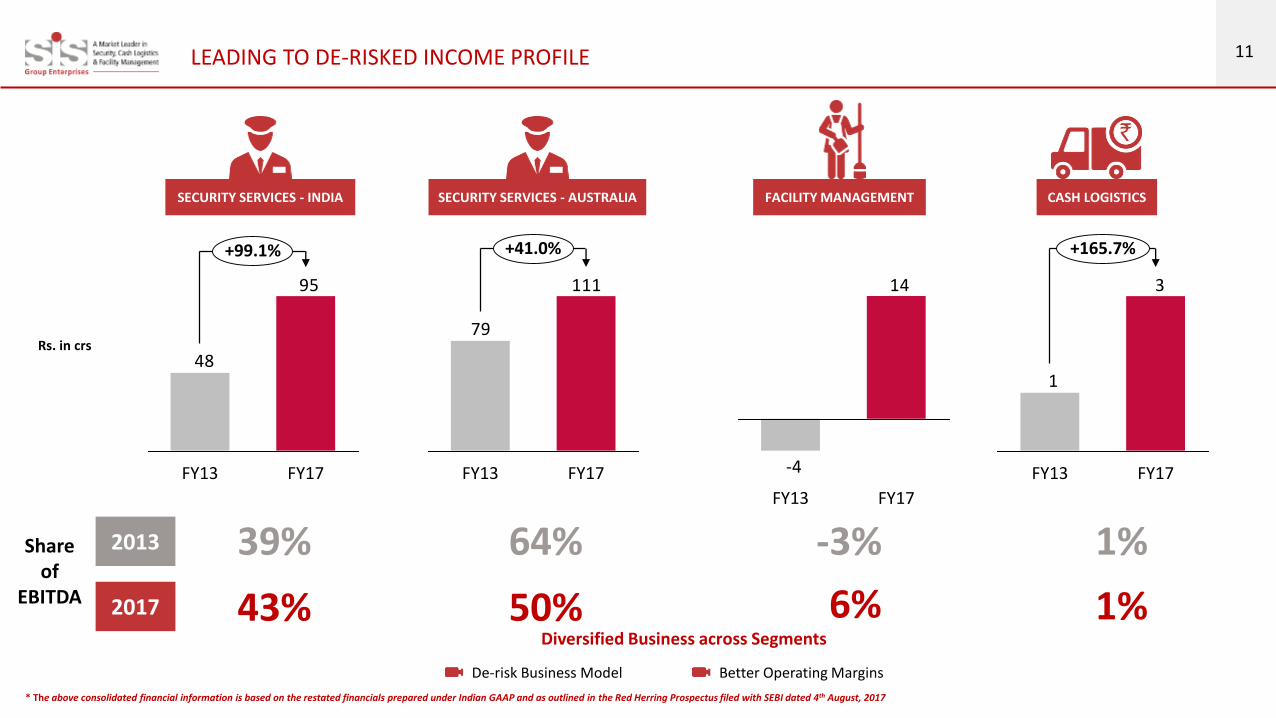
11LEADING TO DE-RISKED INCOME PROFILE
2017 43% 50% 6% 1%
2013 39% 64% -3% 1%
Diversified Business across Segments
De-risk Business Model Better Operating Margins
SECURITY SERVICES - INDIA CASH LOGISTICSFACILITY MANAGEMENTSECURITY SERVICES - AUSTRALIA
Rs. in crs
95
48
+99.1%
FY17FY13
111
79
+41.0%
FY13 FY17
14
-4
FY13 FY17
3
1
+165.7%
FY13 FY17
Share of
EBITDA
* The above consolidated financial information is based on the restated financials prepared under Indian GAAP and as outlined in the Red Herring Prospectus filed with SEBI dated 4th August, 2017
12
SYSTEMS + CULTURE FUTURE AGENDABUSINESS MODEL BUSINESS VERTICALS

13
SecurityServices
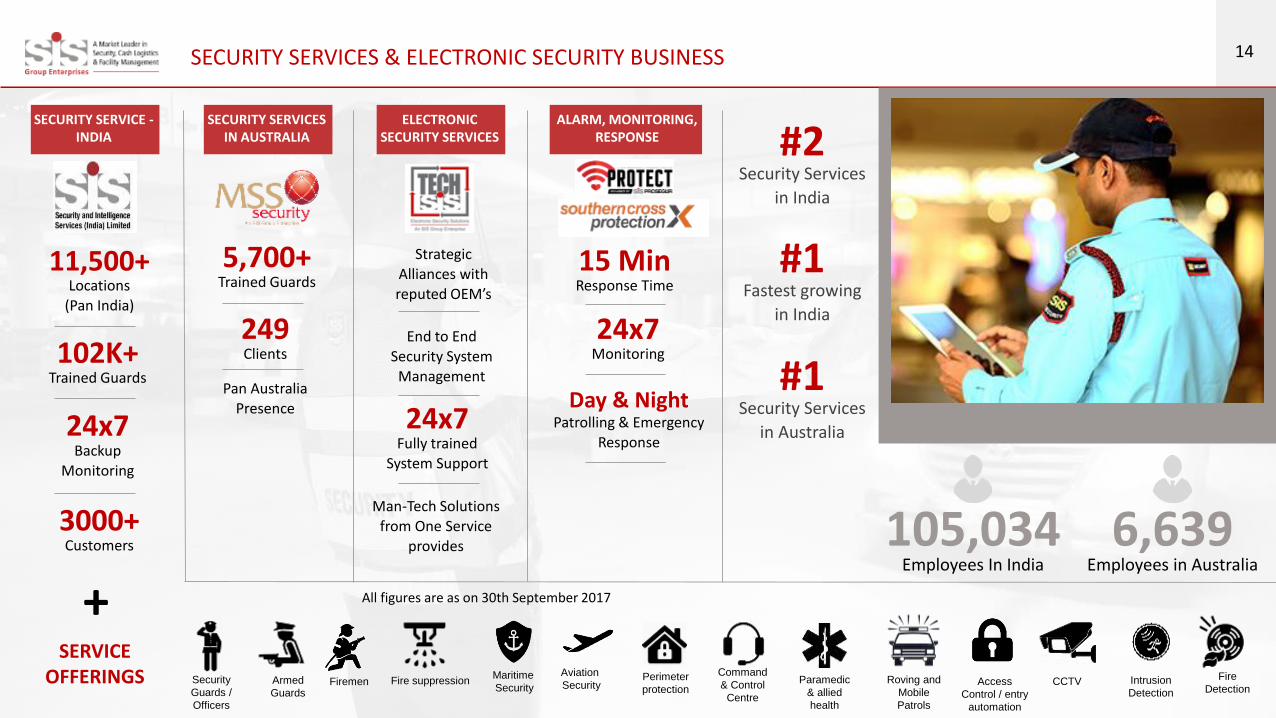
14SECURITY SERVICES & ELECTRONIC SECURITY BUSINESS
SECURITY SERVICE -INDIA
SECURITY SERVICES IN AUSTRALIA
ELECTRONIC SECURITY SERVICES
ALARM, MONITORING, RESPONSE
11,500+Locations
(Pan India)
102K+Trained Guards
24x7Backup
Monitoring
3000+Customers
5,700+Trained Guards
249Clients
Pan Australia Presence
Strategic Alliances with reputed OEM’s
End to End Security System
Management
24x7Fully trained
System Support
Man-Tech Solutions from One Service
provides
15 MinResponse Time
24x7Monitoring
Day & NightPatrolling & Emergency
Response
Security
Guards /
Officers
Armed
GuardsFiremen
Maritime
SecurityFire suppression
Aviation
SecurityPerimeter
protection
Command
& Control
Centre
Paramedic
& allied
health
Roving and
Mobile
Patrols
Access
Control / entry
automation
CCTV Intrusion
Detection
Fire
Detection
SERVICEOFFERINGS
+
105,034Employees In India
6,639Employees in Australia
All figures are as on 30th September 2017
#2Security Services
in India
#1Fastest growing
in India
#1Security Services
in Australia
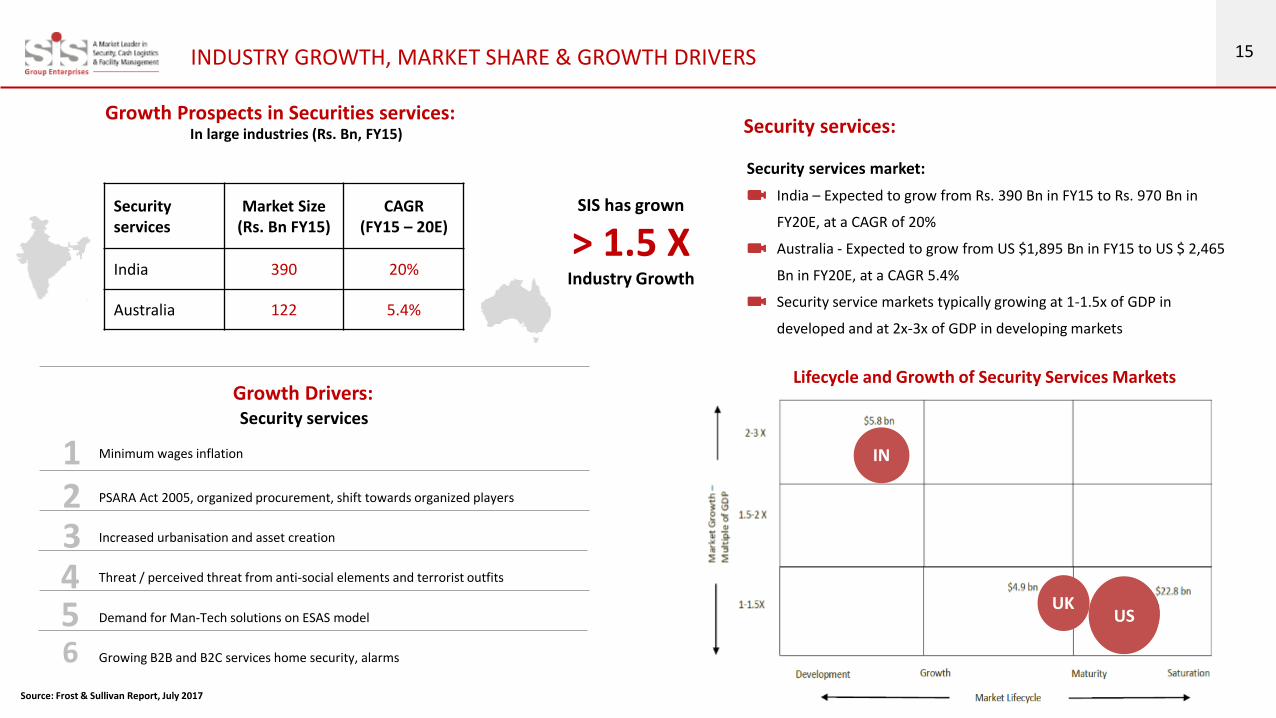
15INDUSTRY GROWTH, MARKET SHARE & GROWTH DRIVERS
Security services market:
India – Expected to grow from Rs. 390 Bn in FY15 to Rs. 970 Bn in
FY20E, at a CAGR of 20%
Australia - Expected to grow from US $1,895 Bn in FY15 to US $ 2,465
Bn in FY20E, at a CAGR 5.4%
Security service markets typically growing at 1-1.5x of GDP in
developed and at 2x-3x of GDP in developing markets
Security services:
Growth Drivers:Security services
Minimum wages inflation1PSARA Act 2005, organized procurement, shift towards organized players2Increased urbanisation and asset creation3Threat / perceived threat from anti-social elements and terrorist outfits4Demand for Man-Tech solutions on ESAS model5Growing B2B and B2C services home security, alarms6
IN
UKUS
Growth Prospects in Securities services:In large industries (Rs. Bn, FY15)
SIS has grown
> 1.5 XIndustry Growth
Lifecycle and Growth of Security Services Markets
Security services
Market Size(Rs. Bn FY15)
CAGR(FY15 – 20E)
India 390 20%
Australia 122 5.4%
Source: Frost & Sullivan Report, July 2017
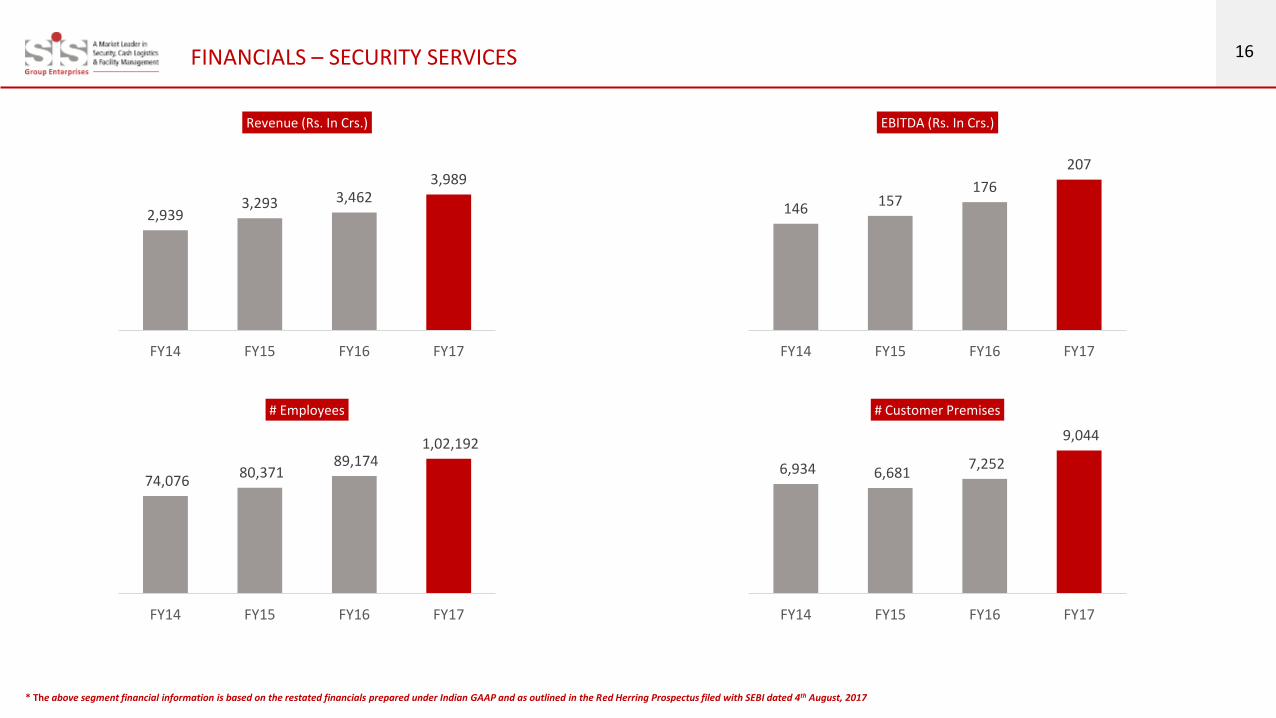
16FINANCIALS – SECURITY SERVICES
2,9393,293 3,462
3,989
FY14 FY15 FY16 FY17
Revenue (Rs. In Crs.)
146 157176
207
FY14 FY15 FY16 FY17
EBITDA (Rs. In Crs.)
74,076 80,371
89,174 1,02,192
FY14 FY15 FY16 FY17
# Employees
6,934 6,681 7,252
9,044
FY14 FY15 FY16 FY17
# Customer Premises
* The above segment financial information is based on the restated financials prepared under Indian GAAP and as outlined in the Red Herring Prospectus filed with SEBI dated 4th August, 2017

17
Facility Management Services
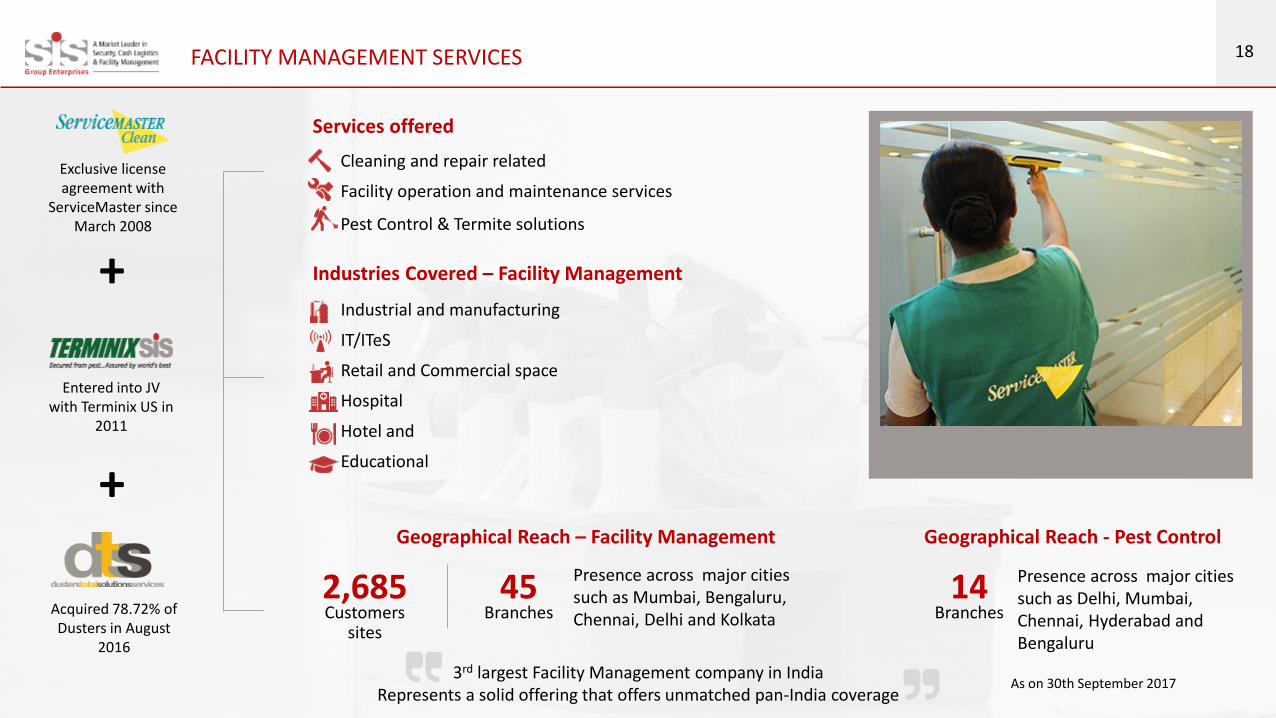
18FACILITY MANAGEMENT SERVICES
Acquired 78.72% of Dusters in August
2016
Exclusive license agreement with
ServiceMaster since March 2008
Entered into JV with Terminix US in
2011
+
+
Presence across major cities such as Mumbai, Bengaluru, Chennai, Delhi and Kolkata
Geographical Reach - Pest ControlGeographical Reach – Facility Management
Presence across major cities such as Delhi, Mumbai, Chennai, Hyderabad and Bengaluru
3rd largest Facility Management company in India Represents a solid offering that offers unmatched pan-India coverage
2,685Customers
sites
45Branches
14Branches
Cleaning and repair related
Facility operation and maintenance services
Pest Control & Termite solutions
Services offered
Industrial and manufacturing
IT/ITeS
Retail and Commercial space
Hospital
Hotel and
Educational
Industries Covered – Facility Management
As on 30th September 2017
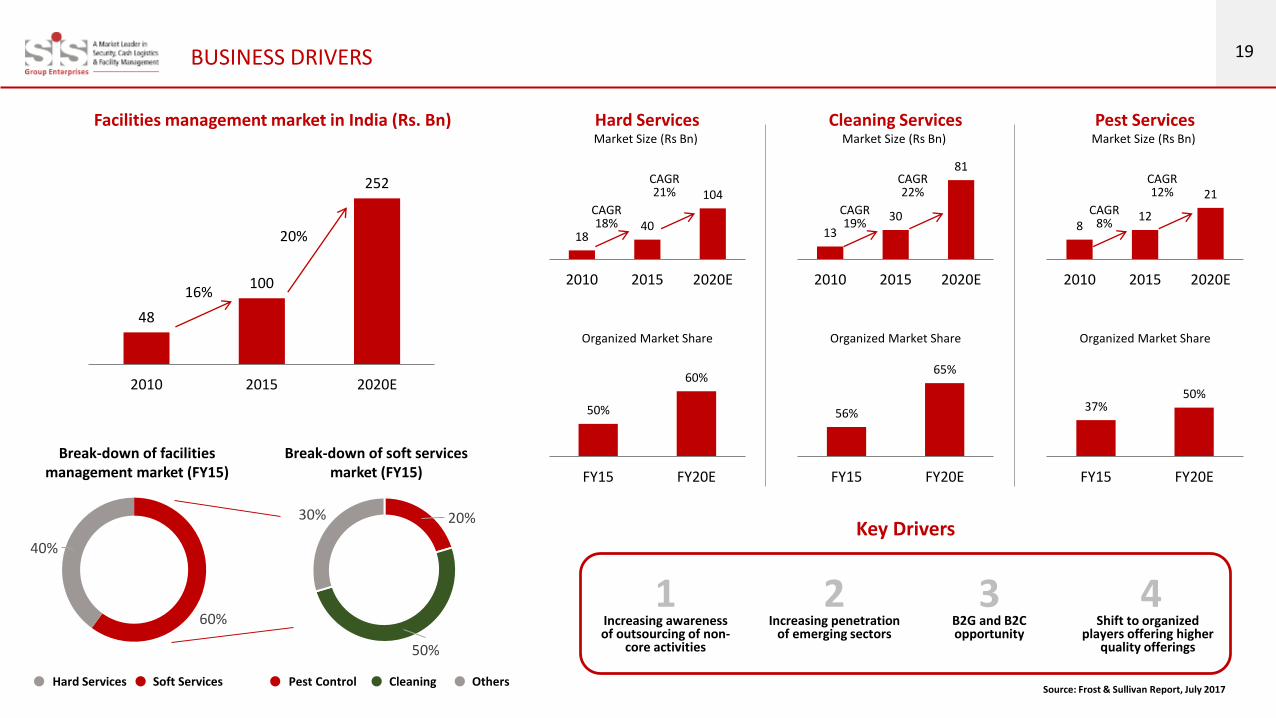
19BUSINESS DRIVERS
48
100
252
2010 2015 2020E
16%
20%
Facilities management market in India (Rs. Bn)
Pest Control Cleaning Others
Break-down of soft services market (FY15)
20%
50%
30%
60%
40%
Break-down of facilities management market (FY15)
Hard Services Soft Services
1840
104
2010 2015 2020E
CAGR18%
CAGR21%
Market Size (Rs Bn)
Hard Services
50%
60%
FY15 FY20E
Organized Market Share
1330
81
2010 2015 2020E
CAGR19%
CAGR22%
Market Size (Rs Bn)
Cleaning Services
56%
65%
FY15 FY20E
Organized Market Share
812
21
2010 2015 2020E
CAGR8%
CAGR12%
Market Size (Rs Bn)
Pest Services
37%50%
FY15 FY20E
Organized Market Share
Source: Frost & Sullivan Report, July 2017
Increasing awareness of outsourcing of non-
core activities
1Increasing penetration
of emerging sectors
2B2G and B2C opportunity
3Shift to organized
players offering higher quality offerings
4
Key Drivers
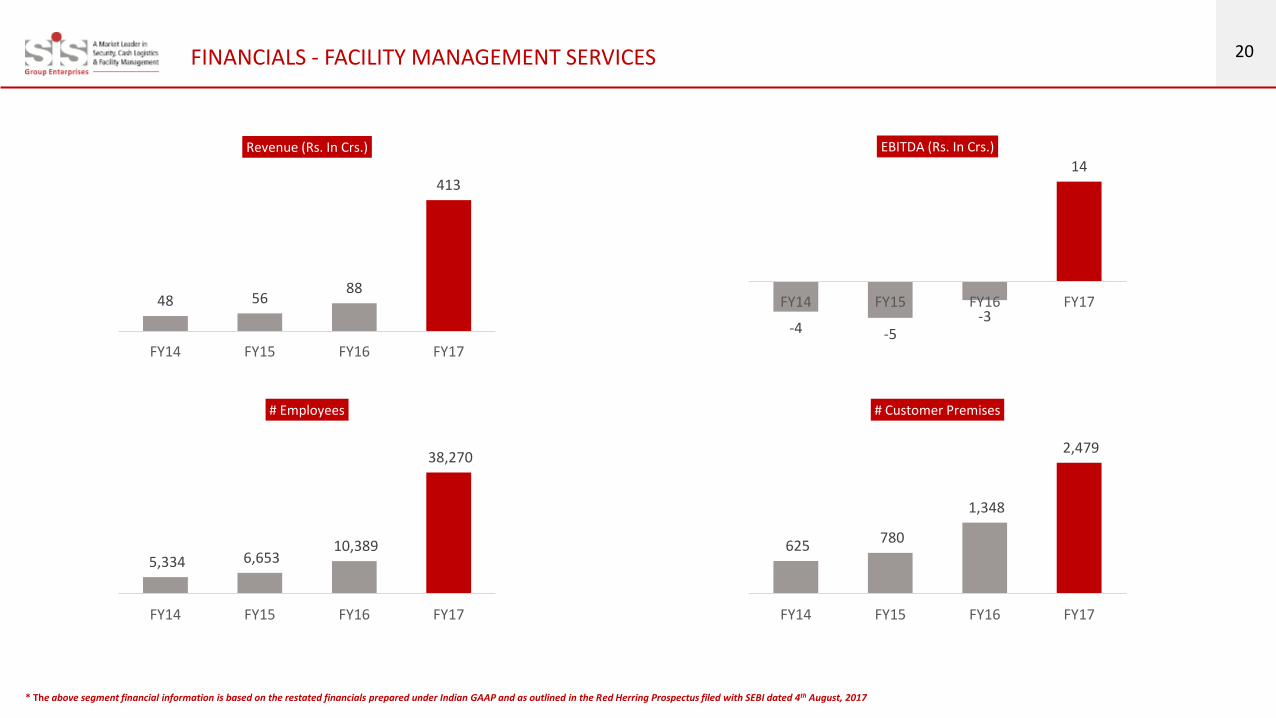
20FINANCIALS - FACILITY MANAGEMENT SERVICES
-4 -5-3
14
FY14 FY15 FY16 FY17
EBITDA (Rs. In Crs.)
5,334 6,653 10,389
38,270
FY14 FY15 FY16 FY17
# Employees
625 780
1,348
2,479
FY14 FY15 FY16 FY17
# Customer Premises
48 5688
413
FY14 FY15 FY16 FY17
Revenue (Rs. In Crs.)
* The above segment financial information is based on the restated financials prepared under Indian GAAP and as outlined in the Red Herring Prospectus filed with SEBI dated 4th August, 2017
21
Cash Logistics
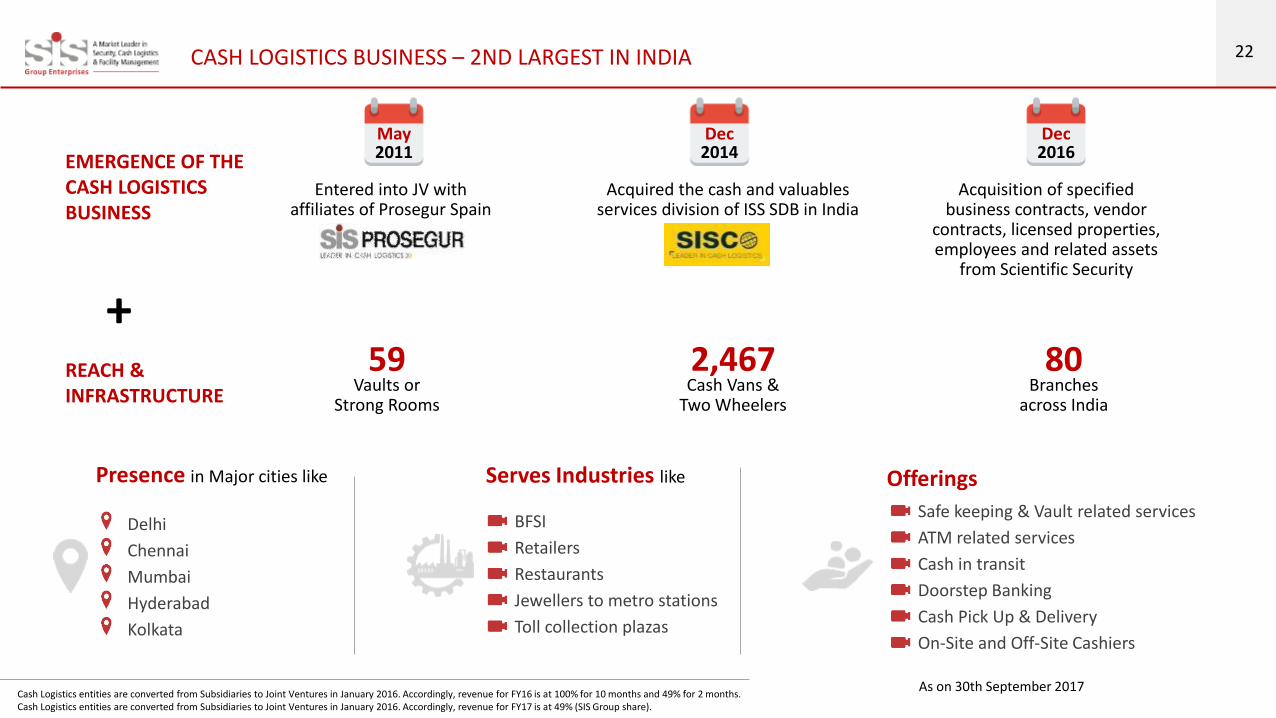
22CASH LOGISTICS BUSINESS – 2ND LARGEST IN INDIA
EMERGENCE OF THE CASH LOGISTICS BUSINESS
REACH & INFRASTRUCTURE
May2011
Entered into JV with affiliates of Prosegur Spain
Dec2014
Acquired the cash and valuables services division of ISS SDB in India
Dec2016
Acquisition of specified business contracts, vendor
contracts, licensed properties, employees and related assets
from Scientific Security
Cash Logistics entities are converted from Subsidiaries to Joint Ventures in January 2016. Accordingly, revenue for FY16 is at 100% for 10 months and 49% for 2 months.Cash Logistics entities are converted from Subsidiaries to Joint Ventures in January 2016. Accordingly, revenue for FY17 is at 49% (SIS Group share).
59Vaults or
Strong Rooms
2,467Cash Vans &
Two Wheelers
80Branches
across India
+
Delhi
Chennai
Mumbai
Hyderabad
Kolkata
Presence in Major cities like
BFSI
Retailers
Restaurants
Jewellers to metro stations
Toll collection plazas
Serves Industries like
Safe keeping & Vault related services
ATM related services
Cash in transit
Doorstep Banking
Cash Pick Up & Delivery
On-Site and Off-Site Cashiers
Offerings
As on 30th September 2017

23BUSINESS DRIVERS
9.110.3
11.412.5
13.915.9
FY11 FY12 FY13 FY14 FY15 FY16
Currency Management services in India
Currency with Public in India
12.3% 11.5%9.1%
11.1%
15.0%
Currency with Public (Rs Tn) Growth
16
29
66
FY11 FY15 FY20E
Cash Logistics industry in India (Rs. Bn)
Currency with Public (Rs Tn) Growth
CAGR 16%
CAGR 18%
55%25%
10%
10%
Break-up of Cash Logistics industry in India (FY15)
ATM Replenishment CIT
CPD Others
87 106142
176 194 225261
301346
398
FY11 FY12 FY13 FY14 FY15 FY16 FY17E FY18E FY19E FY20E
18
130 128108
44
India UK Japan France WorldAverage
Number of ATMs in India (‘000s)ATM Density (Number of ATMs / Lakh) (2014)
Source: Frost & Sullivan Report, July 2017
Key Growth Drivers
India continues to be cash intensive
2Increasing organised
retail
3Increase in
ATMs / ATM Transactions
1

24FINANCIALS - CASH LOGISTICS
110
202
287
165
FY14 FY15 FY16 FY17
Revenue (Rs. In Crs.)
6
7
-3
3
FY14 FY15 FY16 FY17
EBITDA (Rs. In Crs.)
4,867
10,882 10,570 11,400
FY14 FY15 FY16 FY17
# Employees
1,190 1,319
2,315 2,618
FY14 FY15 FY16 FY17
# Cash Vans
#
# Converted from Subsidiary to JV
* The above segment financial information is based on the restated financials prepared under Indian GAAP and as outlined in the Red Herring Prospectus filed with SEBI dated 4th August, 2017
25
SYSTEMS + CULTURE FUTURE AGENDABUSINESS MODEL BUSINESS VERTICALS
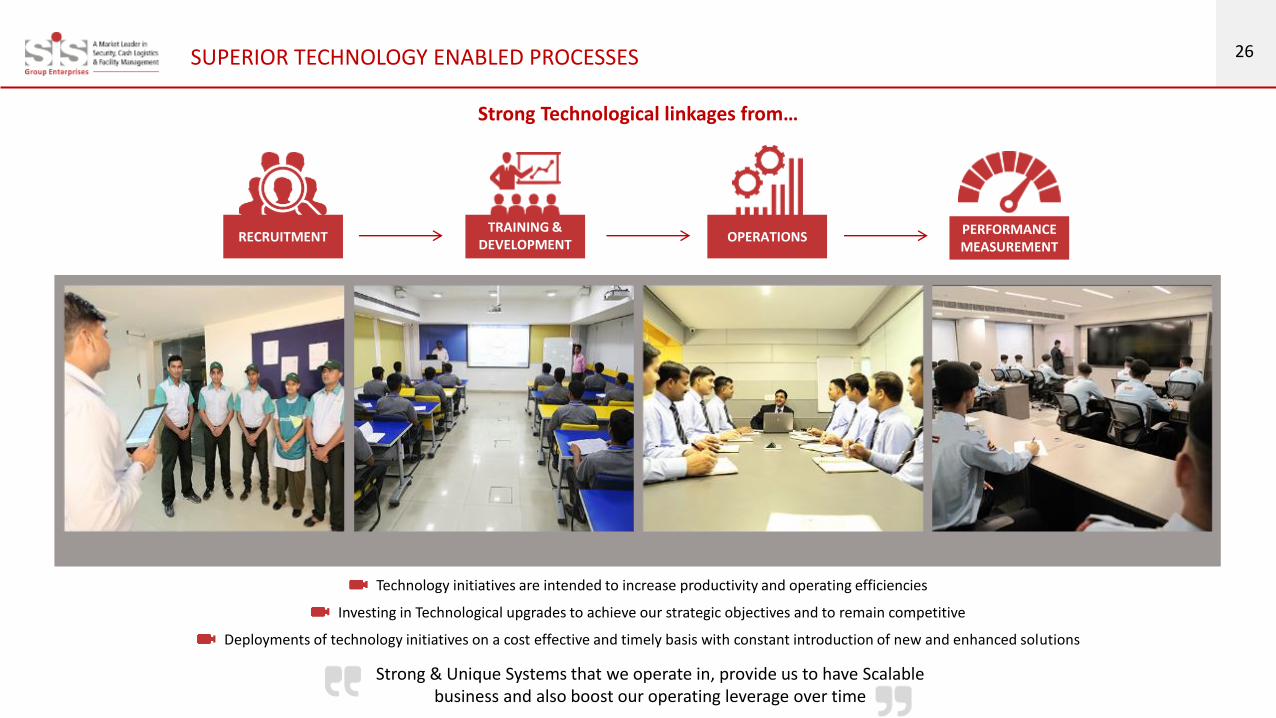
26SUPERIOR TECHNOLOGY ENABLED PROCESSES
Technology initiatives are intended to increase productivity and operating efficiencies
Investing in Technological upgrades to achieve our strategic objectives and to remain competitive
Deployments of technology initiatives on a cost effective and timely basis with constant introduction of new and enhanced solutions
RECRUITMENTTRAINING &
DEVELOPMENTOPERATIONS
PERFORMANCE MEASUREMENT
Strong Technological linkages from…
Strong & Unique Systems that we operate in, provide us to have Scalable business and also boost our operating leverage over time
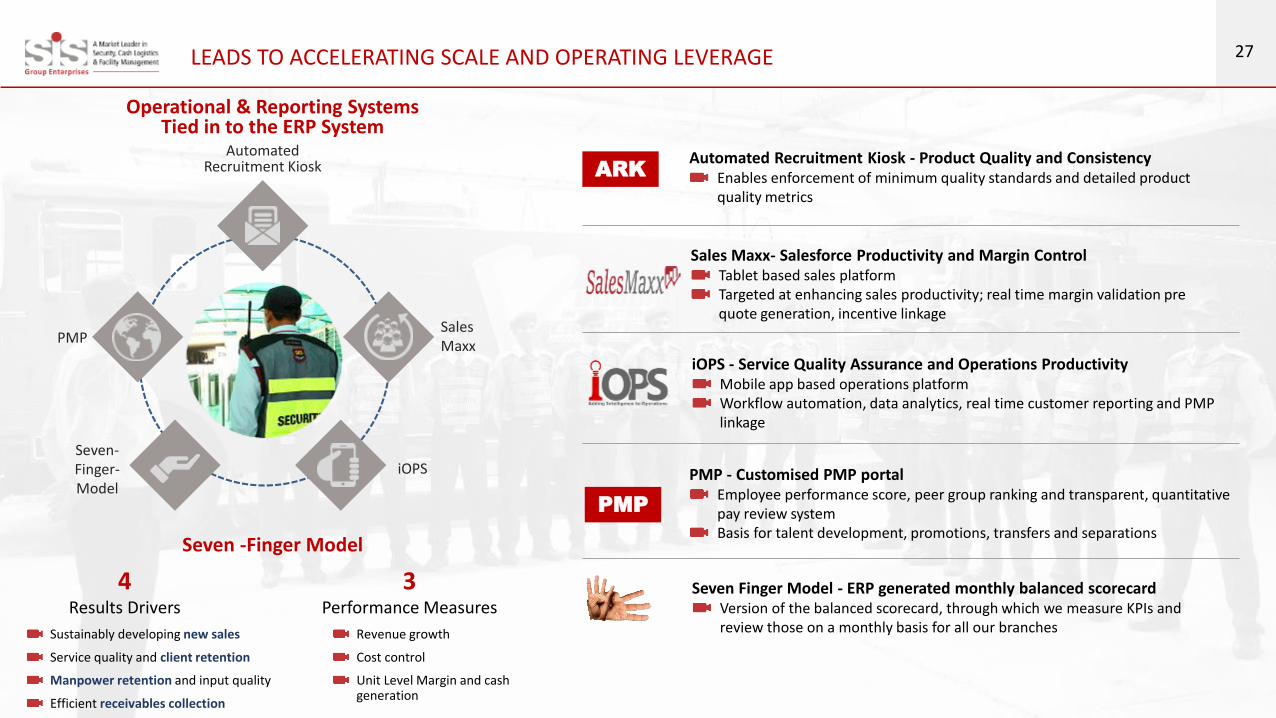
27LEADS TO ACCELERATING SCALE AND OPERATING LEVERAGE
Operational & Reporting Systems Tied in to the ERP System
Automated Recruitment Kiosk
Sales Maxx
iOPSSeven-Finger-Model
PMP
Seven -Finger Model
4Results Drivers
3Performance Measures
Sustainably developing new sales
Service quality and client retention
Manpower retention and input quality
Efficient receivables collection
Revenue growth
Cost control
Unit Level Margin and cash generation
Automated Recruitment Kiosk - Product Quality and ConsistencyEnables enforcement of minimum quality standards and detailed product quality metrics
Sales Maxx- Salesforce Productivity and Margin ControlTablet based sales platformTargeted at enhancing sales productivity; real time margin validation pre quote generation, incentive linkage
iOPS - Service Quality Assurance and Operations ProductivityMobile app based operations platformWorkflow automation, data analytics, real time customer reporting and PMP linkage
PMP - Customised PMP portalEmployee performance score, peer group ranking and transparent, quantitative pay review system Basis for talent development, promotions, transfers and separations
Seven Finger Model - ERP generated monthly balanced scorecardVersion of the balanced scorecard, through which we measure KPIs and review those on a monthly basis for all our branches
PMP
ARK
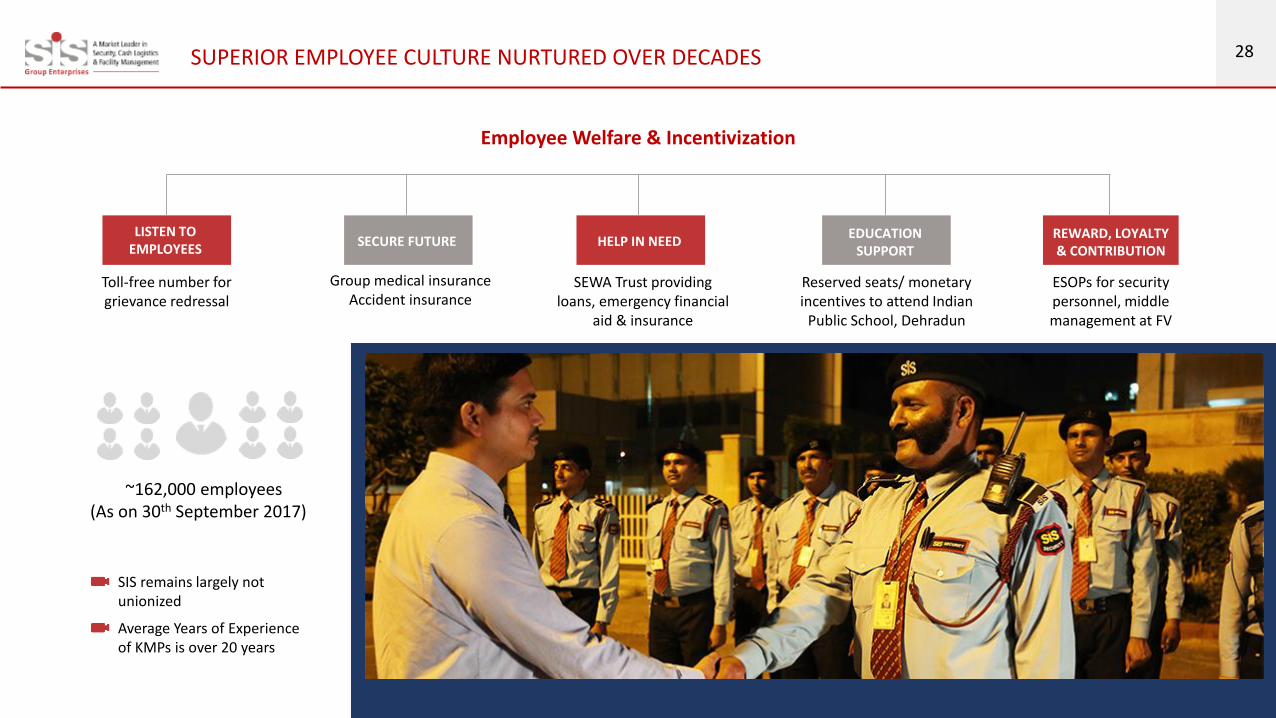
28SUPERIOR EMPLOYEE CULTURE NURTURED OVER DECADES
Toll-free number for grievance redressal
LISTEN TO EMPLOYEES
Group medical insurance Accident insurance
SECURE FUTURE
Reserved seats/ monetary incentives to attend Indian
Public School, Dehradun
EDUCATION SUPPORT
HELP IN NEED
SEWA Trust providing loans, emergency financial
aid & insurance
REWARD, LOYALTY & CONTRIBUTION
ESOPs for security personnel, middle management at FV
Employee Welfare & Incentivization
SIS remains largely not unionized
Average Years of Experience of KMPs is over 20 years
~162,000 employees (As on 30th September 2017)

29EXTENSIVE TRAINING INFRASTRUCTURE SPREAD ACROSS INDIA
Largest trained manpower supply chain in India with integrated capabilities in sourcing, training and deploying a large manpower base
18 training institutes in India, comprising state-of-the-art infrastructure providing upto-date courses that make it possible to train more than 25,000 guards a year securing our personnel pipeline and ensuring prompt deployment
Leadership supply chain, initiated in 1989. 35th batch of training underway (2017)
Management cadre that allows SIS way of doing things to perpetuate
Enables Scalability
13 out of 14 RVPs come from GTO Cadre
~47% of the 140 security services branches headed by GTO graduates
Of top 360 personnel in SIS , average experience with SIS is 8 years and over 100 of these employees are with SIS for over 10 years
Graduate Trainee Officer Programme (GTO)
No formal guard/janitor/cash custodian training in India
Better control over both service quality and service supply chain
Given the economic and demographic inequality across India, local recruitment in high numbers is not possible in most cases
Benefits of Integrated Supply Chain
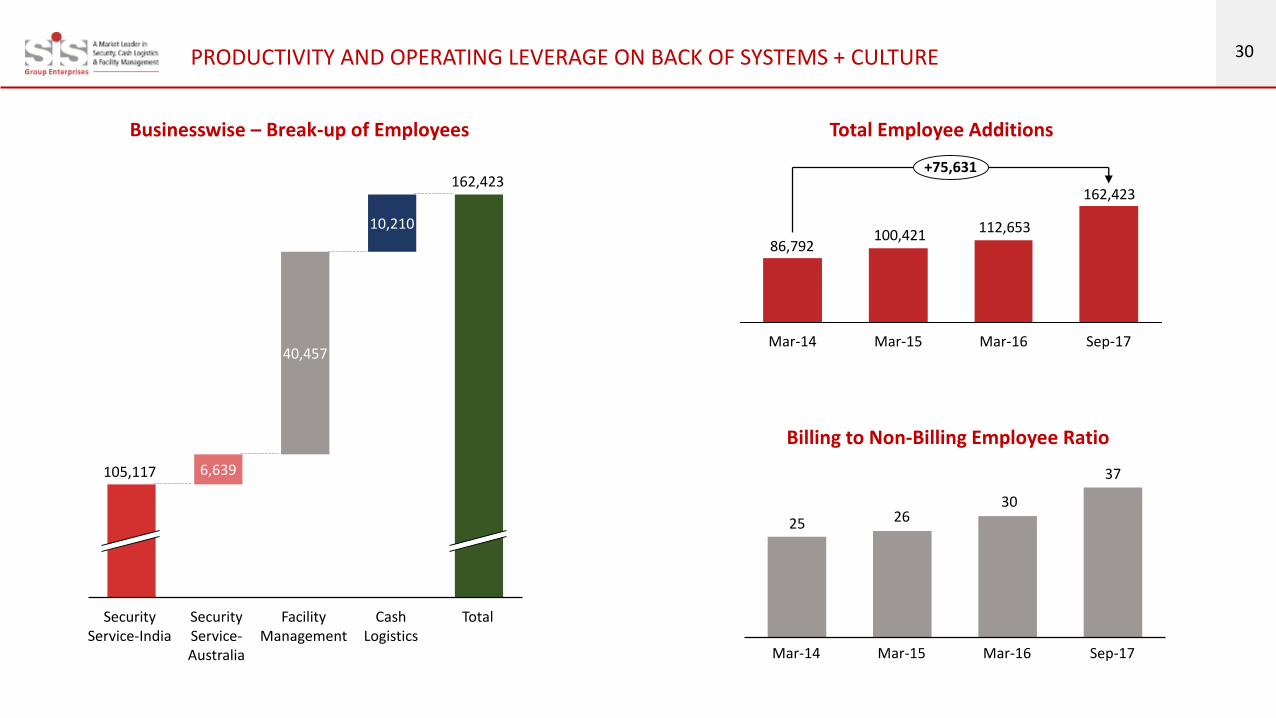
30PRODUCTIVITY AND OPERATING LEVERAGE ON BACK OF SYSTEMS + CULTURE
6,639
40,457
10,210
Facility Management
Security Service-Australia
Security Service-India
105,117
162,423
TotalCash Logistics
Businesswise – Break-up of Employees
162,423
112,653100,42186,792
Mar-14
+75,631
Sep-17Mar-16Mar-15
Total Employee Additions
25 2630
37
Mar-16 Sep-17Mar-15Mar-14
Billing to Non-Billing Employee Ratio
31
SYSTEMS + CULTURE FUTURE AGENDABUSINESS MODEL BUSINESS VERTICALS
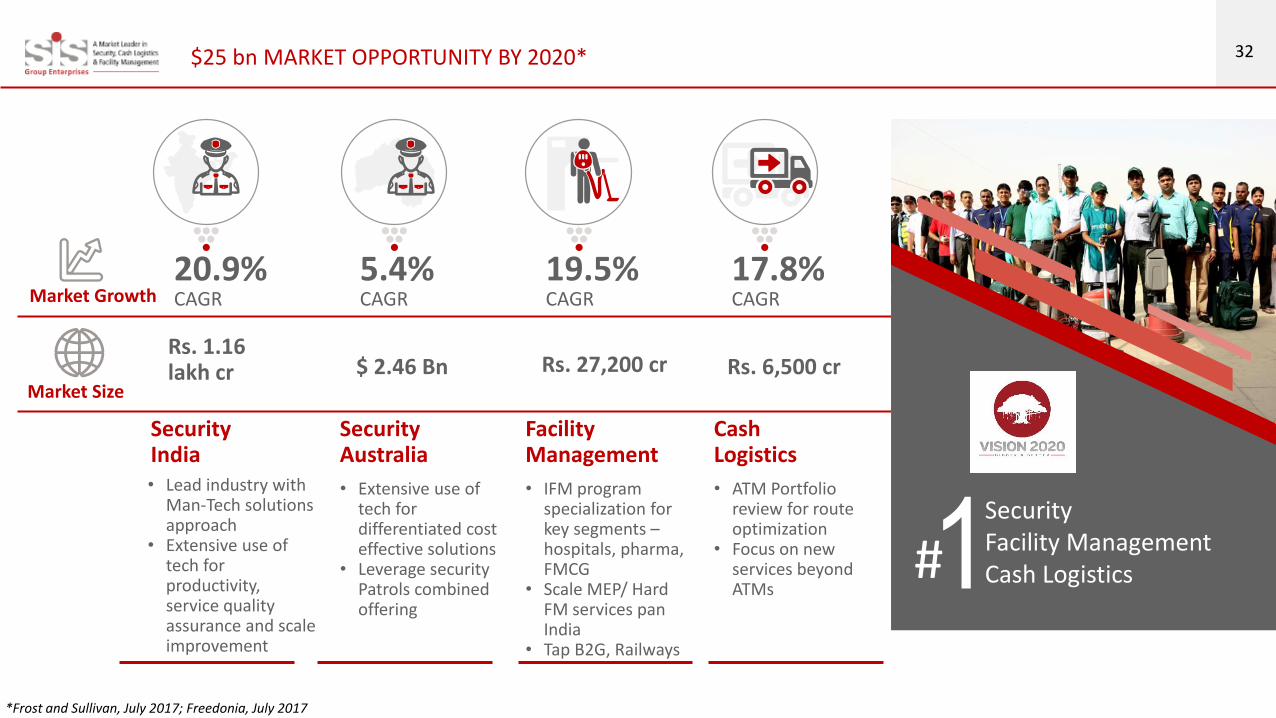
32$25 bn MARKET OPPORTUNITY BY 2020*
Facility Management
• IFM program specialization for key segments –hospitals, pharma, FMCG
• Scale MEP/ Hard FM services pan India
• Tap B2G, Railways
SecurityAustralia
• Extensive use of tech for differentiated cost effective solutions
• Leverage security Patrols combined offering
SecurityIndia• Lead industry with
Man-Tech solutions approach
• Extensive use of tech for productivity, service quality assurance and scale improvement
Cash Logistics
• ATM Portfolio review for route optimization
• Focus on new services beyond ATMs
Market Size
Rs. 27,200 cr$ 2.46 BnRs. 1.16 lakh cr Rs. 6,500 cr
Market Growth CAGRCAGRCAGR CAGR19.5%5.4%20.9% 17.8%
#1SecurityFacility ManagementCash Logistics
*Frost and Sullivan, July 2017; Freedonia, July 2017
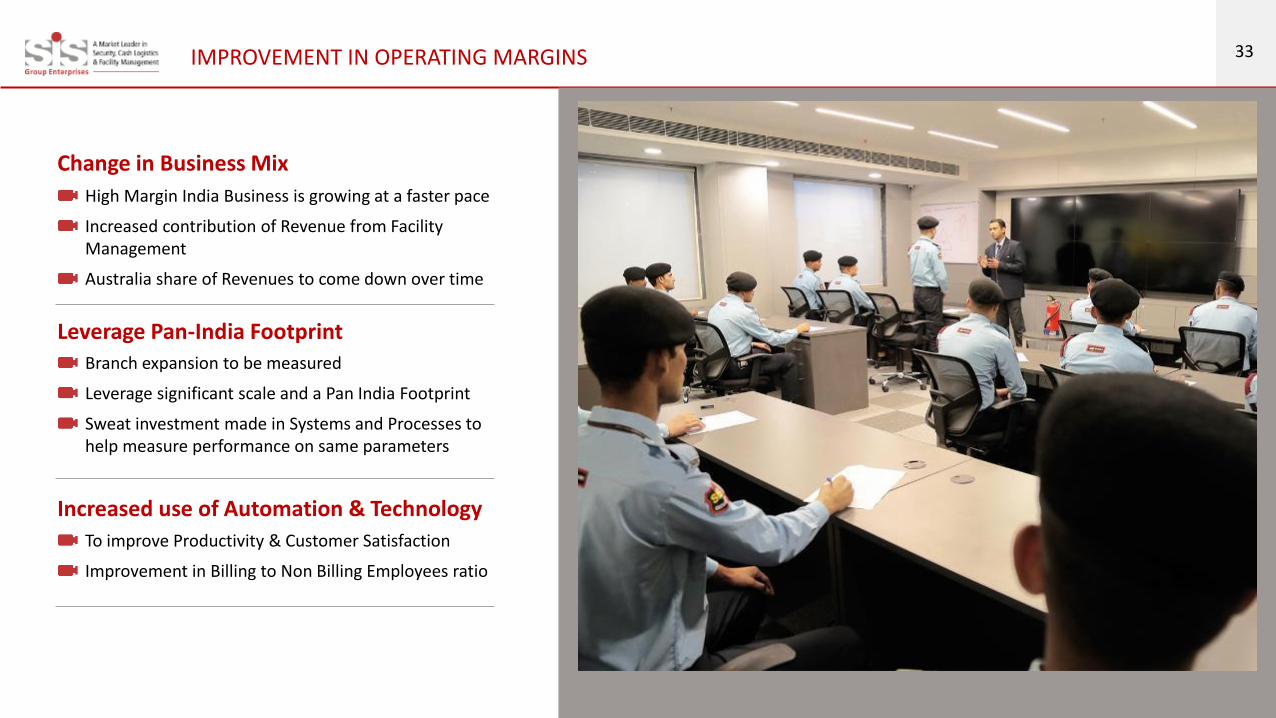
33IMPROVEMENT IN OPERATING MARGINS
High Margin India Business is growing at a faster pace
Increased contribution of Revenue from Facility Management
Australia share of Revenues to come down over time
Change in Business Mix
Branch expansion to be measured
Leverage significant scale and a Pan India Footprint
Sweat investment made in Systems and Processes to help measure performance on same parameters
Leverage Pan-India Footprint
To improve Productivity & Customer Satisfaction
Improvement in Billing to Non Billing Employees ratio
Increased use of Automation & Technology

34SUCCESSFUL ACQUISITIONS STRATEGY WILL CONTINUE
5 Acquisitions
4 JV’s / Partnership
2 PE Rounds with significant returns for Investors
Rich Experience in Inorganic GrowthInorganic Growth by way of
1 Brand Recognition
Technical know-how
Split the risk and
Create exit option
Benefits of Inorganic GrowthInorganic Growth provides us with
3
Acquired in 2008, with revenues of A$288 mn
At a total consideration of A$45 mn
In the first year, EBIT margin improved from 1.4% to 4.1% within 12 months of acquisition
Cash-on-Cash payback for the business within a span of 2.5 years with improvement in working capital cycle
Turnaround FactsEg: MSS Acquisition
4
2Large and fast growing market segments
Manpower intensive and largely asset light
Ability to leverage the existing branch network and customer relationships
Filtering Criteria for Inorganic GrowthFilter Criteria to Target New Segments
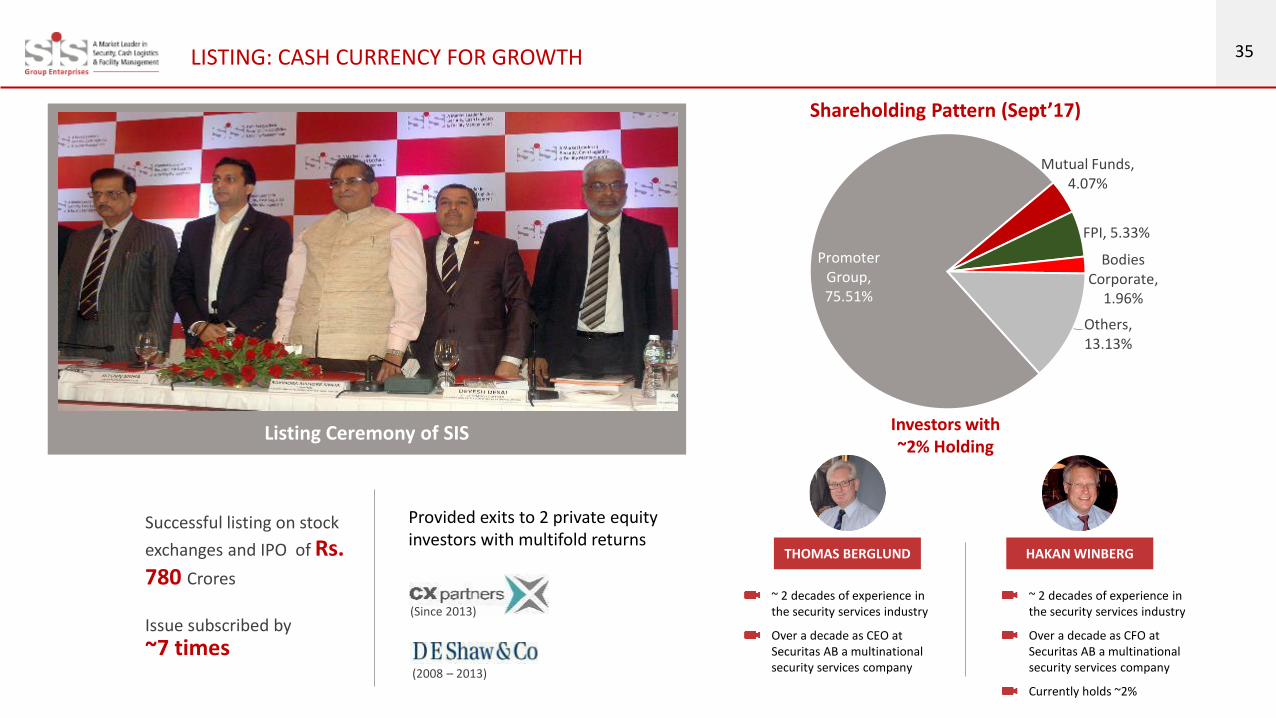
35LISTING: CASH CURRENCY FOR GROWTH
Promoter Group, 75.51%
Mutual Funds, 4.07%
FPI, 5.33%
Bodies Corporate,
1.96%
Others, 13.13%
Listing Ceremony of SIS
Shareholding Pattern (Sept’17)
Successful listing on stock
exchanges and IPO of Rs. 780 Crores
Issue subscribed by
~7 times
Provided exits to 2 private equity investors with multifold returns
(Since 2013)
(2008 – 2013)
~ 2 decades of experience in the security services industry
Over a decade as CEO at Securitas AB a multinational security services company
THOMAS BERGLUND HAKAN WINBERG
~ 2 decades of experience in the security services industry
Over a decade as CFO at Securitas AB a multinational security services company
Currently holds ~2%
Investors with~2% Holding
36
Key Management Personnel
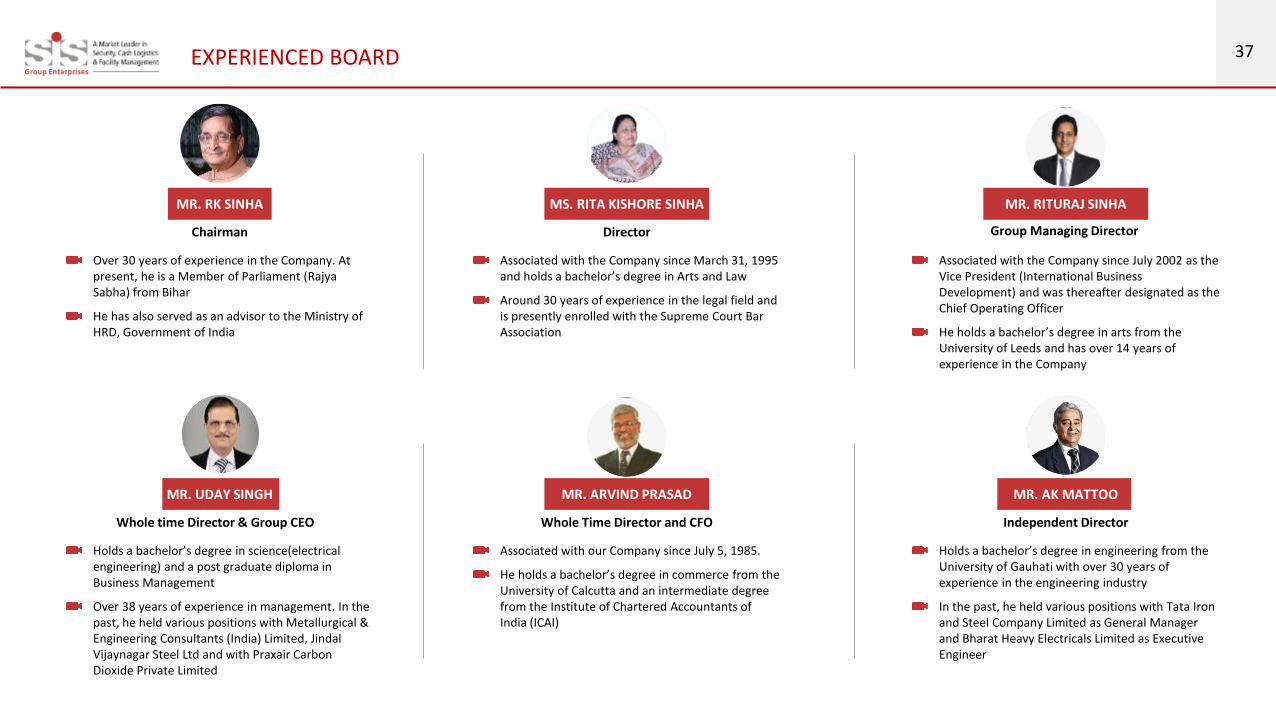
37EXPERIENCED BOARD
Over 30 years of experience in the Company. At present, he is a Member of Parliament (RajyaSabha) from Bihar
He has also served as an advisor to the Ministry of HRD, Government of India
MR. RK SINHA
Chairman
Associated with the Company since March 31, 1995 and holds a bachelor’s degree in Arts and Law
Around 30 years of experience in the legal field and is presently enrolled with the Supreme Court Bar Association
MS. RITA KISHORE SINHA
Director
Associated with the Company since July 2002 as the Vice President (International Business Development) and was thereafter designated as the Chief Operating Officer
He holds a bachelor’s degree in arts from the University of Leeds and has over 14 years of experience in the Company
MR. RITURAJ SINHA
Group Managing Director
Holds a bachelor’s degree in science(electrical engineering) and a post graduate diploma in Business Management
Over 38 years of experience in management. In the past, he held various positions with Metallurgical & Engineering Consultants (India) Limited, Jindal Vijaynagar Steel Ltd and with Praxair Carbon Dioxide Private Limited
MR. UDAY SINGH
Whole time Director & Group CEO
Associated with our Company since July 5, 1985.
He holds a bachelor’s degree in commerce from the University of Calcutta and an intermediate degree from the Institute of Chartered Accountants of India (ICAI)
MR. ARVIND PRASAD
Whole Time Director and CFO
Holds a bachelor’s degree in engineering from the University of Gauhati with over 30 years of experience in the engineering industry
In the past, he held various positions with Tata Iron and Steel Company Limited as General Manager and Bharat Heavy Electricals Limited as Executive Engineer
MR. AK MATTOO
Independent Director
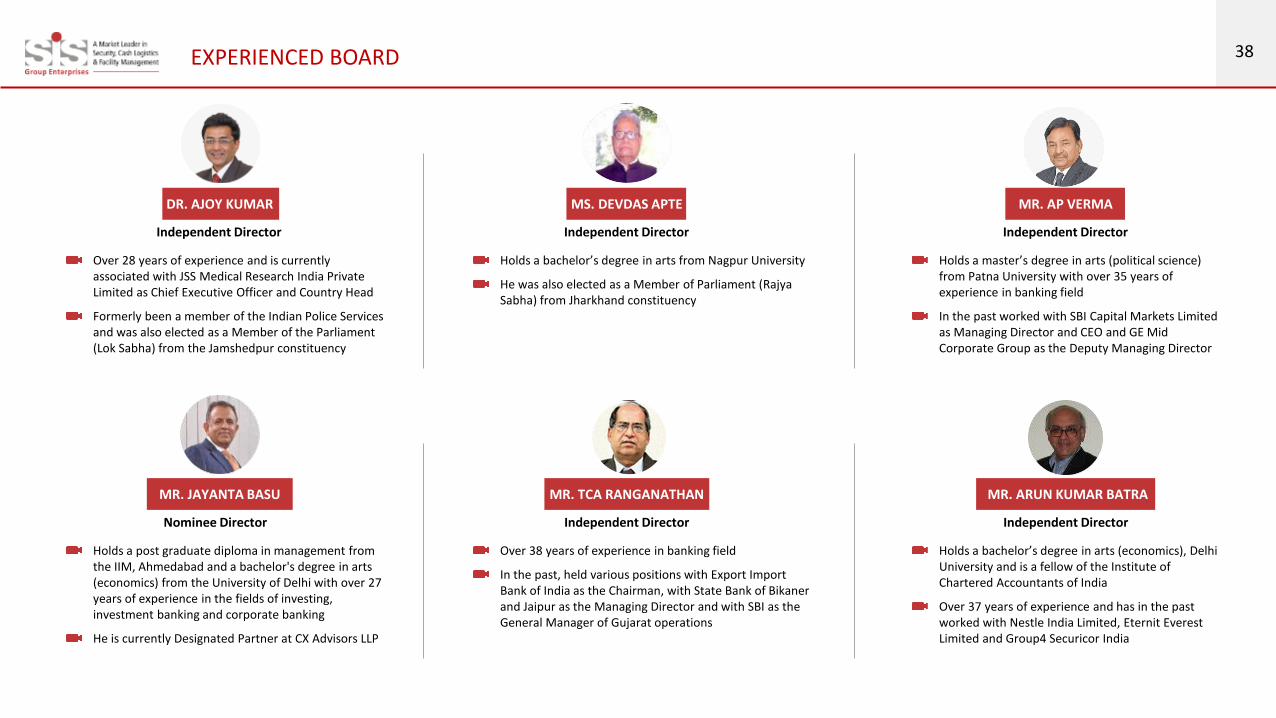
38EXPERIENCED BOARD
Over 28 years of experience and is currently associated with JSS Medical Research India Private Limited as Chief Executive Officer and Country Head
Formerly been a member of the Indian Police Services and was also elected as a Member of the Parliament (Lok Sabha) from the Jamshedpur constituency
DR. AJOY KUMAR
Independent Director
Holds a bachelor’s degree in arts from Nagpur University
He was also elected as a Member of Parliament (RajyaSabha) from Jharkhand constituency
MS. DEVDAS APTE
Holds a master’s degree in arts (political science) from Patna University with over 35 years of experience in banking field
In the past worked with SBI Capital Markets Limited as Managing Director and CEO and GE Mid Corporate Group as the Deputy Managing Director
MR. AP VERMA
Holds a post graduate diploma in management from the IIM, Ahmedabad and a bachelor's degree in arts (economics) from the University of Delhi with over 27 years of experience in the fields of investing, investment banking and corporate banking
He is currently Designated Partner at CX Advisors LLP
MR. JAYANTA BASU
Nominee Director
Over 38 years of experience in banking field
In the past, held various positions with Export Import Bank of India as the Chairman, with State Bank of Bikaner and Jaipur as the Managing Director and with SBI as the General Manager of Gujarat operations
MR. TCA RANGANATHAN
Independent Director
Holds a bachelor’s degree in arts (economics), Delhi University and is a fellow of the Institute of Chartered Accountants of India
Over 37 years of experience and has in the past worked with Nestle India Limited, Eternit Everest Limited and Group4 Securicor India
MR. ARUN KUMAR BATRA
Independent Director
Independent Director Independent Director
39
Mr. VamshidharGuthikonda
Mr. Tapash ChaudhuriMr. Brajesh KumarMr. Mike McKinnonMr. Dhiraj Singh
MANAGEMENT COMMITTEE
Mr. Devesh DesaiMr. Arvind PrasadMr. Uday SinghMr. Rituraj Kishore Sinha
40
Financial Performance
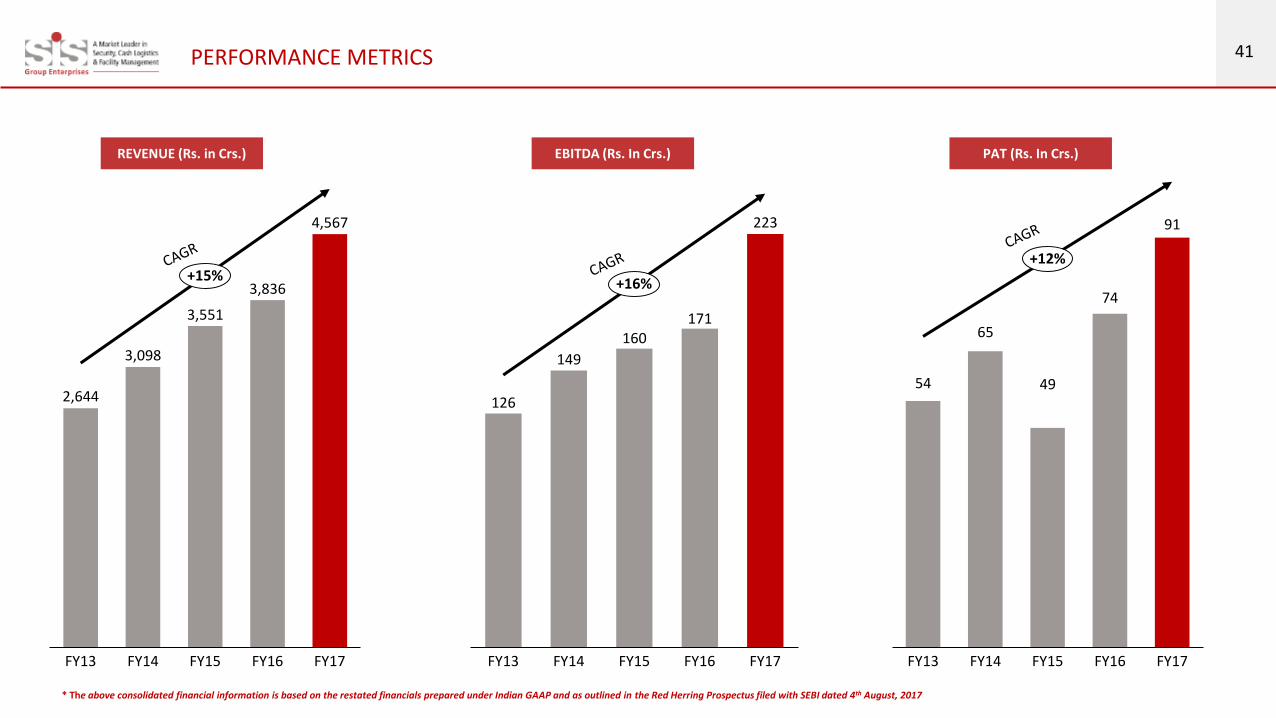
41PERFORMANCE METRICS
2,644
3,098
3,551
3,836
4,567
FY13 FY14 FY15 FY16 FY17
+15%
126
149
160171
223
FY16FY15FY13 FY17FY14
+16%
54
65
49
74
91
FY16FY14FY13 FY15 FY17
+12%
REVENUE (Rs. in Crs.) EBITDA (Rs. In Crs.) PAT (Rs. In Crs.)
* The above consolidated financial information is based on the restated financials prepared under Indian GAAP and as outlined in the Red Herring Prospectus filed with SEBI dated 4th August, 2017

42
NET DEBT/EQUITY (X) ROACE (%) CASH CONVERSION (%)
Disciplined Capital Allocation with focus on better returns on Capital employed
Strong Balance Sheet to support future growth
RETURN RATIOS
38
29
25 25
FY14 FY15 FY16 FY17-0.13 -0.13
0.180.22
0.57
FY13 FY14 FY15 FY16 FY17
5254
45 43 42
FY13 FY14 FY15 FY16 FY17
* The above consolidated financial information is based on the restated financials prepared under Indian GAAP and as outlined in the Red Herring Prospectus filed with SEBI dated 4th August, 2017
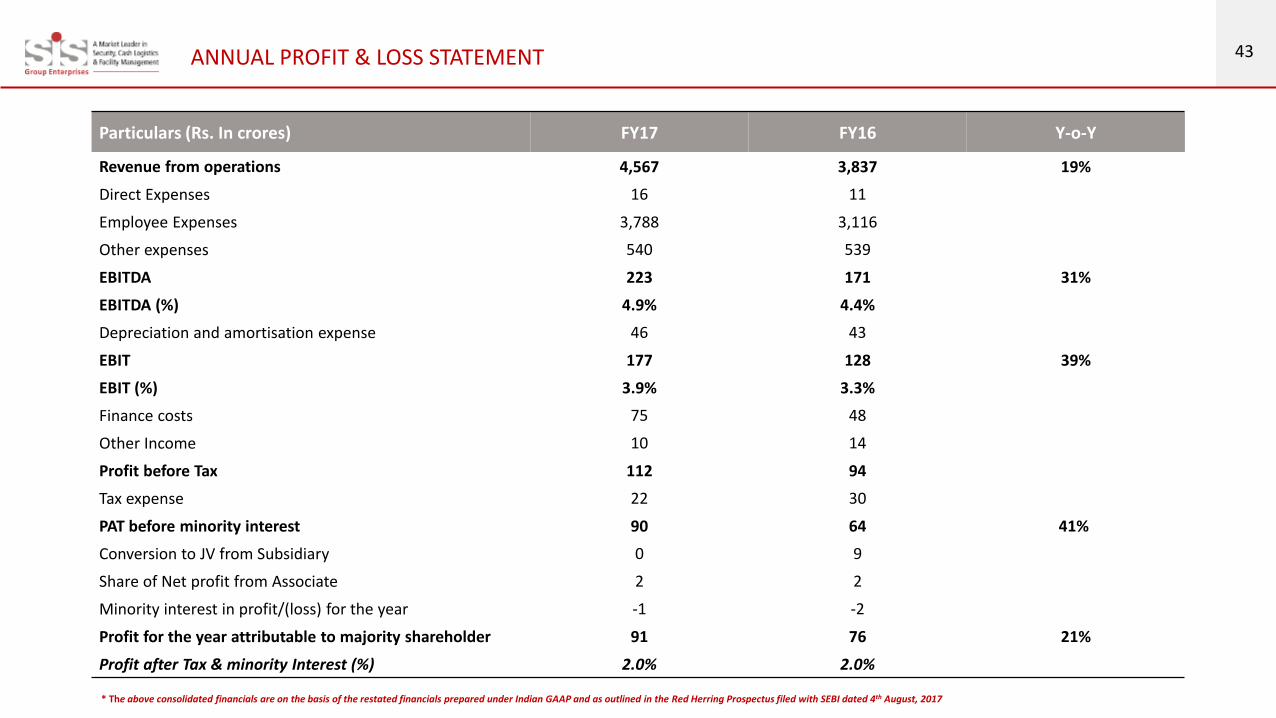
43ANNUAL PROFIT & LOSS STATEMENT
Particulars (Rs. In crores) FY17 FY16 Y-o-Y
Revenue from operations 4,567 3,837 19%
Direct Expenses 16 11
Employee Expenses 3,788 3,116
Other expenses 540 539
EBITDA 223 171 31%
EBITDA (%) 4.9% 4.4%
Depreciation and amortisation expense 46 43
EBIT 177 128 39%
EBIT (%) 3.9% 3.3%
Finance costs 75 48
Other Income 10 14
Profit before Tax 112 94
Tax expense 22 30
PAT before minority interest 90 64 41%
Conversion to JV from Subsidiary 0 9
Share of Net profit from Associate 2 2
Minority interest in profit/(loss) for the year -1 -2
Profit for the year attributable to majority shareholder 91 76 21%
Profit after Tax & minority Interest (%) 2.0% 2.0%
* The above consolidated financials are on the basis of the restated financials prepared under Indian GAAP and as outlined in the Red Herring Prospectus filed with SEBI dated 4th August, 2017
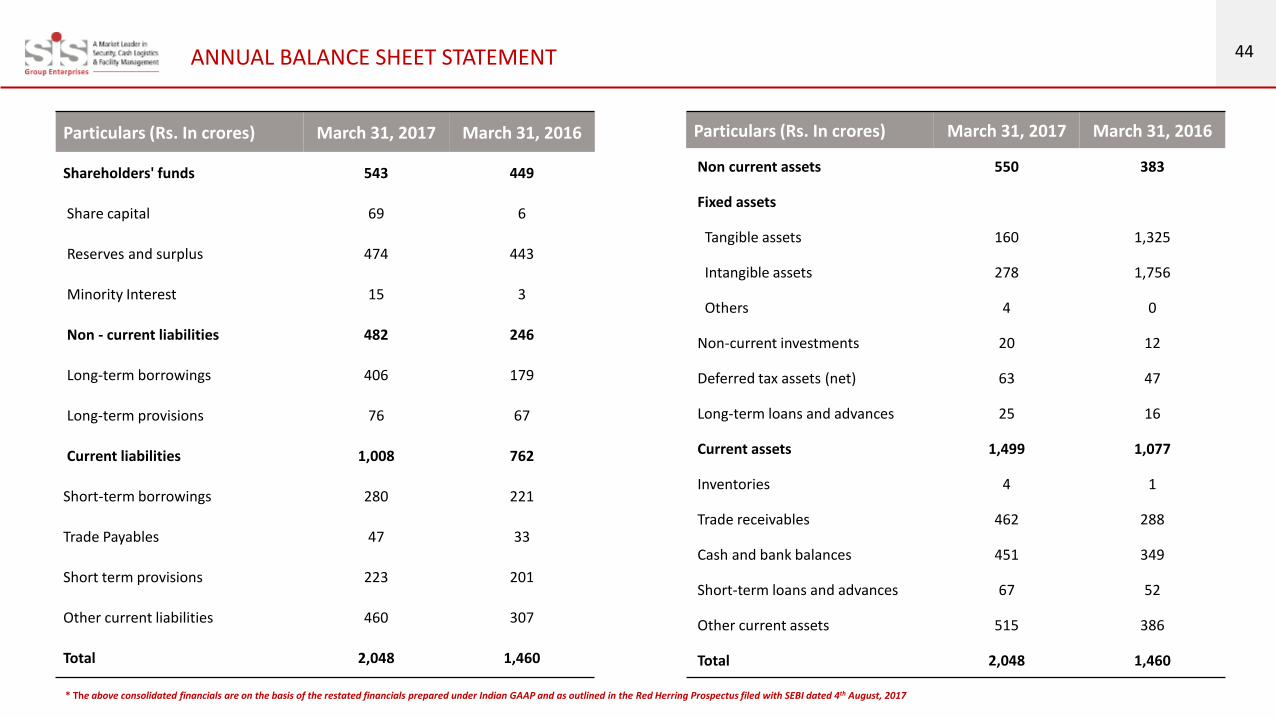
44ANNUAL BALANCE SHEET STATEMENT
Particulars (Rs. In crores) March 31, 2017 March 31, 2016
Shareholders' funds 543 449
Share capital 69 6
Reserves and surplus 474 443
Minority Interest 15 3
Non - current liabilities 482 246
Long-term borrowings 406 179
Long-term provisions 76 67
Current liabilities 1,008 762
Short-term borrowings 280 221
Trade Payables 47 33
Short term provisions 223 201
Other current liabilities 460 307
Total 2,048 1,460
Particulars (Rs. In crores) March 31, 2017 March 31, 2016
Non current assets 550 383
Fixed assets
Tangible assets 160 1,325
Intangible assets 278 1,756
Others 4 0
Non-current investments 20 12
Deferred tax assets (net) 63 47
Long-term loans and advances 25 16
Current assets 1,499 1,077
Inventories 4 1
Trade receivables 462 288
Cash and bank balances 451 349
Short-term loans and advances 67 52
Other current assets 515 386
Total 2,048 1,460
* The above consolidated financials are on the basis of the restated financials prepared under Indian GAAP and as outlined in the Red Herring Prospectus filed with SEBI dated 4th August, 2017
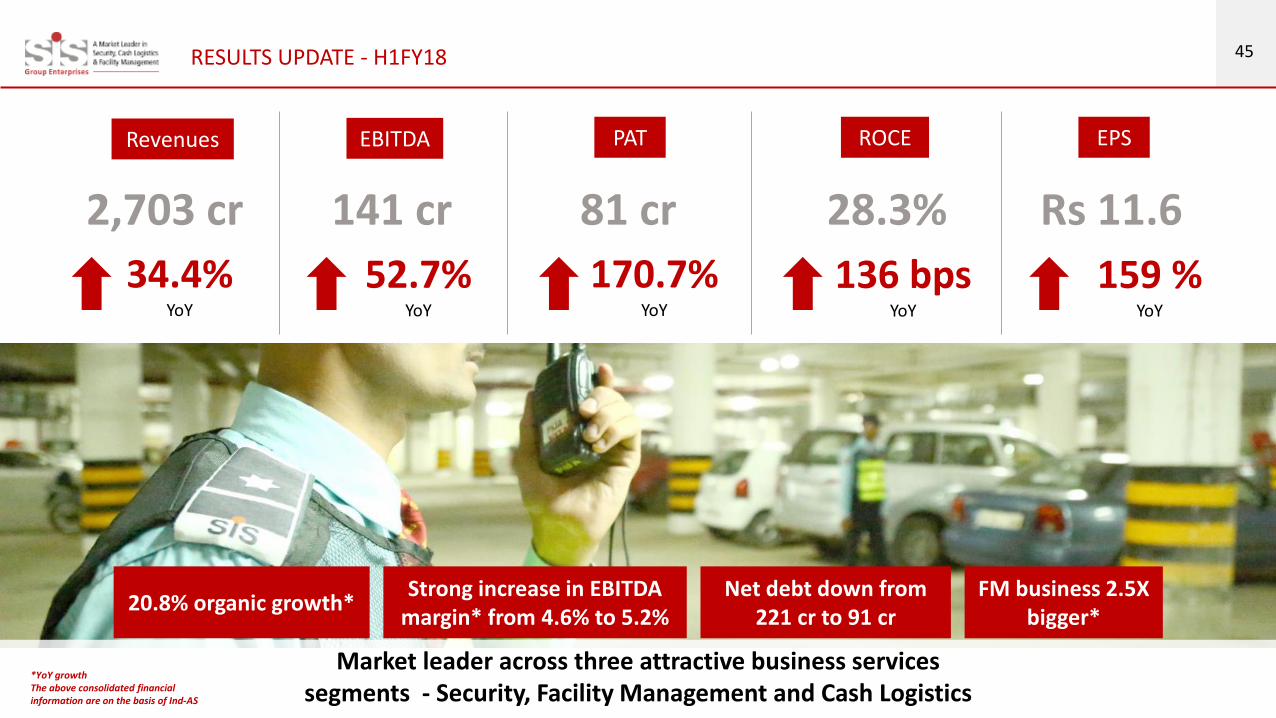
45RESULTS UPDATE - H1FY18
34.4%YoY
52.7%YoY
170.7%YoY
136 bps YoY
159 %YoY
Revenues EBITDA PAT ROCE EPS
2,703 cr 141 cr 81 cr 28.3% Rs 11.6
20.8% organic growth*Strong increase in EBITDA
margin* from 4.6% to 5.2%Net debt down from
221 cr to 91 crFM business 2.5X
bigger*
Market leader across three attractive business services segments - Security, Facility Management and Cash Logistics
*YoY growthThe above consolidated financial information are on the basis of Ind-AS

46RESULTS BY BUSINESS LINE - H1FY18
SECURITY - INDIA
CASH LOGISTICSFACILITY
MANAGEMENT
SECURITY - AUSTRALIA
+37.8%
735
1012
H1FY17 H1FY18
44
73
H1FY17 H1FY18
+65.9%
REVENUES
Rs. in crsThe above financial information are on the basis of Ind-AS
EBITDA
1,152
1,373
4754
+19% +14.7%
REVENUES EBITDA
H1FY18H1FY17 H1FY17 H1FY18
125
318
H1FY17 H1FY18
1
14
H1FY17 H1FY18
+154% +1046%
REVENUES EBITDA
4.1% 4.1%6.0% 7.2%
1.0%
4.4%145
154
H1FY17 H1FY18
+6.4%
1.3
H1FY17 H1FY182
-4.4%
-6.3 0.9%
REVENUES EBITDA
Strong organic growth across all segments with margin improvement
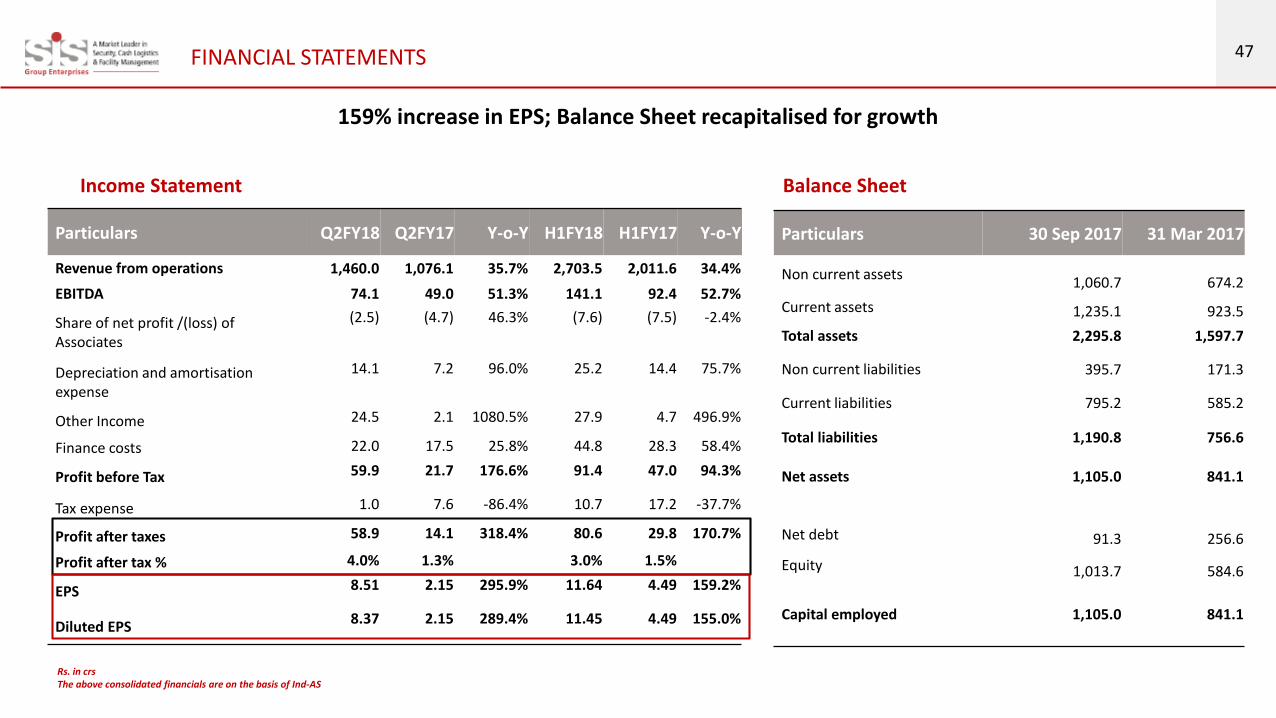
47FINANCIAL STATEMENTS
Particulars Q2FY18 Q2FY17 Y-o-Y H1FY18 H1FY17 Y-o-Y
Revenue from operations 1,460.0 1,076.1 35.7% 2,703.5 2,011.6 34.4%
EBITDA 74.1 49.0 51.3% 141.1 92.4 52.7%
Share of net profit /(loss) of Associates
(2.5) (4.7) 46.3% (7.6) (7.5) -2.4%
Depreciation and amortisation expense
14.1 7.2 96.0% 25.2 14.4 75.7%
Other Income 24.5 2.1 1080.5% 27.9 4.7 496.9%
Finance costs 22.0 17.5 25.8% 44.8 28.3 58.4%
Profit before Tax 59.9 21.7 176.6% 91.4 47.0 94.3%
Tax expense 1.0 7.6 -86.4% 10.7 17.2 -37.7%
Profit after taxes 58.9 14.1 318.4% 80.6 29.8 170.7%
Profit after tax % 4.0% 1.3% 3.0% 1.5%
EPS 8.51 2.15 295.9% 11.64 4.49 159.2%
Diluted EPS8.37 2.15 289.4% 11.45 4.49 155.0%
Income Statement
Particulars 30 Sep 2017 31 Mar 2017
Non current assets1,060.7 674.2
Current assets 1,235.1 923.5
Total assets 2,295.8 1,597.7
Non current liabilities 395.7 171.3
Current liabilities 795.2 585.2
Total liabilities 1,190.8 756.6
Net assets 1,105.0 841.1
Net debt 91.3 256.6
Equity 1,013.7 584.6
Capital employed 1,105.0 841.1
Balance Sheet
159% increase in EPS; Balance Sheet recapitalised for growth
Rs. in crsThe above consolidated financials are on the basis of Ind-AS
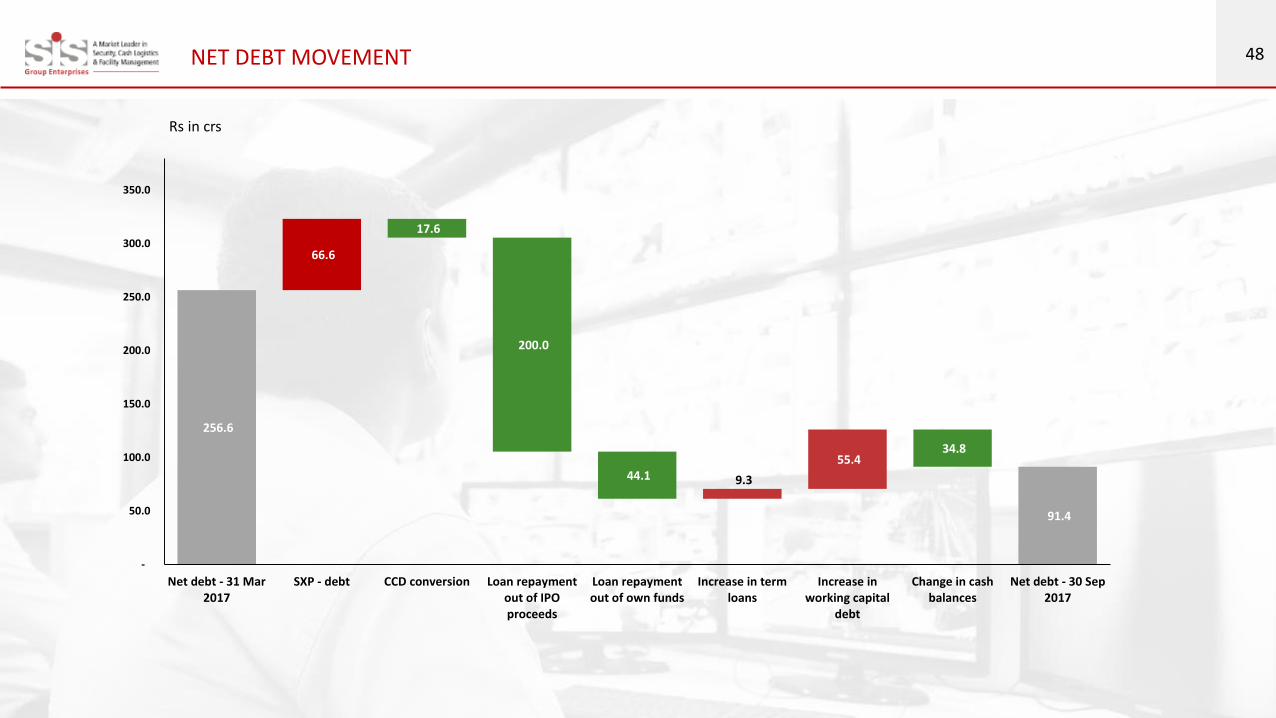
48NET DEBT MOVEMENT
256.6
17.6
200.0
44.1
34.8
66.6
9.3
55.4
91.4
-
50.0
100.0
150.0
200.0
250.0
300.0
350.0
Net debt - 31 Mar2017
SXP - debt CCD conversion Loan repaymentout of IPOproceeds
Loan repaymentout of own funds
Increase in termloans
Increase inworking capital
debt
Change in cashbalances
Net debt - 30 Sep2017
Rs in crs
49
CONTACT US
CIN: L75230BR1985PLC002083
Mr. Vamshidhar Guthikonda,President, M&A & IR
Email : [email protected]
CIN: U74140MH2010PTC204285
Mr. Pankaj Chhaochharia / Mr. Pratik R. ShahEmail : [email protected] / [email protected]
+91 79770 90417/ +91 97692 60769www.sgapl.net