investor presentation - nzx-prod-s7fsd7f98s.s3-website-ap...
TRANSCRIPT
INVESTOR PRESENTATION FY18 FINANCIAL RESULTS 23 August 2018

2
DISCLAIMER The information in this presentation was prepared by EBOS Group Ltd with due care and attention. However, the information is supplied in summary form and is therefore not necessarily complete, and no representation is made as to the accuracy, completeness or reliability of the information. In addition, neither the EBOS Group nor any of its subsidiaries, directors, employees, shareholders nor any other person shall have liability whatsoever to any person for any loss (including, without limitation, arising from any fault or negligence) arising from this presentation or any information supplied in connection with it.
This presentation may contain forward-looking statements and projections. These reflect EBOS’ current expectations, based on what it thinks are reasonable assumptions. EBOS gives no warranty or representation as to its future financial performance or any future matter. Except as required by law or NZX or ASX listing rules, EBOS is not obliged to update this presentation after its release, even if things change materially. This presentation does not constitute financial advice. Further, this presentation is not and should not be construed as an offer to sell or a solicitation of an offer to buy EBOS Group securities and may not be relied upon in connection with any purchase of EBOS Group securities.
This presentation contains a number of non-GAAP financial measures, including Gross Profit, Gross Operating Revenue, EBIT, EBITA, EBITDA, Underlying EBITDA, NPAT, Underlying NPAT, Underlying Earnings per Share, Free Cash Flow, Interest cover, Net Debt and Return on Capital Employed. Because they are not defined by GAAP or IFRS, EBOS’ calculation of these measures may differ from similarly titled measures presented by other companies and they should not be considered in isolation from, or construed as an alternative to, other financial measures determined in accordance with GAAP. Although EBOS believes they provide useful information in measuring the financial performance and condition of EBOS' business, readers are cautioned not to place undue reliance on these non-GAAP financial measures.
The information contained in this presentation should be considered in conjunction with the consolidated financial statements for the period ended 30 June 2018.
All currency amounts are in New Zealand dollars unless stated otherwise.
Group Financial Results
4
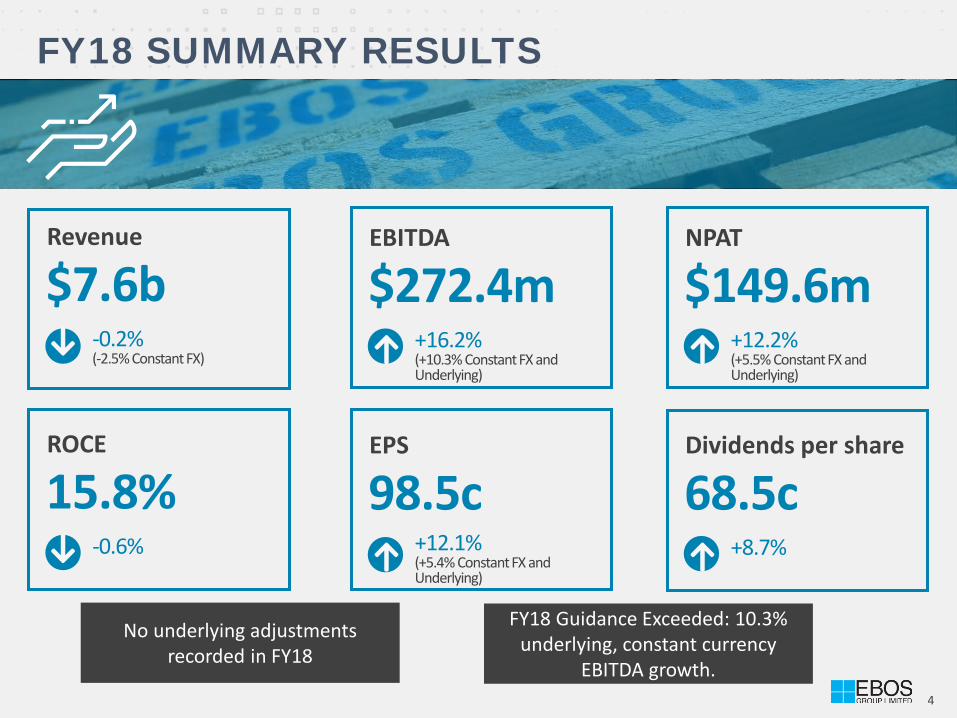
FY18 SUMMARY RESULTS
$7.6b Revenue
$272.4m EBITDA
$149.6m NPAT
ROCE EPS Dividends per share
No underlying adjustments recorded in FY18
15.8% -0.6%
98.5c +12.1% (+5.4% Constant FX and Underlying)
68.5c +8.7%
-0.2% (-2.5% Constant FX)
+16.2% (+10.3% Constant FX and Underlying)
+12.2% (+5.5% Constant FX and Underlying)
FY18 Guidance Exceeded: 10.3% underlying, constant currency
EBITDA growth.
5
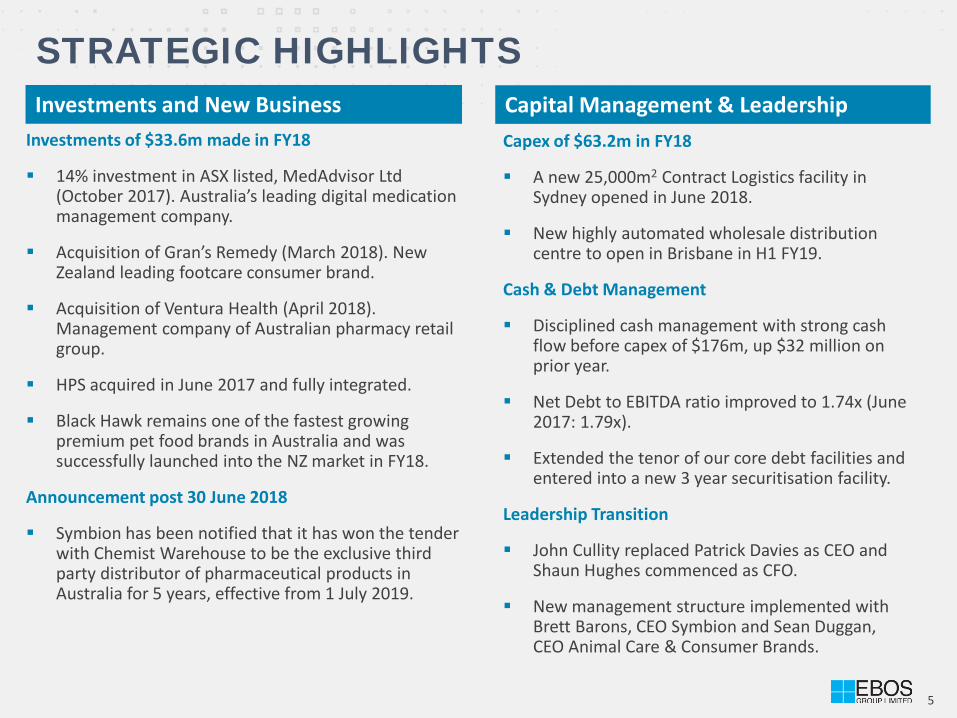
STRATEGIC HIGHLIGHTS Investments and New Business
Investments of $33.6m made in FY18
14% investment in ASX listed, MedAdvisor Ltd (October 2017). Australia’s leading digital medication management company.
Acquisition of Gran’s Remedy (March 2018). New Zealand leading footcare consumer brand.
Acquisition of Ventura Health (April 2018). Management company of Australian pharmacy retail group.
HPS acquired in June 2017 and fully integrated.
Black Hawk remains one of the fastest growing premium pet food brands in Australia and was successfully launched into the NZ market in FY18.
Announcement post 30 June 2018
Symbion has been notified that it has won the tender with Chemist Warehouse to be the exclusive third party distributor of pharmaceutical products in Australia for 5 years, effective from 1 July 2019.
Capital Management & Leadership Capex of $63.2m in FY18
A new 25,000m2 Contract Logistics facility in Sydney opened in June 2018.
New highly automated wholesale distribution centre to open in Brisbane in H1 FY19.
Cash & Debt Management
Disciplined cash management with strong cash flow before capex of $176m, up $32 million on prior year.
Net Debt to EBITDA ratio improved to 1.74x (June 2017: 1.79x).
Extended the tenor of our core debt facilities and entered into a new 3 year securitisation facility.
Leadership Transition
John Cullity replaced Patrick Davies as CEO and Shaun Hughes commenced as CFO.
New management structure implemented with Brett Barons, CEO Symbion and Sean Duggan, CEO Animal Care & Consumer Brands.
6
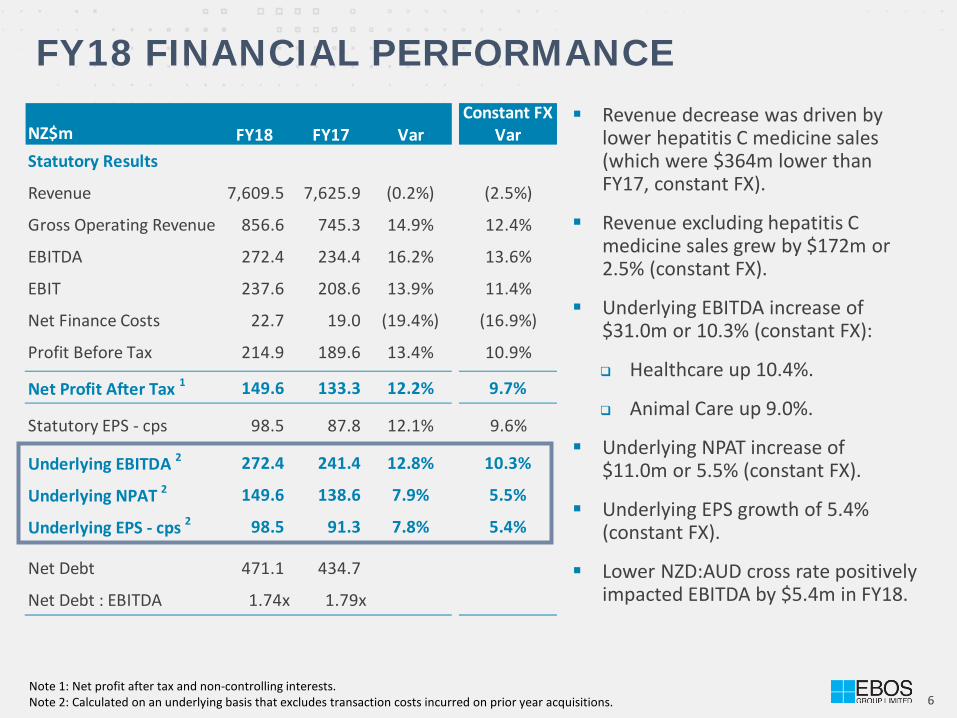
FY18 FINANCIAL PERFORMANCE Revenue decrease was driven by
lower hepatitis C medicine sales (which were $364m lower than FY17, constant FX).
Revenue excluding hepatitis C medicine sales grew by $172m or 2.5% (constant FX).
Underlying EBITDA increase of $31.0m or 10.3% (constant FX):
Healthcare up 10.4%.
Animal Care up 9.0%.
Underlying NPAT increase of $11.0m or 5.5% (constant FX).
Underlying EPS growth of 5.4% (constant FX).
Lower NZD:AUD cross rate positively impacted EBITDA by $5.4m in FY18.
Note 1: Net profit after tax and non-controlling interests. Note 2: Calculated on an underlying basis that excludes transaction costs incurred on prior year acquisitions.
Constant FXNZ$m FY18 FY17 Var VarStatutory Results
Revenue 7,609.5 7,625.9 (0.2%) (2.5%)
Gross Operating Revenue 856.6 745.3 14.9% 12.4%
EBITDA 272.4 234.4 16.2% 13.6%
EBIT 237.6 208.6 13.9% 11.4%
Net Finance Costs 22.7 19.0 (19.4%) (16.9%)
Profit Before Tax 214.9 189.6 13.4% 10.9%
Net Profit After Tax 1 149.6 133.3 12.2% 9.7%
Statutory EPS - cps 98.5 87.8 12.1% 9.6%
Underlying EBITDA 2 272.4 241.4 12.8% 10.3%
Underlying NPAT 2 149.6 138.6 7.9% 5.5%
Underlying EPS - cps 2 98.5 91.3 7.8% 5.4%
Net Debt 471.1 434.7
Net Debt : EBITDA 1.74x 1.79x

Healthcare Results
8
Constant FXNZ$m FY18 FY17 Var Var
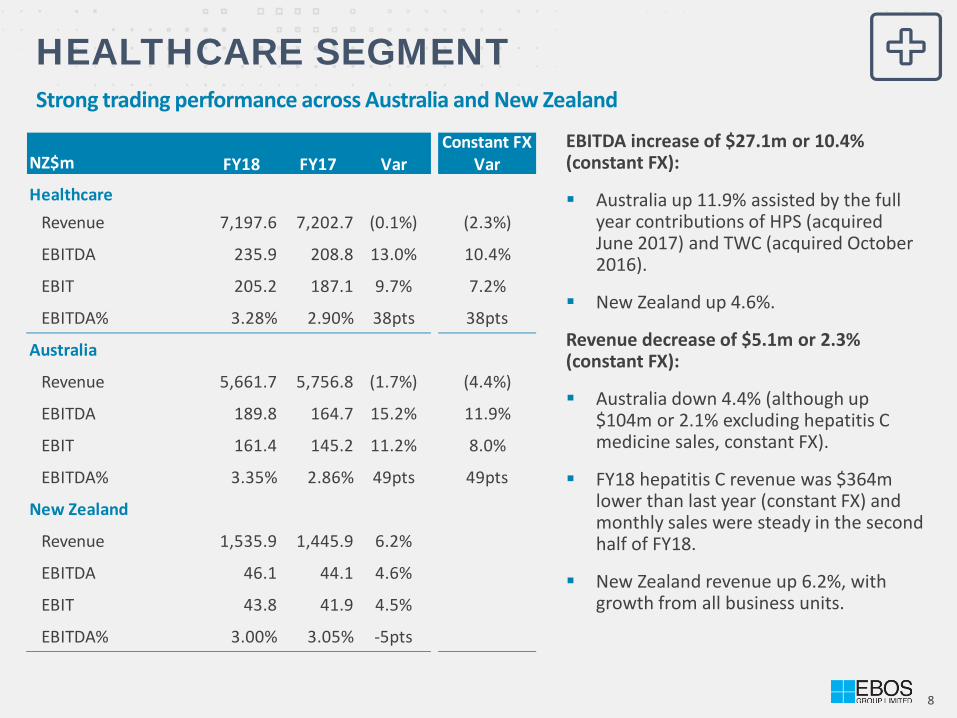
HealthcareRevenue 7,197.6 7,202.7 (0.1%) (2.3%)
EBITDA 235.9 208.8 13.0% 10.4%
EBIT 205.2 187.1 9.7% 7.2%
EBITDA% 3.28% 2.90% 38pts 38pts
Australia
Revenue 5,661.7 5,756.8 (1.7%) (4.4%)
EBITDA 189.8 164.7 15.2% 11.9%
EBIT 161.4 145.2 11.2% 8.0%
EBITDA% 3.35% 2.86% 49pts 49pts
New Zealand
Revenue 1,535.9 1,445.9 6.2%
EBITDA 46.1 44.1 4.6%
EBIT 43.8 41.9 4.5%
EBITDA% 3.00% 3.05% -5pts
HEALTHCARE SEGMENT Strong trading performance across Australia and New Zealand
EBITDA increase of $27.1m or 10.4% (constant FX):
Australia up 11.9% assisted by the full year contributions of HPS (acquired June 2017) and TWC (acquired October 2016).
New Zealand up 4.6%.
Revenue decrease of $5.1m or 2.3% (constant FX):
Australia down 4.4% (although up $104m or 2.1% excluding hepatitis C medicine sales, constant FX).
FY18 hepatitis C revenue was $364m lower than last year (constant FX) and monthly sales were steady in the second half of FY18.
New Zealand revenue up 6.2%, with growth from all business units.
9
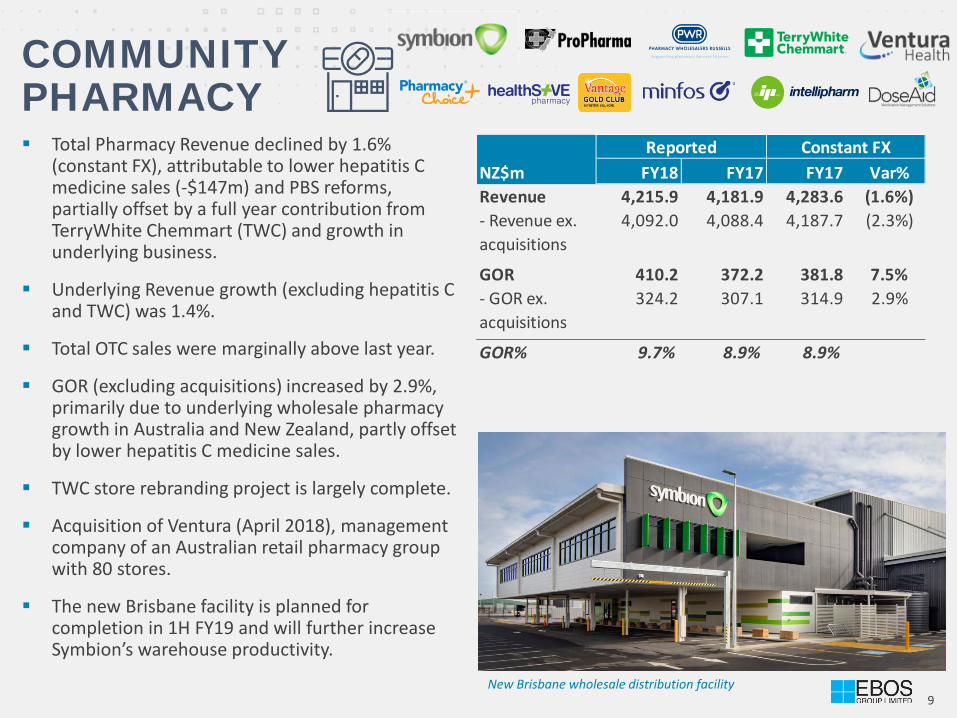
COMMUNITY PHARMACY
New Brisbane wholesale distribution facility
Total Pharmacy Revenue declined by 1.6% (constant FX), attributable to lower hepatitis C medicine sales (-$147m) and PBS reforms, partially offset by a full year contribution from TerryWhite Chemmart (TWC) and growth in underlying business.
Underlying Revenue growth (excluding hepatitis C and TWC) was 1.4%.
Total OTC sales were marginally above last year.
GOR (excluding acquisitions) increased by 2.9%, primarily due to underlying wholesale pharmacy growth in Australia and New Zealand, partly offset by lower hepatitis C medicine sales.
TWC store rebranding project is largely complete.
Acquisition of Ventura (April 2018), management company of an Australian retail pharmacy group with 80 stores.
The new Brisbane facility is planned for completion in 1H FY19 and will further increase Symbion’s warehouse productivity.
NZ$m FY18 FY17 FY17 Var%Revenue 4,215.9 4,181.9 4,283.6 (1.6%)- Revenue ex. acquisitions
4,092.0 4,088.4 4,187.7 (2.3%)
GOR 410.2 372.2 381.8 7.5%- GOR ex. acquisitions
324.2 307.1 314.9 2.9%
GOR% 9.7% 8.9% 8.9%
Reported Constant FX
10
CHEMIST WAREHOUSE ANNOUNCEMENT
In July 2018, EBOS was notified it won the tender to act as the exclusive third party distributor of pharmaceutical products to more than 400 Chemist Warehouse and My Chemist stores in Australia.
EBOS expects to enter into a five-year supply agreement, to take effect from 1 July 2019, with the potential for an extension of a further 3 years.
EBOS estimates that sales to the Chemist Warehouse Group stores will generate approximately A$1 billion in revenue in the first year of the agreement.
To be selected as a trusted partner by Chemist Warehouse Group reinforces our capital investment strategy and reflects the efficiencies we have made over a number of years to our operations. It also reflects the high level of expertise and service standards that we offer the industry.
EBOS is confident that it will generate an acceptable return on capital from this new business.
11
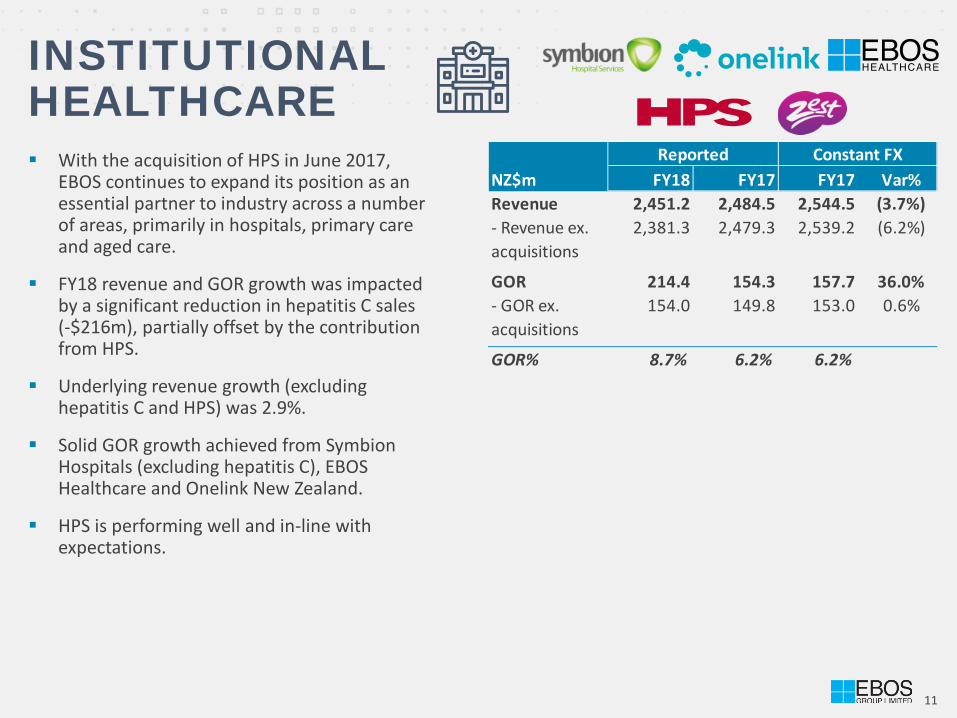
INSTITUTIONAL HEALTHCARE With the acquisition of HPS in June 2017,
EBOS continues to expand its position as an essential partner to industry across a number of areas, primarily in hospitals, primary care and aged care.
FY18 revenue and GOR growth was impacted by a significant reduction in hepatitis C sales (-$216m), partially offset by the contribution from HPS.
Underlying revenue growth (excluding hepatitis C and HPS) was 2.9%.
Solid GOR growth achieved from Symbion Hospitals (excluding hepatitis C), EBOS Healthcare and Onelink New Zealand.
HPS is performing well and in-line with expectations.
NZ$m FY18 FY17 FY17 Var%Revenue 2,451.2 2,484.5 2,544.5 (3.7%)- Revenue ex. acquisitions
2,381.3 2,479.3 2,539.2 (6.2%)
GOR 214.4 154.3 157.7 36.0%- GOR ex. acquisitions
154.0 149.8 153.0 0.6%
GOR% 8.7% 6.2% 6.2%
Reported Constant FX
12
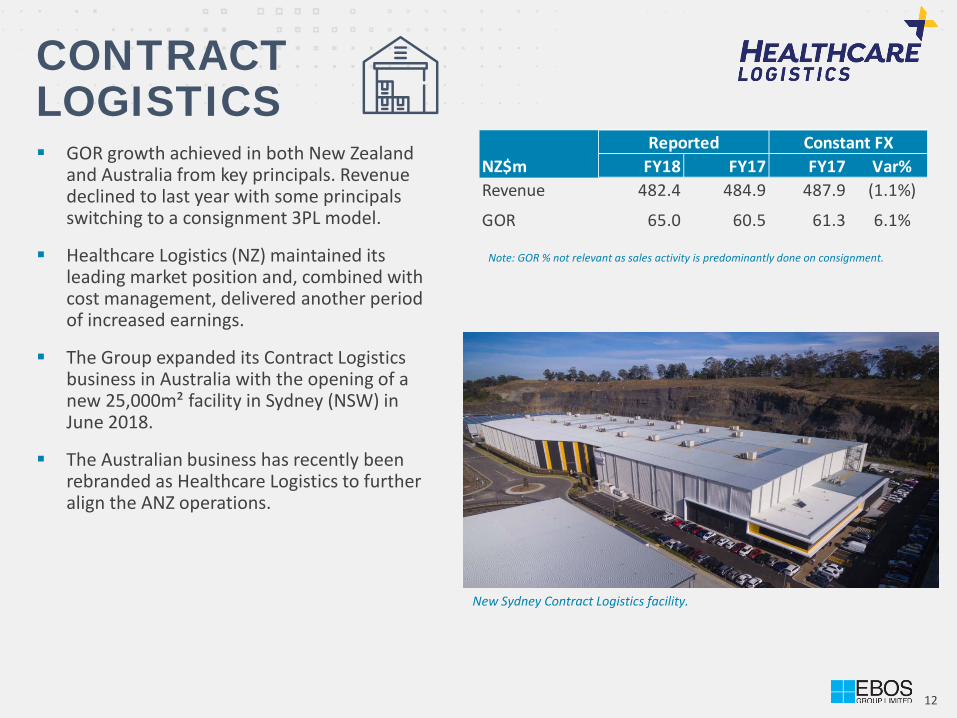
CONTRACT LOGISTICS
New Sydney Contract Logistics facility.
GOR growth achieved in both New Zealand and Australia from key principals. Revenue declined to last year with some principals switching to a consignment 3PL model.
Healthcare Logistics (NZ) maintained its leading market position and, combined with cost management, delivered another period of increased earnings.
The Group expanded its Contract Logistics business in Australia with the opening of a new 25,000m² facility in Sydney (NSW) in June 2018.
The Australian business has recently been rebranded as Healthcare Logistics to further align the ANZ operations.
Note: GOR % not relevant as sales activity is predominantly done on consignment.
NZ$m FY18 FY17 FY17 Var%Revenue 482.4 484.9 487.9 (1.1%)
GOR 65.0 60.5 61.3 6.1%
Constant FXReported
13
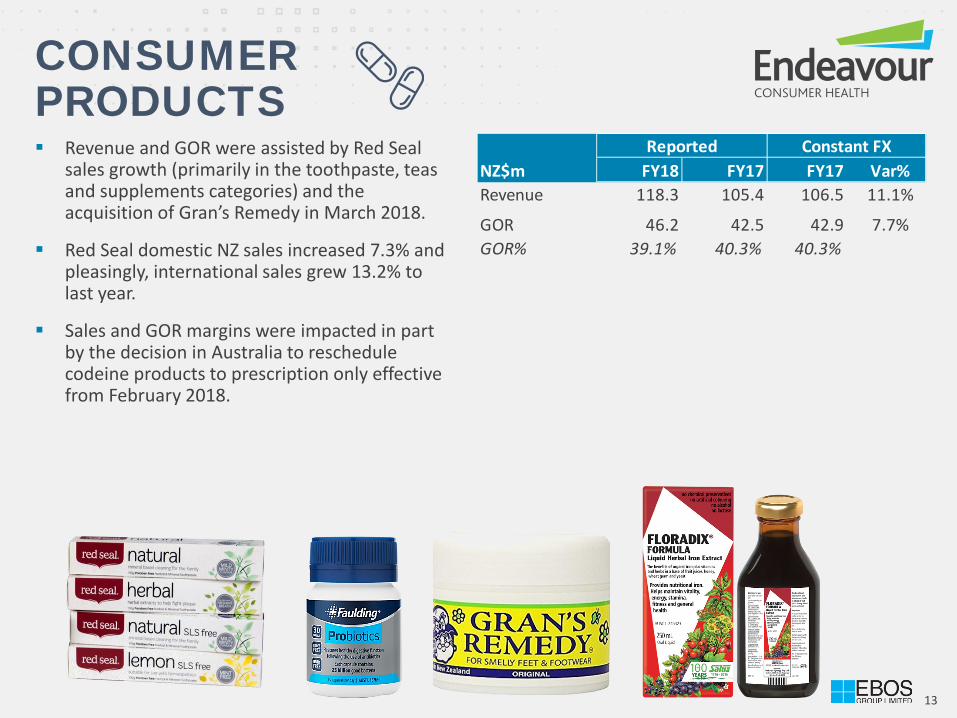
CONSUMER PRODUCTS Revenue and GOR were assisted by Red Seal
sales growth (primarily in the toothpaste, teas and supplements categories) and the acquisition of Gran’s Remedy in March 2018.
Red Seal domestic NZ sales increased 7.3% and pleasingly, international sales grew 13.2% to last year.
Sales and GOR margins were impacted in part by the decision in Australia to reschedule codeine products to prescription only effective from February 2018.
NZ$m FY18 FY17 FY17 Var%Revenue 118.3 105.4 106.5 11.1%
GOR 46.2 42.5 42.9 7.7%GOR% 39.1% 40.3% 40.3%
Constant FXReported
Animal Care Results
15
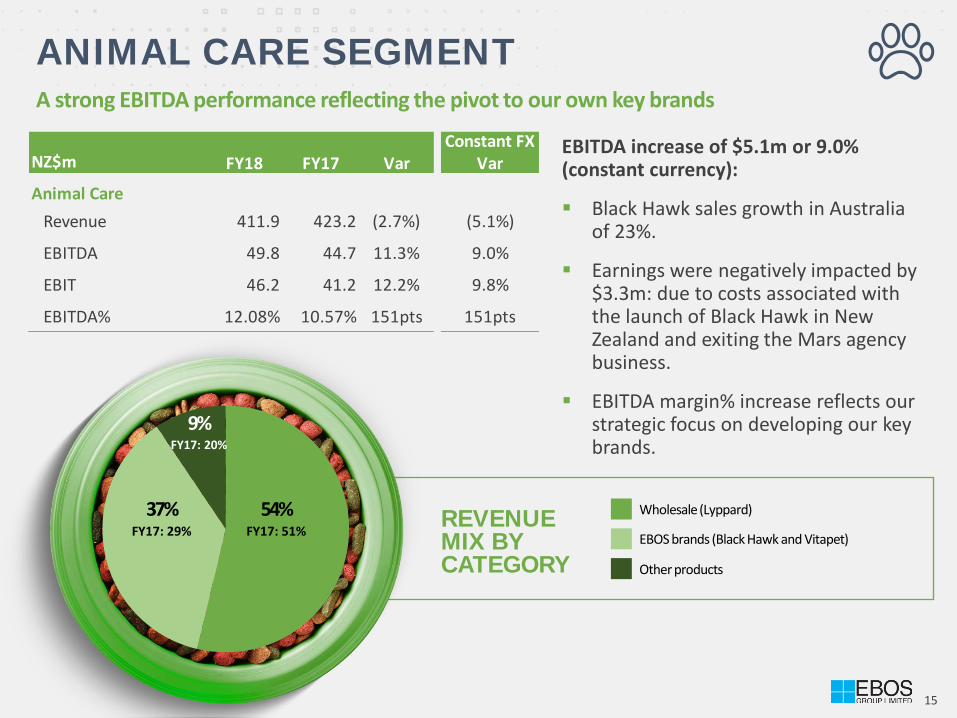
ANIMAL CARE SEGMENT A strong EBITDA performance reflecting the pivot to our own key brands
54% FY17: 51%
37% FY17: 29%
9% FY17: 20%
REVENUE MIX BY CATEGORY
Wholesale (Lyppard)
EBOS brands (Black Hawk and Vitapet)
Other products
EBITDA increase of $5.1m or 9.0% (constant currency):
Black Hawk sales growth in Australia of 23%.
Earnings were negatively impacted by $3.3m: due to costs associated with the launch of Black Hawk in New Zealand and exiting the Mars agency business.
EBITDA margin% increase reflects our strategic focus on developing our key brands.
Constant FXNZ$m FY18 FY17 Var Var
Animal CareRevenue 411.9 423.2 (2.7%) (5.1%)
EBITDA 49.8 44.7 11.3% 9.0%
EBIT 46.2 41.2 12.2% 9.8%
EBITDA% 12.08% 10.57% 151pts 151pts
16
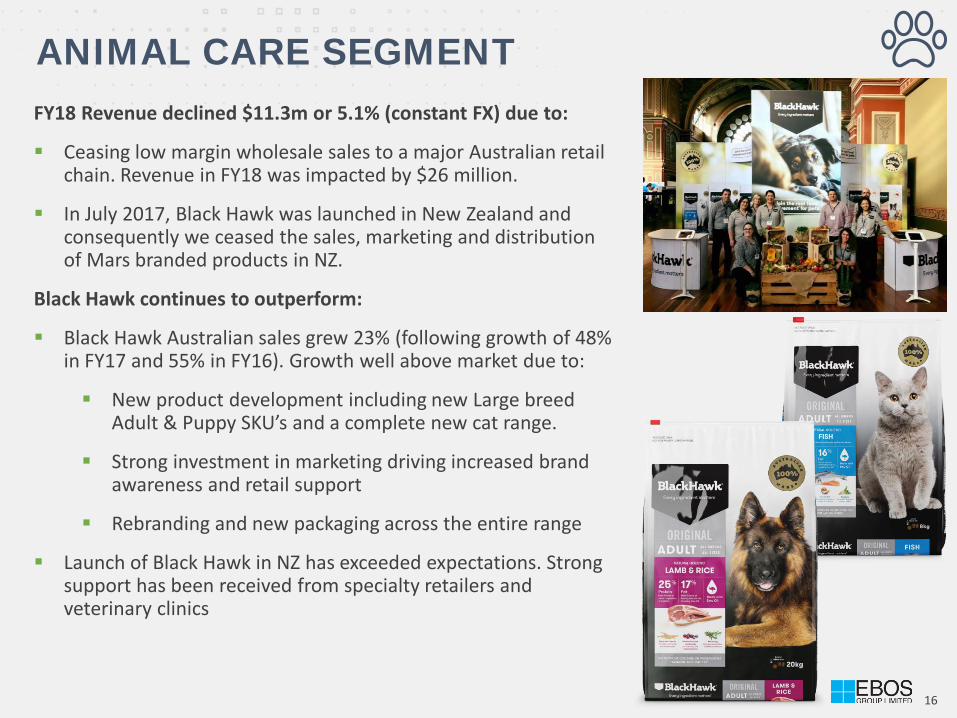
ANIMAL CARE SEGMENT FY18 Revenue declined $11.3m or 5.1% (constant FX) due to:
Ceasing low margin wholesale sales to a major Australian retail chain. Revenue in FY18 was impacted by $26 million.
In July 2017, Black Hawk was launched in New Zealand and consequently we ceased the sales, marketing and distribution of Mars branded products in NZ.
Black Hawk continues to outperform:
Black Hawk Australian sales grew 23% (following growth of 48% in FY17 and 55% in FY16). Growth well above market due to:
New product development including new Large breed Adult & Puppy SKU’s and a complete new cat range.
Strong investment in marketing driving increased brand awareness and retail support
Rebranding and new packaging across the entire range
Launch of Black Hawk in NZ has exceeded expectations. Strong support has been received from specialty retailers and veterinary clinics
Group Financial Information & Outlook
18
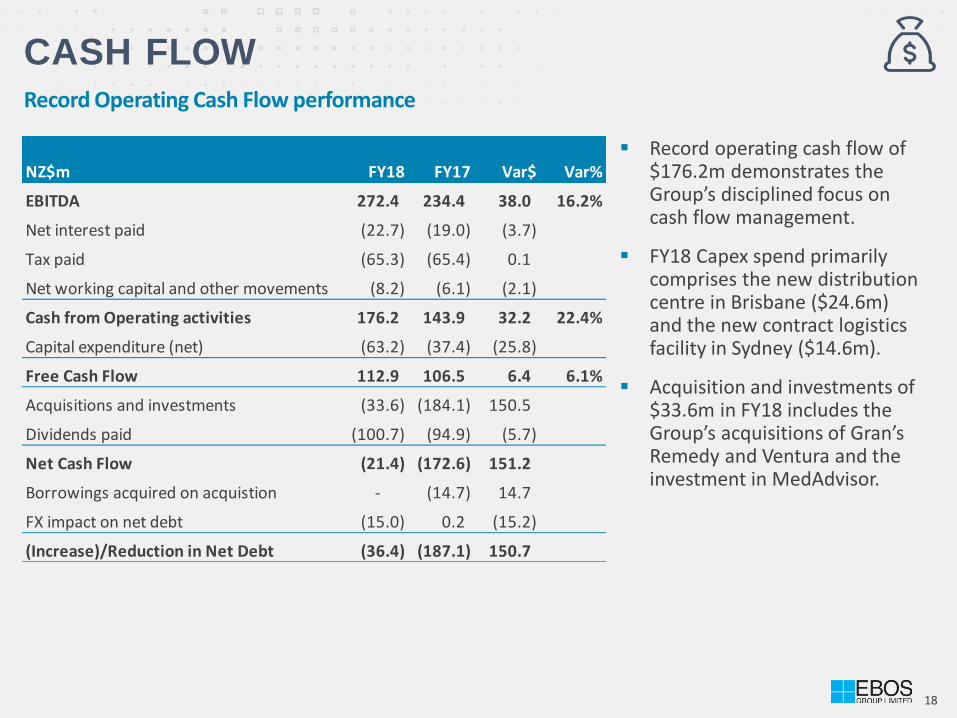
CASH FLOW Record Operating Cash Flow performance
Record operating cash flow of $176.2m demonstrates the Group’s disciplined focus on cash flow management.
FY18 Capex spend primarily comprises the new distribution centre in Brisbane ($24.6m) and the new contract logistics facility in Sydney ($14.6m).
Acquisition and investments of $33.6m in FY18 includes the Group’s acquisitions of Gran’s Remedy and Ventura and the investment in MedAdvisor.
NZ$m FY18 FY17 Var$ Var%
EBITDA 272.4 234.4 38.0 16.2%
Net interest paid (22.7) (19.0) (3.7)
Tax paid (65.3) (65.4) 0.1
Net working capital and other movements (8.2) (6.1) (2.1)
Cash from Operating activities 176.2 143.9 32.2 22.4%
Capital expenditure (net) (63.2) (37.4) (25.8)
Free Cash Flow 112.9 106.5 6.4 6.1%
Acquisitions and investments (33.6) (184.1) 150.5
Dividends paid (100.7) (94.9) (5.7)
Net Cash Flow (21.4) (172.6) 151.2
Borrowings acquired on acquistion - (14.7) 14.7
FX impact on net debt (15.0) 0.2 (15.2)
(Increase)/Reduction in Net Debt (36.4) (187.1) 150.7
19
WORKING CAPITAL AND ROCE Working Capital Return on Capital Employed
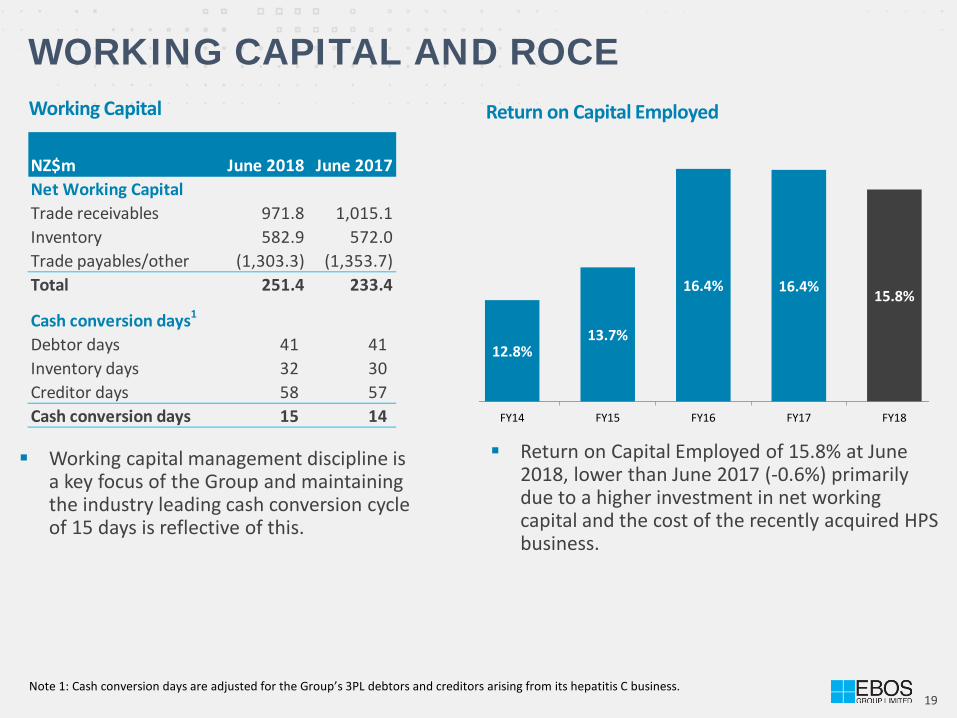
Working capital management discipline is a key focus of the Group and maintaining the industry leading cash conversion cycle of 15 days is reflective of this.
Return on Capital Employed of 15.8% at June 2018, lower than June 2017 (-0.6%) primarily due to a higher investment in net working capital and the cost of the recently acquired HPS business.
Note 1: Cash conversion days are adjusted for the Group’s 3PL debtors and creditors arising from its hepatitis C business.
NZ$m June 2018 June 2017Net Working CapitalTrade receivables 971.8 1,015.1Inventory 582.9 572.0Trade payables/other (1,303.3) (1,353.7)Total 251.4 233.4
Cash conversion days1
Debtor days 41 41 Inventory days 32 30 Creditor days 58 57 Cash conversion days 15 14
12.8%13.7%
16.4% 16.4% 15.8%
FY14 FY15 FY16 FY17 FY18
20
NET DEBT, GEARING AND MATURITY PROFILE Net Debt and Gearing
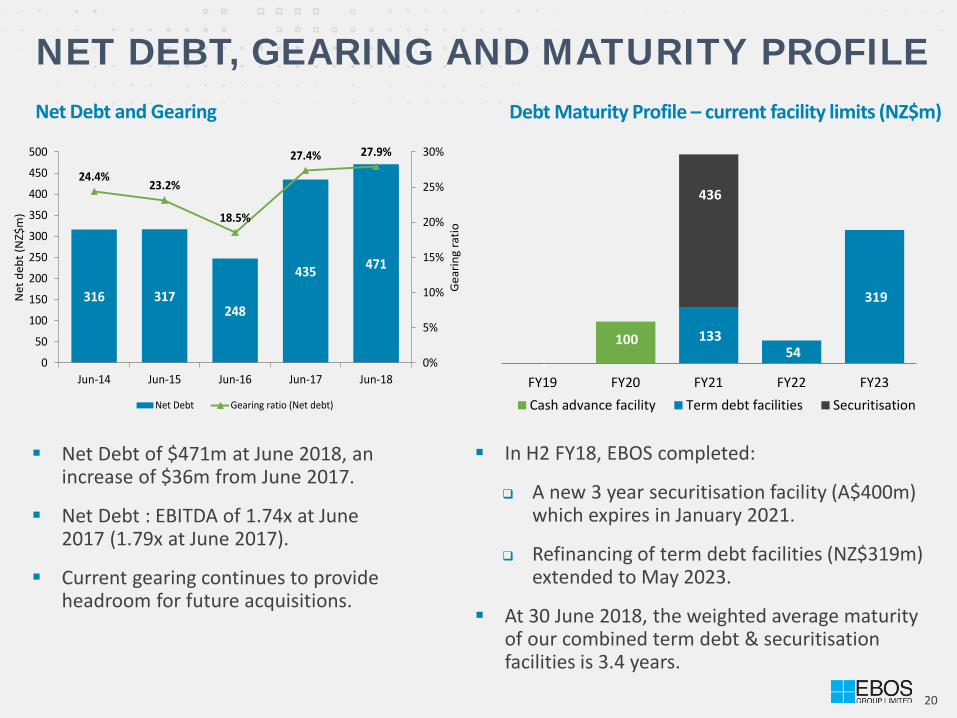
Net Debt of $471m at June 2018, an increase of $36m from June 2017.
Net Debt : EBITDA of 1.74x at June 2017 (1.79x at June 2017).
Current gearing continues to provide headroom for future acquisitions.
Debt Maturity Profile – current facility limits (NZ$m)
In H2 FY18, EBOS completed:
A new 3 year securitisation facility (A$400m) which expires in January 2021.
Refinancing of term debt facilities (NZ$319m) extended to May 2023.
At 30 June 2018, the weighted average maturity of our combined term debt & securitisation facilities is 3.4 years.
316 317248
435 471
24.4%23.2%
18.5%
27.4% 27.9%
0%
5%
10%
15%
20%
25%
30%
0
50
100
150
200
250
300
350
400
450
500
Jun-14 Jun-15 Jun-16 Jun-17 Jun-18
Gea
ring
ratio
Net
deb
t (N
Z$m
)
Net Debt Gearing ratio (Net debt)
100
-
133 54
319
436
FY19 FY20 FY21 FY22 FY23Cash advance facility Term debt facilities Securitisation
21
EARNINGS AND DIVIDENDS PER SHARE Underlying Earnings Per Share
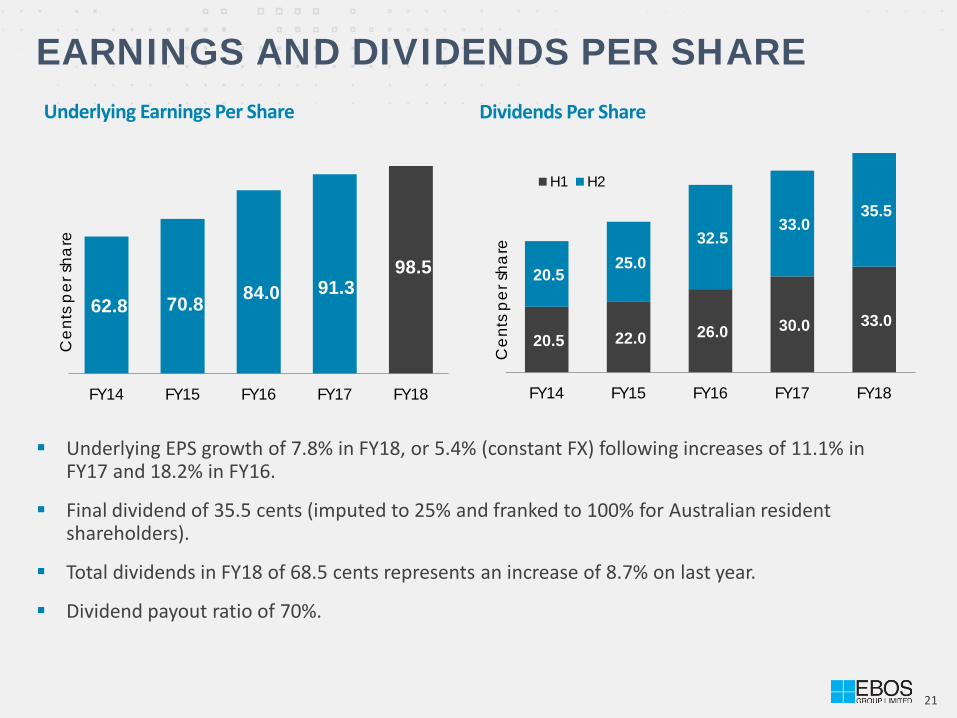
Underlying EPS growth of 7.8% in FY18, or 5.4% (constant FX) following increases of 11.1% in FY17 and 18.2% in FY16.
Final dividend of 35.5 cents (imputed to 25% and franked to 100% for Australian resident shareholders).
Total dividends in FY18 of 68.5 cents represents an increase of 8.7% on last year.
Dividend payout ratio of 70%.
Dividends Per Share
20.5 22.0 26.0 30.0 33.0
20.5 25.0
32.5 33.0
35.5
FY14 FY15 FY16 FY17 FY18
Cen
ts p
er sh
are
H1 H2
62.8 70.8 84.0 91.3 98.5
FY14 FY15 FY16 FY17 FY18
Cen
ts p
er sh
are
22
OUTLOOK
EBOS Group has recorded a strong financial performance in FY18 and the Company is confident of further profit growth into FY19 on an underlying, constant currency basis.
A performance update will be provided to shareholders at the Annual Meeting on 16 October 2018.
With 82% of the Group’s earnings generated from Australia, the statutory results have historically been
significantly impacted by movements in the NZD:AUD exchange rate. In order to reduce this volatility for future periods, the Board has decided to change the Group’s presentation currency from New Zealand dollars to Australian dollars effective 1 July 2018.
CHANGE IN PRESENTATION CURRENCY
Supporting Information
24
0.88 0.89 0.90 0.91 0.92 0.93 0.94 0.95 0.96 0.97 0.98
Jul-1
6
Oct
-16
Jan-
17
Apr-
17
Jul-1
7
Oct
-17
Jan-
18
Apr-
18
Jun-
18
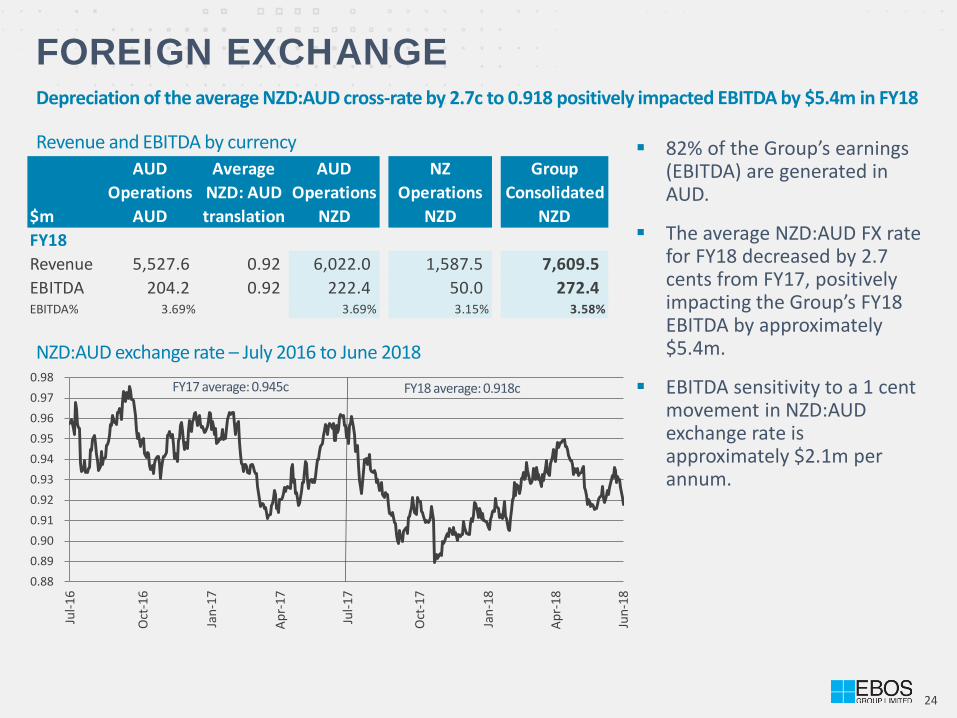
FOREIGN EXCHANGE Depreciation of the average NZD:AUD cross-rate by 2.7c to 0.918 positively impacted EBITDA by $5.4m in FY18
82% of the Group’s earnings (EBITDA) are generated in AUD.
The average NZD:AUD FX rate for FY18 decreased by 2.7 cents from FY17, positively impacting the Group’s FY18 EBITDA by approximately $5.4m.
EBITDA sensitivity to a 1 cent movement in NZD:AUD exchange rate is approximately $2.1m per annum.
Revenue and EBITDA by currency
NZD:AUD exchange rate – July 2016 to June 2018
FY17 average: 0.945c FY18 average: 0.918c
AUD Average AUD NZ GroupOperations NZD: AUD Operations Operations Consolidated
$m AUD translation NZD NZD NZDFY18Revenue 5,527.6 0.92 6,022.0 1,587.5 7,609.5 EBITDA 204.2 0.92 222.4 50.0 272.4 EBITDA% 3.69% 3.69% 3.15% 3.58%
25
Health Care
Animal Care
Pharmacy (Wholesale and retail)
Institutional Healthcare
Contract Logistics
Consumer Products
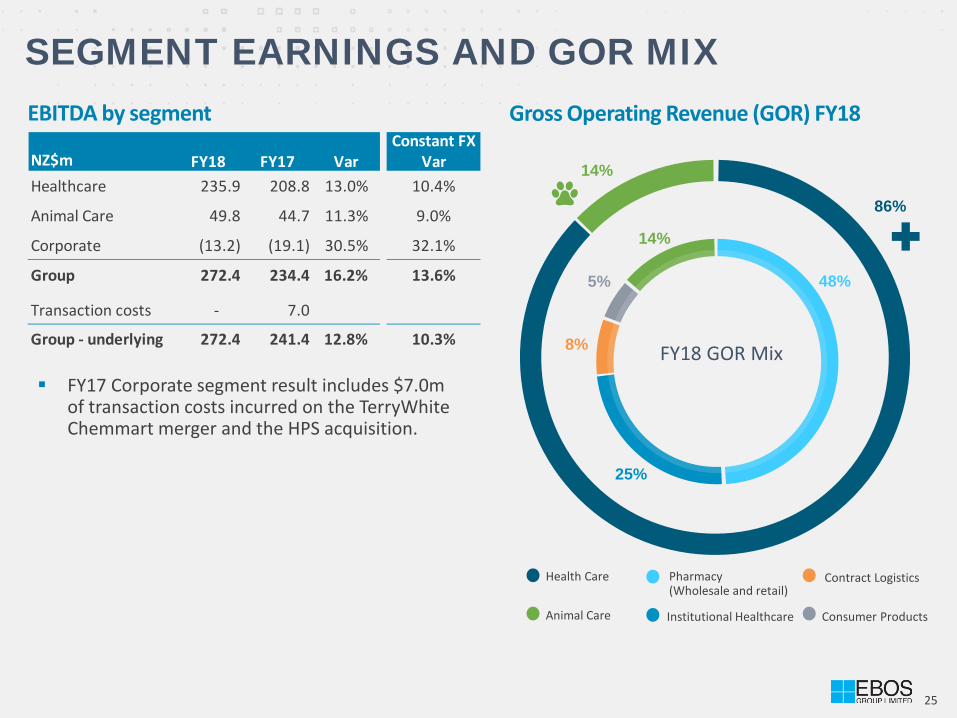
SEGMENT EARNINGS AND GOR MIX EBITDA by segment Gross Operating Revenue (GOR) FY18
5%
14%
14%
25%
8% FY18 GOR Mix
48%
86%
FY17 Corporate segment result includes $7.0m of transaction costs incurred on the TerryWhite Chemmart merger and the HPS acquisition.
Constant FXNZ$m FY18 FY17 Var VarHealthcare 235.9 208.8 13.0% 10.4%
Animal Care 49.8 44.7 11.3% 9.0%
Corporate (13.2) (19.1) 30.5% 32.1%
Group 272.4 234.4 16.2% 13.6%
Transaction costs - 7.0
Group - underlying 272.4 241.4 12.8% 10.3%
26
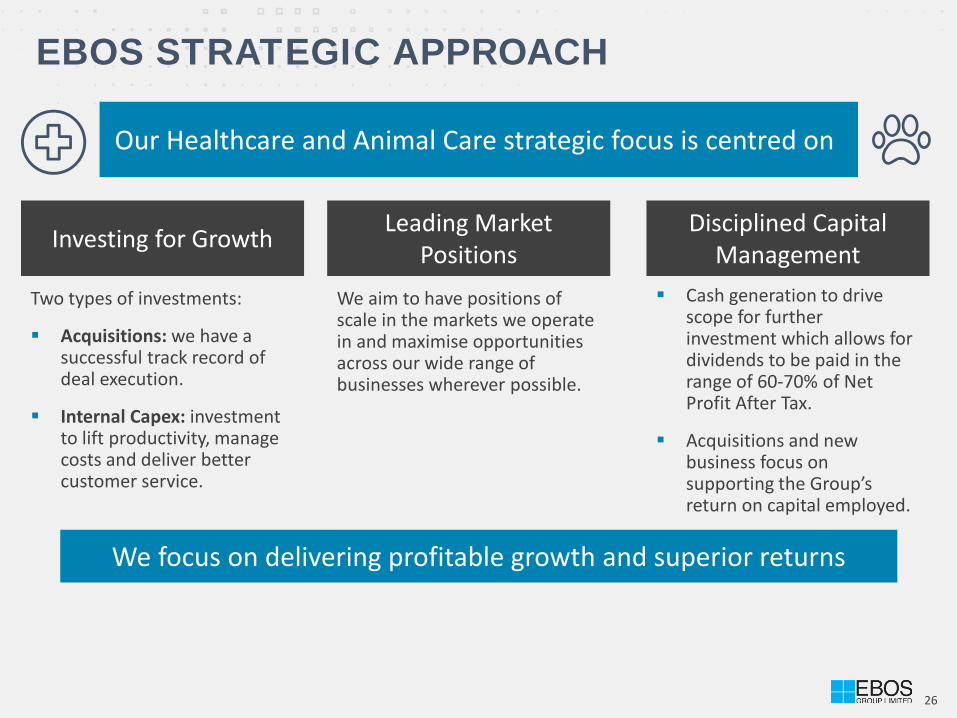
EBOS STRATEGIC APPROACH
Investing for Growth
Our Healthcare and Animal Care strategic focus is centred on
We focus on delivering profitable growth and superior returns
Leading Market Positions
Disciplined Capital Management
Two types of investments:
Acquisitions: we have a successful track record of deal execution.
Internal Capex: investment to lift productivity, manage costs and deliver better customer service.
Cash generation to drive scope for further investment which allows for dividends to be paid in the range of 60-70% of Net Profit After Tax.
Acquisitions and new business focus on supporting the Group’s return on capital employed.
We aim to have positions of scale in the markets we operate in and maximise opportunities across our wide range of businesses wherever possible.
27
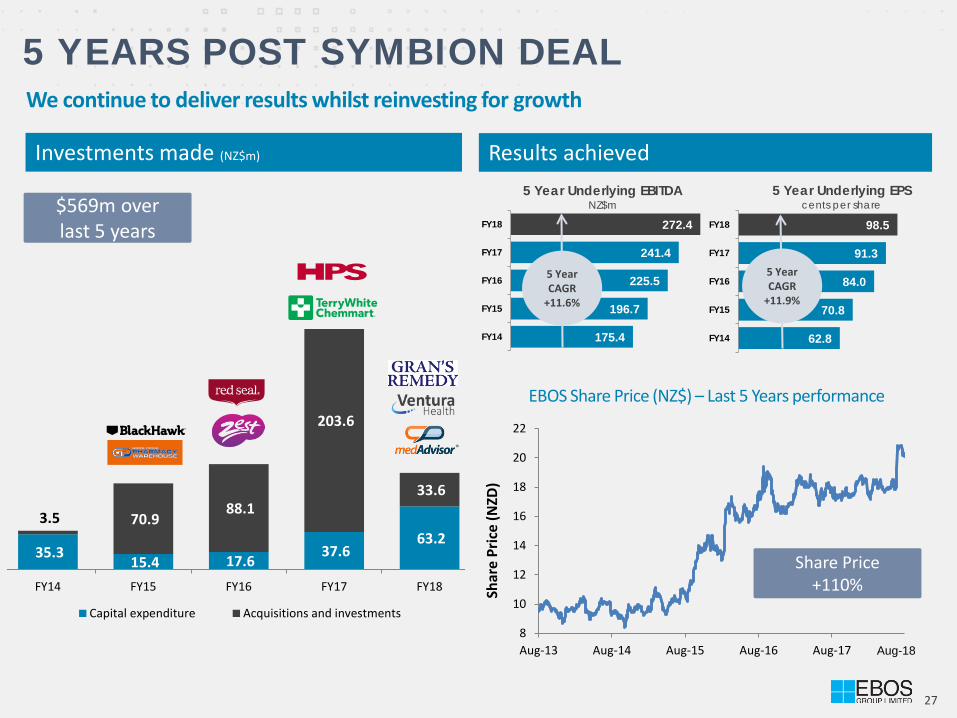
175.4
196.7
225.5
241.4
272.4
FY14
FY15
FY16
FY17
FY18
5 Year Underlying EBITDA NZ$m
8
10
12
14
16
18
20
22
Aug-13 Aug-14 Aug-15 Aug-16 Aug-17
Shar
e Pr
ice
(NZD
)
5 YEARS POST SYMBION DEAL We continue to deliver results whilst reinvesting for growth
Investments made (NZ$m) Results achieved
$569m over last 5 years
Share Price +110%
EBOS Share Price (NZ$) – Last 5 Years performance
62.8
70.8
84.0
91.3
98.5
FY14
FY15
FY16
FY17
FY18
5 Year Underlying EPS cents per share
35.3 15.4 17.6 37.6 63.2
3.5 70.9 88.1
203.6
33.6
FY14 FY15 FY16 FY17 FY18
Capital expenditure Acquisitions and investments
5 Year CAGR
+11.6%
5 Year CAGR
+11.9%
Aug-18
28
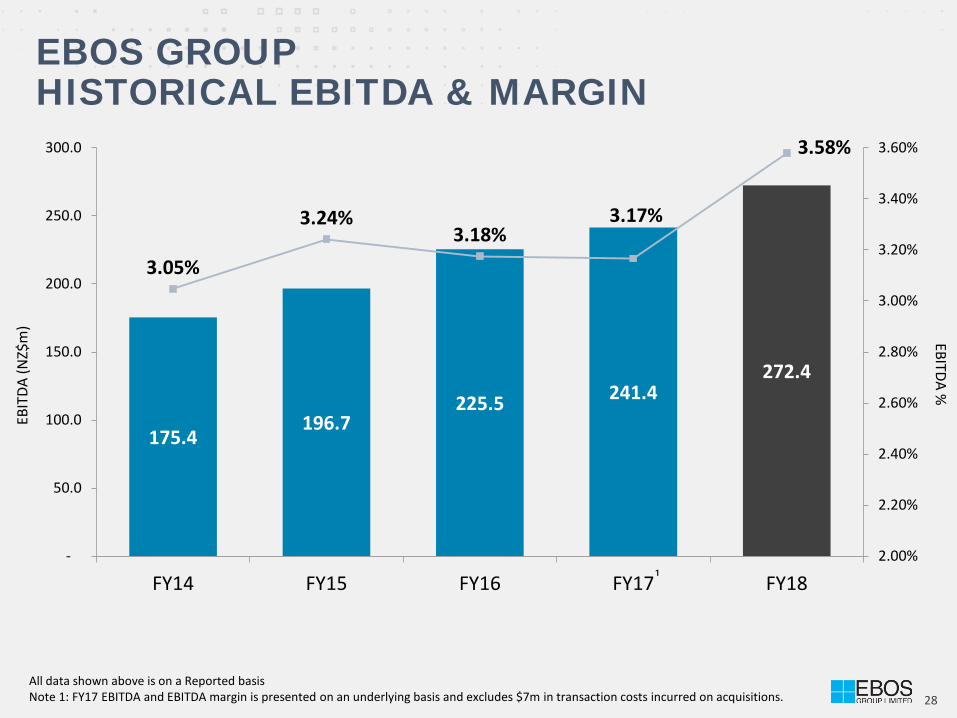
175.4 196.7
225.5 241.4 272.4
3.05%
3.24% 3.18%
3.17%
3.58%
2.00%
2.20%
2.40%
2.60%
2.80%
3.00%
3.20%
3.40%
3.60%
-
50.0
100.0
150.0
200.0
250.0
300.0
FY14 FY15 FY16 FY17 FY18
EBOS GROUP HISTORICAL EBITDA & MARGIN
All data shown above is on a Reported basis Note 1: FY17 EBITDA and EBITDA margin is presented on an underlying basis and excludes $7m in transaction costs incurred on acquisitions.
EBIT
DA (N
Z$m
) EBITDA %
¹
29
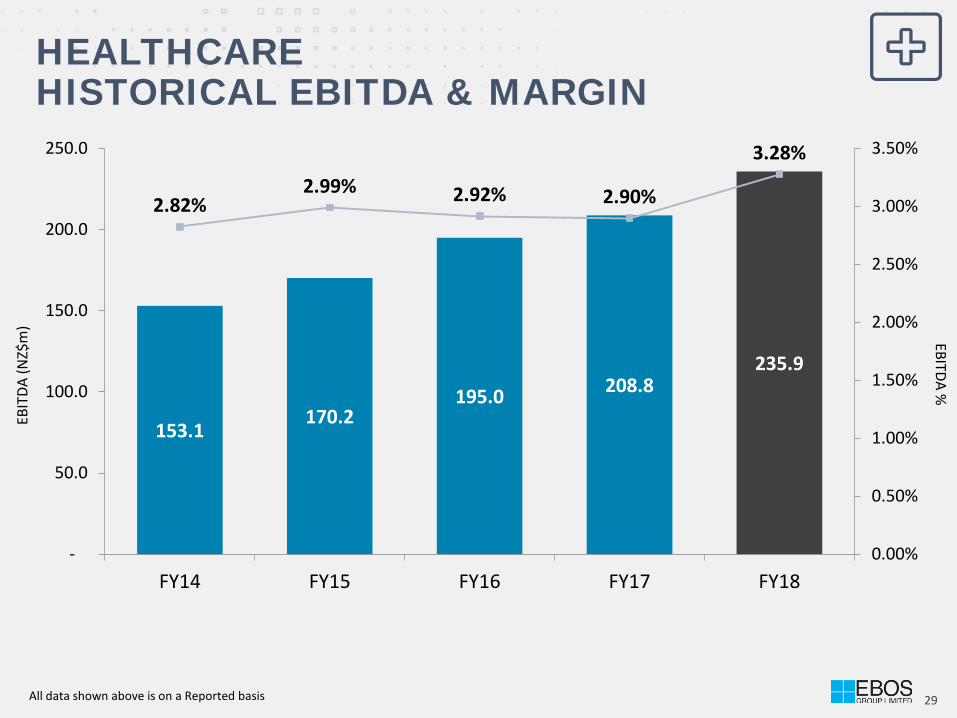
153.1 170.2
195.0 208.8 235.9
2.82% 2.99% 2.92% 2.90%
3.28%
0.00%
0.50%
1.00%
1.50%
2.00%
2.50%
3.00%
3.50%
-
50.0
100.0
150.0
200.0
250.0
FY14 FY15 FY16 FY17 FY18
HEALTHCARE HISTORICAL EBITDA & MARGIN
EBIT
DA (N
Z$m
) EBITDA %
All data shown above is on a Reported basis
30
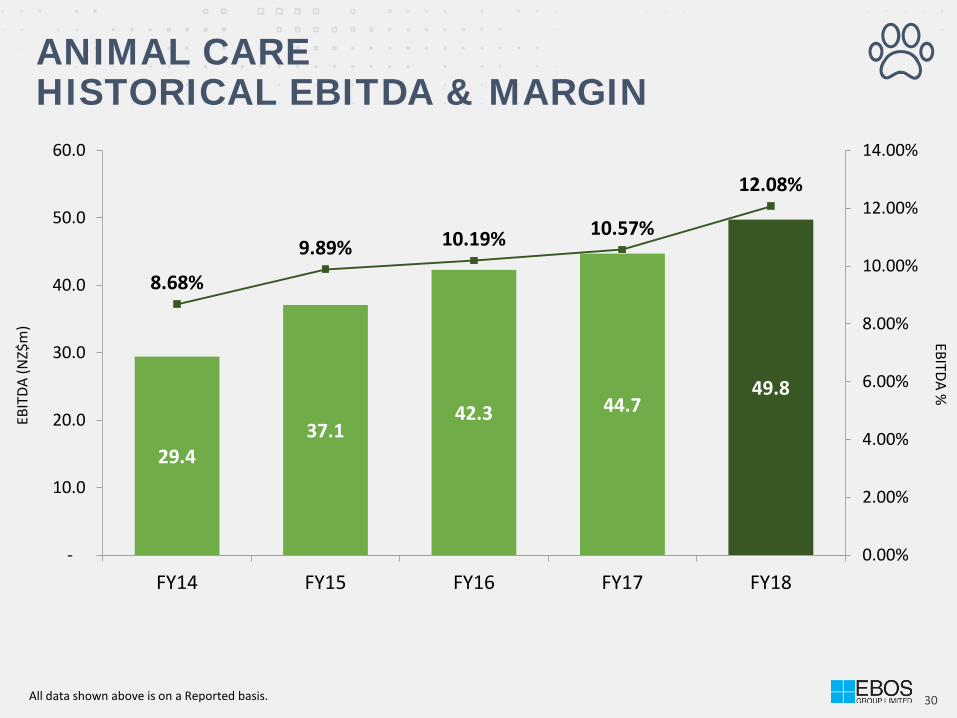
ANIMAL CARE HISTORICAL EBITDA & MARGIN
EBIT
DA (N
Z$m
) EBITDA %
29.4 37.1
42.3 44.7 49.8
8.68%
9.89% 10.19% 10.57%
12.08%
0.00%
2.00%
4.00%
6.00%
8.00%
10.00%
12.00%
14.00%
-
10.0
20.0
30.0
40.0
50.0
60.0
FY14 FY15 FY16 FY17 FY18
All data shown above is on a Reported basis.

31
GLOSSARY OF TERMS AND MEASURES
Term Definition
Actual results Results translated into NZ dollars at the applicable actual monthly exchange rates ruling in each period.
Debtor days Trade debtors at the end of period divided by Revenue for the period, multiplied by number of days in the period.
Inventory days Inventory at the end of period divided by Cost of Sales for the period, multiplied by number of days in the period.
Creditor days Trade creditors at the end of period divided by Cost of Sales for the period, multiplied by number of days in the period.
Constant FX/currency
Calculated by translating the prior period results into NZ dollars at the actual monthly exchange rates applicable in the current period.
Revenue Revenue from the sale of goods and the rendering of services.
Gross Operating Revenue (GOR)
Revenue less cost of sales and the write-down of inventory.
EBIT Earnings before interest and tax.
EBITDA Earnings before interest, tax, depreciation and amortisation.
Underlying EBITDA Earnings before interest, tax, depreciation, amortisation and transaction costs relating to acquisitions.
NPAT Net Profit After Tax attributable to the owners of the company.
Underlying NPAT Net Profit After Tax attributable to the owners of the company and before transaction costs relating to acquisitions.
Free Cash Flow Cash from operations less capital expenditure net of proceeds from disposals.
Earnings per share (EPS)
Net Profit after tax divided by the weighted average number of shares on issue during the period in accordance with IAS 33 ‘Earnings per share’.
Underlying EPS NPAT excluding transaction costs on acquisitions, divided by the weighted average number of shares on issue during the period .
Net Debt : EBITDA Ratio of net debt at period end to the last 12 months EBITDA, adjusting for pre acquisition earnings of acquisitions for the period.
Return on Capital Employed (ROCE)
Measured as underlying earnings before interest, tax and amortisation of finite life intangibles for 12 months divided by closing capital employed (including a pro-rata adjustment for entities acquired and excluding amounts for significant capital projects yet to complete and strategic investments).
Except where noted, common terms and measures used in this document are based upon the following definitions:
www.ebosgroup.com