investor presentation park city group: vision randy fields · pdf fileinvestor presentation...
TRANSCRIPT

Park City Group: VisionConsumer Driven Sales Optimization™
Investor Presentation
Randy Fields
November 2009
OTCBB: PCYGwww.parkcitygroup.com

2
Specializes in Unique Supply Chain Solutions for Retailers and Suppliers
Reasons To Invest in Park City Group
Recurring revenue model with multiple year visibility Only scan based trading platform in the world Marquis customer list Beneficiary of the current economic backdrop Patent protected technology solution

3
Impactful Board of Directors
Randy Fields, Chairman & CEO - Co-founder, Mrs. Fields CookiesRobert Allen – former CEO of Southern Belle DairyPeter Brennan – private brand authority and Vice Chairman of
Daymon Worldwide James Gillis - Co-CEO of Source Interlink Companies, Inc., a
marketing and fulfillment company of entertainment productsBob Hermanns, SVP – Former CEO of Associated GrocersRichard Jacobsen – CEO, Time Inc. Retail Sales and MarketingRichard Krause –CEO of New England Confectionery Company
Industry Experts & Access to Customers

4
Our Target Market
All Major Retail Channels– Grocery, specialty, home
improvement, office supply, arts & crafts, sporting goods, electronics, etc…
All Consumer Goods Suppliers
- Clorox, Crayola, Warner Lambert, Johnson & Johnson, Titleist, Adidas, Kraft Foods, 3M, etc…

5
Select Retail CustomersGROCERYGROCERY DRUG & DRUG &
CONVENIENCECONVENIENCEMASS &MASS &
SPECIALTYSPECIALTY

6
Select Supplier CustomersBREAD &BREAD &BAKERYBAKERY
PRODUCEPRODUCE
JUICEJUICE
DAIRY &DAIRY &SNACKSSNACKS
CENTER CENTER STORESTORE
CONFECTIONCONFECTION
7
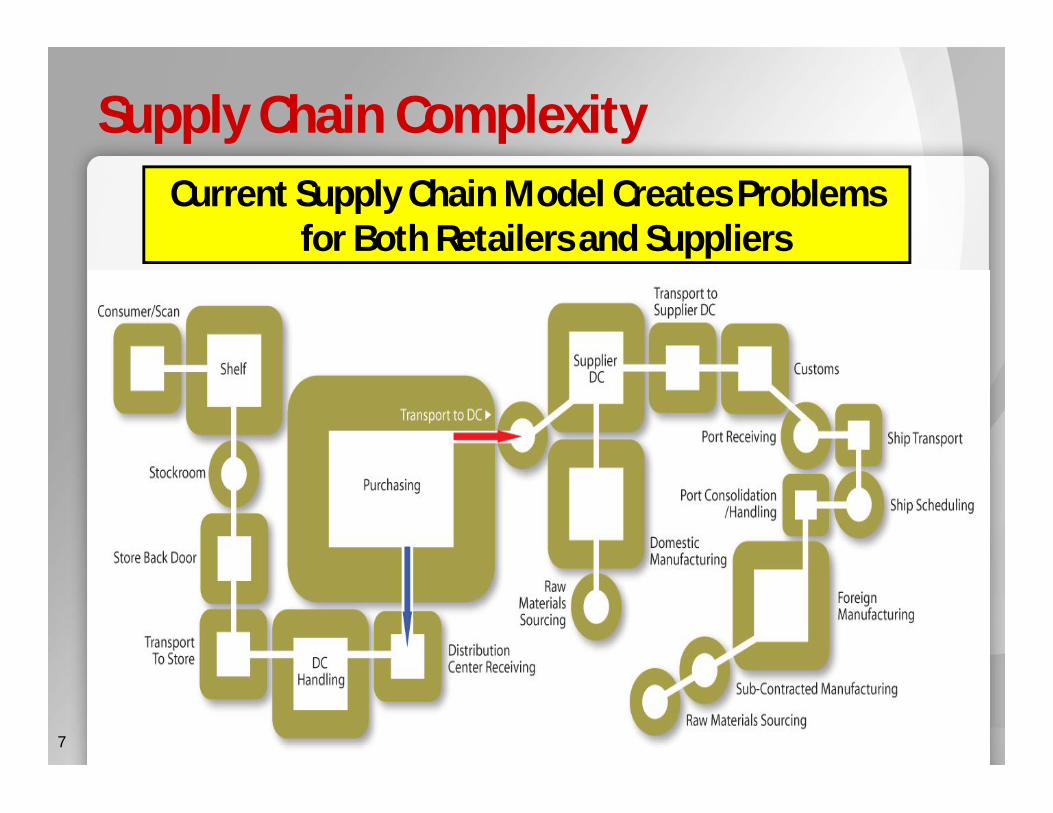
Supply Chain ComplexityCurrent Supply Chain Model Creates Problems
for Both Retailers and Suppliers

8
Retailer Concerns
Balance sheets are highly leveraged
Pressure to reduce inventory– Out-of-stocks
– Lost sales
– Reduced consumer loyalty
Consumer behavior is changing
Increasingly adversarial relationships with suppliers
Wal-Mart factor

9
Supplier Concerns
Sell to Retailers – not consumers– Paid at the retailer’s discretion
Increased private label penetration– Impacting shelf space allocation
– Reducing brand loyalty
Promotional spending effectiveness
Increasingly adversarial relationships with retailers
Supply chain visibility & complexity

10
Consumer Driven Sales OptimizationTM
Retailer and supplier data synchronization
Scan based trading
Visibility and analytics
Store level replenishment
Vendor managed inventory
Demand planning
Production planning
We Convert Information into CA$H!
Suite of Technology and Services That Tame the Supply Chain Beast
11
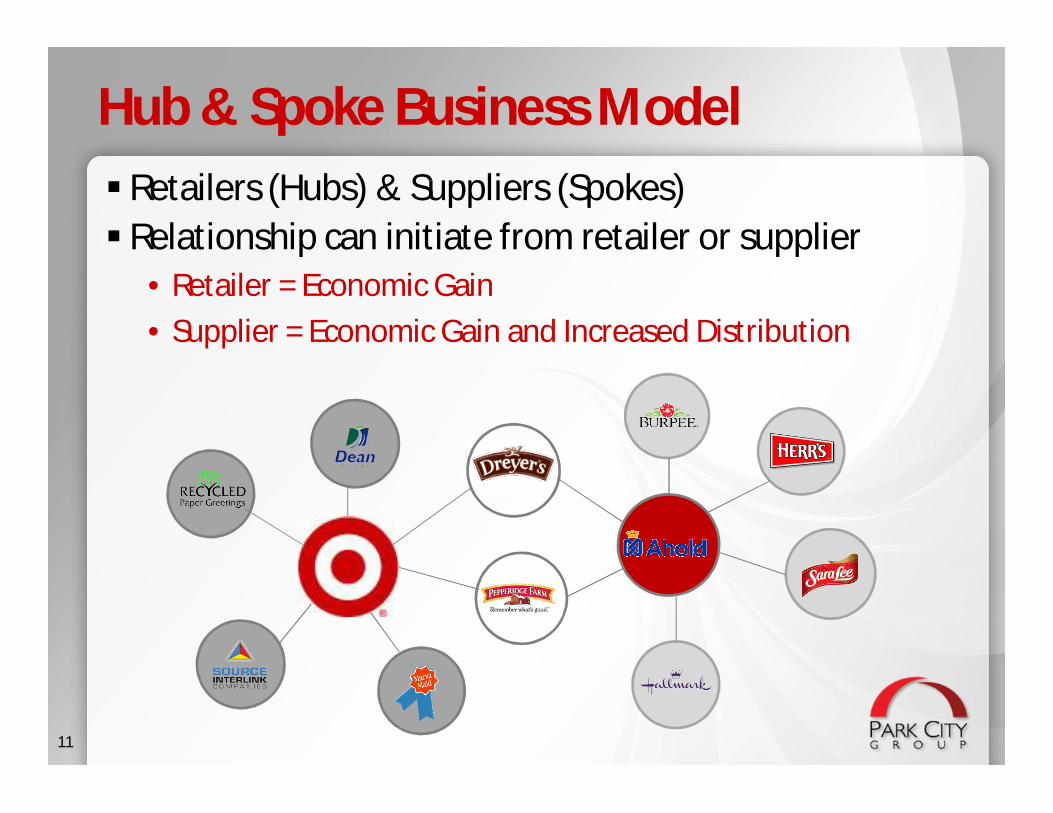
Retailers (Hubs) & Suppliers (Spokes) Relationship can initiate from retailer or supplier
• Retailer = Economic Gain• Supplier = Economic Gain and Increased Distribution
Hub & Spoke Business Model

12
Our Model

13
How The Retailer (Hub) Benefits
Increased Sales
Reduced Out-of-Stocks
Lower Inventories
Labor Savings
Improved Customer Experience

14
How The Supplier (Spoke) Benefits
Improved Sales
Reduced Financial Risk
Promotional Spending Efficiency
Reduced Slotting Fees
Better Demand and Production Planning
Provide Information Much like Wal-Mart

15
Benefits of Consumer Drives Sales Optimization
Area of Measure Impact*
Sales Increased 3% - 10%
Inventory Reduced 10% - 30%
Working Capital Decreased 10% - 15%
Shrink Reduced .2% - 2%
*Based on 15 years experience and hundreds of implementations
16
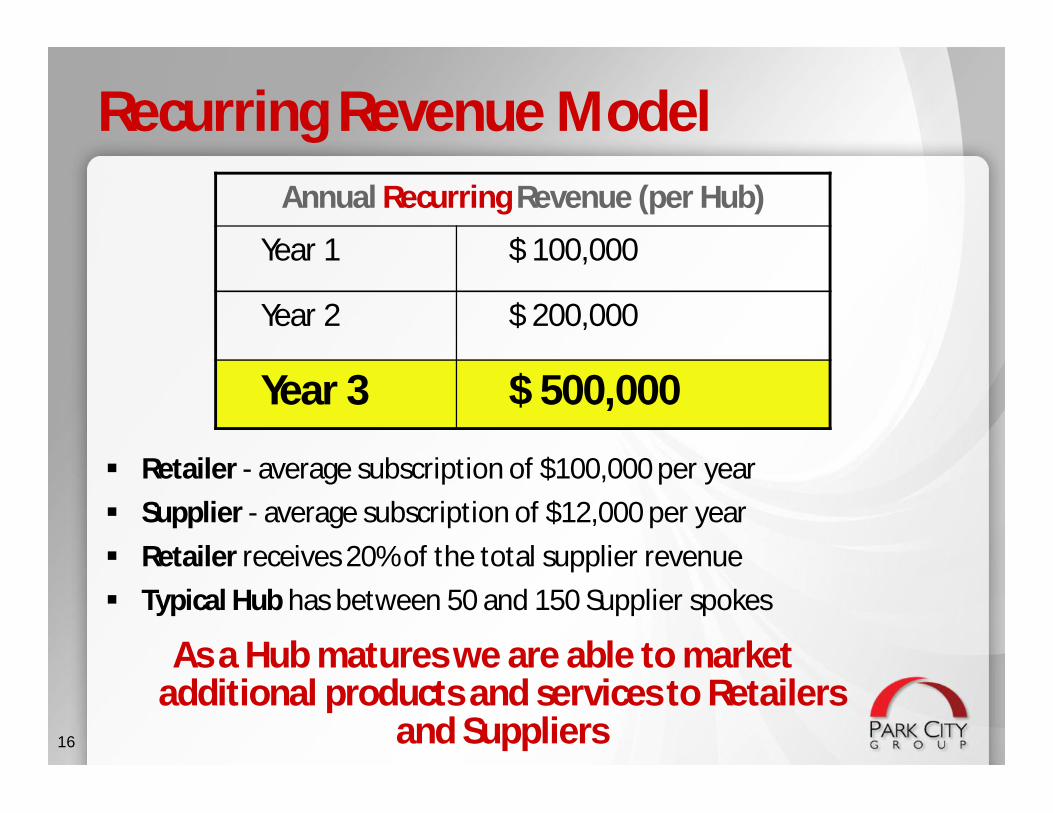
Recurring Revenue Model
Retailer - average subscription of $100,000 per year Supplier - average subscription of $12,000 per year Retailer receives 20% of the total supplier revenue Typical Hub has between 50 and 150 Supplier spokes
As a Hub matures we are able to market additional products and services to Retailers
and Suppliers
Annual Recurring Revenue (per Hub)
Year 1 $ 100,000
Year 2 $ 200,000
Year 3 $ 500,000

17
Basic Retailer & Supplier Matrix

18
Penetration of Additional Services Drives Exponential Revenue Growth
19
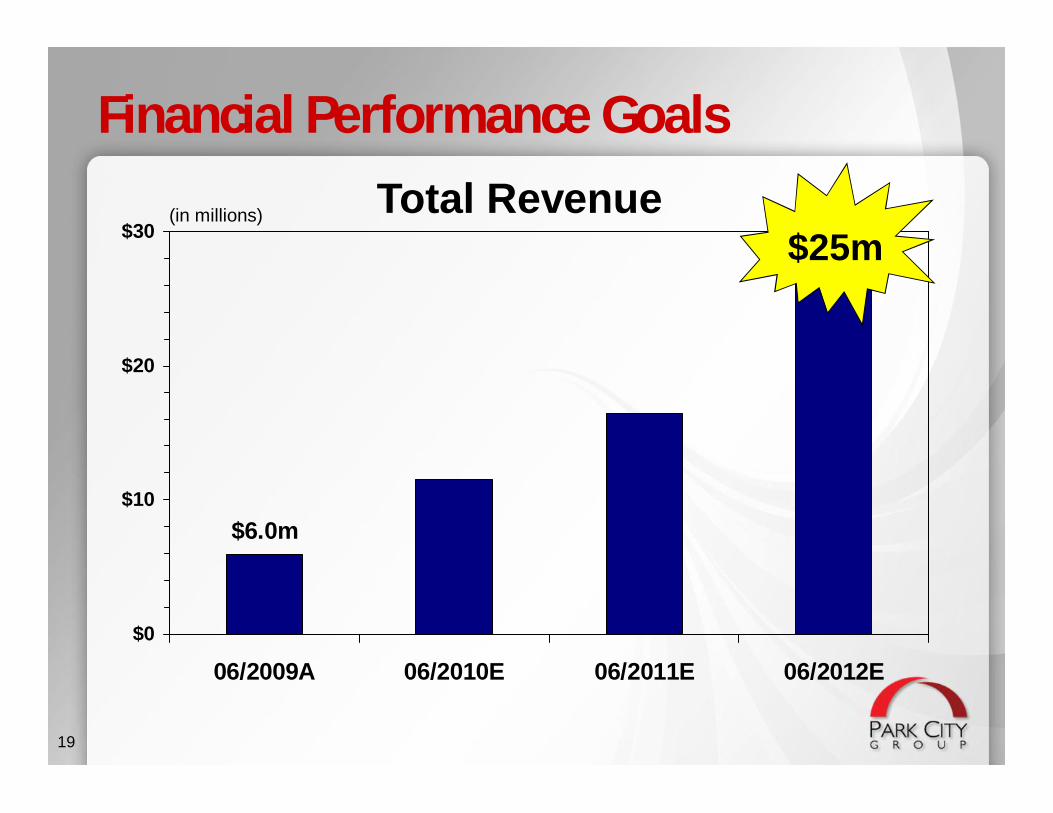
$6.0m
$0
$10
$20
$30
06/2009A 06/2010E 06/2011E 06/2012E
$25m(in millions) Total Revenue
Financial Performance Goals

20
$357,000$0
$5
$10
$15
$20
06/2009A 06/2010E 06/2011E 06/2012E
$13m
(1) Earnings before interest, taxes, depreciation and amortization
(2)
(2) On an adjusted pro-forma basis
(in millions)EBITDA(1)
Fiscal 2010 Will Be the Breakout Year
Financial Performance Goals

21
-$0.48
-$0.75
-$0.25
$0.25
$0.75
$1.25
06/2009A 06/2010E 06/2011E 06/2012E
$1.00Earnings Per Share
Financial Performance Goals

22
Patented, One-of-a-Kind Technology Platform
Market Credibility and Experience Through Our Founder, Randy Fields of Mrs. Fields Cookies
Superior Sales and Operational Management Team
Deep Consumer Packaged Goods and Retailer Experience
Access to Many Global C-Level Decision Makers
22
Summary: Our Competitive Advantage

23
Traditional Supply Chain Model

24
Our Model
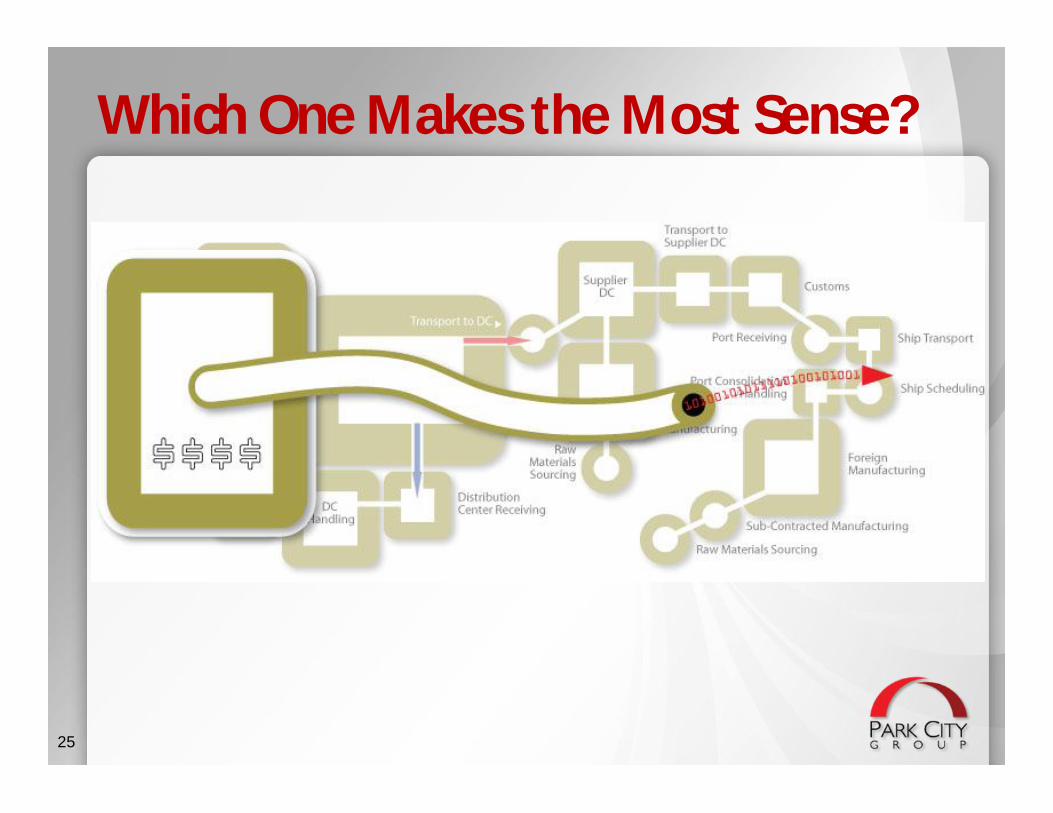
25
Which One Makes the Most Sense?

26
Forward-Looking StatementStatements in this presentation that relate to Park City Group's future plans, objectives,expectations, performance, events and the like are "forward-looking statements" within themeaning of the Private Securities Litigation Reform Act of 1995 and the Securities ExchangeAct of 1934. Future events, risks and uncertainties, individually or in the aggregate, couldcause actual results to differ materially from those expressed or implied in these statements.Those factors could include changes in economic conditions that may change demand for theCompany's products and services and other factors discussed in the "forward-lookinginformation" section and the "risk factor" section of the management's discussion andanalysis included in the Company's report on Form 10-K for the year ended June 30, 2009 orcurrent reports on Form 8-K filed with the Securities and Exchange Commission. Thispresentation is comprised of interrelated information that must be interpreted in the context ofall of the information provided and care should be exercised not to consider portions of thisrelease out of context. Park City Group uses paid services of investor relations organizationsto promote the Company to the investment community. Investments in any company shouldbe considered speculative and prior to acquisition, should be thoroughly researched. ParkCity Group does not intend to update these forward-looking statements prior toannouncement of quarterly or annual results.
Randy FieldsT: (435) 645-2100