investor presentation q2 13 - bmo 2013 investor presentation.pdfpcl 0.11 0.15 net income 1.0 1.0 eps...
TRANSCRIPT
Investor PresentationJune 6, 2013
Q2 13

2Investor Presentation | Q2 2013
Forward Looking Statements & Non-GAAP Measures
Caution Regarding Forward-Looking Statements
Bank of Montreal’s public communications often include written or oral forward-looking statements. Statements of this type are included in this document, and may be included in other filings with Canadian securities regulators or the U.S. Securities and Exchange Commission, or in other communications. All such statements are made pursuant to the “safe harbor” provisions of, and are intended to be forward-looking statements under, the United States Private Securities Litigation Reform Act of 1995 and any applicable Canadian securities legislation. Forward-looking statements may involve, but are not limited to, comments with respect to our objectives and priorities for 2013 and beyond, our strategies or future actions, our targets, expectations for our financial condition or share price, and the results of or outlook for our operations or for the Canadian and U.S. economies.
By their nature, forward-looking statements require us to make assumptions and are subject to inherent risks and uncertainties. There is significant risk that predictions, forecasts, conclusions or projections will not prove to be accurate, that our assumptions may not be correct and that actual results may differ materially from such predictions, forecasts, conclusions or projections. We caution readers of this document not to place undue reliance on our forward-looking statements as a number of factors could cause actual future results, conditions, actions or events to differ materially from the targets, expectations, estimates or intentions expressed in the forward-looking statements.
The future outcomes that relate to forward-looking statements may be influenced by many factors, including but not limited to: general economic and market conditions in the countries in which we operate; weak, volatile or illiquid capital and/or credit markets; interest rate and currency value fluctuations; changes in monetary, fiscal or economic policy; the degree of competition in the geographic and business areas in which we operate; changes in laws or in supervisory expectations or requirements, including capital, interest rate and liquidity requirements and guidance; judicial or regulatory proceedings; the accuracy and completeness of the information we obtain with respect to our customers and counterparties; our ability to execute our strategic plans and to complete and integrate acquisitions; critical accounting estimates and the effect of changes to accounting standards, rules and interpretations on these estimates; operational and infrastructure risks; changes to our credit ratings; general political conditions; global capital markets activities; the possible effects on our business of war or terrorist activities; disease or illness that affects local, national or international economies; natural disasters and disruptions to public infrastructure, such as transportation, communications, power or water supply; technological changes; and our ability to anticipate and effectively manage risks associated with all of the foregoing factors.
We caution that the foregoing list is not exhaustive of all possible factors. Other factors could adversely affect our results. For more information, please see the discussion below, which outlines in detail certain key factors that may affect Bank of Montreal’s future results. When relying on forward-looking statements to make decisions with respect to Bank of Montreal, investors and others should carefully consider these factors, as well as other uncertainties and potential events, and the inherent uncertainty of forward-looking statements. Bank of Montreal does not undertake to update any forward-looking statements, whether written or oral, that may be made from time to time by the organization or on its behalf, except as required by law. The forward-looking information contained in this document is presented for the purpose of assisting our shareholders in understanding our financial position as at and for the periods ended on the dates presented, as well as our strategic priorities and objectives, and may not be appropriate for other purposes.
Effective the first quarter of 2013, our regulatory capital, risk-weighted assets and regulatory capital ratios have been calculated pursuant to the Capital Adequacy Requirement (CAR) Guideline released by the Office of the Superintendent of Financial Institutions (OSFI) in December 2012 to implement the Basel III Accord in Canada. When calculating the pro-forma impact of Basel III on our regulatory capital (including capital deductions and qualifying and grandfathered ineligible capital), risk-weighted assets and regulatory capital ratios in prior periods, we assumed that our interpretation of OSFI’s draft implementation guideline of rules and amendments announced by the Basel Committee on Banking Supervision (BCBS), and our models used to assess those requirements, were consistent with the final requirements that would be promulgated by OSFI. We have not recalculated our pro-forma Basel III regulatory capital, risk-weighted assets or capital ratios based on the CAR Guideline and references to Basel III pro-forma items refer to these items as previously estimated.
Assumptions about the level of asset sales, expected asset sale prices, net funding cost, credit quality, risk of default and losses on default of the underlying assets of the structured investment vehicle were material factors we considered when establishing our expectations regarding the structured investment vehicle, including the adequacy of first-loss protection. Key assumptions included that assets will continue to be sold with a view to reducing the size of the structured investment vehicle, under various asset price scenarios, and that the level of default and losses will be consistent with the credit quality of the underlying assets and our current expectations regarding continuing difficult market conditions.
Assumptions about the level of default and losses on default were material factors we considered when establishing our expectations regarding the future performance of the transactions into which our credit protection vehicle has entered. Among the key assumptions were that the level of default and losses on default will be consistent with historical experience. Material factors that were taken into account when establishing our expectations regarding the future risk of credit losses in our credit protection vehicle and risk of loss to Bank of Montreal included industry diversification in the portfolio, initial credit quality by portfolio, the first-loss protection incorporated into the structure and the hedges into which Bank of Montreal has entered.
Assumptions about the performance of the Canadian and U.S. economies, as well as overall market conditions and their combined effect on our business, are material factors we consider when determining our strategic priorities, objectives and expectations for our business. In determining our expectations for economic growth, both broadly and in the financial services sector, we primarily consider historical economic data provided by the Canadian and U.S. governments and their agencies. See the Economic Review and Outlook section in Bank of Montreal’s Second Quarter 2013 Report to Shareholders.
Non-GAAP Measures
Bank of Montreal uses both GAAP and non-GAAP measures to assess performance. Readers are cautioned that earnings and other measures adjusted to a basis other than GAAP do not have standardized meanings under GAAP and are unlikely to be comparable to similar measures used by other companies. Reconciliations of GAAP to non-GAAP measures as well as the rationale for their use can be found in Bank of Montreal’s Second Quarter 2013 Report to Shareholders and Bank of Montreal’s 2012 Management’s Discussion and Analysis, all of which are available on our website at www.bmo.com/investorrelations.
Examples of non-GAAP amounts or measures include: efficiency and leverage ratios; revenue and other measures presented on a taxable equivalent basis (teb); amounts presented net of applicable taxes; adjusted net income, revenues, provision for credit losses, specific provision for credit losses, expenses, earnings per share, effective tax rate, ROE, efficiency ratio and other adjusted measures which exclude the impact of certain items such as credit-related items on the acquired M&I performing loans, run-off structured credit activities, M&I integration costs, amortization of acquisition-related intangibles, decrease (increase) in collective allowance for credit losses and restructuring costs.
Bank of Montreal provides supplemental information on combined business segments to facilitate comparisons to peers.

3Investor Presentation | Q2 2013
Other Information
Quarterly Dividend $0.74
Listings NYSE, TSX (Ticker: BMO)
Share Price (April 30, 2013)
TSX C$63.19
NYSE US$62.71
Market Cap (April 30, 2013) C$41 billion
Employees 46,580
Q2 13 Results (C$ billions) Adjusted2 Reported
Revenue 3.8 3.9
PCL 0.11 0.15
Net Income 1.0 1.0
EPS ($) 1.46 1.42
ROE (%) 14.5 14.2
Average Assets 555 555
Basel III Common Equity Tier 1 Ratio (%)3 9.7% 9.7%
BMO Financial Group8th largest bank in North America1; 2nd largest Canadian bank by retail branches in Canada and the U.S.
2 Adjusted measures are non-GAAP measures. See slides 2 and 33 of this document, pages 32, 98-99 of BMO’s 2012 Annual Report and pages 34-35 of BMO’s Second Quarter 2013 Report to Shareholders
Who we areEstablished in 1817, BMO Financial Group is a highly diversified financial services provider based in North America. With total assets of $555 billion and 46,580 employees (as at April 30, 2013), BMO provides a broad range of retail banking, wealth management and investment banking products and services to more than 12 million customers. BMO Financial Group conducts business through three operating groups: Personal and Commercial Banking, Private Client Group and BMO Capital Markets.
3 OSFI’s decision to delay the effective date for the imposition of the Credit Valuation Adjustment (CVA) risk capital charge until January 2014 improved our CET1 ratio at April 30, 2013, by approximately 35 basis points.
1 As measured by assets as at April 30, 2013; ranking published by Bloomberg

4Investor Presentation | Q2 2013
Expand strategically in select global markets to create future growth
Strategic PrioritiesA Clear Vision: to be the bank that defines great customer experience
1
2
3
4
5
Achieve industry-leading customer loyalty by delivering on our brand promise
Enhance productivity to drive performance and shareholder value
Leverage our consolidated North American platform to deliver quality earnings growth
Ensure our strength in risk management underpins everything we do for our customers

5Investor Presentation | Q2 2013
Strategic FootprintBMO’s strategic footprint is anchored by our core business in the heartland of the continental economy
* BMO has retail banking branches across Canada and in the U.S. Midwest states of Illinois, Wisconsin, Indiana, Minnesota, Missouri and Kansas, as well as in Arizona and Florida
BMO facilitates financing, investmentand wholesale banking activitiesbetween our North American baseand strategically located offices in therapidly growing economies of Asia.
Our significant and long-establishedpresence throughout Canada and theU.S. includes regional economies fuelledby natural resources and agriculture.BMO’s deep connections and historicalpresence in the energy sector extendfrom the oilfields of Western Canadasouthward through to Texas.
Offices in four European countries anda regional representative office in theMiddle East provide us with a strongdistribution platform for our wholesalebanking activities as well as a presencein key markets for institutional assetmanagement and investment banking.
BMO’s enlarged continental footprint is centred in the vital Great Lakes economy that connects six key U.S. Midwest states and the two largest Canadian provinces.

6Investor Presentation | Q2 2013
BMO – A Strong FoundationWe have the business platform, balance sheet and expertise to generate quality growth
Diversified business mix with retail focus 78% of Q2 F2013 operating group revenue from retail businesses Commercial banking is a strength in Canada (#2 in lending) and the U.S. Top-tier deposit market share in key U.S. Midwest markets
Strong national presence in Canada, as well as strategic positioning in select high-growth U.S. and emerging wealth management markets
North American Capital Markets business operating as bulge bracket firm in Canada with mid-cap focus in the U.S.
Strong capital position Basel III Common Equity Tier 1 Ratio of 9.7%1 as at April 30th, 2013
Disciplined and balanced approach to capital management
Proactive risk management Independent risk oversight across the enterprise Disciplined credit risk management capabilities and processes
Commitment to stakeholders Quarterly dividend of $0.74; longest-running dividend payout record of any company in Canada at 184 years Clear brand promise that delivers real benefit for customers Sound corporate governance
1 OSFI’s decision to delay the effective date for the imposition of the Credit Valuation Adjustment (CVA) risk capital charge until January 2014 improved our CET1 ratio at April 30, 2013, by approximately 35 basis points

7Investor Presentation | Q2 2013
Economic Outlook
Canada
United States
Outlook as at May 31, 2013; Source: BMO Economics
The U.S. economy is growing moderately, with strength in housing markets and business investment and a pickup in consumer spending partly offset by government cutbacks
Aggressive fiscal restraint will keep economic growth moderate at 2.2% in 2013, though improved household finances and housing markets should support a stronger expansion in the second half of the year
The unemployment rate will likely decline slowly to 7.2% in late 2013
The Federal Reserve is expected to keep interest rates near zero until 2015
The U.S. dollar is expected to remain firm this year
The Canadian economy continues to grow at a modest pace, held back by the strong Canadian dollar, weak global demand, elevated household debt and fiscal consolidation, but supported by low interest rates
Modest GDP growth of 1.7% is expected in 2013, with strength in business investment and in the resource-producing provinces partly offset by weakness in consumer spending, government cutbacks and a moderation in housing markets
The unemployment rate is forecast to decline to 6.9% in late 2013
The Bank of Canada is expected to keep interest rates steady until the second half of 2014
The Canadian dollar should remain near parity against the U.S. dollar in 2013, supported by firm commodity prices and higher interest rates than in the U.S

8Investor Presentation | Q2 2013
Economic Indicators
Sources: BMO Economics, Haver Analytics1Annual average*Estimates as of May 31, 2013; Eurozone estimates provided by OECD
Canada United States Eurozone
Economic Indicators (%)1 2012 2013E 2014E 2012 2013E 2014E 2012 2013E 2014E
GDP Growth 1.7 1.7 2.3 2.2 2.2 3.2 -0.5 -0.7 0.7
Inflation 1.5 1.0 1.7 2.1 1.4 1.7 2.5 1.4 1.6
Interest Rate (3mth Tbills) 0.9 1.0 1.2 0.1 0.1 0.1 0.5 0.1 0.5
Unemployment Rate 7.3 7.0 6.7 8.1 7.4 6.7 11.4 12.0 11.3
Current Account Balance / GDP* (3.4) (2.9) (2.6) (3.0) (2.9) (2.8) 1.4 1.9 2.2
Budget Surplus / GDP* (1.4) (1.0) (0.3) (7.0) (4.0) (3.4) (3.3) (2.8) (2.6)

9Investor Presentation | Q2 2013
Operating Group Overview
Personal and Commercial Banking - Canada Over 7 million customers Over 900 branches and access to 2,680 automated banking machines
Expanded our branch network by opening or upgrading 27 locations and adding 84 ABMs YTD Strong personal lending growth1 in Q2’13 with balances up 10% Y/Y and 1.3% Q/Q Continued strong momentum in commercial lending with growth2 of 12% Y/Y and 4.6% Q/Q
#2 market share position in small and medium sized loans
Personal and Commercial Banking – U.S. Over 2 million customers Over 600 branches and access to 1,369 automated banking machines; headquartered in Chicago branch footprint spans across the
U.S. Midwest states of Illinois, Wisconsin, Indiana, Minnesota, Missouri and Kansas, as well as Arizona and Florida Strong core C&I loan growth up 17% Y/Y and 4% Q/Q, in Q2’13; 6th straight sequential quarter of growth
Private Client Group (PCG) Broad offering of wealth management products and solutions including Insurance products Full range of client segments from mainstream to ultra-high net worth, as well as select institutional markets Operates in Canada and the United States, as well as in China and the United Kingdom AUA / AUM $522B as at April 30, 2013
BMO Capital Markets (BMO CM) Provides a full range of products and services to help corporate, institutional and government clients achieve their ambitions Expertise in areas including equity and debt underwriting, corporate lending and project financing, mergers and acquisitions advisory
services, merchant banking, securitization, treasury and market risk management, foreign exchange, derivatives, debt and equity research and institutional sales and trading
29 locations around the world, including 16 in North America
Operating Group Overview
1 Personal lending includes mortgages and consumer loans but excludes credit cards. Personal Cards balances approximately 83% of total credit card portfolio in each of Q2’12, Q1’13 and Q2’132 Commercial lending growth excludes commercial credit cards. Commercial cards balances approximately 17% of total credit card portfolio in each of Q2’12, Q1’13 and Q2’13

10Investor Presentation | Q2 2013
Q2 2013 Financial Highlights
Adjusted1
Q2 12 Q1 13 Q2 13
Net Income (C$MM) 982 1,041 997
EPS ($) 1.44 1.52 1.46
ROE (%)2 15.4 14.8 14.5
Reported
Net Income (C$MM) 1,028 1,048 975
EPS ($) 1.51 1.53 1.42
Basel III Common Equity Tier 1 Ratio (%)3 7.6 9.4 9.7
Adjusted EPS of $1.46, up 1% Y/Y
Adjusted net income up 2% Y/Y
Strong Y/Y net income growth in PCG excluding Insurance, up 14% and BMO CM up 19%
Insurance results reduced by $34MM after-tax ($0.05/share) due to negative impact of lower long-term interest rates
P&C US net income up 3%
P&C Canada essentially unchanged
Continued good Y/Y growth in Commercial banking
In Canada, both loan and deposit balances up 12%
In U.S., core C&I loans up 17%
Adjusted provisions4 for credit losses of $110MM compared to $151MM a year ago
Adjusted ROE of 14.5% on strong capital position
In Q2’13 purchased 4MM shares under buyback program
Adjusted effective tax rate5 of 20.0% compared to 19.9% in Q1’13 and 19.5% in Q2’12
1 See slide 33 for adjustments to reported results2 Reported ROE: Q2’12 16.2%; Q1’13 14.9%; Q2’13 14.2% 3 Q2’13 Common Equity Tier 1 Ratio based on Basel III. Q2’12 based on pro forma Basel III4 Reported PCL $145MM, compared to $195MM a year ago5 Reported effective tax rate of 20.8%
Adjusted measures are non-GAAP measures. See slide 2 of this document, pages 32, 98-99 of BMO’s 2012 Annual Report and pages 34-35 of BMO’s Second Quarter 2013 Report to Shareholders

11Investor Presentation | Q2 2013
P&C US730
PCG765
Trading Products
550Inv. & Corp
Banking 300
Canada -Personal
964
Canada -Commercial
568
Diversified Business Mix with Retail Focus78% of Q2 operating group adjusted revenue from retail businesses
PCG (Wealth
Management) 20%
P&C (Personal & Commercial)
58%
Q2 F2013 Adjusted Revenue by Operating Group (C$MM) - $3,877MM
P&C (Personal & Commercial)
59%
Q2 F2013 Adjusted Net Income by Operating Group (C$MM) -
$1,023MM
PCG (Wealth
Management) 14%
BMO CM (Investment Banking)
27%Excludes Corporate Services adjusted net loss of $26MM
Excludes Corporate Services adjusted revenue $(118)MM
Adjusted measures are non-GAAP measures. See slide 2 and 33 of this document, pages 32, 98-99 of BMO’s 2012 Annual Report and pages 34-35 of BMO’s Second Quarter 2013 Report to Shareholders
BMO CM (Investment Banking)
22%
P&C Canada
431
P&C US 168
PCG 148
BMO CM 276

12Investor Presentation | Q2 2013
RevenueY/Y Revenue driven by good growth in PCG (excluding Insurance) and BMO CM
1,758 1,857 1,836
1,969 2,004 1,923
Q2'12 Q1'13 Q2'13
Y/Y adjusted revenue up 1%
NII down 2% as volume growth across all Groups, particularly commercial, was more than offset by lower NIM
NIR up 4% driven by PCG and BMO CM
Good growth in mutual funds
Higher trading revenues primarily due to increased revenue from interest rate activities
Q/Q adjusted revenue down 3%
NII down 4% due to fewer days and lower NIM
NIR down 1% reflecting lower underwriting, lending and advisory fees from high levels in Q1
Adjusted NIM of 164 bps, down 3bps Q/Q. Adjusted NIM (excluding trading) of 200 bps, down 3 bps Q/Q
Reported Revenue – Q2’12 $3,959MM; Q1’13 $4,081MM; Q2’13 $3,944MM, Reported NII – Q2’12 $2,120MM; Q1’13 $2,216MM Q2’13 $2,098MM, Reported NIR – Q2’12 $1,839MM; Q1’13 $1,865MM; Q2’13 $1,846MMReported NIM - 179 bps, down 6 bps Q/Q
Total Bank Adjusted1 Revenue (C$MM)
NIR
NII
3,727 3,861 3,759
1 Adjusted measures are non-GAAP measures. See slide 2 of this document, pages 32, 98-99 of BMO’s 2012 Annual Report and pages 34-35 of BMO’s Second Quarter 2013 Report to Shareholders. See slide 33 for adjustments to reported results
13Investor Presentation | Q2 2013
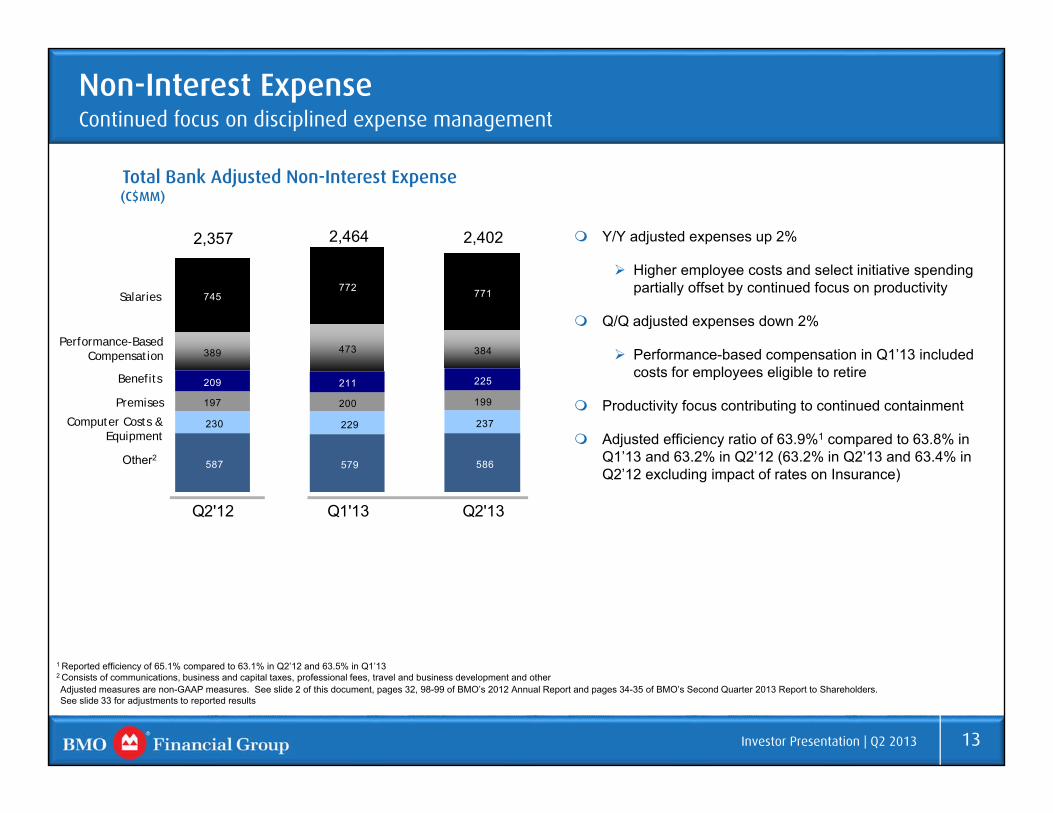
Non-Interest ExpenseContinued focus on disciplined expense management
587 579 586
230 229 237
197 200 199
209 211 225
389 473 384
745772 771
Q2'12 Q1'13 Q2'13
Y/Y adjusted expenses up 2%
Higher employee costs and select initiative spending partially offset by continued focus on productivity
Q/Q adjusted expenses down 2%
Performance-based compensation in Q1’13 included costs for employees eligible to retire
Productivity focus contributing to continued containment
Adjusted efficiency ratio of 63.9%1 compared to 63.8% in Q1’13 and 63.2% in Q2’12 (63.2% in Q2’13 and 63.4% in Q2’12 excluding impact of rates on Insurance)
2,357
Total Bank Adjusted Non-Interest Expense(C$MM)
Computer Costs & Equipment
Performance-Based Compensation
Benefits
Premises
Salaries
Other2
2,4022,464
1 Reported efficiency of 65.1% compared to 63.1% in Q2’12 and 63.5% in Q1’132 Consists of communications, business and capital taxes, professional fees, travel and business development and otherAdjusted measures are non-GAAP measures. See slide 2 of this document, pages 32, 98-99 of BMO’s 2012 Annual Report and pages 34-35 of BMO’s Second Quarter 2013 Report to Shareholders. See slide 33 for adjustments to reported results

14Investor Presentation | Q2 2013
Capital & Risk Weighted AssetsCapital position is strong
Basel III Q1 13 Q2 13
Common Equity Tier 1 Ratio (CET1) (%)1 9.4 9.7
Tier 1 Capital Ratio (%) 11.1 11.3
Total Capital Ratio (%) 13.4 13.7
RWA ($B) 211 208
Assets to Capital Multiple2 16.1 16.3
Basel III CET1 Ratio is 9.7%, up from 9.4% at Q1’13
Basel III RWA decreased from last quarter due mainly to lower risk in certain portfolios and better risk assessments
Capital increased from last quarter due largely to retained earnings growth
4 million common shares were repurchased in Q2F2012
Common Shareholders’ Equity ($B)
F2013
1 OSFI’s decision to delay the effective date for the imposition of the Credit Valuation Adjustment (CVA) risk capital charge until January 2014 improved our CET1 ratio at April 30, 2013, by approximately 35 basis points 2 The Assets-to-Capital Multiple is calculated by dividing total assets, including specified off-balance sheet items, by total capital calculated on a transitional basis, as set out in OSFI's 2013 CAR Guideline.

15Investor Presentation | Q2 2013
436 462
444461
431
283 276 268 265 259
Q2 Q3 Q4 Q1 Q2
Q2 adjusted net income $431MM
Robust loan growth of $15B or 10% Y/Y and $3B or 2% Q/Q Personal loan growth 10% Y/Y and 1.3% Q/Q Commercial loan growth 12% Y/Y and 4.6% Q/Q
#2 market share1 position in small and medium sized loans Deposit growth of 7% Y/Y and 2% Q/Q
Personal deposit growth 4.0% Y/Y and 1.2% Q/Q Commercial deposit growth 12% Y/Y and 2.9% Q/Q
Expenses up 3% Y/Y due to continued business investment; efficiency ratio 51.9% Continue to manage core operating expenses tightly while re-tooling our
workforce Expanded branch network by opening or upgrading 18 locations across the
country in Q2’13 Increased front-line resources across a number of roles Focus on sales force productivity paying off Two technology projects underway:
Commercial Lending Redesign: to increase the front line capacity to sell while reducing operational costs
Credit Card enhancements, including a consistent and scalable North American credit card payments platform that supports future growth and enhancements
Strong top-tier customer loyalty scores are being translated into strong balance growth
Adjusted Net Income* and
Net Interest Margin
(1)%
Adjusted Net Income* ($MM)
Net Interest Margin (bps)
F2013F2012
Y/YGrowth
1 Business loan share (Banks) issued by CBA (one calendar quarter lag basis (Q1 F13: Dec 2012))* Adjusted measures are non-GAAP measures. See slide 2 of this document, pages 32, 98-99 of BMO’s 2012 Annual Report and pages 34-35 of BMO’s Second Quarter 2013 Report to Shareholders.
See slide 33 for adjustments to reported results. Reported Net Income: Q2’12 $433MM; Q3’12 $459MM, Q4’12 $442MM; Q1’13 $458MM; Q2’13 $430MM
Personal & Commercial Banking CanadaFocused on growing high quality assets and attracting new customers

16Investor Presentation | Q2 2013
Personal & Commercial Banking U.S. Continued momentum in core Commercial and Industrial
Adjusted Net Income* and
Net Interest Margin
Adjusted net income $163MM, up 3% Y/Y; down from a very strong Q1
YTD adjusted earnings up 9%
Expenses down Y/Y and Q/Q primarily due to synergy related savings net of selective investments in the business In our Commercial business we have invested in growth opportunities by both
expanding our geographic footprint and adding to our capabilities in certain sectors Added loan offices in Omaha and Atlanta Expanded our Dealer Finance footprint to Washington DC and Ohio Added large Corporate and airplane expertise to our Equipment
Finance team Launched a new Franchise Finance specialty Expanded our ABL team
In our Personal business we have invested in additional personnel to capitalize on the growth in the mortgage sector and premier banking services
Adjusted efficiency ratio 59.6%1
Positive trend in total loan portfolio Strong commercial loan growth driven by continued momentum in core C&I
balances up 17% Y/Y and 4% Q/Q
Brand awareness has increased significantly for BMO Harris Bank across our footprint, with particularly strong gains in Indiana and Minnesota
3%158 153 156 197
163
439 442 430 421 417
Q2 Q3 Q4 Q1 Q2
Adjusted Net Income (US$MM)
Net Interest Margin (bps)
F2013F2012
Y/YGrowth
* Adjusted measures are non-GAAP measures. See slide 2 of this document, page 32, 98-99 of BMO’s 2012 Annual Report and page 34-35 of BMO’s Second Quarter 2013 Report to Shareholders. For details on adjustments refer to slide 33
1 Reported net income up 6% Y/Y, down 17% Q/Q; reported efficiency ratio of 62.2%. Reported net income (US): Q2’12 $143MM, Q3’12 $137MM, Q4’12 141MM, Q1’13 $183MM , Q2’13 $152MM
17Investor Presentation | Q2 2013
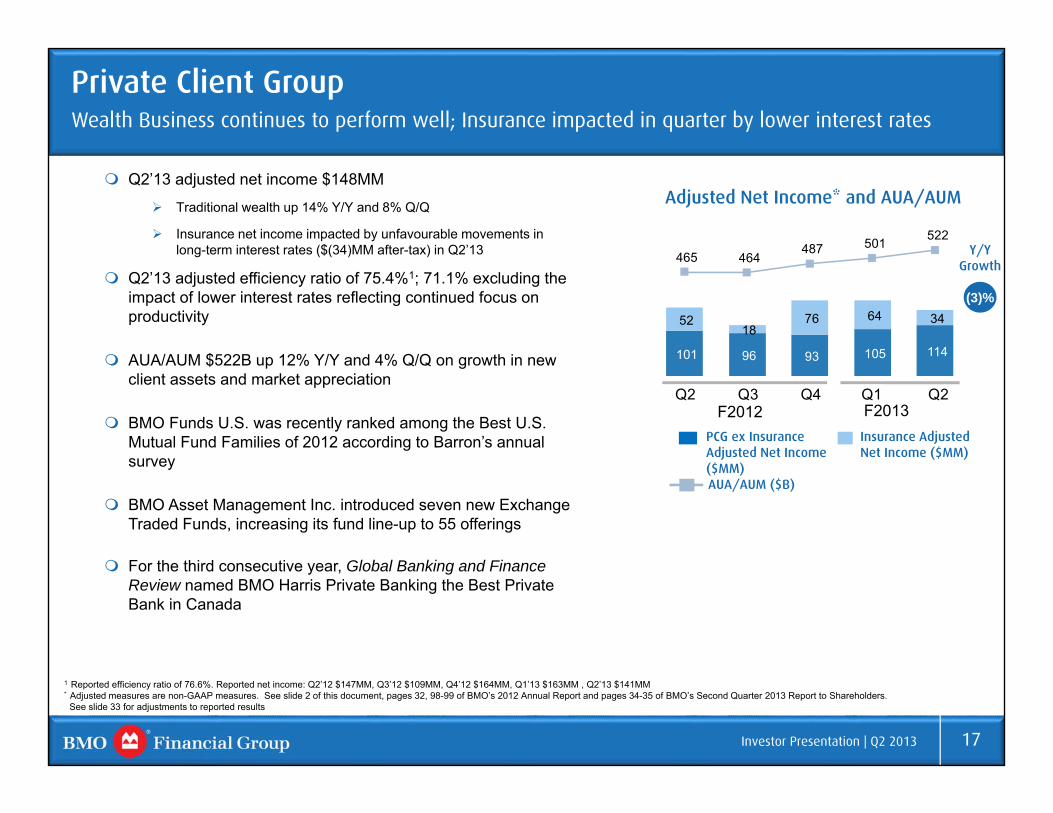
Private Client GroupWealth Business continues to perform well; Insurance impacted in quarter by lower interest rates
Adjusted Net Income* and AUA/AUM Q2’13 adjusted net income $148MM
Traditional wealth up 14% Y/Y and 8% Q/Q
Insurance net income impacted by unfavourable movements in long-term interest rates ($(34)MM after-tax) in Q2’13
Q2’13 adjusted efficiency ratio of 75.4%1; 71.1% excluding the impact of lower interest rates reflecting continued focus on productivity
AUA/AUM $522B up 12% Y/Y and 4% Q/Q on growth in new client assets and market appreciation
BMO Funds U.S. was recently ranked among the Best U.S. Mutual Fund Families of 2012 according to Barron’s annual survey
BMO Asset Management Inc. introduced seven new Exchange Traded Funds, increasing its fund line-up to 55 offerings
For the third consecutive year, Global Banking and Finance Review named BMO Harris Private Banking the Best Private Bank in Canada
(3)%
101 96 93 105 114
52 18
76 64 34
465 464 487 501 522
Q2 Q3 Q4 Q1 Q2
Insurance Adjusted Net Income ($MM)
PCG ex InsuranceAdjusted Net Income ($MM)
F2013F2012
AUA/AUM ($B)
Y/YGrowth
1 Reported efficiency ratio of 76.6%. Reported net income: Q2’12 $147MM, Q3’12 $109MM, Q4’12 $164MM, Q1’13 $163MM , Q2’13 $141MM* Adjusted measures are non-GAAP measures. See slide 2 of this document, pages 32, 98-99 of BMO’s 2012 Annual Report and pages 34-35 of BMO’s Second Quarter 2013 Report to Shareholders.
See slide 33 for adjustments to reported results

18Investor Presentation | Q2 2013
BMO Capital MarketsAdjusted results up Y/Y and down Q/Q from a very strong Q1
Adjusted Net Income1 and Return on Equity
Q2’13 adjusted net income $276MM and ROE of 19.4%
Y/Y adjusted net income up 19%; down from a very strong Q1
Good Y/Y revenue growth driven by higher trading and corporate banking revenues
Net income from US operations increased to US$47MM; YTD earnings have doubled
Efficiency ratio of 59.3%
Strong market position and commitment to focusing on clients
BMO Capital Markets named Canada’s Best Investment Bank for the third time and World’s Best Metals and Mining Investment Bank for the fourth consecutive year by Global Finance
YTD, rank 1st in Equity Capital Markets in the Canadian League tables
BMO Capital Markets participated in 129 new issues in Q2’13
19%233 250
315 310 276
19.2 20.9
27.2
21.3 19.4
Q2 Q3 Q4 Q1 Q2
Adjusted Net Income ($MM)
Return on Equity (%)
F2013F2012
Y/YGrowth
1 Adjusted measures are non-GAAP measures. See slide 2 of this document, pages 32, 98-99 of BMO’s 2012 Annual Report and pages 34-35 of BMO’s Second Quarter 2013 Report to Shareholders. See slide 33 for adjustments to reported results
19Investor Presentation | Q2 2013
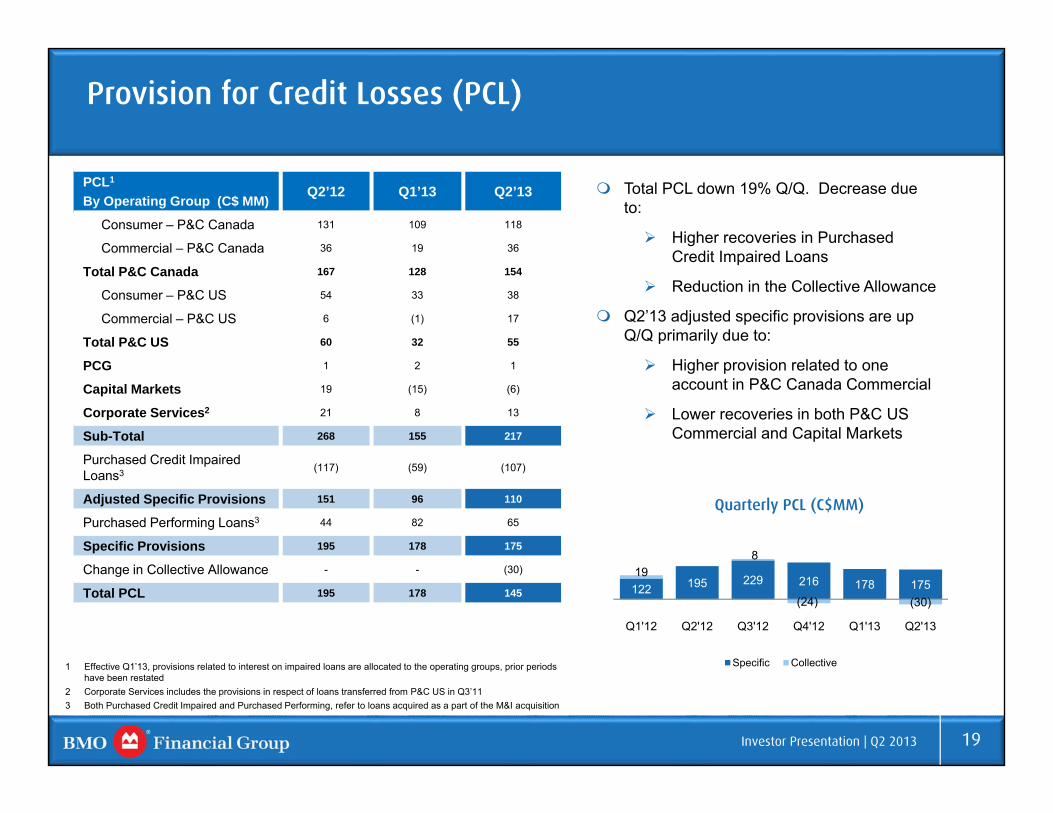
Provision for Credit Losses (PCL)
PCL1
By Operating Group (C$ MM) Q2’12 Q1’13 Q2’13
Consumer – P&C Canada 131 109 118
Commercial – P&C Canada 36 19 36
Total P&C Canada 167 128 154
Consumer – P&C US 54 33 38
Commercial – P&C US 6 (1) 17
Total P&C US 60 32 55
PCG 1 2 1
Capital Markets 19 (15) (6)
Corporate Services2 21 8 13
Sub-Total 268 155 217
Purchased Credit Impaired Loans3 (117) (59) (107)
Adjusted Specific Provisions 151 96 110
Purchased Performing Loans3 44 82 65
Specific Provisions 195 178 175
Change in Collective Allowance - - (30)
Total PCL 195 178 145 122 195 229 216 178 17519
8
(24) (30)
Q1'12 Q2'12 Q3'12 Q4'12 Q1'13 Q2'13
Quarterly PCL (C$MM)
Specific Collective
Total PCL down 19% Q/Q. Decrease due to:
Higher recoveries in Purchased Credit Impaired Loans
Reduction in the Collective Allowance
Q2’13 adjusted specific provisions are up Q/Q primarily due to:
Higher provision related to one account in P&C Canada Commercial
Lower recoveries in both P&C US Commercial and Capital Markets
1 Effective Q1’13, provisions related to interest on impaired loans are allocated to the operating groups, prior periods have been restated
2 Corporate Services includes the provisions in respect of loans transferred from P&C US in Q3’113 Both Purchased Credit Impaired and Purchased Performing, refer to loans acquired as a part of the M&I acquisition

20Investor Presentation | Q2 2013
Liquidity and Funding Strategy
BMO’s Cash and Securities to Total Assets Ratio reflects a strong liquidity position
BMO’s large base of customer deposits, along with our strong capital base, reduces reliance on wholesale funding
* Core Deposits are comprised of customer operating and saving deposits and smaller fixed-date deposits (less than or equal to $100,000)
** Customer Deposits are core deposits plus large fixed-date deposits excluding wholesale customer deposits
Core and Customer Deposits ($B)Cash and Securities to Total Assets Ratio (%) (1)
(1) The decline in the ratio in 2011 from 2010 is the result of including securitized loans and mortgages previously reported off balance sheet under Canadian GAAP on balance sheet under IFRS
29.1%
31.9%
35.0%
29.5% 29.4%30.1%
Q4 2008 Q4 2009 Q4 2010 Q4 2011 Q4 2012 Q2 2013
125.4 125.3135.3
177.3190.7
202.4
145.3 147.9 152.9
194.4203.5
215.7
0
50
100
150
200
250
Q4 2008 Q4 2009 Q4 2010 Q4 2011 Q4 2012 Q2 2013
Core Deposits* Customer Deposits**

21Investor Presentation | Q2 2013
Diversified Wholesale Term Funding Mix
0
2
4
6
8
10
12
14
16
F2013 F2014 F2015 F2016 F2017 F2018 ≥ F2019
Mat
uriti
es C
DE
($B)
Term Debt Tier 1 Capital Tier 2 Capital Securitization
Wholesale Capital Market (1)
Term Funding Composition (Total $77.0B) As at April 30, 2013
Wholesale Capital Market (1)(2)
Term Funding Maturity Profile(Total $77.0B) As at April 30, 2013
BMO's wholesale funding principles seek to match the term of assets with the term of funding. Loans for example are funded with customer deposits and capital, with any difference provided by longer-term wholesale funding
BMO has a well diversified wholesale funding platform across markets, products, terms, currencies and maturities
Credit Ratings
Moody’s S&P Fitch DBRS
Aa3 A+ AA- AA
(1) Wholesale capital market term funding includes non-structured funding for terms greater than or equal to two years.(2) Securitization includes Covered Bond maturities.
Covered Bonds10%
C$ Mortgage & C$ and US$ Credit Card Securitization
32%
C$ Senior Debt24%
Senior Debt (Global Issuance)
22%
Tier 1 Capital5%
Tier 2 Capital7%

22Investor Presentation | Q2 2013
Corporate Governance
Comprehensive code of business conduct and ethics, FirstPrinciples,guides conduct and ethical decision-making by our directors, officers and employees
Governance practices reflect emerging best practices and BMO meets or exceeds legal, regulatory, TSX and NYSE requirements
We have share ownership requirements to ensure directors’ and executives’ compensation is aligned with shareholder interests
The Globe and Mail’s Board Games 2012 annual review of corporate governance practices in Canada ranked BMO 7th overall among 244 Canadian reporting issuers

23Investor Presentation | Q2 2013
Sustainability at BMO
We view Sustainability as creating value for our shareholders while acting in the long-term interest of our various stakeholders and have programs and commitments in place to achieve this.
We are transparent about our progress. Our recently published 2012 Environmental, Social and Governance (ESG) Report provides details on how we are managing the ESG impacts of our business while creating value for our customers, investors, the economy and society.
We are innovative in our approach to ESG reporting. Our ESG scorecard, found in the report, contains year over year metrics for the items most important to our stakeholders
• a talented and diverse workforce, • community investment, • board diversity, • ethical conduct and; • consideration for the environment.
We are recognized for our efforts by inclusion in investor based indices:

24Investor Presentation | Q2 2013
Reasons to invest in BMOWell positioned to leverage our North American platform and deliver sustained earnings growth
R
Proven strength in commercial banking across our large North American platform
Operating leverage from our expanded U.S. platform
Strong capital position
Advantaged business mix in the current environment
Enhancing productivity to drive performance
Focused on generating revenue growth by achieving industry-leading customer experience and loyalty

25Investor Presentation | Q2 2013
APPENDIX
26Investor Presentation | Q2 2013
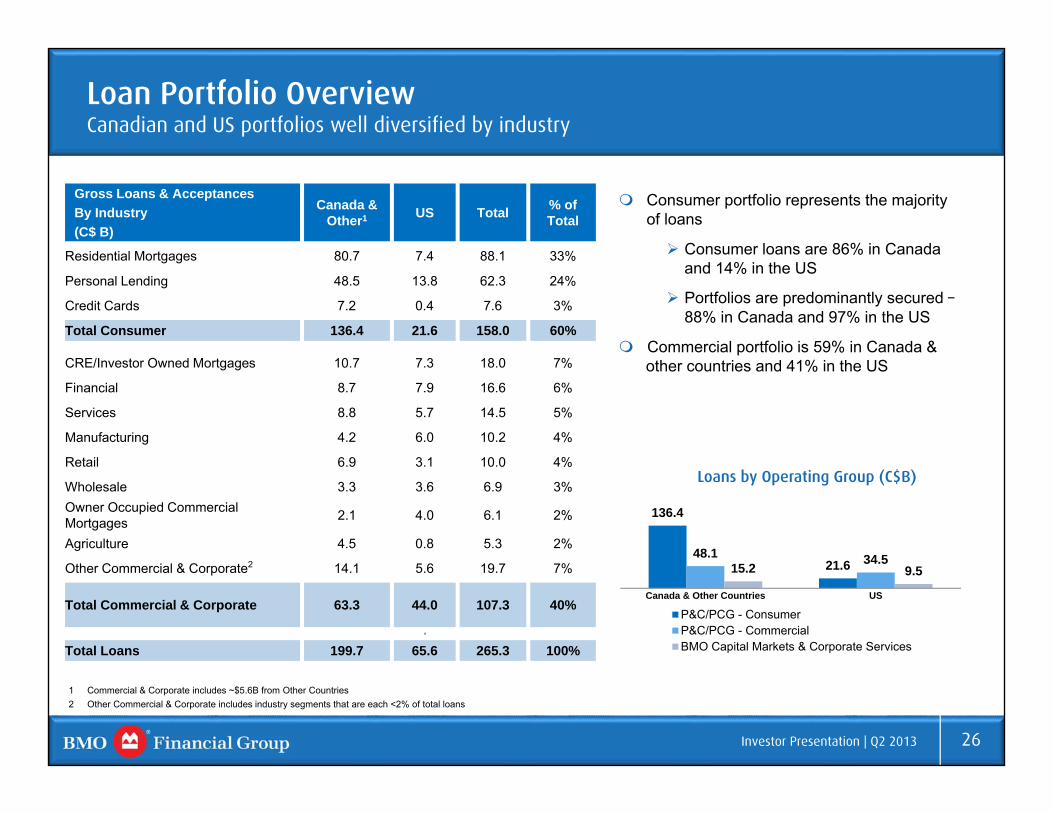
Loan Portfolio OverviewCanadian and US portfolios well diversified by industry
Consumer portfolio represents the majority of loans
Consumer loans are 86% in Canada and 14% in the US
Portfolios are predominantly secured –88% in Canada and 97% in the US
Commercial portfolio is 59% in Canada & other countries and 41% in the US
Gross Loans & Acceptances By Industry(C$ B)
Canada & Other1 US Total % of
Total
Residential Mortgages 80.7 7.4 88.1 33%
Personal Lending 48.5 13.8 62.3 24%
Credit Cards 7.2 0.4 7.6 3%
Total Consumer 136.4 21.6 158.0 60%
CRE/Investor Owned Mortgages 10.7 7.3 18.0 7%
Financial 8.7 7.9 16.6 6%
Services 8.8 5.7 14.5 5%
Manufacturing 4.2 6.0 10.2 4%
Retail 6.9 3.1 10.0 4%
Wholesale 3.3 3.6 6.9 3%Owner Occupied Commercial Mortgages 2.1 4.0 6.1 2%
Agriculture 4.5 0.8 5.3 2%
Other Commercial & Corporate2 14.1 5.6 19.7 7%
Total Commercial & Corporate 63.3 44.0 107.3 40%
.8
Total Loans 199.7 65.6 265.3 100%
1 Commercial & Corporate includes ~$5.6B from Other Countries2 Other Commercial & Corporate includes industry segments that are each <2% of total loans
136.4
21.648.1 34.5
15.2 9.5
Canada & Other Countries US
Loans by Operating Group (C$B)
P&C/PCG - ConsumerP&C/PCG - CommercialBMO Capital Markets & Corporate Services

27Investor Presentation | Q2 2013
Personal & Commercial Banking Canada – Loan Balances
39.2 41.7 43.7
8.9 8.9 8.6
41.3 43.0 43.1
67.275.0 76.4
Q2'12 Q1'13 Q2'13
156.6 168.6 171.8
Average Loans & Acceptances1
(C$B)
1 Column totals may not equal sum of the components due to rounding 2 Personal lending includes mortgages and consumer loans but excludes credit cards. Personal Cards balances approximately 83% of total credit card portfolio in each of Q2’12, Q1’13 and Q2’13
10%
Y/Y Growth
Residential MortgagesConsumer Loans
Credit CardsCommercial Loans & Acceptances
Personal
Strong lending growth2 with balances up 10.0% Y/Y and 1.3% Q/Q
Mortgage balances up 13.7% Y/Y. Balances up 1.9% Q/Q reflecting softer market
Total personal lending2 market share3 up 5 bps Q/Q despite impact from a recent acquisition by a competitor
Commercial
Continued strong momentum in commercial lending with growth4 of 12% Y/Y and 4.6% Q/Q.
Strong Commercial pipeline
#2 market share5 position in small and medium sized loans
3 Personal share issued by OSFI (one month lag basis (Q2 F13: Mar 2013)) ; Market share data sources: Consumer Loans and Residential Mortgages – OSFI4 Commercial lending growth excludes commercial credit cards. Commercial cards balances approximately 17% of total credit card portfolio in each of Q2’12, Q1’13 and Q2’135 Business loan share (Banks) issued by CBA (one calendar quarter lag basis (Q1 F13: Dec 2012))

28Investor Presentation | Q2 2013
Personal & Commercial Banking Canada – Deposit Balances
Average Deposits1
(C$B)
104.7109.9 111.8 7%
Y/Y Growth
Commercial DepositsPersonal Deposits
Personal
Deposit balances up 4.0% Y/Y and 1.2% Q/Q
Strong Y/Y growth of 9.0% in retail operating deposits
Commercial
Strong momentum in commercial deposit growth, up 12% Y/Y and 2.9% Q/Q
Commercial deposit market share2 up 43 bps Q/Q
Strategy to grow commercial deposits performing well
1 Column totals may not equal the sum of the components due to rounding 2 Business deposit share (Banks) issued by CBA (one calendar quarter lag basis (Q1 F13: Dec 2012))

29Investor Presentation | Q2 2013
Personal & Commercial Banking U.S. – Commercial Balances
18.8 19.1 19.9 21.3 22.1
Q2 12 Q3 12 Q4 12 Q1 13 Q2 13
Core C&I ($B) - Average
All amounts in U.S. $B
Strong core C&I loan growth up 17% Y/Y, with Q2’13 being the 6th straight sequential quarter of growth
Growth in core C&I reflects increases across a number of businesses including Diversified Industries, Dealer Finance, Equipment Finance, Financial Institutions and Food and Consumer
Strong growth in the pipeline during the quarter
CRE fundamentals and valuations continue to recover; adding to pipeline and commitments at a moderate pace in a competitive environment
Deposits declined slightly Q/Q, but increased $2B or 11% Y/Y
3.0 3.0 2.9 2.9 2.9
Q2 12 Q3 12 Q4 12 Q1 13 Q2 13
Core Commercial Real Estate ($B) - Average
3.4 3.1 2.7 2.4 2.1
Q2 12 Q3 12 Q4 12 Q1 13 Q2 13
Run-off Loans ($B) - Average
17.7 17.7 18.7 19.9 19.7
Q2 12 Q3 12 Q4 12 Q1 13 Q2 13
Commercial Deposits ($B) - Average

30Investor Presentation | Q2 2013
Personal & Commercial Banking U.S. – Personal Balances
6.6 6.4 6.3 6.0 5.8
4.0 4.1 4.2 4.3 4.5
Q2 12 Q3 12 Q4 12 Q1 13 Q2 13
Mortgages ($B) - AverageMortgages Serviced Mortgage
5.0 5.2 5.4 5.6 5.8
Q2 12 Q3 12 Q4 12 Q1 13 Q2 13
Indirect Auto ($B) - Average
All amounts in U.S. $B
5.8 5.7 5.6 5.6 5.5
Q2 12 Q3 12 Q4 12 Q1 13 Q2 13
Home Equity ($B) - Average
5.5 5.4 5.3 5.1 5.0
Q2 12 Q3 12 Q4 12 Q1 13 Q2 13
Business Banking / Small Business Loans ($B) -Average
4.2 3.9 3.7 3.7 3.6
Q2 12 Q3 12 Q4 12 Q1 13 Q2 13
Other Loans ($B) - Average
41.5 41.3 40.6 39.9 39.9
Q2 12 Q3 12 Q4 12 Q1 13 Q2 13
Personal Deposits ($B) - Average
Mortgage portfolio declined as new originations of long term fixed rate loans are largely sold into the secondary market. Serviced portfolio is up 12% Y/Y and 3% Q/Q
Home Equity portfolio continues to reflect consumer deleveraging
Indirect Auto portfolio continues to grow. New originations increased 15% Y/Y and 5% Q/Q
Business Banking environment remains cautious for new borrowings. Increased emphasis on calling activities is driving an increase in pipeline
Deposit balances remained stable Q/Q and declined Y/Y as continued growth of core checking and savings balances partially offset by planned reductions in money market and higher cost CD portfolios
Other loans include non-strategic portfolios such as wholesale mortgages, purchased home equity, and certain small business CRE, as well as credit card balances and other personal loans
31Investor Presentation | Q2 2013
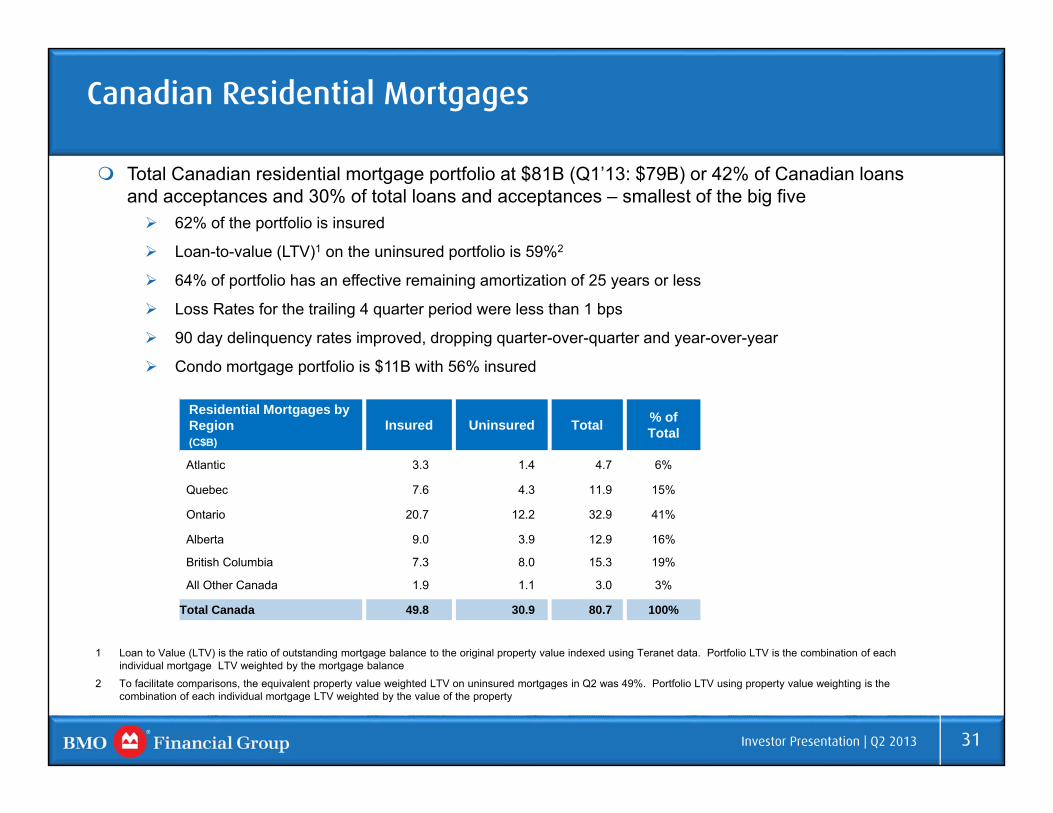
Canadian Residential Mortgages
Total Canadian residential mortgage portfolio at $81B (Q1’13: $79B) or 42% of Canadian loans and acceptances and 30% of total loans and acceptances – smallest of the big five 62% of the portfolio is insured
Loan-to-value (LTV)1 on the uninsured portfolio is 59%2
64% of portfolio has an effective remaining amortization of 25 years or less
Loss Rates for the trailing 4 quarter period were less than 1 bps
90 day delinquency rates improved, dropping quarter-over-quarter and year-over-year
Condo mortgage portfolio is $11B with 56% insured
Residential Mortgages by Region (C$B)
Insured Uninsured Total % of Total
Atlantic 3.3 1.4 4.7 6%
Quebec 7.6 4.3 11.9 15%
Ontario 20.7 12.2 32.9 41%
Alberta 9.0 3.9 12.9 16%
British Columbia 7.3 8.0 15.3 19%
All Other Canada 1.9 1.1 3.0 3%
Total Canada 49.8 30.9 80.7 100%
1 Loan to Value (LTV) is the ratio of outstanding mortgage balance to the original property value indexed using Teranet data. Portfolio LTV is the combination of each individual mortgage LTV weighted by the mortgage balance
2 To facilitate comparisons, the equivalent property value weighted LTV on uninsured mortgages in Q2 was 49%. Portfolio LTV using property value weighting is the combination of each individual mortgage LTV weighted by the value of the property
32Investor Presentation | Q2 2013
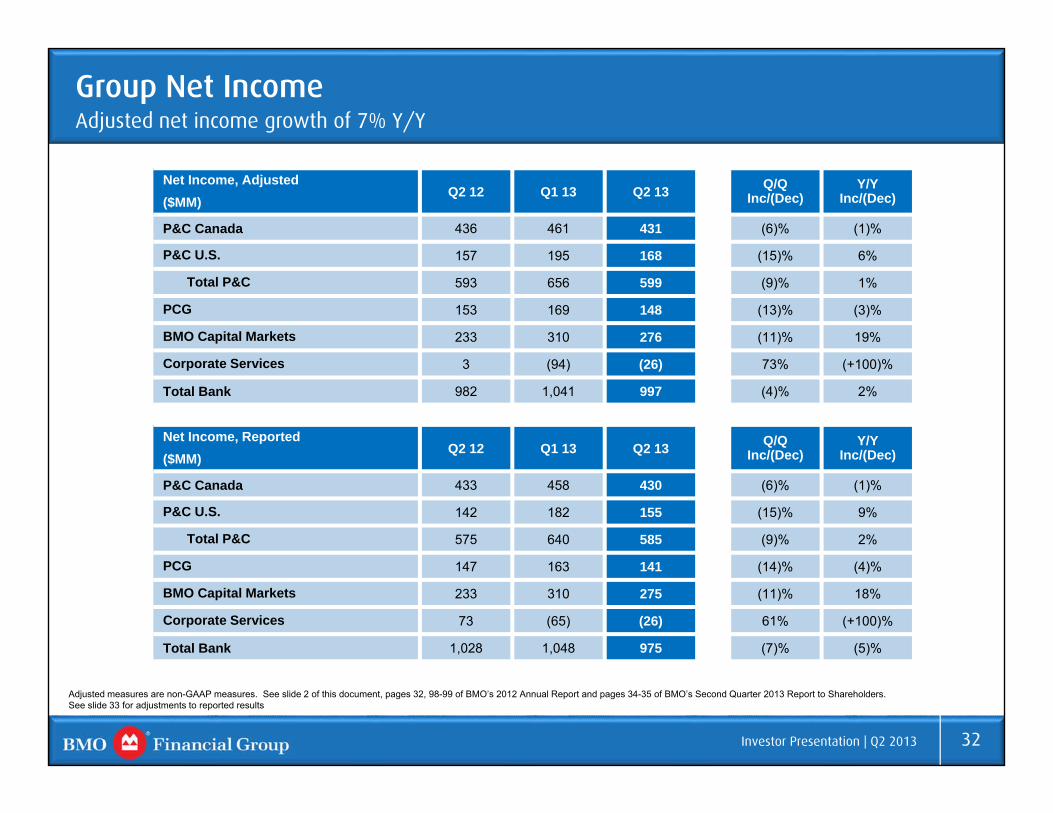
Net Income, Adjusted($MM)
Q2 12 Q1 13 Q2 13 Q/Q Inc/(Dec)
Y/Y Inc/(Dec)
P&C Canada 436 461 431 (6)% (1)%
P&C U.S. 157 195 168 (15)% 6%
Total P&C 593 656 599 (9)% 1%
PCG 153 169 148 (13)% (3)%
BMO Capital Markets 233 310 276 (11)% 19%
Corporate Services 3 (94) (26) 73% (+100)%
Total Bank 982 1,041 997 (4)% 2%
Net Income, Reported($MM)
Q2 12 Q1 13 Q2 13 Q/Q Inc/(Dec)
Y/Y Inc/(Dec)
P&C Canada 433 458 430 (6)% (1)%
P&C U.S. 142 182 155 (15)% 9%
Total P&C 575 640 585 (9)% 2%
PCG 147 163 141 (14)% (4)%
BMO Capital Markets 233 310 275 (11)% 18%
Corporate Services 73 (65) (26) 61% (+100)%
Total Bank 1,028 1,048 975 (7)% (5)%
Group Net IncomeAdjusted net income growth of 7% Y/Y
Adjusted measures are non-GAAP measures. See slide 2 of this document, pages 32, 98-99 of BMO’s 2012 Annual Report and pages 34-35 of BMO’s Second Quarter 2013 Report to Shareholders.See slide 33 for adjustments to reported results

33Investor Presentation | Q2 2013
Adjusting Items
Adjusting1 items – Pre-tax ($MM) Q2 12 Q1 13 Q2 13
Credit-related items on the M&I purchased performing loan portfolio 90 128 119
M&I integration costs (74) (92) (50)
Amortization of acquisition-related intangible assets (33) (31) (31)
Decrease/(increase) in the collective allowance for credit losses 18 - 22
Run-off structured credit activities 76 7 6
Restructuring costs (31) - (82)
Adjusting items included in reported pre-tax income 46 12 (16)
Adjusting1 items – After-tax ($MM) Q2 12 Q1 13 Q2 13
Credit-related items on the M&I purchased performing loan portfolio 55 79 73
M&I integration costs (47) (57) (31)
Amortization of acquisition-related intangible assets (24) (22) (22)
Decrease/(increase) in the collective allowance for credit losses 12 - 11
Run-off structured credit activities 73 7 6
Restructuring costs (23) - (59)
Adjusting items included in reported after-tax net income 46 7 (22)
EPS ($) 0.07 0.01 (0.04)
1 All adjusting items are reflected in Corporate Services with the exception of the amortization of acquisition-related intangible assets, which is reflected across the Operating Groups
Investor Relations Contact Information
E-mail: [email protected]
www.bmo.com/investorrelations
Fax: 416.867.3367
ANDREW CHINDirector, Investor [email protected]
SHARON HAWARD-LAIRDHead, Investor [email protected]