investor presentation q2 2016 - microsoftyoy sales group financial highlights 13,260 ytd jun’16...
TRANSCRIPT
Investor Presentation Q2 2016
1

Group Highlights
2

Group Highlights
6,890-2.1% vs.LY
12,913-2.6% vs. LY
1,290-4.7% vs. LY
2,5130.0% vs. LY
414-23.7% vs. LY
700-23.4% vs. LY
247-43.2% vs. LY
340-62.5% vs. LY
Y
T
D
Q
2
EBIT Net IncomeGross ProfitRevenue
All numbers are in SAR million unless specified
3

Group Highlights – One offs
Q1 2016:
– Share of loss from associate (SAR 20.4 mln)
Q1 2015:
– Capital gain from the sale of packaging business (SAR 265 mln)
4

YoY Sales
Group Financial Highlights
13,260
YTD Jun’16
12,913
YTD Jun’15
-2.6%
1,263
2,5132,512
0.0%
YTD Jun’16YTD Jun’15
YoY Gross Profit
Growth
All numbers are in SAR million unless specified
1,306
18.9% 19.5%
Margin
Q1’15 Q1’16
1,223
5.5%
1,159
18.6% 20.3% 19.2% 18.7%
6,224 6,023
Q1’16Q1’15
-3.2%-2.1%
7,036
Q2’16Q2’15
6,890
Q2’16Q2’15
1,353
-4.7%
1,290
5

511700
913
YTD Jun’16
-23.4%
YTD Jun’15
YoY EBIT
Group Financial Highlights
372
340
905
YTD Jun’15
-62.5%
YTD Jun’16
YoY NI
All numbers are in SAR million unless specified
471
Q1’16
93
-80.3%
Q1’15
7.6% 1.5% 6.2% 3.6%
6.0% 4.7% 7.7% 6.0% 6.9% 5.4%
6.8% 2.6%
414543
-23.7%
Q2’16Q2’15
247434
Q2’15
-43.2%
Q2’16
6
285371
-23.0%
Q1’15 Q1, 16
Growth Margin

Revenue Mix by Business FY 2016
3,092
All numbers are in SAR million unless specified
7
48%52%
RevenueYTD Jun'15
Foods Retail
45% 55%
RevenueYTD Jun'16
Foods Retail

Capital Expenditure By SegmentAll numbers are in SAR million unless specified
199
371
YTD Jun’16YTD Jun’15
+86.4%
670
421
YTD Jun’16YTD Jun’15
-37.2%
Foods Retail
8

Group Net Income Water Fall – Exceptional Items (YTD)
98
89
547
340
USD SourcingFoods
FX ImpactFoods
YTD June 2016
(Clean Net Income)
Loss from Associate
20
YTD June 2016
65
705
905
265
Capital Gain on sale of SPS
YTD June 2015 FX Impact Foods
YTD June 2015(Clean Net Income)
SAR Mn
Group clean NI fell by around 22.4%9

Foods Highlights
10

Foods Highlights
3,103-7.9% vs.LY
5,922-8.3% vs. LY
507-6.1% vs. LY
906-7.5% vs. LY
135-35.7% vs. LY
191-37.3% vs. LY
931-0.4% vs. LY
1,7821.9% vs. LY
Y
T
D
Q
2
Net Income Volume
(‘000MT)Gross ProfitRevenue
All numbers are in SAR million unless specified
11

YoY Sales
Foods Financial Highlights
5,922
YTD Jun’16
-8.3%
6,456
YTD Jun’15
906979
-7.5%
YTD Jun’16YTD Jun’15
YoY Gross Profit
All numbers are in SAR million unless specified
15.2% 15.3%
Q1’15
-8.6%
3,087 2,820
Q1’16
399439
-9.3%
Q1’16Q1’15
14.2% 14.1% 16.0% 16.3%
3,1033,369
-7.9%
Q2’16Q2’15
507540
Q2’16Q2’15
-6.1%
12
Growth Margin

549617
-11.0%
YTD Jun’16YTD Jun’15
YoY EBITDA
Foods Financial Highlights
191
305
-37.4%
YTD Jun’16YTD Jun’15
YoY NI
All numbers are in SAR million unless specified
236275
-14.3%
Q1’16Q1’15
5695
Q1’16
-40.7%
Q1’15
3.1% 2.0% 6.2% 4.4%
8.9% 8.4% 10.1%10.2% 9.6% 9.3%
4.7% 3.2% 13
314342
Q2’16Q2’15
-8.3%
135210
Q2’16
-35.7%
Q2’15
Growth Margin

Revenue Breakdown By Category
4%
24%
5%
73%
YTD Jun’16YTD Jun’15
5,922
22%
6,455
72%
-8.2%
OilYoY -8%
Sugar
YoY -13%
PastaYoY +7%
All numbers are in SAR million unless specified
14

Revenue Breakdown By Geography
2%5%
4%
23%
8%
5,922
YTD Jun’16
21%
46%
7%4%
3%
16%
3%
YTD Jun’15
6,455
38%
20%
-8.2%
Algeria
YoY -8%
Iran
YoY -15%
Egypt
YoY -28%
Sudan
YoY -46%
Morocco
YoY +10%
KSA
YoY +10%
Turkey
YoY -9%
All numbers are in SAR million unless specified
15

Volume Breakdown By Category
YTD Jun’16
7%
YTD Jun’15
45%50%
43%
1,782
47%
1,749
+1.9%
9%
OilYoY -9%
Sugar
YoY +11%
PastaYoY +19%
Thousand tonnes unless specified otherwise
16

Volume Breakdown By Geography
1,782
2%1,749
14%
YTD Jun’15 YTD Jun’16
+1.9%
4%
24%
3%
51%
2%
51%
22%
2%3%
2%
4%
15%
KSA
YoY +2%
Morocco
YoY +11%
Iran
YoY -6%
Turkey
YoY -8%
Sudan
YoY -3%
Egypt
YoY +7%
Algeria
YoY +12%
Thousand tonnes unless specified otherwise
17

Retail Highlights
18

Retail Highlights
3,874+2.4% vs.LY
7,145+2.5% vs. LY
782-3.8% vs. LY
1,607+4.8% vs. LY
-80NA vs. LY
-101NA vs. LY
73 Hyper4 Super
123 Hyper8 Super
1 Pandati
Y
T
D
Q
2
Net Income Stores
OpeningsGross ProfitRevenue
All numbers are in SAR million unless specified
19

YoY Sales
Retail Financial Highlights
2.5%
YTD Jun’15 YTD Jun’16
7,1456,974
4.8%
1,607
YTD Jun’15 YTD Jun’16
1,534
YoY Gross Profit
All numbers are in SAR million unless specified
22.0% 22.5%
Q1’16
3,271
Q1’15
3,192
2.5%
824720
14.5%
Q1’16Q1’1522.6% 25.2% 21.5% 20.2% 20
3,782 3,874
Q2’15
2.4%
Q2’16
782813
-3.8%
Q2’16Q2’15
Growth Margin

163
263
YTD Jun’16
-37.9%
YTD Jun’15
YoY EBITDA
Retail Financial Highlights
YoY NI
All numbers are in SAR million unless specified
112110
Q1’16Q1’15
1.7%
-21
18
Q1’16Q1’15
0.6% -0.6 % 1.3% -2.1% 1.0% -1.4%
3.8% 2.3%3.5% 3.4% 4.0% 1.3%
21
51
153
-66.6%
Q2’15 Q1’16
-80
48
Q2’16Q2’15
-101
67
YTD Jun’15 YTD Jun’16
Growth Margin

Number of Stores and Selling Area
158154 0
ClosuresOpenings YTD’16
4
Q1’16
6764
Q1’16 Openings YTD’16Closures
03
2232329
OpeningsQ1’16
0
YTD’16Closures
4484507
YTD’16Closures
9
OpeningsQ1’16
TotalSelling Area
758,227 m2Selling Area
742,113 m2
Super Hyper
Pandati
22
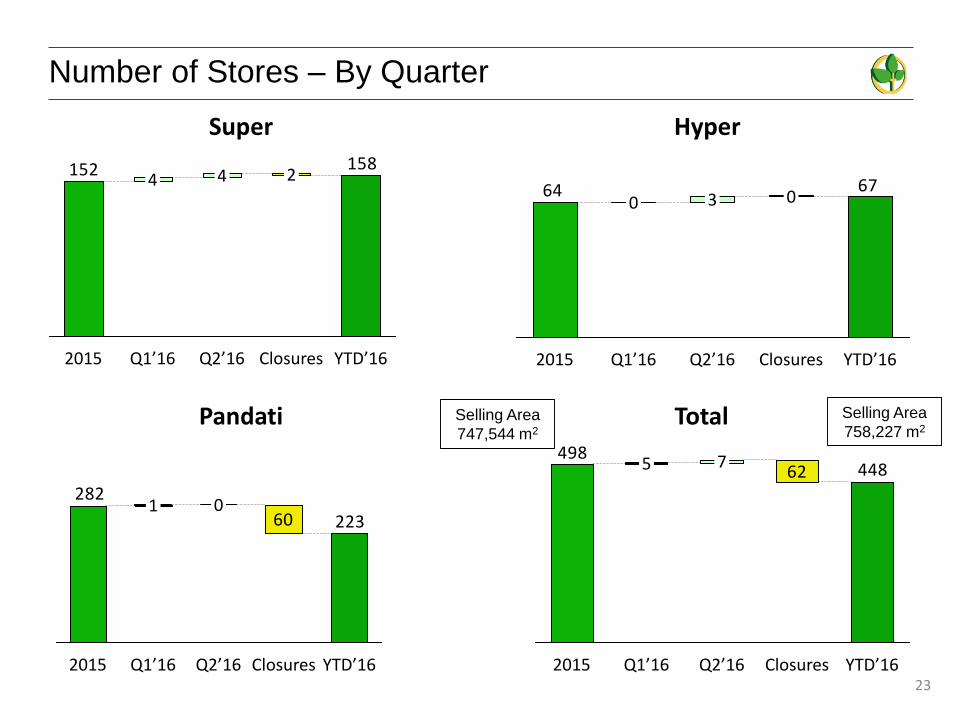
Number of Stores – By Quarter
158152
2015
4
YTD’16Q2’16Q1’16
4 2
Closures
Super
6764
Q1’16
0
2015
3
Q2’16 Closures YTD’16
0
Hyper
282
22360
YTD’16Q2’16Q1’16
01
2015 Closures
Pandati
49844862
Closures YTD’16Q2’16Q1’16
7
2015
5
Total Selling Area
758,227 m2Selling Area
747,544 m2
23

Appendix
24

Quarterly Financials – Q1 2016
25
(all figures are in SAR millions)
Revenue Gross Profit EBIT Net Income EBITDA Revenue Gross Profit EBIT Net Income EBITDA
Food
Oil-Mature Markets 1,675 292 153 107 175 1,930 331 198 119 219
Oil-Start-up Markets* 273 39 14 9 18 354 66 33 25 37
Total Oil 1,949 331 168 117 193 2,284 396 231 144 256
Sugar 733 37 (3) (67) 24 682 21 (24) (52) 4
Pasta 138 31 13 6 18 121 22 9 3 15
Total Foods 2,820 399 177 56 236 3,087 439 217 95 275
Retail
KSA 3,191 810 2 (16) 112 3,118 709 30 17 108
Overseas 80 15 (1) (5) (0) 75 11 2 2 3
Total Retail 3,271 824 1 (21) 112 3,192 720 31 18 110
Real Estate 0 0 16 16 16 0 0 4 4 4
Herfy 0 0 28 28 28 0 0 29 29 29
Al Marai-Savola Share 0 0 112 112 112 0 0 112 112 112
HQ/Elimination/Impairments (68) 0 (48) (98) (48) (55) (0) (23) 212 (19)
Total 6,023 1,223 285 93 456 6,224 1,159 371 471 511
Adjustments
Impairments - -
Capital gains - (265)
Adjusted Profit 93 206
Segment Wise Financials
Q1- 2016 Q1- 2015

Quarterly Financials – Q2 2016
26
(all figures are in SAR millions)
Revenue Gross Profit EBIT Net Income EBITDA Revenue Gross Profit EBIT Net Income EBITDA
Food
Oil-Mature Markets 1,765 380 213 139 236 2,002 401 233 186 254
Oil-Start-up Markets* 288 38 14 9 17 368 57 29 21 33
Total Oil 2,053 418 227 148 253 2,370 458 261 207 287
Sugar 886 49 3 (31) 33 838 42 (0) (17) 28
Pasta 164 40 23 18 27 161 41 22 20 27
Total Foods 3,103 507 253 135 314 3,369 540 283 210 342
Retail
KSA 3,787 766 (61) (80) 50 3,701 801 59 46 149
Overseas 87 17 (0) 0 1 81 12 3 3 3
Total Retail 3,874 782 (61) (80) 51 3,782 813 61 48 153
Real Estate 0 0 0 0 0 0 0 5 5 5
Herfy 0 0 20 20 20 0 0 20 20 20
Al Marai-Savola Share 0 0 232 232 232 0 0 194 194 194
HQ/Elimination/Impairments (86) 0 (29) (60) (13) (114) (0) (21) (43) (17)
Total 6,890 1,290 414 247 604 7,036 1,353 543 434 697
Adjustments
Impairments - -
Capital gains - -
Adjusted Profit 247 434
Segment Wise Financials
Q2- 2016 Q2- 2015