investor presentation q4-2014.pdf
TRANSCRIPT
INVESTOR PRESENTATIONFEBRUARY 2015
Safe Harbor Statement
This presentation contains statements about management's future expectations, plans and prospects of our business thatconstitute forward-looking statements, which are found in various places throughout the press release, including , but notlimited to, statements relating to expectations of orders, net sales, product shipments, backlog, expenses, timing ofpurchases of assembly equipment by customers, gross margins, operating results and capital expenditures. The use ofwords such as “anticipate”, “estimate”, “expect”, “can”, “intend”, “believes”, “may”, “plan”, “predict”, “project”, “forecast”,“will”, “would”, and similar expressions are intended to identify forward looking statements, although not all forward lookingstatements contain these identifying words. The financial guidance set forth under the heading “Outlook” constitutes forwardlooking statements. While these forward looking statements represent our judgments and expectations concerning thedevelopment of our business, a number of risks, uncertainties and other important factors could cause actual developmentsand results to differ materially from those contained in forward looking statements, including the discovery of weaknesses inour internal controls and procedures, our inability to maintain continued demand for our products; the impact on ourbusiness of potential disruptions to European economies from euro zone sovereign credit issues; failure of anticipatedorders to materialize or postponement or cancellation of orders, generally without charges; the volatility in the demand forsemiconductors and our products and services; failure to adequately decrease costs and expenses as revenues decline,loss of significant customers, lengthening of the sales cycle, incurring additional restructuring charges in the future, acts ofterrorism and violence; inability to forecast demand and inventory levels for our products, the integrity of product pricing andprotect our intellectual property in foreign jurisdictions; risks, such as changes in trade regulations, currency fluctuations,political instability and war, associated with substantial foreign customers, suppliers and foreign manufacturing operations;potential instability in foreign capital markets; the risk of failure to successfully manage our diverse operations; thoseadditional risk factors set forth in Besi's annual report for the year ended December 31, 2013 and other key factors thatcould adversely affect our businesses and financial performance contained in our filings and reports, including our statutoryconsolidated statements. We are under no obligation to (and expressly disclaim any such obligation to) update or alter ourforward-looking statements whether as a result of new information, future events or otherwise.
2February 2015
Agenda
I. Company Overview
II. Market
III. Strategy
IV. Financial Review
V. Outlook & Summary
3February 2015
I. COMPANY OVERVIEW
4February 2015
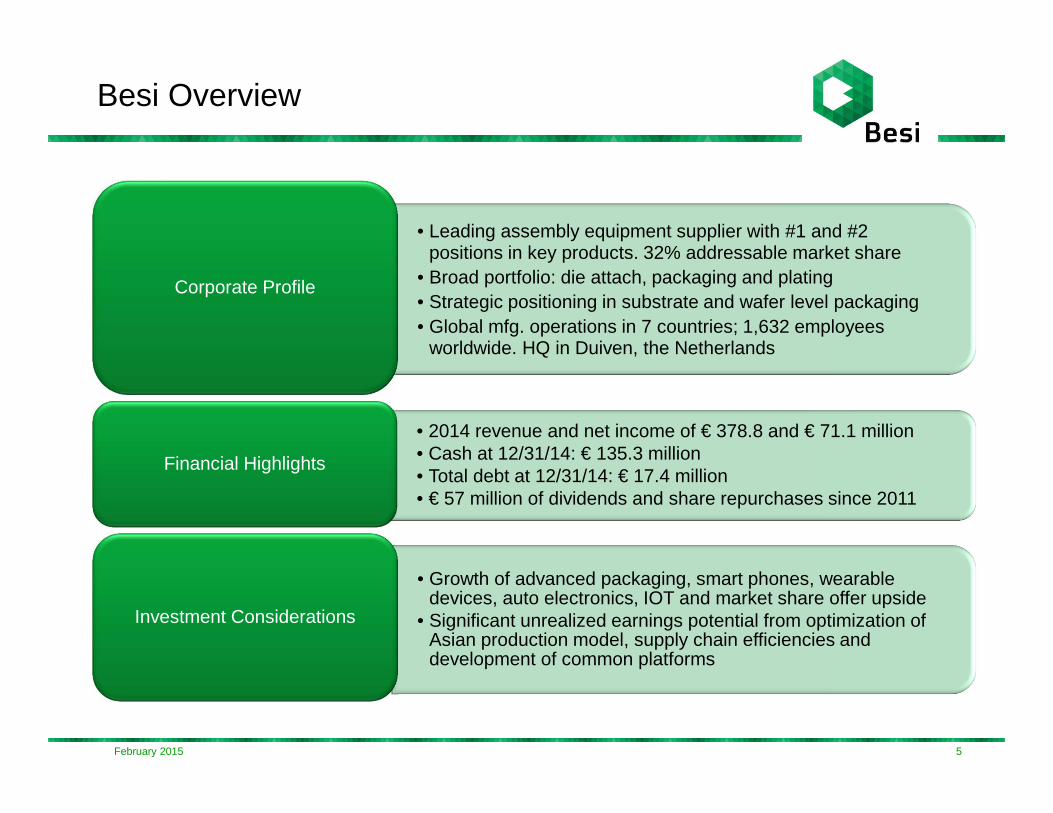
Besi Overview
• Leading assembly equipment supplier with #1 and #2 positions in key products. 32% addressable market share
• Broad portfolio: die attach, packaging and plating• Strategic positioning in substrate and wafer level packaging • Global mfg. operations in 7 countries; 1,632 employees
worldwide. HQ in Duiven, the Netherlands
Corporate Profile
• 2014 revenue and net income of € 378.8 and € 71.1 million• Cash at 12/31/14: € 135.3 million• Total debt at 12/31/14: € 17.4 million• € 57 million of dividends and share repurchases since 2011
Financial Highlights
• Growth of advanced packaging, smart phones, wearable devices, auto electronics, IOT and market share offer upside
• Significant unrealized earnings potential from optimization of Asian production model, supply chain efficiencies and development of common platforms
Investment Considerations
5February 2015
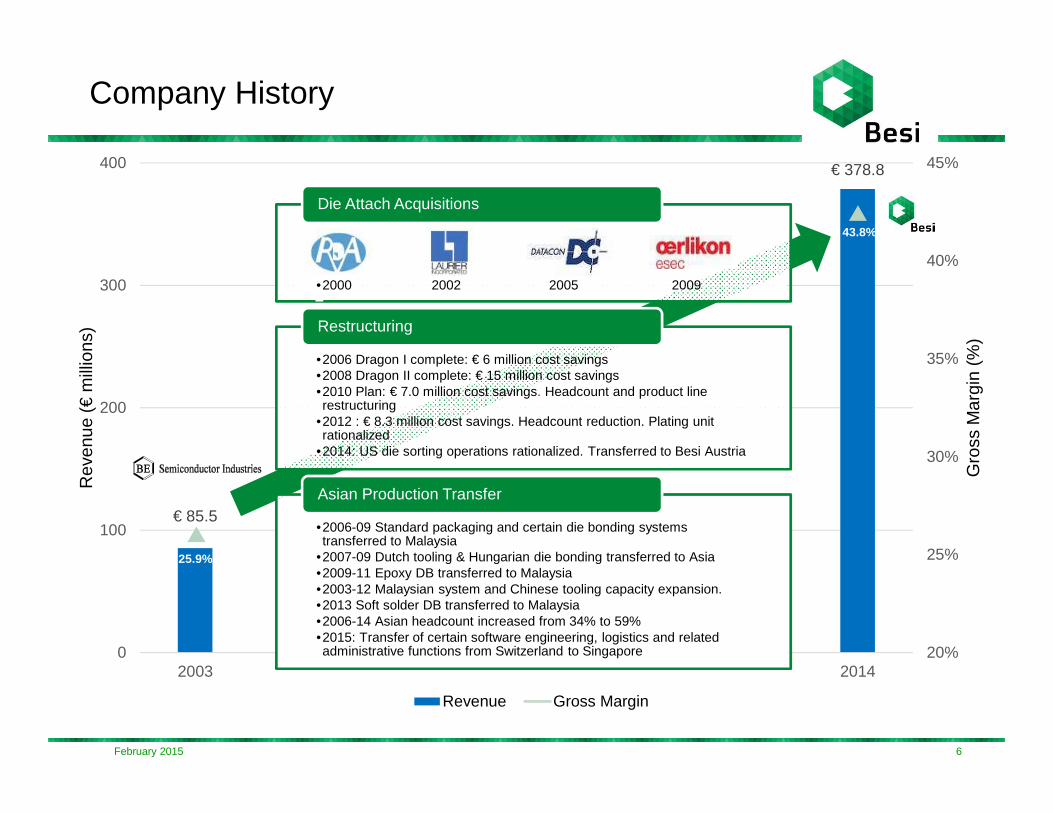
€ 85.5
€ 378.8
25.9%
43.8%
20%
25%
30%
35%
40%
45%
0
100
200
300
400
2003 2014
Gro
ss M
argi
n (%
)
Rev
enue
(€
mill
ions
)
Revenue Gross Margin
Company History
•2000 2002 2005 2009
Die Attach Acquisitions
•2006 Dragon I complete: € 6 million cost savings•2008 Dragon II complete: € 15 million cost savings•2010 Plan: € 7.0 million cost savings. Headcount and product line restructuring
•2012 : € 8.3 million cost savings. Headcount reduction. Plating unit rationalized
•2014: US die sorting operations rationalized. Transferred to Besi Austria
Restructuring
•2006-09 Standard packaging and certain die bonding systems transferred to Malaysia
•2007-09 Dutch tooling & Hungarian die bonding transferred to Asia•2009-11 Epoxy DB transferred to Malaysia•2003-12 Malaysian system and Chinese tooling capacity expansion. •2013 Soft solder DB transferred to Malaysia•2006-14 Asian headcount increased from 34% to 59%•2015: Transfer of certain software engineering, logistics and related administrative functions from Switzerland to Singapore
Asian Production Transfer
6February 2015
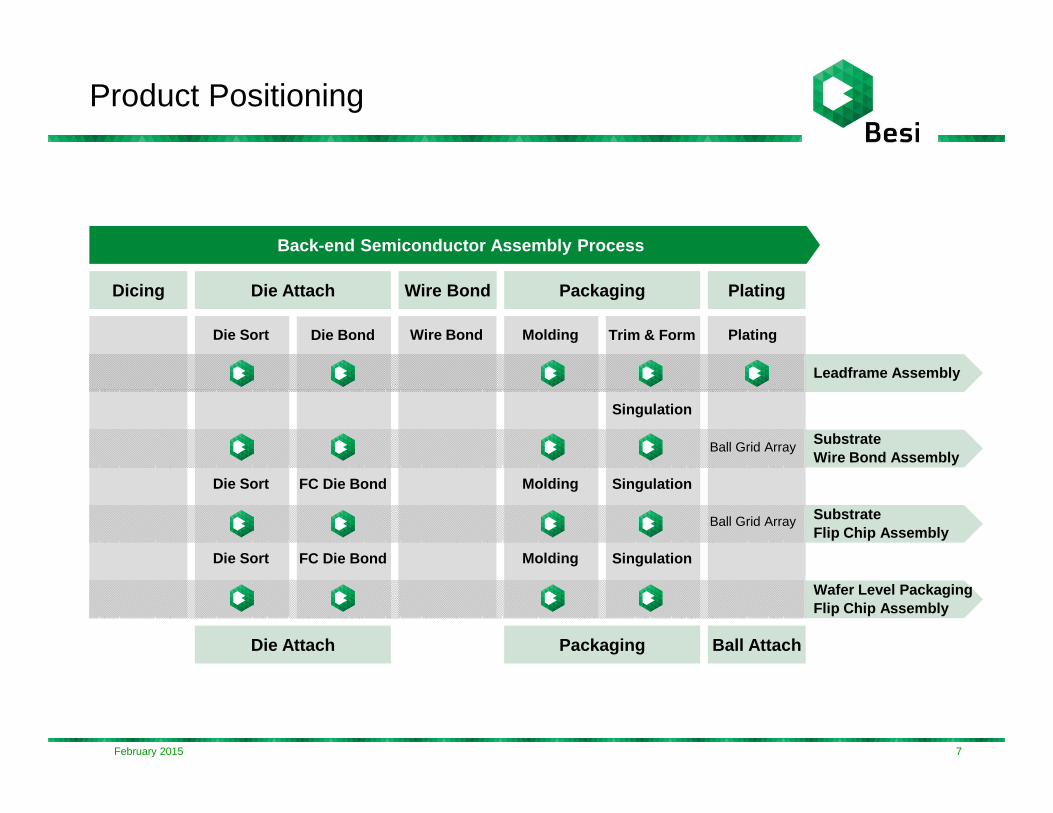
Dicing
Back-end Semiconductor Assembly Process
Die Attach Wire Bond Packaging Plating
Leadframe Assembly
SubstrateWire Bond Assembly
SubstrateFlip Chip Assembly
Wafer Level PackagingFlip Chip Assembly
Wire BondDie Bond
FC Die Bond
FC Die Bond
Molding
Molding
Molding
Trim & Form
Singulation
Singulation
Singulation
Plating
Ball Grid Array
Ball Grid Array
Die Sort
Die Sort
Die Sort
Die Attach Packaging Ball Attach
Product Positioning
7February 2015

Best in Class Product Portfolio
• Molding- AMS series- AMS LM 95- MMS series- FML
• Die Bonding- 2100 xPplus
- 2100 sDplus
- 2100 sD PPPplus
- 2100 HS - 2009 SSI- 2100 DS
Die Attach Packaging & Plating
• Multi Module Die Attach- 2200 evo- 2200 evo plus
• Flip Chip- 8800 FC QUANTUM- 8800 CHAMEO- 8800 TCB - 2100 FC
• Trim & Form- Compact series- Power series- Compact Line XHD New
• Plating- Leadframe- Solar- Film & Foil
In Development
•Next generation Die Attach
•Next generation Packaging
•Common modules
Datacon
Datacon
Esec
Fico
Meco
Fico
New
8
Fico
• Singulation- FSL
New
New
• Die Sorting- DS 9000E- WTT- TTR- DLA
Datacon
NewNew
New
New
February 2015
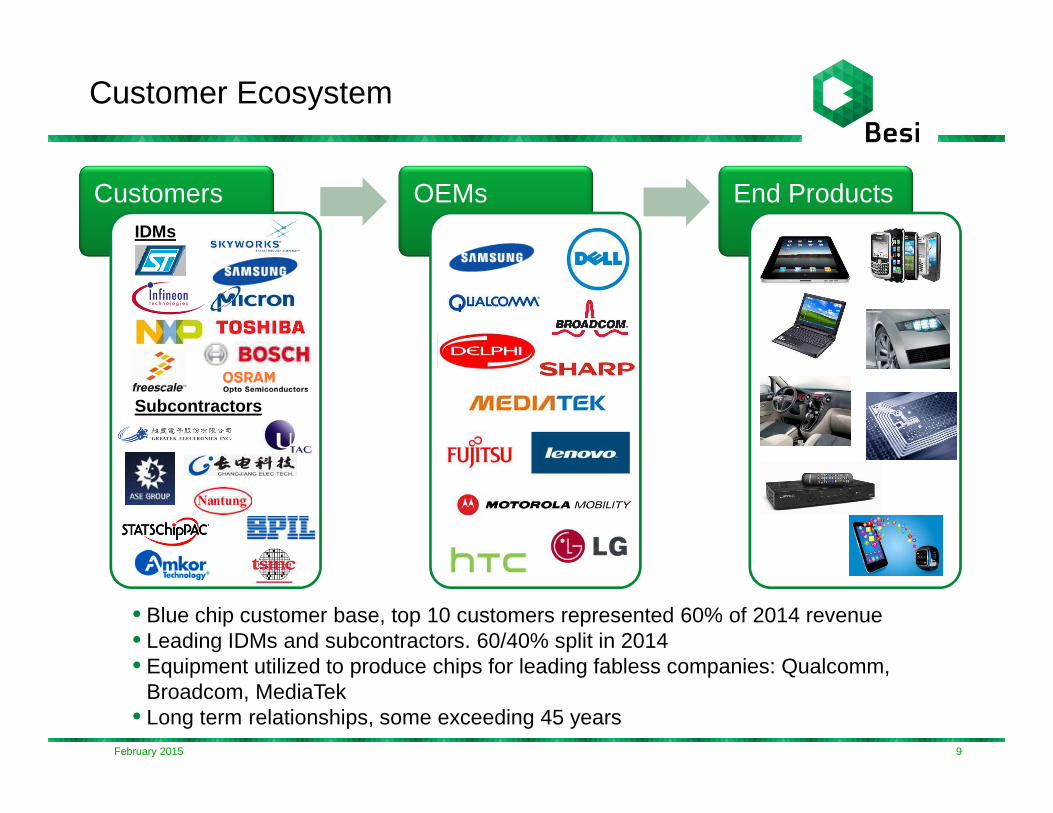
Customers OEMs End Products
Customer Ecosystem
• Blue chip customer base, top 10 customers represented 60% of 2014 revenue • Leading IDMs and subcontractors. 60/40% split in 2014• Equipment utilized to produce chips for leading fabless companies: Qualcomm,
Broadcom, MediaTek• Long term relationships, some exceeding 45 years
IDMs
Subcontractors
9February 2015
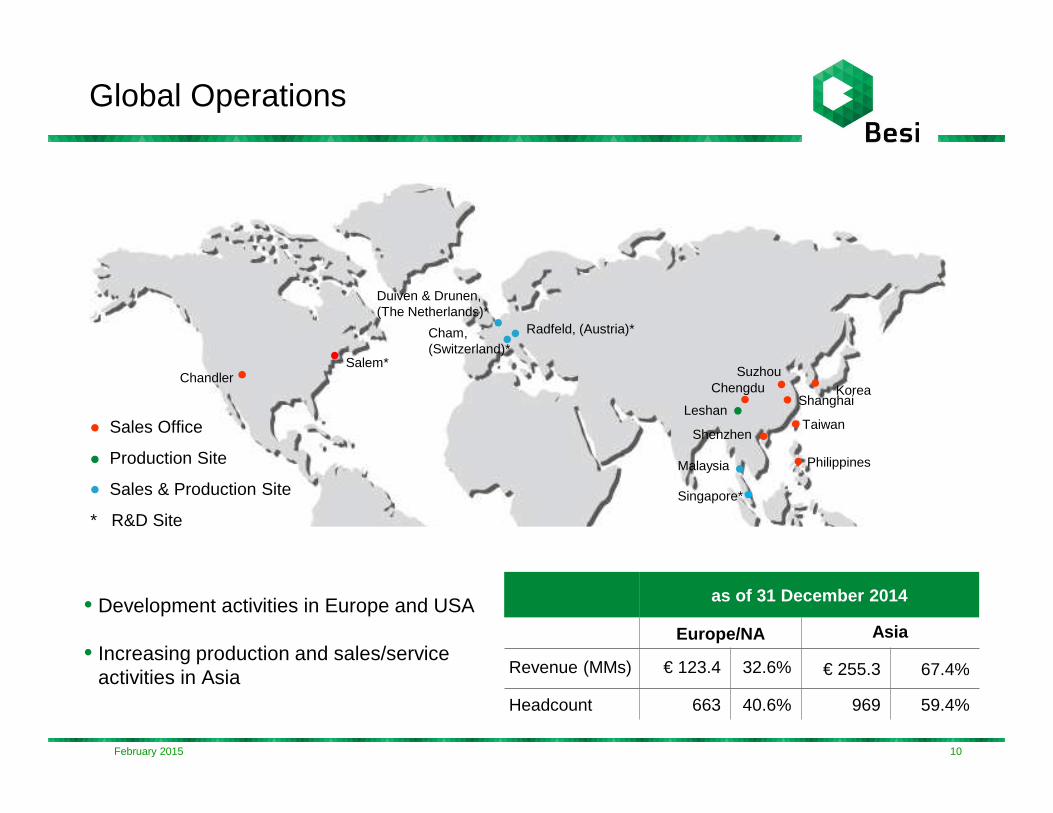
Global Operations
as of 31 December 2014
Europe/NA Asia
Revenue (MMs) € 123.4 32.6% € 255.3 67.4%
Headcount 663 40.6% 969 59.4%
• Development activities in Europe and USA
• Increasing production and sales/service activities in Asia
Sales Office
Production Site
Sales & Production Site
* R&D Site
Leshan
ChengduShanghai
Korea
Taiwan
PhilippinesMalaysia
Singapore*
Salem*Suzhou
Radfeld, (Austria)*Cham,(Switzerland)*
Duiven & Drunen,(The Netherlands)*
Chandler
Shenzhen
10February 2015
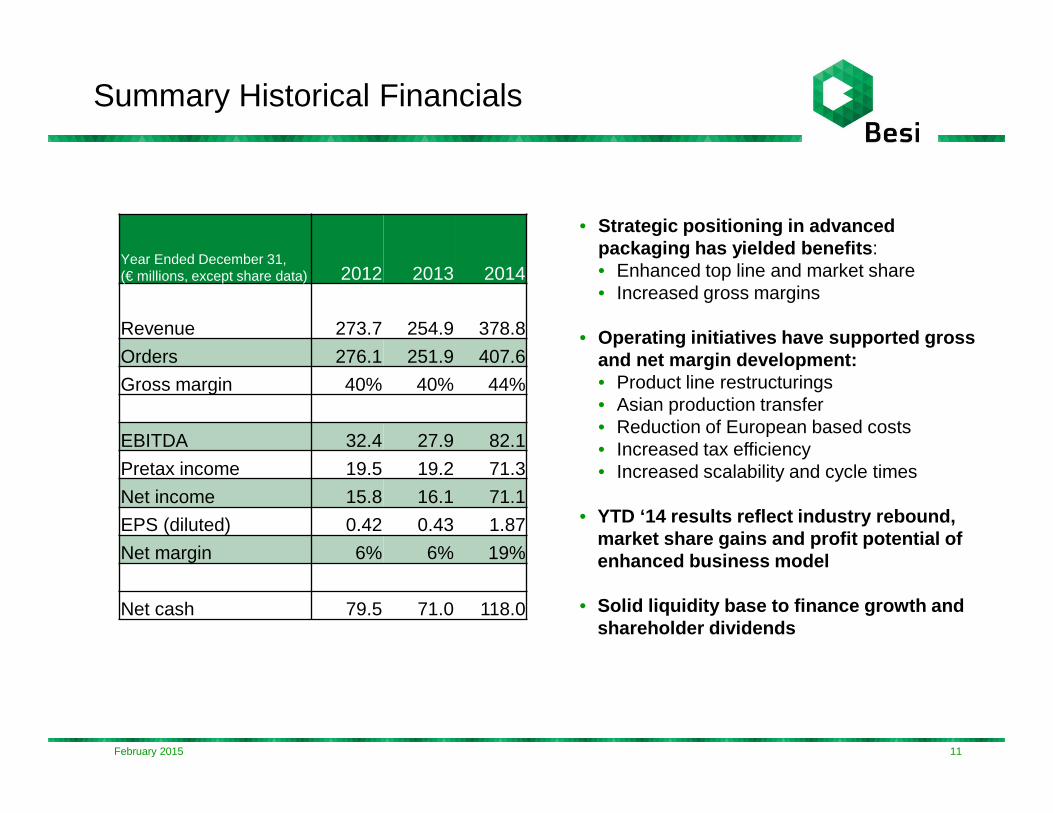
• Strategic positioning in advanced packaging has yielded benefits :• Enhanced top line and market share• Increased gross margins
• Operating initiatives have supported gross and net margin development:• Product line restructurings• Asian production transfer• Reduction of European based costs• Increased tax efficiency• Increased scalability and cycle times
• YTD ‘14 results reflect industry rebound, market share gains and profit potential of enhanced business model
• Solid liquidity base to finance growth and shareholder dividends
Year Ended December 31, (€ millions, except share data) 2012 2013 2014
Revenue 273.7 254.9 378.8
Orders 276.1 251.9 407.6
Gross margin 40% 40% 44%
EBITDA 32.4 27.9 82.1
Pretax income 19.5 19.2 71.3
Net income 15.8 16.1 71.1
EPS (diluted) 0.42 0.43 1.87
Net margin 6% 6% 19%
Net cash 79.5 71.0 118.0
Summary Historical Financials
11February 2015
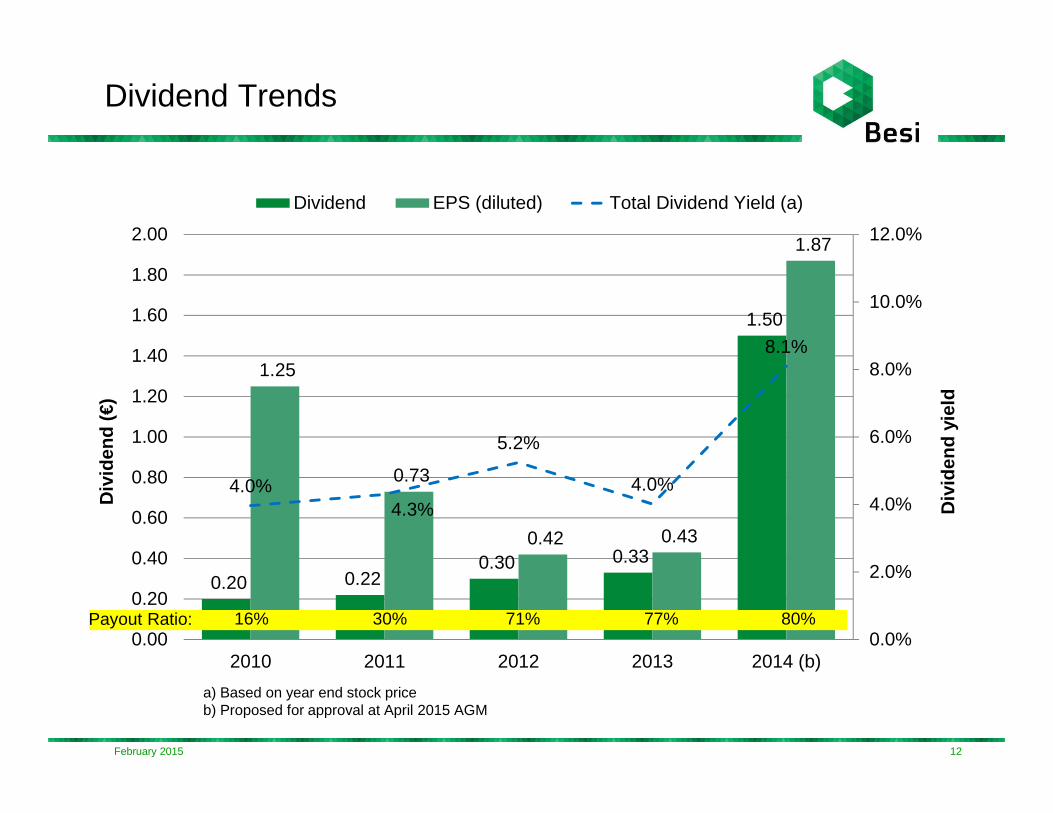
Dividend Trends
12
0.20 0.22 0.30 0.33
1.50
1.25
0.73
0.42 0.43
1.87
4.0%4.3%
5.2%
4.0%
8.1%
0.0%
2.0%
4.0%
6.0%
8.0%
10.0%
12.0%
0.00
0.20
0.40
0.60
0.80
1.00
1.20
1.40
1.60
1.80
2.00
2010 2011 2012 2013 2014 (b)
Div
iden
d yi
eld
Div
iden
d (€
)
Dividend EPS (diluted) Total Dividend Yield (a)
a) Based on year end stock priceb) Proposed for approval at April 2015 AGM
February 2015
16% 30% 71% 77% 80%Payout Ratio:

II. MARKET
13February 2015
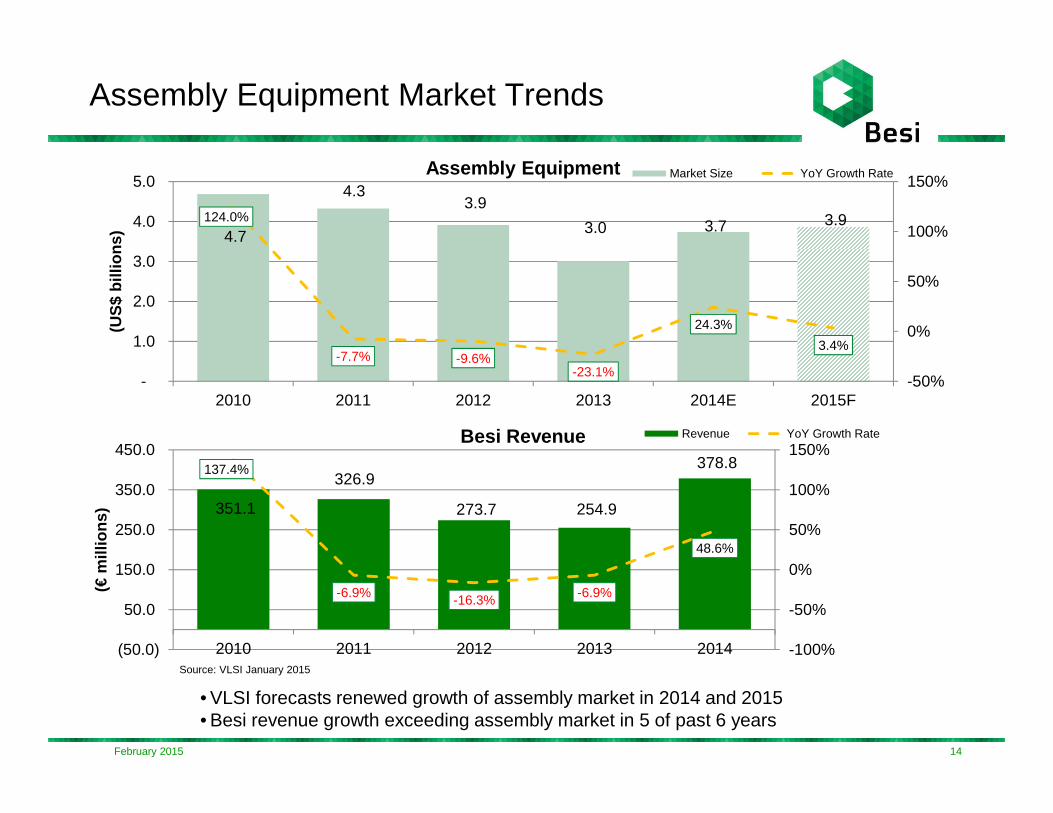
Assembly Equipment Market Trends
14February 2015
• VLSI forecasts renewed growth of assembly market in 2014 and 2015• Besi revenue growth exceeding assembly market in 5 of past 6 years
351.1
326.9
273.7 254.9
378.8 137.4%
-6.9% -16.3% -6.9%
48.6%
-100%
-50%
0%
50%
100%
150%
(50.0)
50.0
150.0
250.0
350.0
450.0
2010 2011 2012 2013 2014
(€m
illio
ns)
Besi Revenue Revenue YoY Growth Rate
4.7
4.3 3.9
3.0 3.7 3.9 124.0%
-7.7% -9.6%-23.1%
24.3%
3.4%
-50%
0%
50%
100%
150%
-
1.0
2.0
3.0
4.0
5.0
2010 2011 2012 2013 2014E 2015F
(US
$ bi
llion
s)
Assembly Equipment Market Size YoY Growth Rate
Source: VLSI January 2015
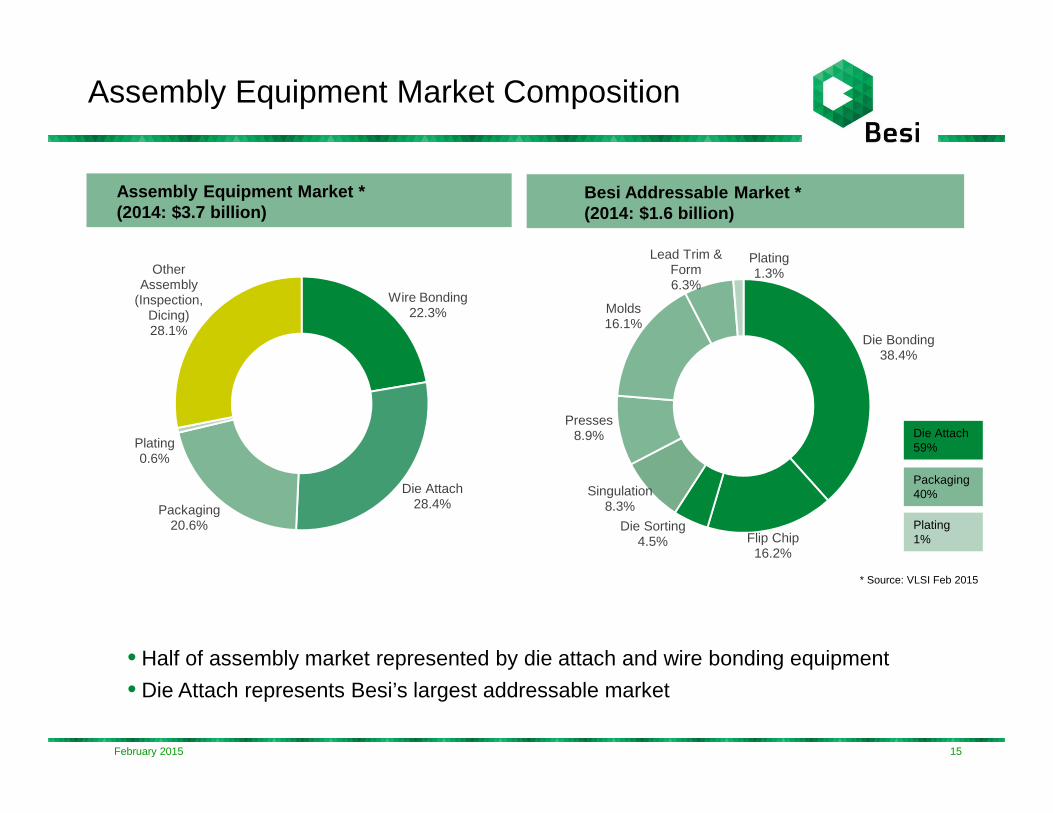
Die Bonding38.4%
Flip Chip16.2%
Die Sorting4.5%
Singulation8.3%
Presses8.9%
Molds16.1%
Lead Trim & Form6.3%
Plating1.3%
Assembly Equipment Market Composition
• Half of assembly market represented by die attach and wire bonding equipment
• Die Attach represents Besi’s largest addressable market
Die Attach 59%
Packaging 40%
Plating1%
Assembly Equipment Market * (2014: $3.7 billion)
Besi Addressable Market *(2014: $1.6 billion)
* Source: VLSI Feb 2015
Wire Bonding22.3%
Die Attach28.4%Packaging
20.6%
Plating0.6%
Other Assembly
(Inspection, Dicing)28.1%
15February 2015
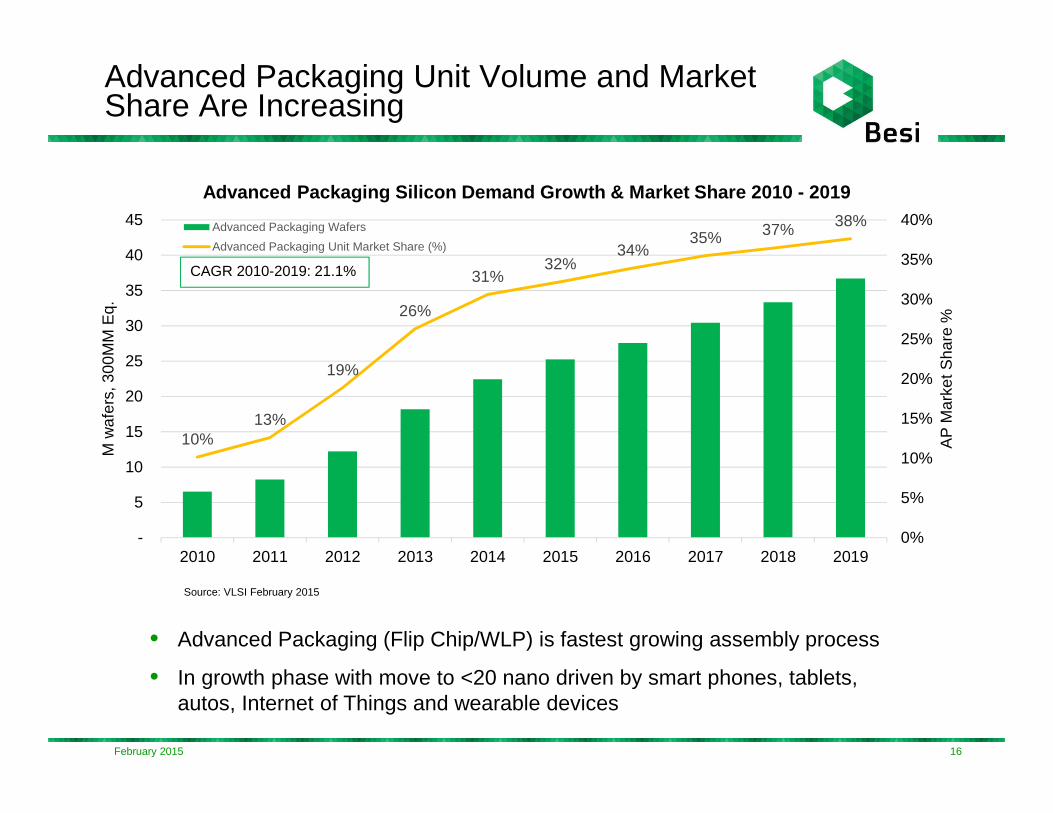
Advanced Packaging Unit Volume and MarketShare Are Increasing
• Advanced Packaging (Flip Chip/WLP) is fastest growing assembly process
• In growth phase with move to <20 nano driven by smart phones, tablets, autos, Internet of Things and wearable devices
Source: VLSI February 2015
16February 2015
10%13%
19%
26%
31%32%
34%35% 37% 38%
0%
5%
10%
15%
20%
25%
30%
35%
40%
-
5
10
15
20
25
30
35
40
45
2010 2011 2012 2013 2014 2015 2016 2017 2018 2019
AP
Mar
ket S
hare
%
M w
afer
s, 3
00M
M E
q.
Advanced Packaging Silicon Demand Growth & Market S hare 2010 - 2019
Advanced Packaging Wafers
Advanced Packaging Unit Market Share (%)
CAGR 2010-2019: 21.1%
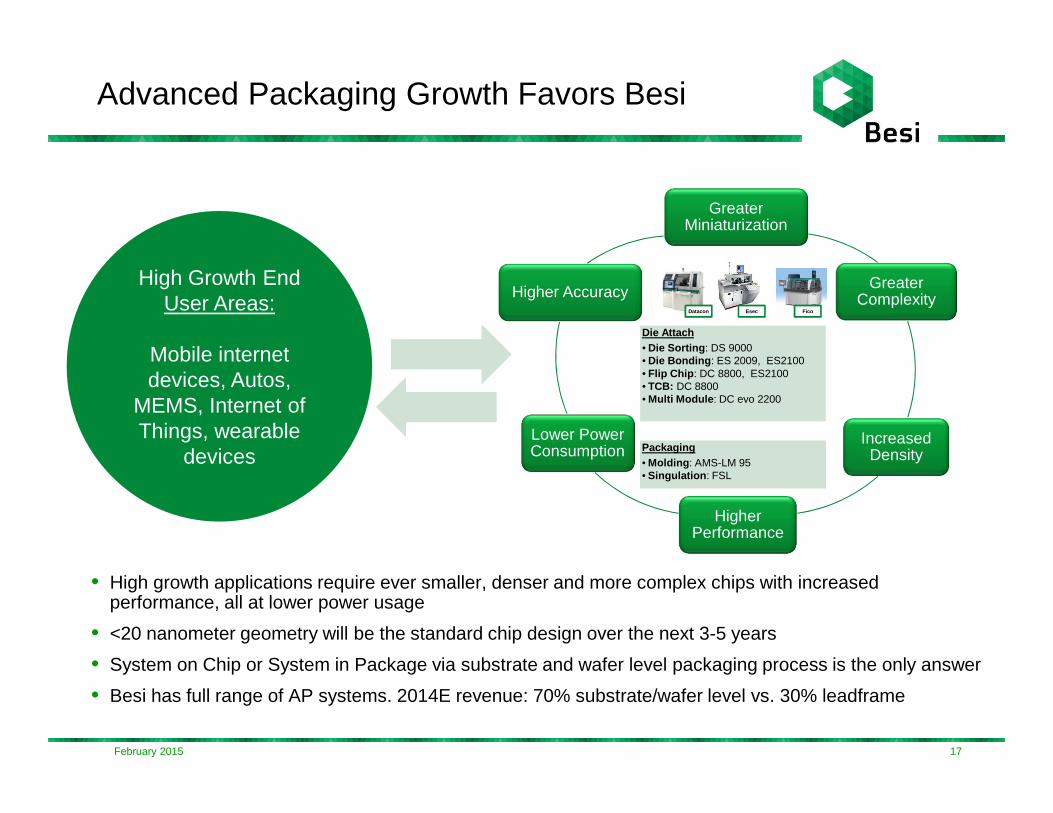
Advanced Packaging Growth Favors Besi
Greater Miniaturization
Greater Complexity
Increased Density
Higher Performance
Lower Power Consumption
Higher Accuracy
• High growth applications require ever smaller, denser and more complex chips with increased performance, all at lower power usage
• <20 nanometer geometry will be the standard chip design over the next 3-5 years
• System on Chip or System in Package via substrate and wafer level packaging process is the only answer
• Besi has full range of AP systems. 2014E revenue: 70% substrate/wafer level vs. 30% leadframe
Die Attach• Die Sorting : DS 9000• Die Bonding : ES 2009, ES2100• Flip Chip : DC 8800, ES2100• TCB: DC 8800• Multi Module : DC evo 2200
Packaging• Molding : AMS-LM 95• Singulation : FSL
High Growth EndUser Areas:
Mobile internet devices, Autos,
MEMS, Internet of Things, wearable
devices
Datacon Esec Fico
17February 2015
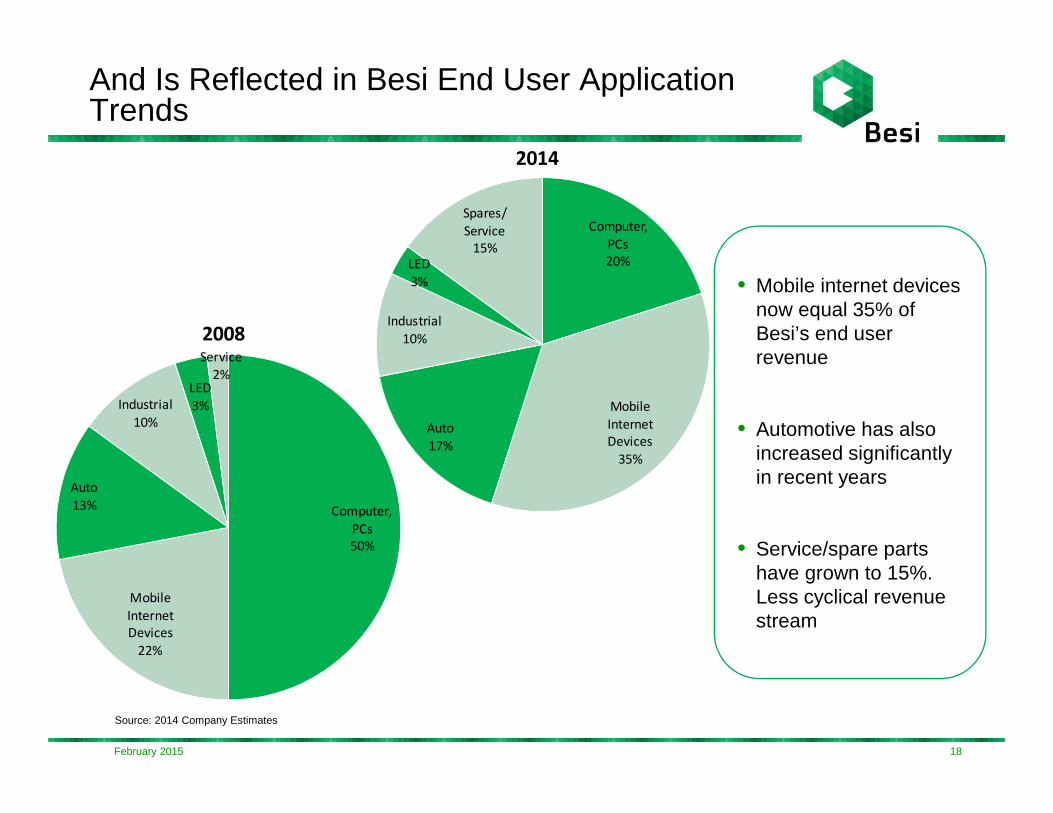
Computer,
PCs
50%
Mobile
Internet
Devices
22%
Auto
13%
Industrial
10%
LED
3%
Service
2%
2008
And Is Reflected in Besi End User Application Trends
Computer,
PCs
20%
Mobile
Internet
Devices
35%
Auto
17%
Industrial
10%
LED
3%
Spares/
Service
15%
2014
Source: 2014 Company Estimates
• Mobile internet devices now equal 35% of Besi’s end user revenue
• Automotive has also increased significantly in recent years
• Service/spare parts have grown to 15%. Less cyclical revenue stream
18February 2015
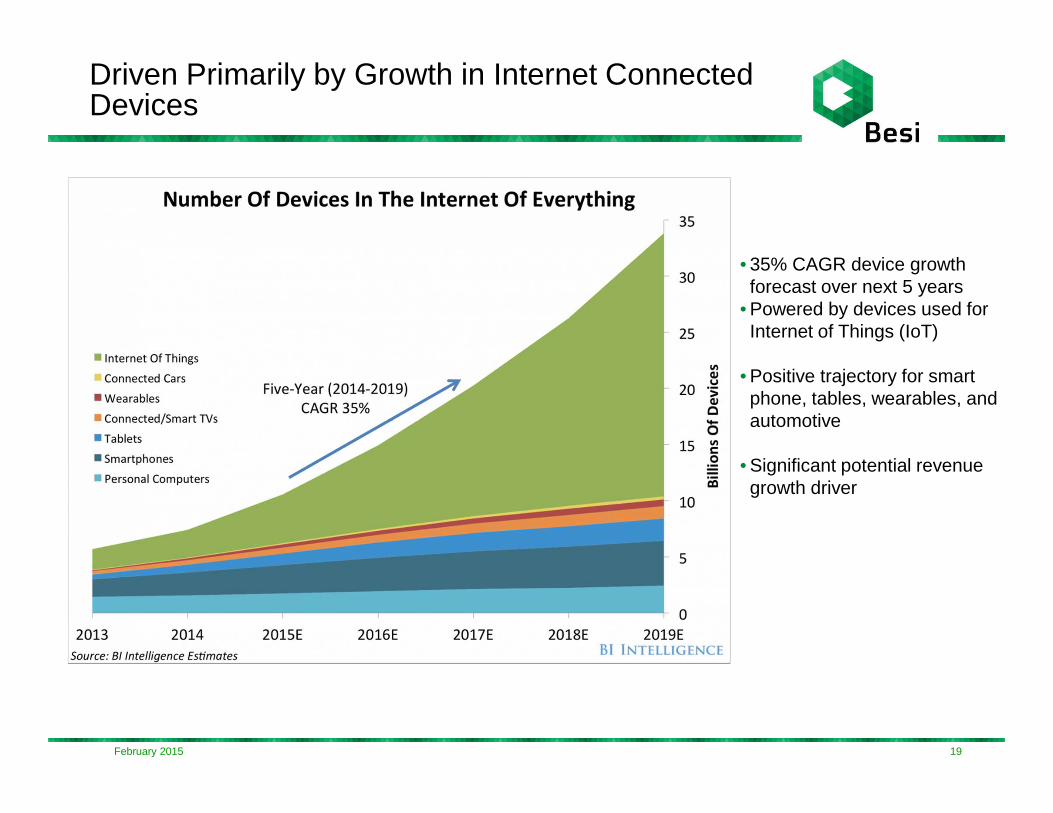
Driven Primarily by Growth in Internet Connected Devices
• 35% CAGR device growth forecast over next 5 years
• Powered by devices used for Internet of Things (IoT)
• Positive trajectory for smart phone, tables, wearables, and automotive
• Significant potential revenue growth driver
19February 2015
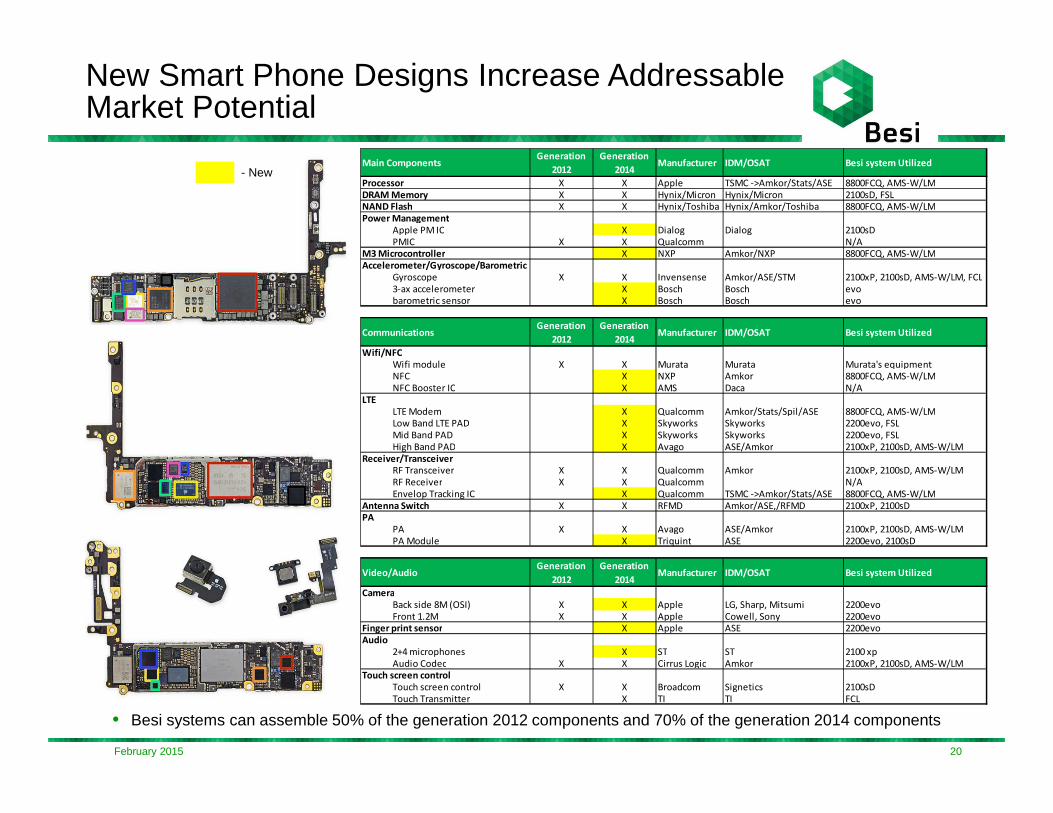
New Smart Phone Designs Increase Addressable Market Potential
• Besi systems can assemble 50% of the generation 2012 components and 70% of the generation 2014 components
- New
20
Main ComponentsGeneration
2012
Generation
2014Manufacturer IDM/OSAT Besi system Utilized
Processor X X Apple TSMC ->Amkor/Stats/ASE 8800FCQ, AMS-W/LM
DRAM Memory X X Hynix/Micron Hynix/Micron 2100sD, FSL
NAND Flash X X Hynix/Toshiba Hynix/Amkor/Toshiba 8800FCQ, AMS-W/LM
Power Management
Apple PM IC X Dialog Dialog 2100sD
PMIC X X Qualcomm N/A
M3 Microcontroller X NXP Amkor/NXP 8800FCQ, AMS-W/LM
Accelerometer/Gyroscope/Barometric
Gyroscope X X Invensense Amkor/ASE/STM 2100xP, 2100sD, AMS-W/LM, FCL
3-ax accelerometer X Bosch Bosch evo
barometric sensor X Bosch Bosch evo
CommunicationsGeneration
2012
Generation
2014Manufacturer IDM/OSAT Besi system Utilized
Wifi/NFC
Wifi module X X Murata Murata Murata's equipment
NFC X NXP Amkor 8800FCQ, AMS-W/LM
NFC Booster IC X AMS Daca N/A
LTE
LTE Modem X Qualcomm Amkor/Stats/Spil/ASE 8800FCQ, AMS-W/LM
Low Band LTE PAD X Skyworks Skyworks 2200evo, FSL
Mid Band PAD X Skyworks Skyworks 2200evo, FSL
High Band PAD X Avago ASE/Amkor 2100xP, 2100sD, AMS-W/LM
Receiver/TransceiverRF Transceiver X X Qualcomm Amkor 2100xP, 2100sD, AMS-W/LM
RF Receiver X X Qualcomm N/A
Envelop Tracking IC X Qualcomm TSMC ->Amkor/Stats/ASE 8800FCQ, AMS-W/LM
Antenna Switch X X RFMD Amkor/ASE,/RFMD 2100xP, 2100sD
PA
PA X X Avago ASE/Amkor 2100xP, 2100sD, AMS-W/LM
PA Module X Triquint ASE 2200evo, 2100sD
Video/AudioGeneration
2012
Generation
2014Manufacturer IDM/OSAT Besi system Utilized
Camera
Back side 8M (OSI) X X Apple LG, Sharp, Mitsumi 2200evo
Front 1.2M X X Apple Cowell, Sony 2200evo
Finger print sensor X Apple ASE 2200evo
Audio
2+4 microphones X ST ST 2100 xp
Audio Codec X X Cirrus Logic Amkor 2100xP, 2100sD, AMS-W/LM
Touch screen control
Touch screen control X X Broadcom Signetics 2100sD
Touch Transmitter X TI TI FCL
February 2015
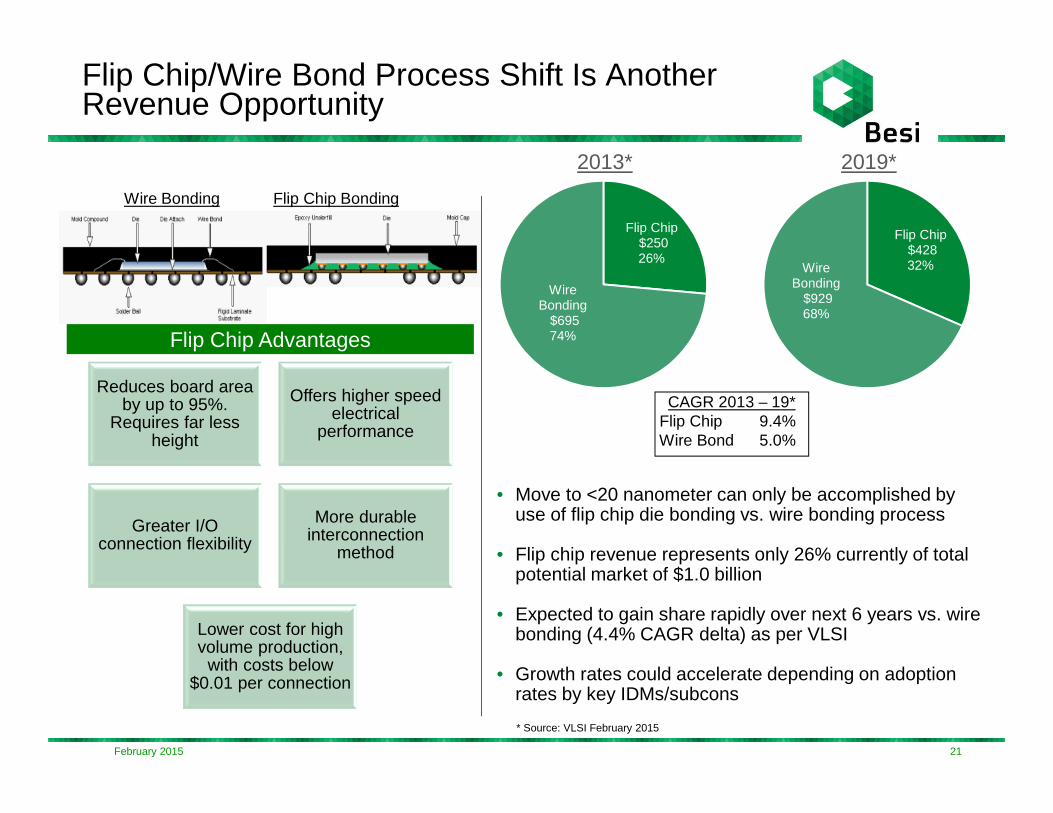
Flip Chip/Wire Bond Process Shift Is Another Revenue Opportunity
• Move to <20 nanometer can only be accomplished by use of flip chip die bonding vs. wire bonding process
• Flip chip revenue represents only 26% currently of total potential market of $1.0 billion
• Expected to gain share rapidly over next 6 years vs. wire bonding (4.4% CAGR delta) as per VLSI
• Growth rates could accelerate depending on adoption rates by key IDMs/subcons
CAGR 2013 – 19*Flip Chip 9.4%Wire Bond 5.0%
Wire Bonding Flip Chip Bonding
Reduces board area by up to 95%.
Requires far less height
Offers higher speed electrical
performance
Greater I/O connection flexibility
More durable interconnection
method
Lower cost for high volume production,
with costs below $0.01 per connection
Flip Chip Advantages
* Source: VLSI February 2015
Flip Chip$428 32%Wire
Bonding$929 68%
2019*
Flip Chip$250 26%
Wire Bonding
$695 74%
2013*
21February 2015
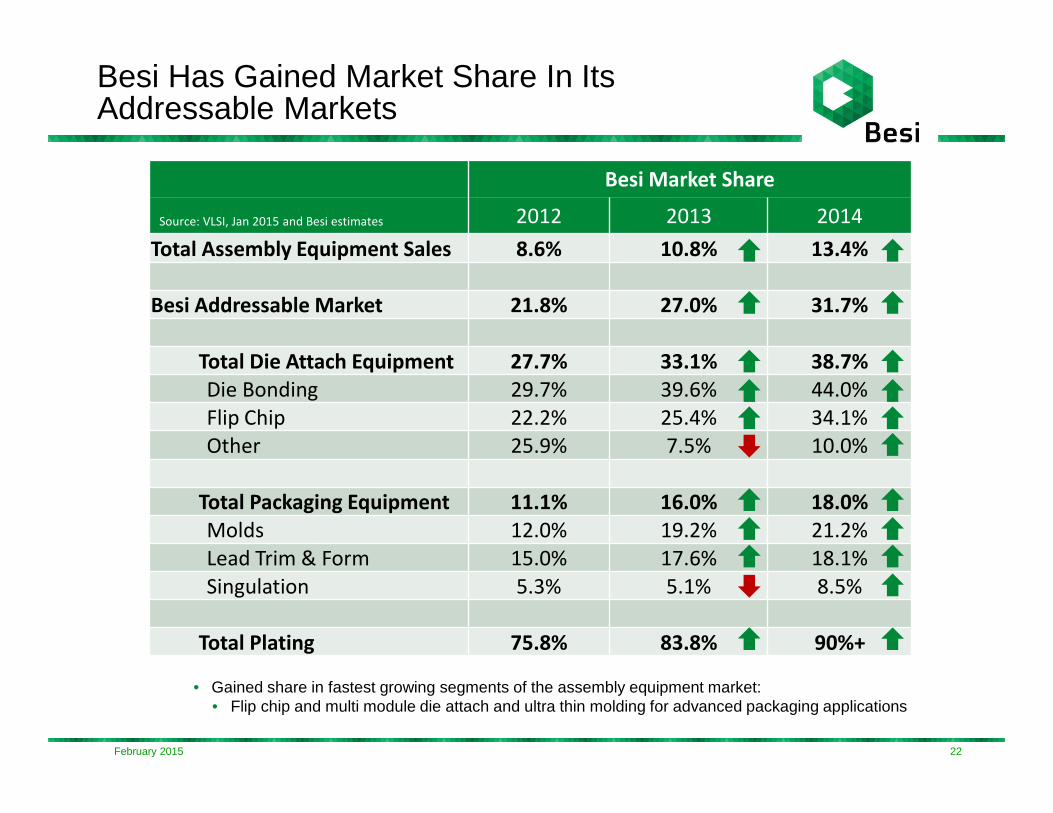
Besi Has Gained Market Share In Its Addressable Markets
• Gained share in fastest growing segments of the assembly equipment market:• Flip chip and multi module die attach and ultra thin molding for advanced packaging applications
Besi Market Share
Source: VLSI, Jan 2015 and Besi estimates 2012 2013 2014
Total Assembly Equipment Sales 8.6% 10.8% 13.4%
Besi Addressable Market 21.8% 27.0% 31.7%
Total Die Attach Equipment 27.7% 33.1% 38.7%
Die Bonding 29.7% 39.6% 44.0%
Flip Chip 22.2% 25.4% 34.1%
Other 25.9% 7.5% 10.0%
Total Packaging Equipment 11.1% 16.0% 18.0%
Molds 12.0% 19.2% 21.2%
Lead Trim & Form 15.0% 17.6% 18.1%
Singulation 5.3% 5.1% 8.5%
Total Plating 75.8% 83.8% 90%+
February 2015 22

• Customers are largest producers. • Engaged in most advanced packaging applications
• Strong customer market shares:• ≈ 60 - 100% of die attach requirements
• ≈ 20 - 100% of packaging requirements
• Customer market shares p.a. vary based on capacity needs and purchasing cycles
• Primary competition:• Die Attach: ASM-PT, Hitachi, Canon• Packaging: Towa, Hanmi,
ASM-PT
And With Leading Edge Technology Customers
N/B No reported bookings for Besi or its competitors* Fabless semiconductor companies such as Qualcomm, Broadcom and Mediatek have assembly
production done by subcontractors** In general, Samsung satisfies approximately 50% of its equipment needs internally
23February 2015
Die Attach PackagingIn USD 2012 2013 2014 2012 2013 2014
SubcontractorsASE 67% 59% 69% 36% 65% 24%Amkor 75% 84% 89% 45% 11% 22%STATSChippac 95% 100% 85% 28% 100% 100%SPIL 47% 93% 89% 37% 76% 19%Unisem 92% 84% 100% N/B N/B N/BJCET 75% 48% 67% 0% 8% 0%Cowell/Foxconn
100% N/B 100%(Camera Modules) N/B N/B N/B
IDMs *Skyworks 100% 96% 100% 13% 24% 38%ST Micro 91% 72% 78% 44% 76% 42%Infineon 81% 97% 100% 0% 24% 90%Micron 86% 100% 43% 50% N/B 100%Samsung** 5% 0% N/B 0% 100% N/B
% of Besi Die Attach and Packaging systems revenue
49% 48% 60% 54% 66% 54%
III. STRATEGY
24February 2015
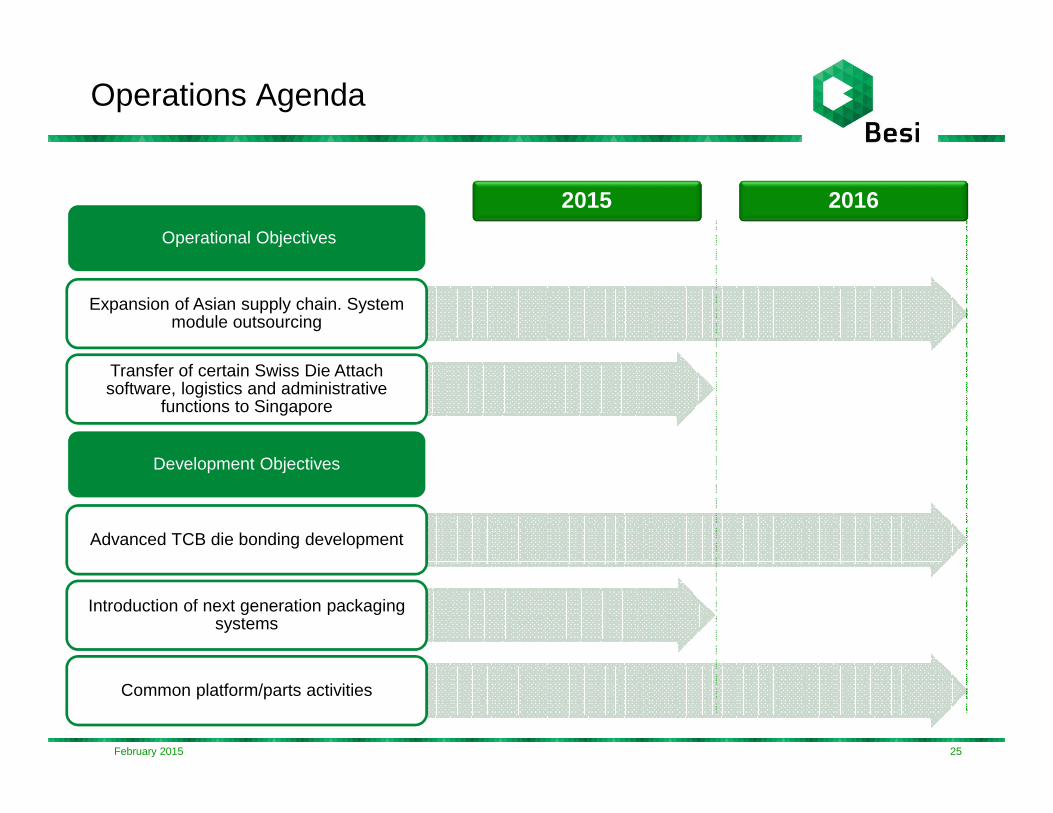
Operations Agenda
Operational Objectives
Expansion of Asian supply chain. System module outsourcing
Transfer of certain Swiss Die Attach software, logistics and administrative
functions to Singapore
Development Objectives
Advanced TCB die bonding development
Introduction of next generation packaging systems
Common platform/parts activities
2015 2016
25February 2015

Asian Production Has Significantly Expanded
26February 2015
396
487
658 673
963
170
331
553 579
927
42.9%
68.0%
84.0% 86.0%
96.3%
0.0%
10.0%
20.0%
30.0%
40.0%
50.0%
60.0%
70.0%
80.0%
90.0%
100.0%
-
200
400
600
800
1,000
1,200
2010 2011 2012 2013 2014
% D
irect
Shi
pmen
ts
Shi
pmen
ts
Total Asian Shipments Direct Asian Shipments % Direct
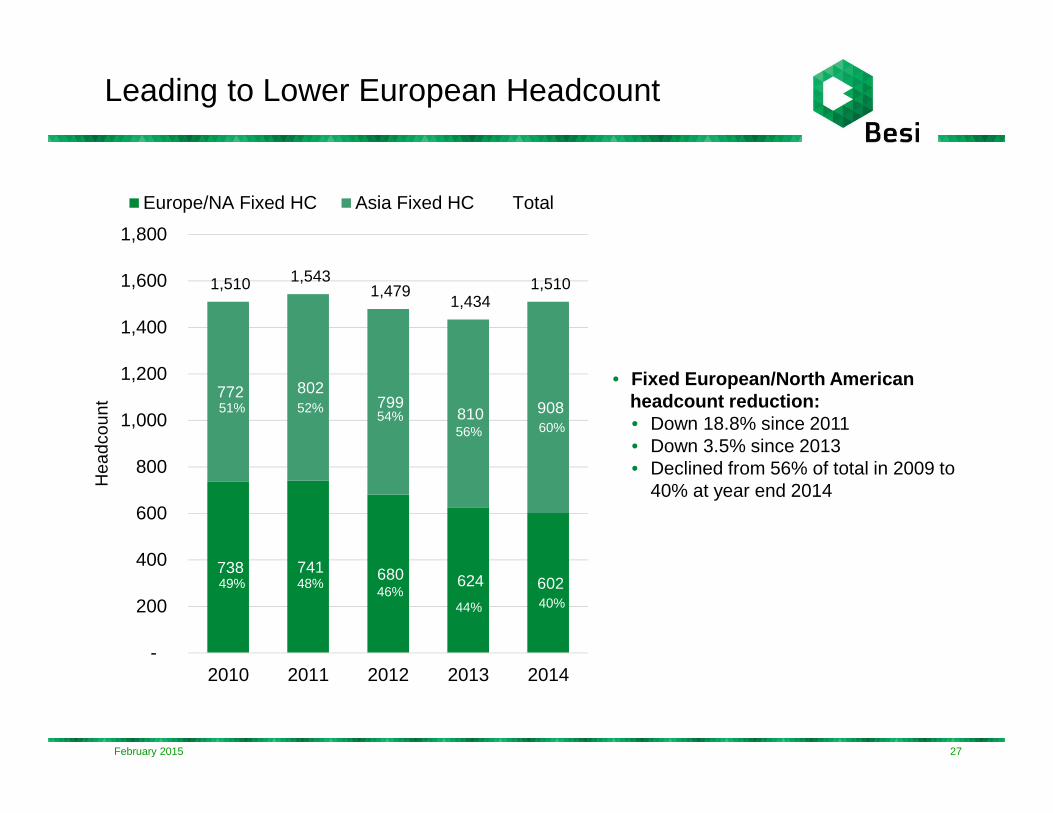
Leading to Lower European Headcount
• Fixed European/North American headcount reduction:• Down 18.8% since 2011• Down 3.5% since 2013• Declined from 56% of total in 2009 to
40% at year end 2014
738 741 680 624 602
772 802 799
810 908
1,510 1,543 1,479
1,434 1,510
-
200
400
600
800
1,000
1,200
1,400
1,600
1,800
2010 2011 2012 2013 2014
Hea
dcou
nt
Europe/NA Fixed HC Asia Fixed HC Total
51%
49%
52%
48%
54%
46%
56%
44%
60%
40%
27February 2015
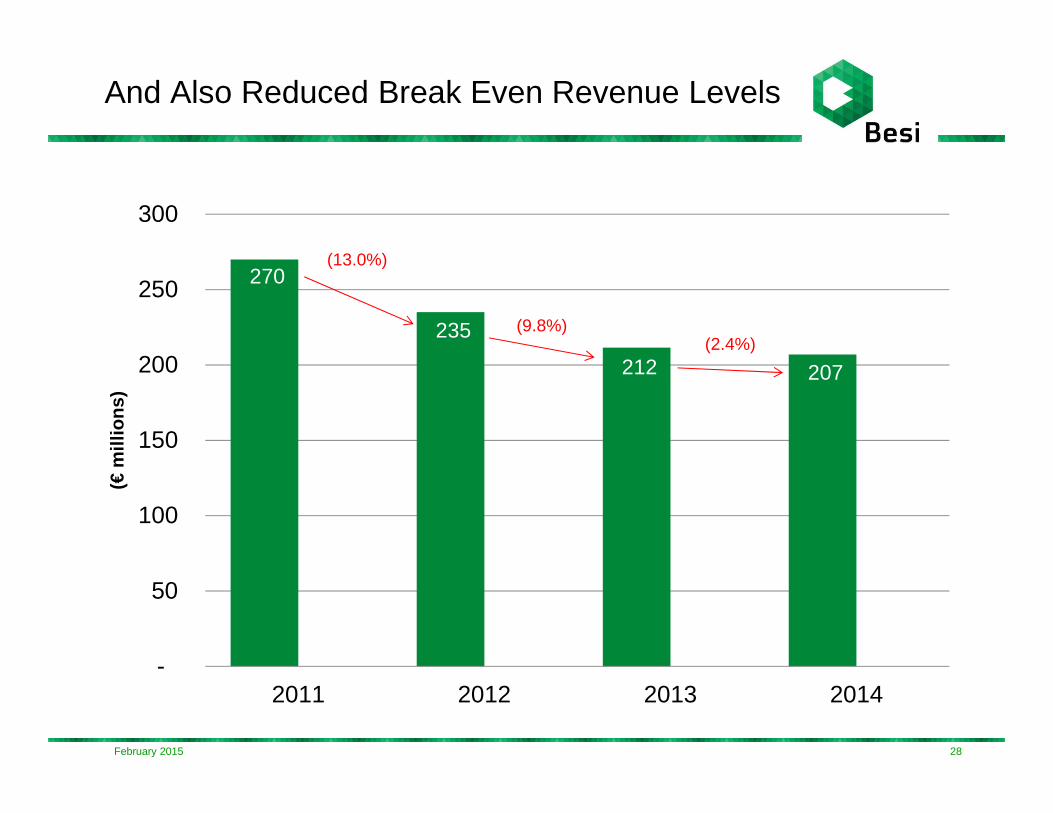
And Also Reduced Break Even Revenue Levels
28February 2015
270
235
212 207
-
50
100
150
200
250
300
2011 2012 2013 2014
(€m
illio
ns)
(13.0%)
(9.8%)(2.4%)
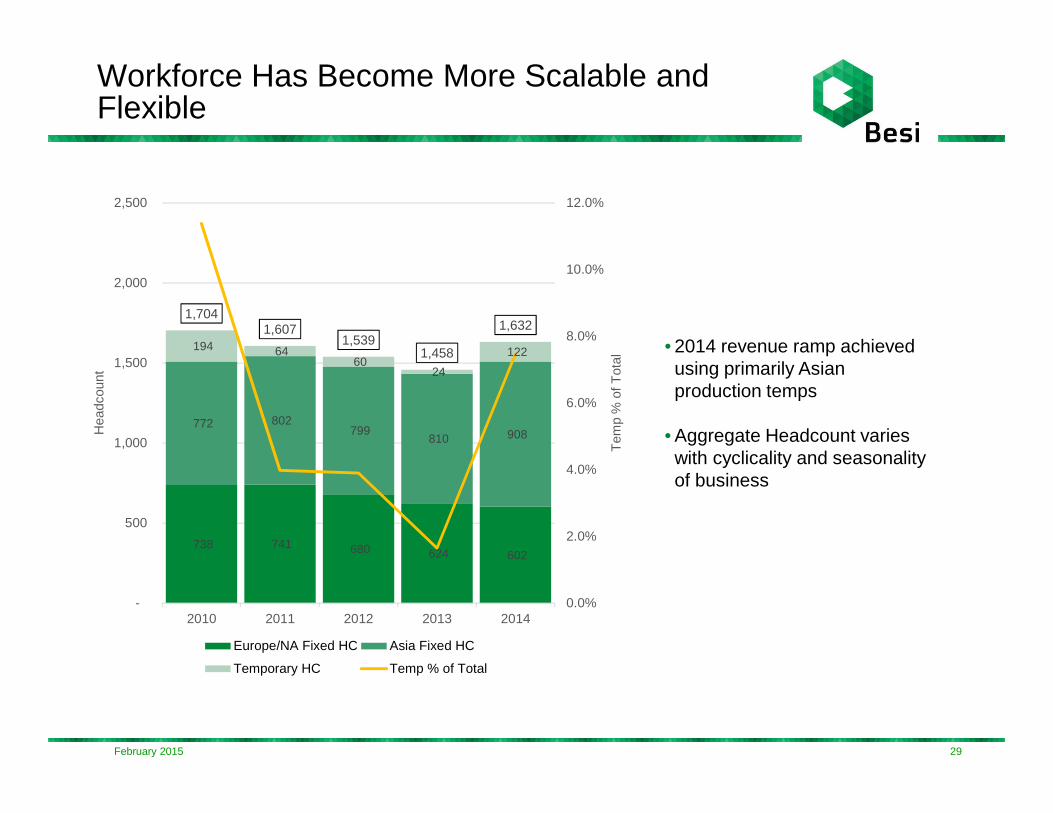
Workforce Has Become More Scalable and Flexible
29February 2015
• 2014 revenue ramp achieved using primarily Asian production temps
• Aggregate Headcount varies with cyclicality and seasonality of business
738 741 680 624 602
772 802 799
810 908
194 64 60
24
122
1,7041,607
1,5391,458
1,632
0.0%
2.0%
4.0%
6.0%
8.0%
10.0%
12.0%
-
500
1,000
1,500
2,000
2,500
2010 2011 2012 2013 2014T
emp
% o
f Tot
al
Hea
dcou
nt
Europe/NA Fixed HC Asia Fixed HC
Temporary HC Temp % of Total
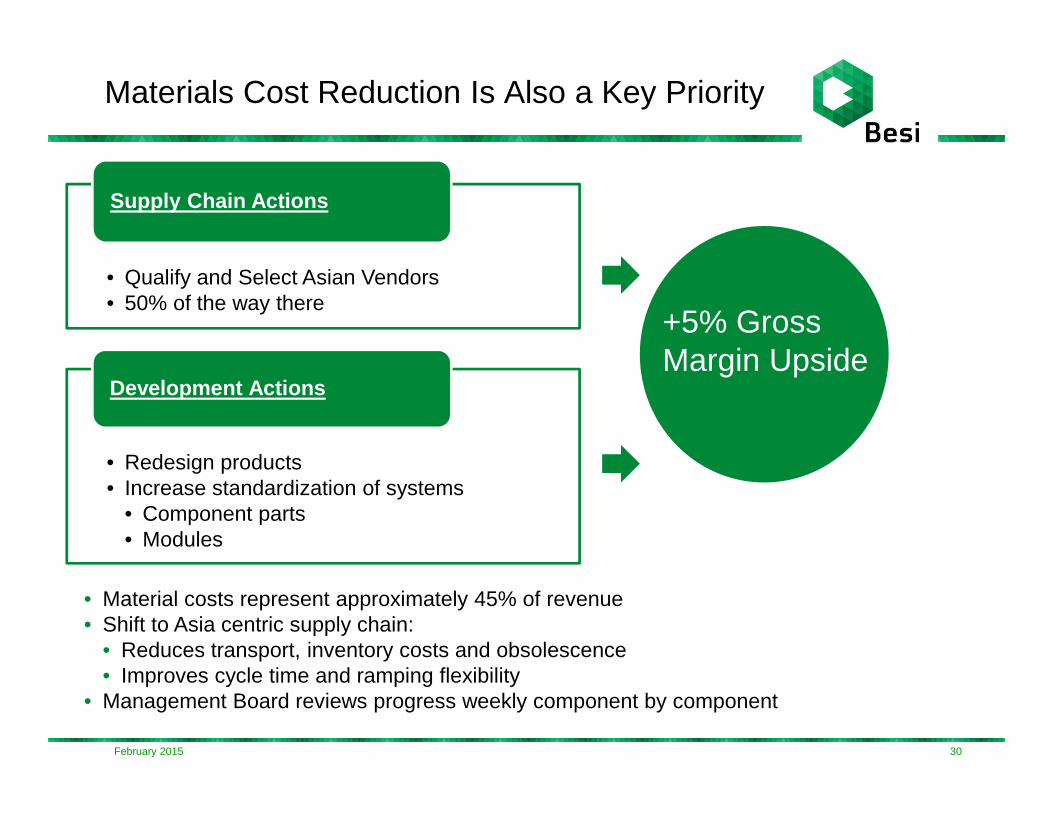
Materials Cost Reduction Is Also a Key Priority
• Qualify and Select Asian Vendors• 50% of the way there
Supply Chain Actions
• Redesign products• Increase standardization of systems
• Component parts• Modules
Development Actions
+5% Gross Margin Upside
• Material costs represent approximately 45% of revenue• Shift to Asia centric supply chain:
• Reduces transport, inventory costs and obsolescence• Improves cycle time and ramping flexibility
• Management Board reviews progress weekly component by component
30February 2015
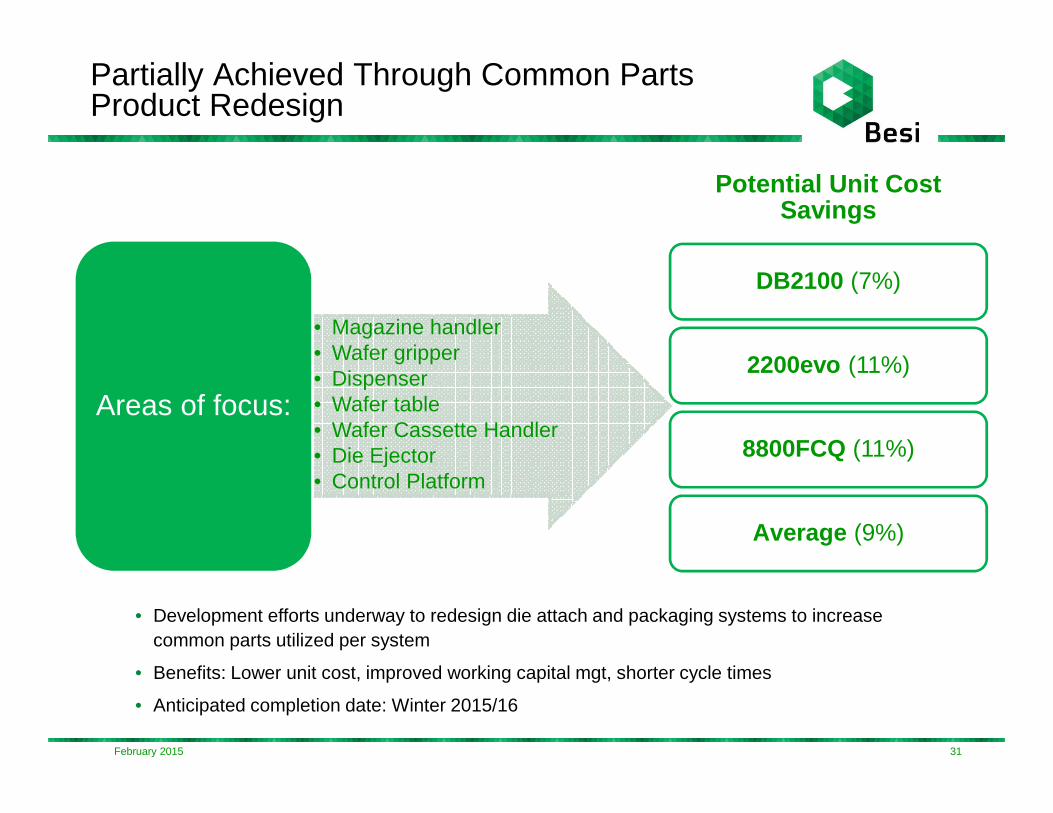
Partially Achieved Through Common Parts Product Redesign
• Development efforts underway to redesign die attach and packaging systems to increasecommon parts utilized per system
• Benefits: Lower unit cost, improved working capital mgt, shorter cycle times
• Anticipated completion date: Winter 2015/16
• Magazine handler• Wafer gripper• Dispenser• Wafer table• Wafer Cassette Handler• Die Ejector• Control Platform
Areas of focus:
Potential Unit Cost Savings
DB2100 (7%)
2200evo (11%)
8800FCQ (11%)
Average (9%)
31February 2015

IV. FINANCIAL REVIEW
32February 2015
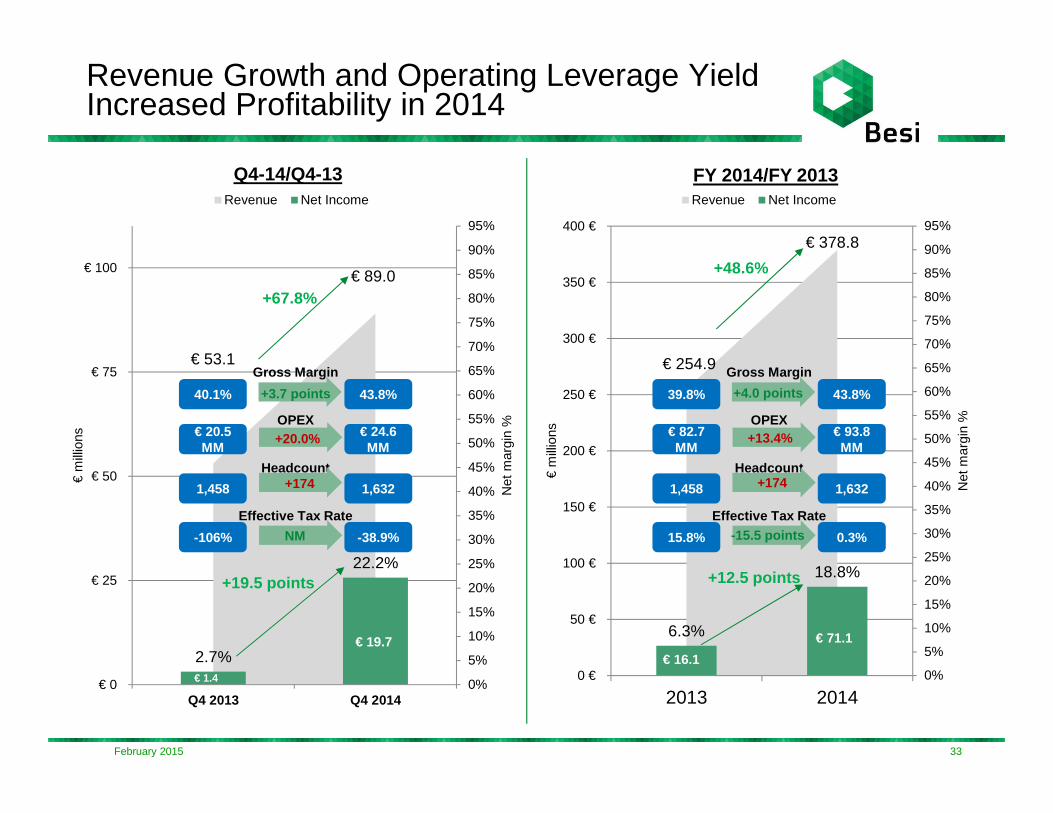
Revenue Growth and Operating Leverage Yield Increased Profitability in 2014
33February 2015
€ 53.1
€ 89.0
2.7%
22.2%
0%
5%
10%
15%
20%
25%
30%
35%
40%
45%
50%
55%
60%
65%
70%
75%
80%
85%
90%
95%
€ 0
€ 25
€ 50
€ 75
€ 100
Q4 2013 Q4 2014
Net
mar
gin
%
€m
illio
ns
Revenue Net Income
Gross Margin
OPEX
Headcount
Effective Tax Rate
-106% -38.9%
1,458 1,632
€ 20.5 MM
€ 24.6 MM
+174
NM
+20.0%
40.1% 43.8%
+67.8%
+19.5 points
Q4-14/Q4-13 FY 2014/FY 2013
+3.7 points
€ 1.4
€ 19.7
€ 254.9
€ 378.8
6.3%
18.8%
0%
5%
10%
15%
20%
25%
30%
35%
40%
45%
50%
55%
60%
65%
70%
75%
80%
85%
90%
95%
0 €
50 €
100 €
150 €
200 €
250 €
300 €
350 €
400 €
2013 2014
Net
mar
gin
%
€m
illio
ns
Revenue Net Income
Gross Margin
OPEX
Headcount
Effective Tax Rate
15.8% 0.3%
1,458 1,632
€ 82.7 MM
€ 93.8 MM
39.8% 43.8%
+174
-15.5 points
+13.4%
+4.0 points
+48.6%
+12.5 points
€ 71.1
€ 16.1
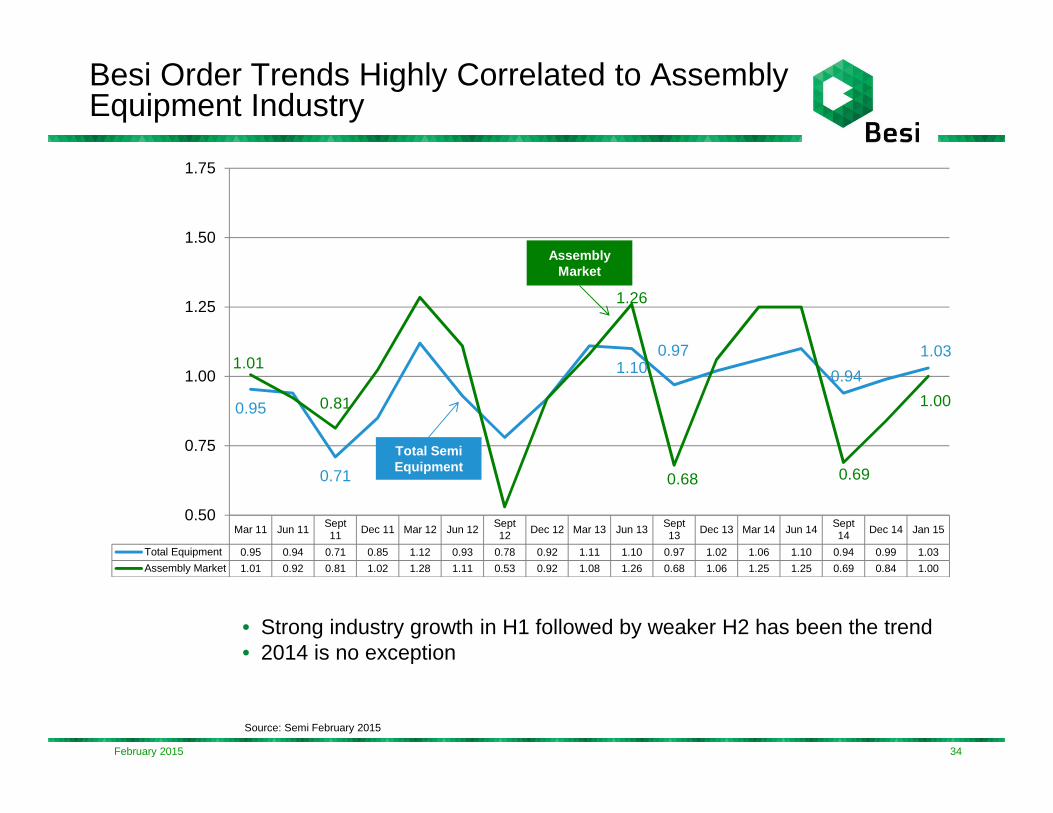
Besi Order Trends Highly Correlated to Assembly Equipment Industry
• Strong industry growth in H1 followed by weaker H2 has been the trend• 2014 is no exception
Source: Semi February 2015
34February 2015
Mar 11 Jun 11Sept11 Dec 11 Mar 12 Jun 12
Sept12 Dec 12 Mar 13 Jun 13
Sept13 Dec 13 Mar 14 Jun 14
Sept14 Dec 14 Jan 15
Total Equipment 0.95 0.94 0.71 0.85 1.12 0.93 0.78 0.92 1.11 1.10 0.97 1.02 1.06 1.10 0.94 0.99 1.03
Assembly Market 1.01 0.92 0.81 1.02 1.28 1.11 0.53 0.92 1.08 1.26 0.68 1.06 1.25 1.25 0.69 0.84 1.00
0.95
0.71
1.100.97
0.94
1.03 1.01
0.81
1.26
0.68 0.69
1.00
0.50
0.75
1.00
1.25
1.50
1.75
Assembly Market
Total Semi Equipment
35
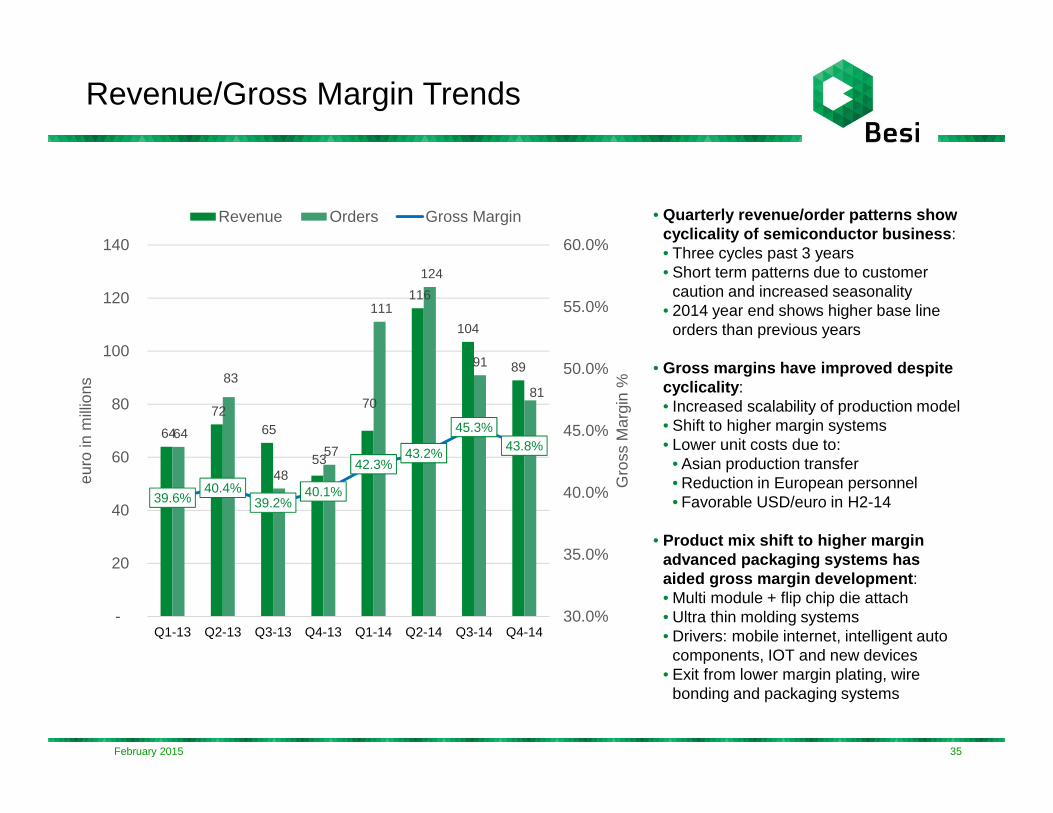
• Quarterly revenue/order patterns show cyclicality of semiconductor business :• Three cycles past 3 years• Short term patterns due to customer
caution and increased seasonality • 2014 year end shows higher base line
orders than previous years
• Gross margins have improved despite cyclicality :• Increased scalability of production model• Shift to higher margin systems• Lower unit costs due to:
• Asian production transfer• Reduction in European personnel• Favorable USD/euro in H2-14
• Product mix shift to higher margin advanced packaging systems has aided gross margin development :• Multi module + flip chip die attach• Ultra thin molding systems• Drivers: mobile internet, intelligent auto
components, IOT and new devices• Exit from lower margin plating, wire
bonding and packaging systems
Revenue/Gross Margin Trends
64
72 65
53
70
116
104
89
64
83
48
57
111
124
91
81
39.6%40.4%
39.2%40.1%
42.3%43.2%
45.3%43.8%
30.0%
35.0%
40.0%
45.0%
50.0%
55.0%
60.0%
-
20
40
60
80
100
120
140
Q1-13 Q2-13 Q3-13 Q4-13 Q1-14 Q2-14 Q3-14 Q4-14G
ross
Mar
gin
%
euro
in m
illio
ns
Revenue Orders Gross Margin
February 2015
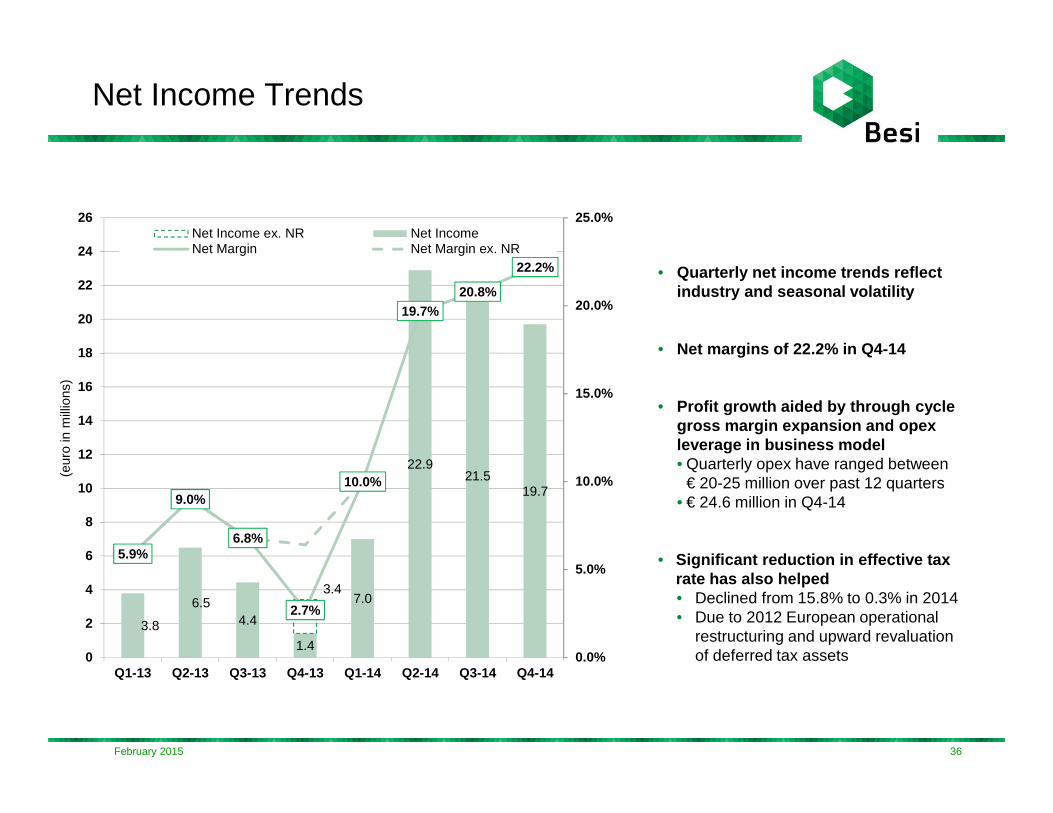
Net Income Trends
3.8
6.5 4.4
1.4
7.0
22.9 21.5
19.7
5.9%
9.0%
6.8%
2.7%
10.0%
19.7%20.8%
22.2%
0.0%
5.0%
10.0%
15.0%
20.0%
25.0%
0
2
4
6
8
10
12
14
16
18
20
22
24
26
Q1-13 Q2-13 Q3-13 Q4-13 Q1-14 Q2-14 Q3-14 Q4-14
(eur
o in
mill
ions
)
Net Income ex. NR Net IncomeNet Margin Net Margin ex. NR
3.4
• Quarterly net income trends reflect industry and seasonal volatility
• Net margins of 22.2% in Q4-14
• Profit growth aided by through cycle gross margin expansion and opex leverage in business model• Quarterly opex have ranged between
€ 20-25 million over past 12 quarters• € 24.6 million in Q4-14
• Significant reduction in effective tax rate has also helped• Declined from 15.8% to 0.3% in 2014• Due to 2012 European operational
restructuring and upward revaluation of deferred tax assets
36February 2015

Liquidity Trends
Quarterly Trends
91.9
81.1 78.5
89.6 91.9
83.8
105.4
135.3
27.7 24.9 22.5
18.6 19.1 21.3 19.3 17.3
64.2
56.2 56.0
71.0 72.8
62.5
86.1
118.0
0
20
40
60
80
100
120
140
160
Q1-13 Q2-13 Q3-13 Q4-13 Q1-14 Q2-14 Q3-14 Q4-14
(eur
o in
mill
ions
)
Cash Debt Net Cash
• Solid liquidity position• € 135.3 million cash at 12/31/14• € 3.59 per share vs. € 18.53 price (as of December 31, 2014)
• Net cash reached € 118.0 million at year end 2014
• Has Been Utilized to Enhance Shareholder Value• € 57 million spent on cash dividends and
share repurchases 2011-2014
• Strong balance sheet helps support future organic growth and acquisition opportunities
3737February 2015
V. OUTLOOK & SUMMARY
38February 2015
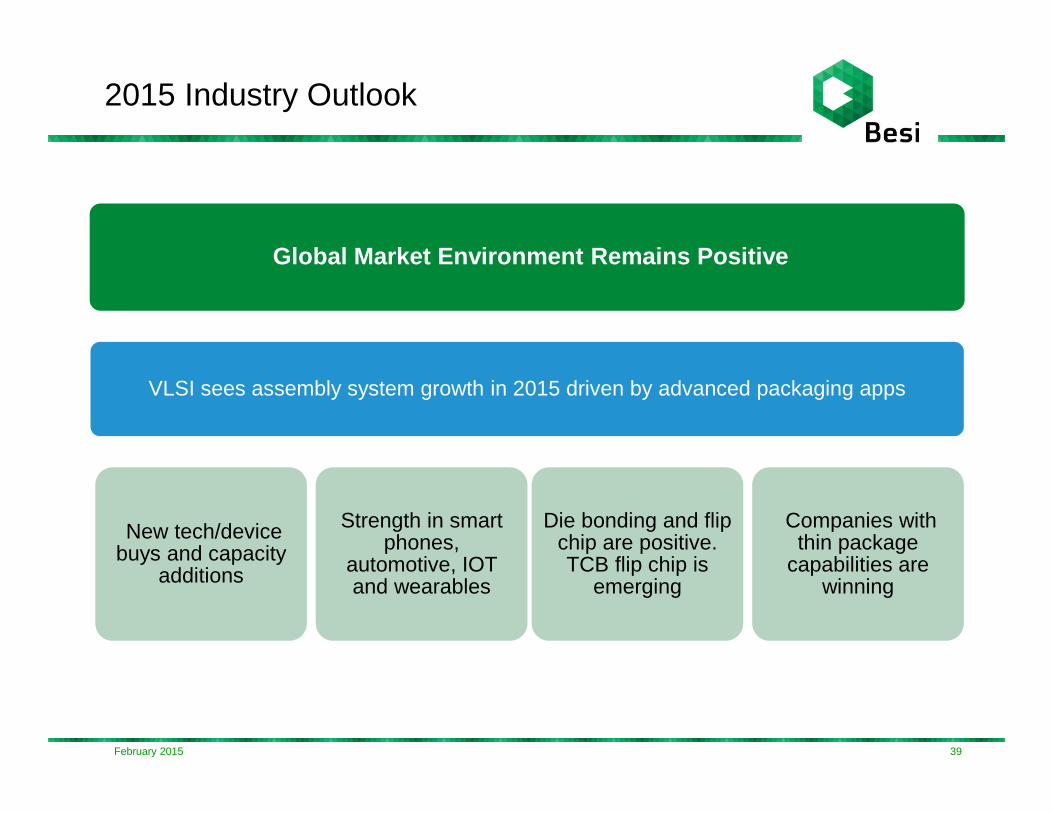
2015 Industry Outlook
Global Market Environment Remains Positive
VLSI sees assembly system growth in 2015 driven by advanced packaging apps
New tech/device buys and capacity
additions
Strength in smart phones,
automotive, IOT and wearables
Die bonding and flip chip are positive. TCB flip chip is
emerging
Companies with thin package
capabilities are winning
39February 2015
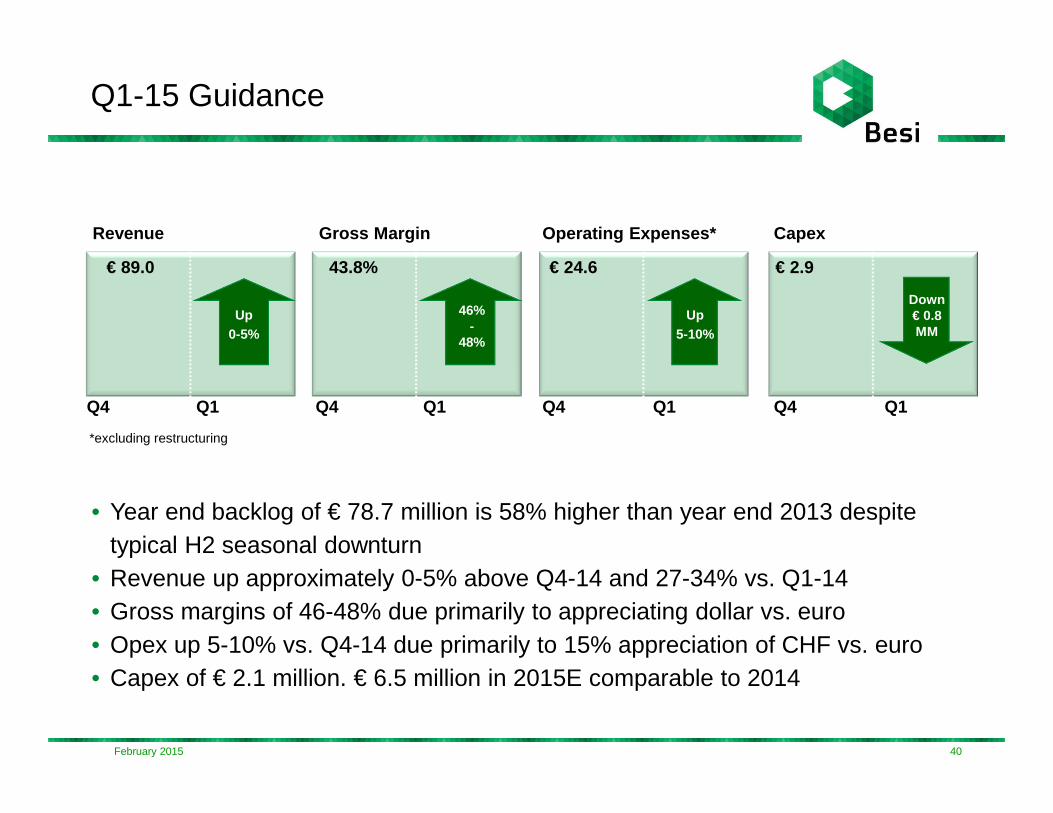
Q1-15 Guidance
Revenue Gross Margin Operating Expenses* Capex
Q4 Q1 Q4 Q1 Q4 Q1 Q4 Q1
€ 89.0 43.8% € 24.6 € 2.9
Up0-5%
Down € 0.8 MM
• Year end backlog of € 78.7 million is 58% higher than year end 2013 despite typical H2 seasonal downturn
• Revenue up approximately 0-5% above Q4-14 and 27-34% vs. Q1-14• Gross margins of 46-48% due primarily to appreciating dollar vs. euro• Opex up 5-10% vs. Q4-14 due primarily to 15% appreciation of CHF vs. euro• Capex of € 2.1 million. € 6.5 million in 2015E comparable to 2014
Up5-10%
46%-
48%
*excluding restructuring
February 2015 40
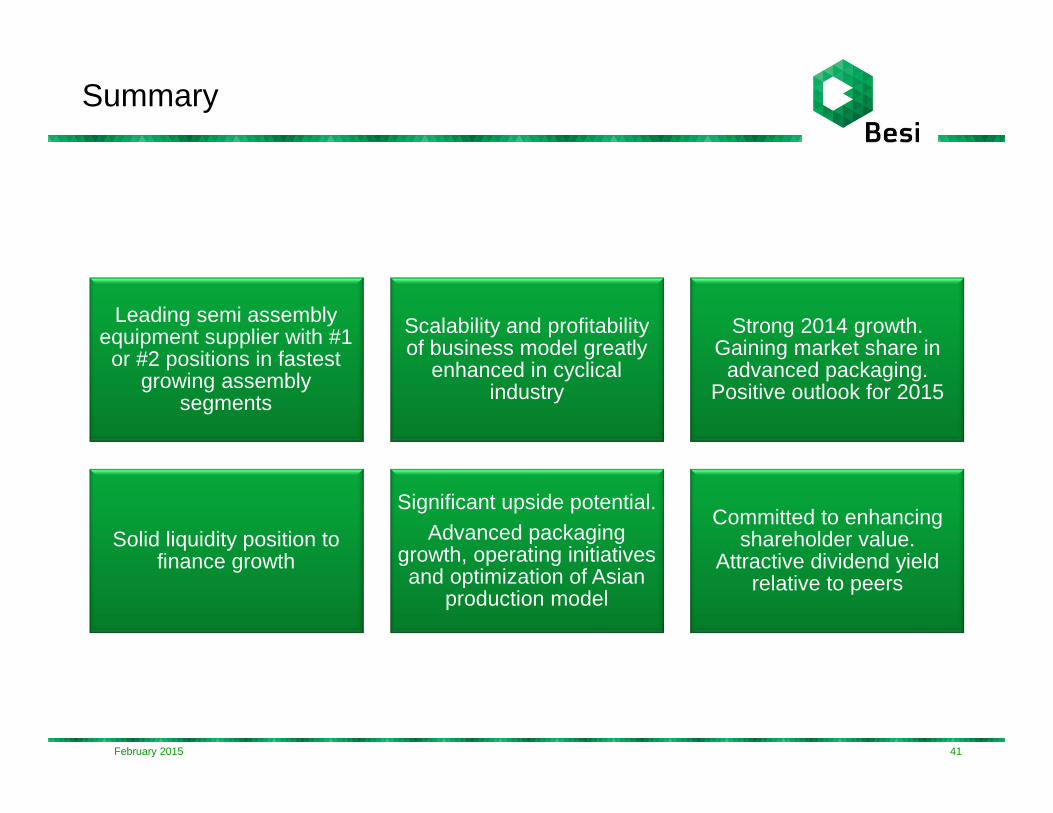
Summary
Leading semi assembly equipment supplier with #1
or #2 positions in fastest growing assembly
segments
Scalability and profitability of business model greatly
enhanced in cyclical industry
Strong 2014 growth. Gaining market share in
advanced packaging. Positive outlook for 2015
Solid liquidity position to finance growth
Significant upside potential.Advanced packaging
growth, operating initiatives and optimization of Asian
production model
Committed to enhancing shareholder value.
Attractive dividend yield relative to peers
41February 2015