investor presentation results fy2016 -...
TRANSCRIPT

© 2017 Wirecard AG 1
Investor Presentation –
Results FY2016
6 April 2017

© 2017 Wirecard AG 2
Content
1. Highlights
2. Industry and regions
3. Products and solutions
4. Mergers and acquisitions
5. Outlook
6. Financial data

© 2017 Wirecard AG 3
1
Highlights

© 2017 Wirecard AG 4
Wirecard at a glance
Highlights
61.7 EUR bn processed transaction volume worldwide
Outstanding track record with continuing growth and strong
fundamentals
Innovation leader with leading internet and mobile payment technology
Global M&A strategy adding to organic success
Unique value chain with fully integrated and licensed banking operations
~ 27,000 large and medium sized merchants
~ 150,000 small sized merchants

© 2017 Wirecard AG 5
Key figures FY2016
Highlights
Results in EUR mn (except where stated) 2016 2015 Change
Transaction volume (in EUR bn) 61.7 45.2 37%
Revenues 1,028.4 771.3 33%
EBITDA 307.4 227.3 35%
EBIT adjusted* 268.3 197.4 36%
EBIT 235.2 172.8 36%
Earnings after taxes 266.7 142.6 87%
Earnings after taxes adjusted** 176.9 142.6 24%
Operating cash flow*** 283.0 199.7 42%
Free cash flow**** 209.9 145.2 45%
Earnings per share (in EUR, undiluted) 2.16 1.16 86%
Earnings per share adjusted** (in EUR, undiluted) 1.43 1.16 23%
EBITDA guidance for FY2017 of 382 - 400 EUR mn
Proposed dividend of 0.16 EUR per share
* Adjusted for amortisation (M&A related)
** Adjusted for Visa Europe
*** Consolidated cash flow from operating activities (adjusted)
**** Cash flow from operating activities (adjusted) less operative CAPEX

© 2017 Wirecard AG 6
Organic versus M&A1 related growth FY2016
Highlights
1 Payment business of GI Retail Group, India; Wirecard Brasil, Brazil; Provus Group, Romania
Transaction volume
growth
Total
Organic
M&A
• GI Retail
• Wirecard Brasil
• Provus
36.5%
30.2%
6.3%
4.4%
1.2%
0.7%
Revenue growth
33.3%
20.6%
12.7%
9.5%
2.1%
1.1%
EBITDA growth
35.2%
27.1%
8.2%
6.6%
0.5%
1.1%

© 2017 Wirecard AG 7
Global mega trends driving Wirecard´s growth
Highlights
Substitution of POS transactions by mobile and internet
transactions
Transition from cash transactions to electronic card
transactions
Transition from non-real-time transactions to real-time
transactions
Internet technology as convergence driver between all sales
channels – POS, mobile and internet – omni-channel
1
2
3
4

© 2017 Wirecard AG 8
Wirecard´s strategy
Highlights
Driving convergence between online,
mobile and POS front-ends
using innovative internet technology
Globalisation
Constant extension of
value chain and innovative internet-
driven value added services

© 2017 Wirecard AG 9
Value chain
Wirecard´s USPs
Highlights
Strong value chain
with end-to-end fully digitised
acquiring and issuing
leading to gross margin advantages
Leading 360° risk management: raising
conversion on average by more than 5%
and reducing default by up to 50%*
Most advanced in rolling out
Wirecard´s platform and innovations
on a global scale
Risk
management
Global reach
* Depending on business model, industry and sales channel

© 2017 Wirecard AG 10
ISS
UIN
G
FRAUD / AML
MANAGEMENT
BALANCE MGMT.
(STORED VALUE
ACCOUNT)
PERSONALIZATIONTRUSTED SERVICE
MANAGER
TRANSACTION
AUTH. / CLEARING
ISSUING LICENSE and many more
KNOW-YOUR
CUSTOMER
CREDIT FACILITY
MANAGEMENTPEER-TO-PEER
CUSTOMER DATA
MANAGEMENT
MULTI-CHANNEL WALLET
PLATFORM
ISSUING PROCESSING
PLATFORM
CONTEXTUAL ADVERTISINGVALUE ADDED
SERVICESLOYALTY PROGRAMS COUPONING SERVICES
SMS / USSDMOBILE FRONTEND
SOLUTIONSSIM TOOLKIT / J2ME SMARTPHONE APPS
HARDWAREMULTI-CHANNEL
FRONTEND
VALUE ADDED
SERVICES
FINANCIAL SERVICES LICENSE
ACQUIRING LICENSE (more than 45 payment solutions)
FRAUD / AML
MANAGEMENT
TERMINAL
MANAGEMENT
NETWORK
OPERATIONSTRANSACTION
AUTH. / CLEARING
ACQUIRING PROCESSING
PLATFORM
CUSTOMER DATA
MANAGEMENT
WALLET CONTENT
MANAGEMENT
SMARTPHONE SDK
CONTEXTUAL
ADVERTISING
VALUE ADDED
SERVICESLOYALTY PROGRAMS MINI ATM
ONLINE API
TRANSACTION
ROUTING
COUPONING
SERVICESTRUST EVALUATION
SUITE
MULTI-CHANNEL PSP
PLATFORMRISK MANAGEMENT FRAUD PREVENTION MERCHANT
ANALYTICS
MERCHANT
RECONCILIATION
SMARTPHONE SDK BATCH API
Wirecard´s end-to-end payment ecosystem –
fully digitised global acquiring and issuing
Highlights
AC
QU
IRIN
G

© 2017 Wirecard AG 11
360° risk engine
Highlights
RISK
ENGINE
HOTLIST
CONNECTORS
FRAUD
PREVENTION
SUITE
IP GEO-
LOCATION
DEVICE
FINGERPRINT
CUSTOMER ID
SANCTION
LIST
ADDRESS
ADDRESS
ADDRESS
VALIDATION
PEP CHECK
TRUST
EVALUATION
SUITE
FURTHER
PARA-
METERS
ORDER
HISTORY
PAYMENT
HISTORY
CREDIT AGENCY
GATEWAY
Region 2
Region 4
Region 3
Region 1
SCORE-CARD
CREDIT LIMIT
PAYMENT CARD
VALIDATION
One Platform for multiple purposes
• Platform for decision making
• Modular design
• Flexible setup
• One interface to the merchant
PATTERN
DETECTION
SELF-LEARNING
ALGORITHMS

© 2017 Wirecard AG 12
Global reach
Highlights

© 2017 Wirecard AG 13
Operative highlights FY2016
Highlights
Strong customer gains and extension of existing business relationships translate into
continuing organic growth of Wirecard
New customer gains in second half 2016 with a potential transaction volume of 9.5 EUR bn
Examples of customer gains, business extensions and new partners
Microsoft Cloud Platform Azure, Siemens Mobility, Verlagsgruppe Handelsblatt, Visa Europe Collab, ÖBB,
T-Systems, Eurotrade Flughafen München Handels-GmbH, Takko, MyOrder B.V., Ingenico, Verifone, Apple Pay,
Sabre, Commerzbank AG, Wizz Air, Miles and More GmbH, The Body Shop, Printemps, O2, Burger King, Airberlin,
Europe Net, savedroid, Future Finance, WMF, Enterprise Rent-A-Car, Tamaris, Awinta, TeamViewer, Wargaming.net,
Taxi.de, LogoYazilim, Otelz.com, Cuscal, ComfortDelGro, Eleos Web, Bloyalty, DCB Bank, RBL Bank, Lidl, Mondo,
Paygoo, Curve, Travelex, Carrefour, Conferma
Various omni-channel initiatives
In cooperation with the WMF Group, Wirecard is realising the integration of an omni-channel shopping solution in the
WMF branches. The solution enables WMF customers to view products in the store, order them directly online in the
store and have them delivered to their homes.
Furthermore, the cooperation with eurotrade Flughafen underlines Wirecard's international convergence strategy.
Wirecard has integrated Alipay Barcode Payment into eurotrade’s central checkout system for this purpose. Another
customer who accepts Alipay payments via Wirecard is Miles & More GmbH, who accept barcode payment in their
Lufthansa WorldShop Stores via the new iOS app “Scan Alipay”. In addition, the British company The Body Shop
and the French company Printemps Group with its 19 department stores in France have been acquired as
customers.

© 2017 Wirecard AG 14
2
Industry and regions

© 2017 Wirecard AG 15
Transaction volume – industry view (1/2)
Strong growth across all industries with well diversified
customer portfolio and low customer concentration
Industry and regions
Travel & mobility, 18.8%
Digital goods, 34.3%
Consumer goods, 46.9%
Transaction volume1 industry allocation
Travel & mobility
• Includes airlines, hotel chains, travel
portals, tour operators, ferries, car
rental and transportation companies
• Travel & mobility up 2.5 EUR bn, with
28.0% yoy growth
Consumer goods
• Includes B2C and B2B physical
products
• Consumer goods up 8.2 EUR bn, with
39.5% yoy growth
Digital goods
• Includes digital goods such as internet
portals, download and streaming
services, telecommunications, SaaS
and app providers
• Digital goods up 5.7 EUR bn, with
37.0% yoy growth
28.0% yoy growth
39.5% yoy growth
37.0% yoy growth
1 Transaction volume: mainly acceptance and issuing means of payment along with associated value added services

© 2017 Wirecard AG 16
Transaction volume1 – industry view (2/2)
Industry and regions
1.49
1.67
1.81
2.05
2.28
0.5
1.0
1.5
2.0
2.5
2012 2013 2014 2015 2016
Volu
me in E
UR
mn
Average transaction volume per merchant (large and medium sized only)14% CAGR
(2012-2016)
Adding large scale merchants enables Wirecard to continuously increase
transaction volume per merchant
1 Transaction volume: mainly acceptance and issuing means of payment along with associated value added services for large and medium sized merchants

© 2017 Wirecard AG 17
Transaction volume1 – geographic view 2
Industry and regions
In EUR mn (except where stated) EuropeOutside
EuropeTotal
Transaction volume in EUR bn 42.1 19.6 61.7
Revenue 582.7 445.7 1,028.4
→ Hardware related 3.8 30.2 34.0
→ Other non-TX-related 27.5 12.2 39.6
Total non-TX-related revenue 31.2 42.4 73.6
Total TX-related revenue 551.5 403.3 954.8
Average transaction margin 1.3% 2.1% 1.5%1.7
1.6
3.6
0.0
2.1
2.2
11.2
2.8
17.3
13.8
34.0
45.2
3.0
2.4
5.2
2.2
3.6
3.2
19.6
3.1
23.1
15.9
42.1
61.7
thereof MEA
thereof Americas
thereof APAC other
thereof India
thereof Indonesia
thereof Singapore
Outside Europe
thereof Europe (non EU)
thereof EU (w/o GER)
thereof Germany
Europe
Total
In EUR bn
Transaction volume - global breakdown
2016 2015
1 Transaction volume: mainly acceptance and issuing means of payment along with associated value added services
2 Geographic view is based on merchant location
© 2017 Wirecard AG 18
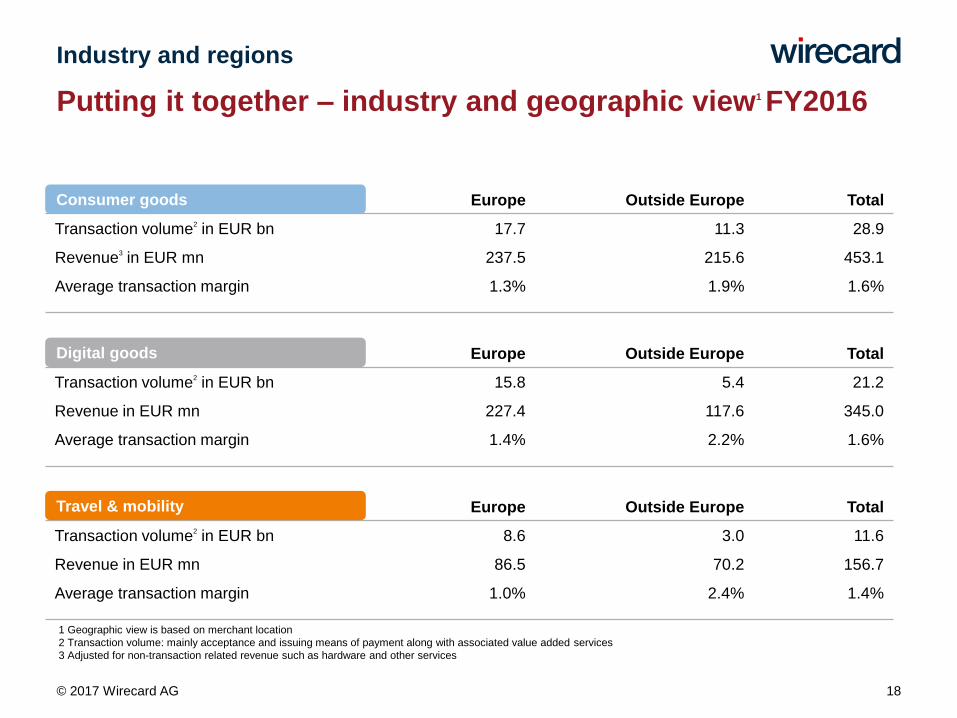
Europe Outside Europe Total
Transaction volume2in EUR bn 8.6 3.0 11.6
Revenue in EUR mn 86.5 70.2 156.7
Average transaction margin 1.0% 2.4% 1.4%
Europe Outside Europe Total
Transaction volume2in EUR bn 15.8 5.4 21.2
Revenue in EUR mn 227.4 117.6 345.0
Average transaction margin 1.4% 2.2% 1.6%
Europe Outside Europe Total
Transaction volume2in EUR bn 17.7 11.3 28.9
Revenue3in EUR mn 237.5 215.6 453.1
Average transaction margin 1.3% 1.9% 1.6%
Putting it together – industry and geographic view1 FY2016
Industry and regions
Consumer goods
Digital goods
Travel & mobility
1 Geographic view is based on merchant location
2 Transaction volume: mainly acceptance and issuing means of payment along with associated value added services
3 Adjusted for non-transaction related revenue such as hardware and other services

© 2017 Wirecard AG 19
3
Products and solutions

© 2017 Wirecard AG 20
Key innovations and product development (1/2)
Products and solutions
boon.
Wirecard’s Host Card Emulation (“HCE”) app for mobile payment – redefining
smartphone payments. As a digital payment solution for Android smartphones
boon combines innovative payment functions, loyalty points and couponing as
well as a range of personal finance services. The app communicates with
point of sale terminals via near field communication (NFC). Boon was
successfully launched in Germany, Austria, Spain, Belgium, Ireland, France,
Switzerland and the Netherlands for Android users.
Since May 2016 boon was also launched as a fully digitised credit card for
Apple Pay in Great Britain, France, Switzerland and Ireland.
Wirecard Checkout Portal
Higher conversion rate through targeted search engine marketing: With Google
AdWords, Wirecard AG is offering with its partners a new premium service for its
Checkout Portal, a fully automated solution that enables online payment
processing for small and medium-sized businesses (SMB) as well as
marketplaces.
Wirecard acquired SUPR, in order to expand the Checkout Portal to include further
value added services in the area of omni-channel sales. SUPR is working on the
vision of decentralised e-commerce to enable retailers to sell their goods via so-
called widgets directly on blogs and social networks independently of an online
shop. The innovative SUPR solutions will be integrated into the Wirecard Checkout
Portal and rolled out Europe-wide as part of a complete ecosystem.

© 2017 Wirecard AG 21
Products and solutions
CONNECTED POS
Connected POS
Connected POS technology is Wirecard’s central and intelligent
platform for value added services at the Point of Sale (POS).
The solution brings internet technology to the POS and enables
merchants to digitise various areas of business such as
payment, loyalty solutions or the evaluation of data.
Connected POS also powers Wirecard’s Alipay integration into
merchants such as The Body Shop, Printemps or WMF.
Key innovations and product development (2/2)
mPOS
In todays retail environment, mobile point of sale solutions are
more than a transaction authorization process – mPOS is
becoming a core driver for in-store conversion in combination
with inventory & product information.
Retailers are investing heavily in mobile technologies to create
a personalized shopping experience while bringing the checkout
to the customer. Wirecard operates its own mPOS program
attracting merchants of all sizes that follow a mobile first
approach.

© 2017 Wirecard AG 22
4
Mergers and acquisitions

© 2017 Wirecard AG 23
Overview of recent M&A activity
Mergers and acquisitions
Citi Prepaid Card
Services in North
America
Merchant acquiring
services of Citigroup in
APAC
MyGate in South Africa
• A leading merchant acquiring business across 11 countries in APAC
• Client base of more than 20,000 merchants incl. segment leading corporate clients
• Strong cross- and upselling opportunities due to Wirecard’s innovative payment
ecosystem
• Synergies of > USD 7 mn annually
• Estimated EBITDA contribution of > USD 20 mn for the 12 months after closing
• Signing March 2017
• MyGate is a leading payment service provider in South Africa
• Supplements existing product portfolio of Wirecard in South Africa
• Employees: 21
• Cash payment of 18.2 EUR mn, further earnouts up to 4.9 EUR mn
• Expected EBITDA 2017: 2.0 EUR mn
• Signing and closing March 2017
• Leading position in institutional funded prepaid card issuing with more than 2,500
client programs launched
• Global expansion with market entry U.S.
• Employees: 120
• Estimated EBITDA margin 2017 approx. 20%
• Estimated EBITDA contribution 2017 > USD 20 mn (before integration costs)
• Estimated integration costs: 5.0 USD mn
• Closing March 2017

© 2017 Wirecard AG 24
EBITDARevenue
Track record of recent M&A activity
Payment business of
GI Retail Group, India
Mergers and acquisitions
73.5 EUR mn
FY2016
(consolidation as of
December 30, 2015)
14.9 EUR mn
FY2016
(consolidation as of
December 30, 2015)
Wirecard Brasil, Brazil
16.2 EUR mn
FY2016
(since consolidation as of
February 22, 2016)
1.2 EUR mn
FY2016
(since consolidation as of
February 22, 2016)
Provus Group, Romania
8.5 EUR mn
FY2016
(since consolidation as of
February 29, 2016)
2.4 EUR mn
FY2016
(since consolidation as of
February 29, 2016)

© 2017 Wirecard AG 25
Wirecard India – driving financial inclusion
Mergers and acquisitions
150kAGENTS
ICASH( PPI LICENSE )
MTSSINTERNATIONAL
REMITTANCE
LICENSE
BANK( FULL LICENSE )
MOBILE WALLETby
WIRECARD
mPOS /
MINI ATMs
APPSTORE( SMARTSHOP )
ACQUIRING(via referral/ BIN
sponsor)
AUTHORIZED
DEALER,
CATEGORY II(LICENCE UPGRADE
BY RBI)
LOANS( NBFC, BANK )
Acquired
business
Post M&A
Future
steps
SUCCESSFUL
FY2016
PSPPAYMENT PLATFORM
by
WIRECARD
FULLY DIGITISED
OPEN LOOP
ISSUING

© 2017 Wirecard AG 26
5
Outlook

© 2017 Wirecard AG 27
Real-time payments
Convergence of all
sales channels
Strong prospective market growth of 16% to 17% within
Wirecard´s core geographies as well as its industry mix for 2017
Market environment
Outlook
Ongoing digitalisation
Transition from cash to
electronic payments

© 2017 Wirecard AG 28
Company guidance 2017
Outlook
Guidance is based on
• Growth of the European e-commerce market and additional global growth drivers
• Increase of processed transaction volume with existing and new clients
• Economies of scale
• Contribution from recent acquisitions
Detailed break down of guidance mid-point of 391 EUR mn
• Organic growth of 24%
• >13.0 EUR mn EBITDA contribution from Citi prepaid (based on 20 USD mn and integration costs
of 5 USD mn)
• EBITDA guidance for FY2017 of 382 to 400 EUR mn
• Proposed dividend of 0.16 EUR per share

© 2017 Wirecard AG 29
Wirecard´s visionary playing field
Outlook
85% cash transactions worldwide
… whereas only 15% of all transactions are electronic
…with only 6% to 7% of all electronic transactions being
fully digitised
Leaving an enormous market potential for Wirecard

© 2017 Wirecard AG 30
Vision 2020
Outlook
TX volume
> EUR 190 bnRevenue
> EUR 2.5 bnEBITDA – margin
30-35%FCF conversion to
EBITDA
> 65%

© 2017 Wirecard AG 31
6
Financial data

© 2017 Wirecard AG 32
Financial highlights FY2016
Financial data
in EUR k 2016 2015 Change
Revenue 1,028,358 771,340 33%
EBITDA 307,363 227,315 35%
EBIT adjusted* 268,322 197,420 36%
EBIT 235,188 172,844 36%
Tax 36,091 23,023 57%
Earnings after taxes 266,749 142,646 87%
Earnings after taxes adjusted** 176,888 142,646 24%
EPS (undiluted) in EUR 2.16 1.16 86%
EPS adjusted** (undiluted) in EUR 1.43 1.16 23%
Operating cash flow*** 283,030 199,685 42%
Shareholders’ equity 1,474,963 1,280,513 15%
Total equity and liabilities 3,482,062 2,935,501 19%
Employees**** as of 31.12.2016 / 31.12.2015 4,002 3,096 29%
thereof full-time employees 3,697 2,833 30%
thereof part-time employees 305 263 16%
*Adjusted by amortisation (M&A related)
**Adjusted for Visa Europe
*** Consolidated cash flow from operating activities (adjusted)
**** Thereof 340 employees of Wirecard Brasil, Brazil; Provus Group, Romania

© 2017 Wirecard AG 33
Revenue and EBITDA – 5 year view
Financial data
25.0%
26.0%
27.0%
28.0%
29.0%
30.0%
0
200
400
600
800
1000
1200
2012 2013 2014 2015 2016
EUR mn
Financials - 5 year view
Revenue EBITDA EBITDA margin
26% CAGR
(2012-2016)
30% CAGR
(2012-2016)
Strong 5 year
revenue/EBITDA growth and
margin expansion
due to scalability of
Wirecard´s platform and
cross selling effects

© 2017 Wirecard AG 34
Consolidated income statement
Financial data
in EUR k 2016 % of revenues 2015 % of revenues
Revenues 1,028,358 771,340
Own work capitalised 30,201 28,293
Cost of materials -530,761 51.6% -418,935 54.3%
Personnel expenses -129,852 12.6% -96,378 12.5%
Other operating expenses -97,888 9.5% -62,665 8.1%
Other operating income 7,502 0.7% 5,659 0.7%
Income from investments using equity method -197 0.0% n/a n/a
EBITDA 307,363 29.9% 227,315 29.5%
Amortisation and depreciation (M&A adjusted)* -39,042 3.8% -29,895 3.9%
EBIT adjusted* 268,322 26.1% 197,420 25.6%
Amortisation (M&A related) -33,133 3.2% -24,576 3.2%
EBIT 235,188 22.9% 172,844 22.4%
Financial results 67,651 -7,175
Income tax -36,091 ** 11.9% -23,023 ** 13.9%
Profit after Taxes 266,749 25.9% 142,646 18.5%
* Adjusted by amortisation (M&A related)
** Taxes on income and profit with regards to Earnings before Taxes (EBT)

© 2017 Wirecard AG 35
Balance sheet
Financial data
Assets in EUR k 31.12.2016 31.12.2015
Non-current assets 1,386,438 1,280,261
Goodwill 534,892 489,301
Customer relationships 392,329 385,451
Internally gen. intangible assets 99,224 80,639
Other intangible assets 81,682 65,869
Deferred tax assets 2,657 862
Other property, plant & equipm. 44,656 30,987
Fin. assets/ int. bearing securities 230,999 227,152
Current assets 2,095,624 1,655,240
Receivables of acquiring business
402,423 334,055
Trade receivables 190,185 113,204
Cash and cash equivalents 1,332,631 1,062,968
Interest-bearing securities 156,493 133,128
Other 13,893 11,885
Total assets 3,482,062 2,935,501
Equity and liabilities in EUR k 31.12.2016 31.12.2015
Shareholders´ equity 1,474,963 1,280,513
Liabilities 2,007,099 1,654,988
Current provisions 3,914 1,421
Tax provisions 24,276 14,087
Liabilities of acquiringbusiness
404,767 333,924
Trade payables 34,920 25,988
Interest-bearing bank loans 594,541 370,725
Deferred income taxes 59,747 53,266
Other non-current liabilities 31,425 71,912
Other current liabilities 119,505 201,201
Customer deposits 734,003 582,464
Total equity and liabilities 3,482,062 2,935,501

© 2017 Wirecard AG 36
Net cash (short- and long-term)
Financial data
*
In EUR mn
0
500
1,000
1,500
2,000
2,500
Cash and cashequivalents
Interest-bearingsecurities and
fixed-termdeposits
Receivables ofacquiring
business andtrade
receivables
Current interestbearing
liabilities/otherliabilities
Customerdeposits(banking
operations)*
Liabilities ofacquiring
business andtrade payables
Net cashposition short
term - Wirecard
Non-currentfinancial assets
Non-currentinterest bearingliabilities / other
liabilities
Net cashposition long
term - Wirecard
In EUR mn
Net cash bridge FY2016
1,333 3
*Customer deposits break down in EUR k 31.12.2016
Customer deposits - balance sheet amount 734,003
thereof in long-term interest bearing securities -42,558
thereof in interest bearing securities and fixed-term deposits -156,493
Customer deposits relevant for net cash calculation 534,953
593-135
-535
-440
819
379
-611171

© 2017 Wirecard AG 37
Income tax analysis
Financial data
in EUR k 2016 in % of ebt 2015 in % of ebt
Earnings before tax (EBT) 302,840 165,669
Tax on income and profit -36,091 11.9% -23,023 13.9%
thereof impact from deferred tax 1,694 -0.6% -1,109 0.7%
thereof tax to be paid -37,785 12.5% -21,914 13.2%
Paid tax on income -24,544 -21,892
thereof income tax -29,907 -21,892
thereof capital gain tax on dividends 5,363
in EUR k 2016 in % of ebt 2015 in % of ebt
Earnings before tax (EBT) adjusted* 211,265 165,669
Tax on income and profit adjusted* -34,377 16.3% -23,023 13.9%
thereof impact from deferred tax adjusted* 1,694 -0.8% -1,109 0.7%
thereof tax to be paid adjusted* -36,071 17.1% -21,914 13.2%
*Adjusted for Visa Europe

© 2017 Wirecard AG 38
Cash flow and conversion
Financial data
Free cash flow in EUR k 2016 2015
Cash flow from operating activities
(adjusted)
283,030 199,685
Operative CAPEX 73,160 54,477
Free cash flow 209,870 145,208
Cash conversion in EUR k 2016 2015
Free cash flow 209,870 145,208
Earnings after tax* 176,888 142,646
Cash conversion in % 118.6 101.8
* Adjusted for Visa Europe

© 2017 Wirecard AG 39
FinTech
Financial data
TechnologyPayment processing
Cards and accounts
POS (mPOS and connected POS)
Banking license
E-money license
Acquiring and issuing licenses
Account management
Couponing and loyalty
Risk & fraud
White label frontend solutions
Call centre support
Licenses
Value added
services
Wirecard as a global technology company with a fully licensed bank is
THE preferred partner for FinTech companies and provides services in
the area of…
Selective provision of
financing - based on detailed
individual assessments and
suitable security measures -
by the cash cycle of
Wirecard Bank…
…leading to substitution of
deposits/interest bearing
securities by „FinTech-loans“
in selected cases to optimise
interest income in a
low/negative interest rate
environment

© 2017 Wirecard AG 40
THANK YOU
FOR YOUR ATTENTION

© 2017 Wirecard AG 41
Investor Relations
Iris Stöckl: [email protected]
IR-Team: [email protected]
T: + 49 (0) 89 4424 1788
Wirecard AG
Einsteinring 35
85609 Aschheim / Munich
Germany
Contact

© 2017 Wirecard AG 42
Disclaimer
This presentation contains explicit and implicit forward-looking statements concerning Wirecard AG, its affiliated
companies and their business. These statements are subject to various known and unknown risks, uncertainties and
other factors due to which the actual events, financial conditions, performances and achievements of Wirecard AG
may differ substantially from those expressed in such explicit or implicit statements. Wirecard AG makes these
statements at the time of the publication of the presentation and is under no obligation to update the forward-looking
statements in this presentation including on receipt of new information or on occurrence of future events or for other
reasons. However, Wirecard AG, may change in its own free discretion any forward-looking statements should
relevant factors change.
The forward-looking statements from third parties’ surveys, in particular without being limited
to research reports and analysts’ statements, may prove to be incorrect. Reference to such third parties’ surveys
is provided for information only and does not imply any agreement with or consent to the content of such surveys or
the information, opinions or conclusions contained therein. Wirecard AG accepts no liability for the selection,
completeness or correctness of third parties’ studies.
Wirecard AG mostly publishes its figures in thousands of euro (kEUR). The use of rounding means that it is possible
that some figures do not add up exactly to form the totals stated, and that the figures and percentages do not exactly
reflect the absolute values on which they are based.
This presentation is no offer for the sale and no invitation for offers of purchase or for subscription to of shares of
Wirecard AG but is provided for information only.
Financial data (IAS/IFRS) refers to the Reports of Wirecard AG published on our website:
ir.wirecard.com