investor presentation - s21.q4cdn.coms21.q4cdn.com/.../05/evine-investor-presentation... · qvc...
TRANSCRIPT

Investor PresentationMay 2017
Safe Harbor Statement
This document may contain certain “forward-looking statements” within the meaning of the Private Securities Litigation Reform Act of 1995. Such statements
may be identified by words such as anticipate, believe, estimate, expect, intend, predict, hope, should, plan, will or similar expressions. Any statements
contained herein that are not statements of historical fact may be deemed forward-looking statements. These statements are based on management's current
expectations and accordingly are subject to uncertainty and changes in circumstances. Actual results may vary materially from the expectations contained
herein due to various important factors, including (but not limited to): consumer preferences, spending and debt levels; the general economic and credit
environment; interest rates; seasonal variations in consumer purchasing activities; the ability to achieve the most effective product category mixes to
maximize sales and margin objectives; competitive pressures on sales; pricing and gross sales margins; the level of cable and satellite distribution for our
programming and the associated fees or estimated cost savings from contract renegotiations; our ability to establish and maintain acceptable commercial
terms with third-party vendors and other third parties, with whom we have contractual relationships, and to successfully manage key vendor relationships and
develop key partnerships and proprietary and exclusive brands; our ability to manage our operating expenses successfully and our working capital levels; our
ability to remain compliant with our credit facilities covenants; customer acceptance of our branding strategy and our repositioning as a video commerce
company; the market demand for television station sales; changes to our management and information systems infrastructure; challenges to our data and
information security; changes in governmental or regulatory requirements, including without limitation, regulations of the Federal Communications
Commission and Federal Trade Commission, and adverse outcomes from regulatory proceedings; litigation or governmental proceedings affecting our
operations; significant public events that are difficult to predict, or other significant television-covering events causing an interruption of television coverage or
that directly compete with the viewership of our programming; our ability to obtain and retain key executives and employees; our ability to attract new
customers and retain existing customers; changes in shipping costs; our ability to offer new or innovative products and customer acceptance of the same;
changes in customer viewing habits of television programming; and the risks identified under “Risk Factors” in our recently filed Form 10-K and any additional
risk factors identified in our periodic reports since the date of such Form 10-K. More detailed information about those factors is set forth in our filings with the
Securities and Exchange Commission, including our annual report on Form 10-K, quarterly reports on Form 10-Q, and current reports on Form 8-K. You are
cautioned not to place undue reliance on forward-looking statements, which speak only as of the date of this announcement. We are under no obligation (and
expressly disclaim any such obligation) to update or alter our forward-looking statements whether as a result of new information, future events or otherwise.
Adjusted EBITDA
EBITDA represents net income (loss) for the respective periods excluding depreciation and amortization expense, interest income (expense) and income
taxes. The Company defines Adjusted EBITDA as EBITDA excluding non-operating gains (losses); executive and management transition costs; loss on debt
extinguishment; distribution facility consolidation and technology upgrade costs and non-cash share-based compensation expense. The Company has
included the term “Adjusted EBITDA” in our EBITDA reconciliation in order to adequately assess the operating performance of our television and online
businesses and in order to maintain comparability to our analyst's coverage and financial guidance, when given. Management believes that the term Adjusted
EBITDA allows investors to make a meaningful comparison between our business operating results over different periods of time with those of other similar
companies. In addition, management uses Adjusted EBITDA as a metric to evaluate operating performance under the Company’s management and
executive incentive compensation programs. Adjusted EBITDA should not be construed as an alternative to operating income (loss), net income (loss) or to
cash flows from operating activities as determined in accordance with generally accepted accounting principles (“GAAP”) and should not be construed as a
measure of liquidity. Adjusted EBITDA may not be comparable to similarly entitled measures reported by other companies. The Company has included a
reconciliation of the comparable GAAP measure, net income (loss) to Adjusted EBITDA in this presentation.
Certain data in this presentation is unaudited.2
Company Overview
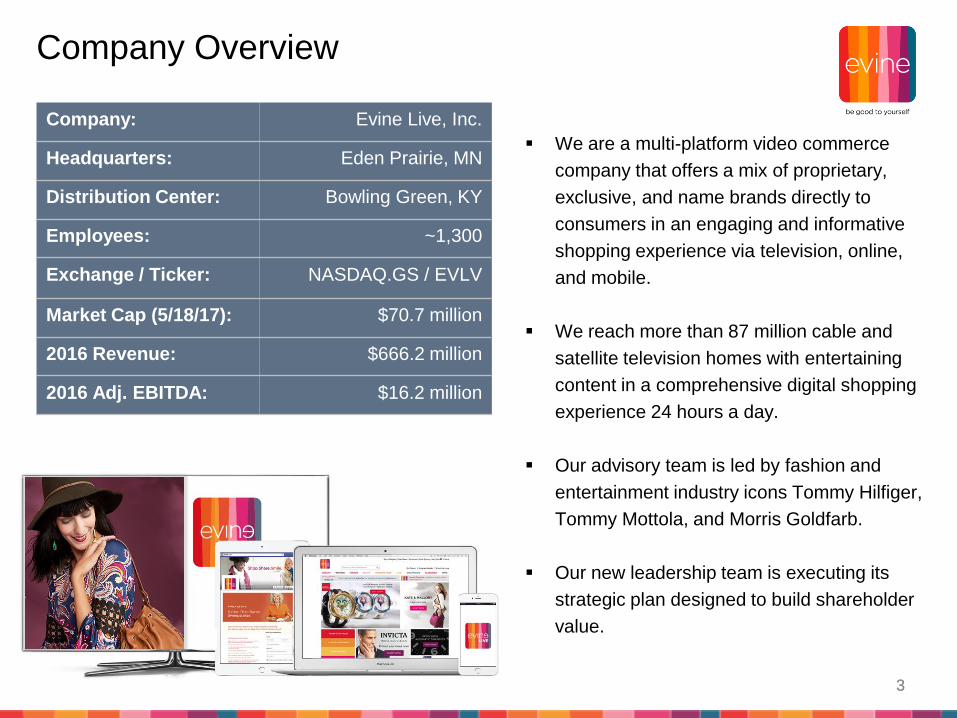
Company: Evine Live, Inc.
Headquarters: Eden Prairie, MN
Distribution Center: Bowling Green, KY
Employees: ~1,300
Exchange / Ticker: NASDAQ.GS / EVLV
Market Cap (5/18/17): $70.7 million
2016 Revenue: $666.2 million
2016 Adj. EBITDA: $16.2 million
We are a multi-platform video commerce
company that offers a mix of proprietary,
exclusive, and name brands directly to
consumers in an engaging and informative
shopping experience via television, online,
and mobile.
We reach more than 87 million cable and
satellite television homes with entertaining
content in a comprehensive digital shopping
experience 24 hours a day.
Our advisory team is led by fashion and
entertainment industry icons Tommy Hilfiger,
Tommy Mottola, and Morris Goldfarb.
Our new leadership team is executing its
strategic plan designed to build shareholder
value.
33

Why Invest Today?
We believe our stock price is undervalued – we currently trade at 0.2x EV/Revenue.
Our closest competitor trades at 0.6x EV/Revenue, this gap represents a $287
million or $4.42/share opportunity.
We are growing our collection of brands using our strong merchant team and our
advisor group (Tommy Hilfiger, Tommy Mottola, Morris Goldfarb).
Our national multi-platform distribution provides us significant reach in today’s retail
landscape which helps us leverage our interactive video commerce expertise.
We’ve made significant investments in our fulfillment center and WMS system in
FY15-16 – seeing the financial benefit in FY17 and beyond.
We will convert to HD in fall 2017 – we expect revenue lift from this initiative.
4
“It is clear the traditional department store retail strategy of offering
everything to everyone has been disrupted by technology, which allows for
narrowcasting of personal shopping capabilities to consumers. We believe
our growth strategy positions us to become the platform for the next
generation of personalized ecommerce.”4
We Have Made Significant Progress
5
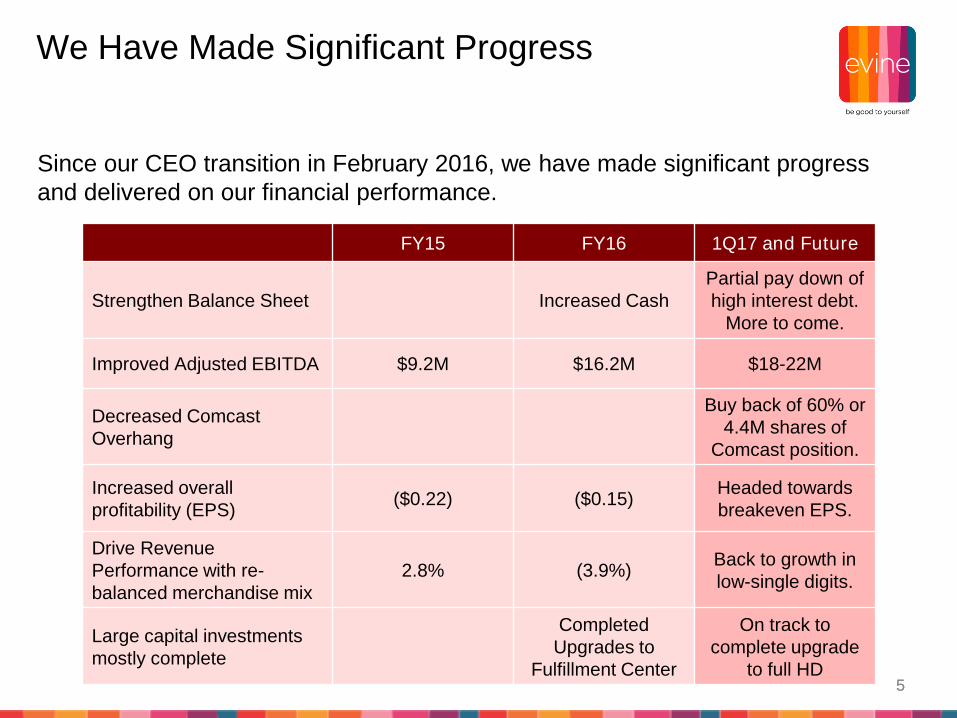
FY15 FY16 1Q17 and Future
Strengthen Balance Sheet Increased Cash
Partial pay down of
high interest debt.
More to come.
Improved Adjusted EBITDA $9.2M $16.2M $18-22M
Decreased Comcast
Overhang
Buy back of 60% or
4.4M shares of
Comcast position.
Increased overall
profitability (EPS)($0.22) ($0.15)
Headed towards
breakeven EPS.
Drive Revenue
Performance with re-
balanced merchandise mix
2.8% (3.9%)Back to growth in
low-single digits.
Large capital investments
mostly complete
Completed
Upgrades to
Fulfillment Center
On track to
complete upgrade
to full HD
Since our CEO transition in February 2016, we have made significant progress
and delivered on our financial performance.
5

Current Growth Plan
Build Stable of Proprietary, Exclusive, and Undiscovered
Brands
Deliver Compelling Live Interactive Content and
Commerce
Expand the Quality, Quantity, and Technology of
our Content Distribution
We believe our growth strategy positions us to become the preferred platform
for the next generation of personalized commerce.
6

Investment Highlights
Evine is part of a 3 member oligopoly that generates over $9 billion in annual U.S.
revenues*
Strategic focus on contribution margin and profit delivery
Emerging proprietary and exclusive brands gaining traction and acceptance from
customers
Established Brands provide stable cash flows and financial performance
Improved distribution efficiencies through Bowling Green Facility with new WMS
system
Utilizing new technologies in mobile and logistics to drive better connectivity between
on-air, online, and mobile platforms
Significant capital investments complete
*$9.3 billion in FY 2016 US revenue for QVCUS, HSN (excluding Cornerstone), and Evine.77
Competitive Landscape
8
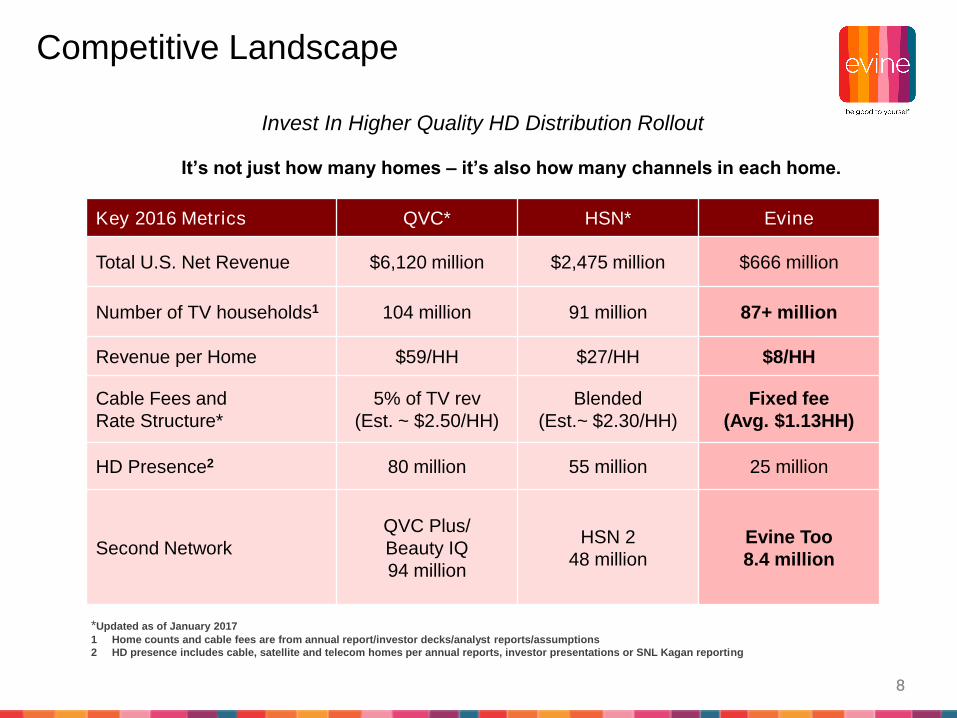
It’s not just how many homes – it’s also how many channels in each home.
Invest In Higher Quality HD Distribution Rollout
Key 2016 Metrics QVC* HSN* Evine
Total U.S. Net Revenue $6,120 million $2,475 million $666 million
Number of TV households1 104 million 91 million 87+ million
Revenue per Home $59/HH $27/HH $8/HH
Cable Fees and
Rate Structure*
5% of TV rev
(Est. ~ $2.50/HH)
Blended
(Est.~ $2.30/HH)
Fixed fee
(Avg. $1.13HH)
HD Presence2 80 million 55 million 25 million
Second Network
QVC Plus/
Beauty IQ
94 million
HSN 2
48 million
Evine Too
8.4 million
*Updated as of January 2017
1 Home counts and cable fees are from annual report/investor decks/analyst reports/assumptions
2 HD presence includes cable, satellite and telecom homes per annual reports, investor presentations or SNL Kagan reporting
8

Well-Positioned for Dynamic Retail Landscape
9
The Merchant’s Ideal Relationship is Directly With The Customer
Merchant
Traditional
Media is
Declining
Brick & Mortar
Is Transforming
Consumer
“Direct to Consumer”
is Growing
Traditional
MediaTraditional
Retail
9

Content Distribution Opportunities
1950s 1960 1970 1980 1990 2000 2010 2020s
TV Stations Dominated Video Distribution
MSO/Cable Dominated Video Distribution
ISPs, On-Demand and OTT Distribution Expected to Dominate Video Distribution in the Future
“We will build our Distribution Footprint on the Best Technology of the day”
1010

Pioneer in Video, Omni-channel Commerce
11
television
available in 87+ million homes
live broadcast studios • branded sets
• aspirational hosts • cross-channel
• promotional spots
digital
50.6% of total company sales
integrated home page • boutique product
video • live streaming • email campaigns
• online only assortment
mobile
48.0% of digital sales
integrated home page • live streaming
• iphone & android apps • easy interface
• shop entire assortment
social
facebook • pinterest • twitter
• Instagram • youtube • blogosphere
11

Our Competitive Advantage = Our Brands
12
Jewelry
• Established proprietary brand portfolio in key
jewelry categories of colored gemstones, diamonds,
gold, sterling silver, and pearls across a total of 53
on air brands/concepts
• An elevated ASP in all jewelry categories is a
reflection of our commitment to better quality and
value for the Evine customer as well as their
confidence in our growing luxury jewelry brand
portfolio
• Established reputation from being a longtime
jewelry destination in the video commerce world
• Industry leader with first-to-market gemstone finds,
stories, and designs
• Strategic and creative execution of jewelry events
that create strong tune-in both on-air and online
12
Our Competitive Advantage = Our Brands
13
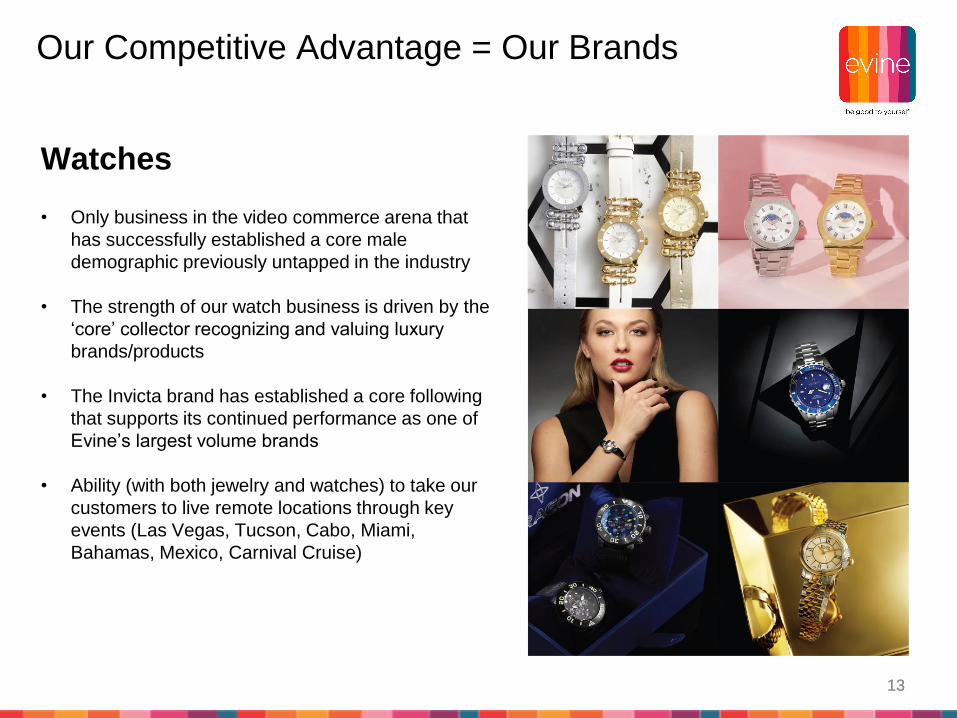
Watches
• Only business in the video commerce arena that
has successfully established a core male
demographic previously untapped in the industry
• The strength of our watch business is driven by the
‘core’ collector recognizing and valuing luxury
brands/products
• The Invicta brand has established a core following
that supports its continued performance as one of
Evine’s largest volume brands
• Ability (with both jewelry and watches) to take our
customers to live remote locations through key
events (Las Vegas, Tucson, Cabo, Miami,
Bahamas, Mexico, Carnival Cruise)
13
Our Competitive Advantage = Our Brands
14
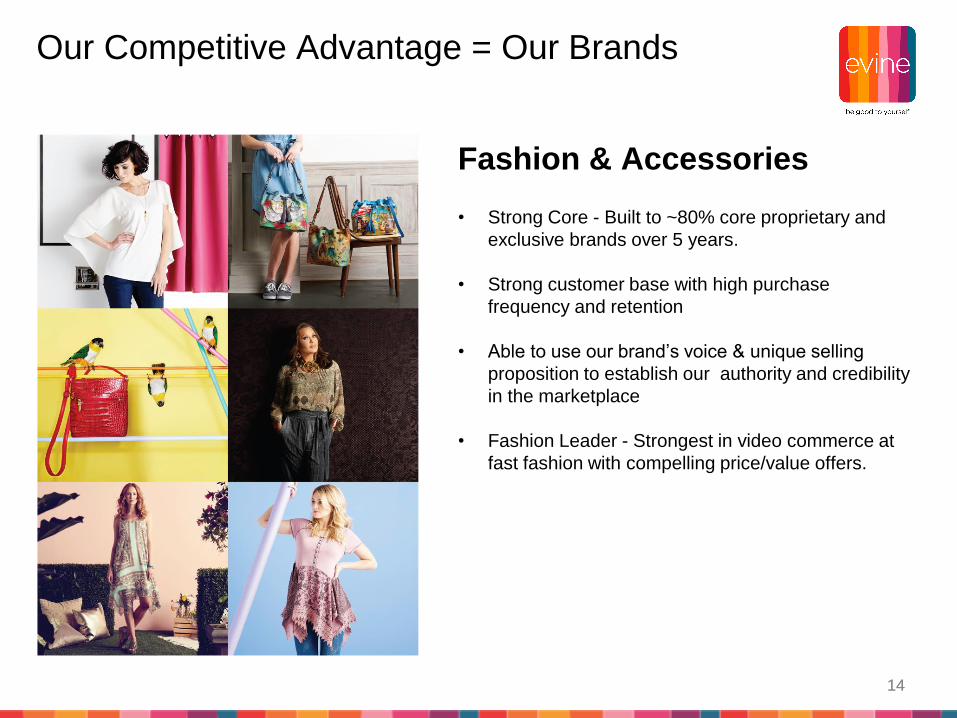
Fashion & Accessories
• Strong Core - Built to ~80% core proprietary and
exclusive brands over 5 years.
• Strong customer base with high purchase
frequency and retention
• Able to use our brand’s voice & unique selling
proposition to establish our authority and credibility
in the marketplace
• Fashion Leader - Strongest in video commerce at
fast fashion with compelling price/value offers.
14
Our Competitive Advantage = Our Brands
15
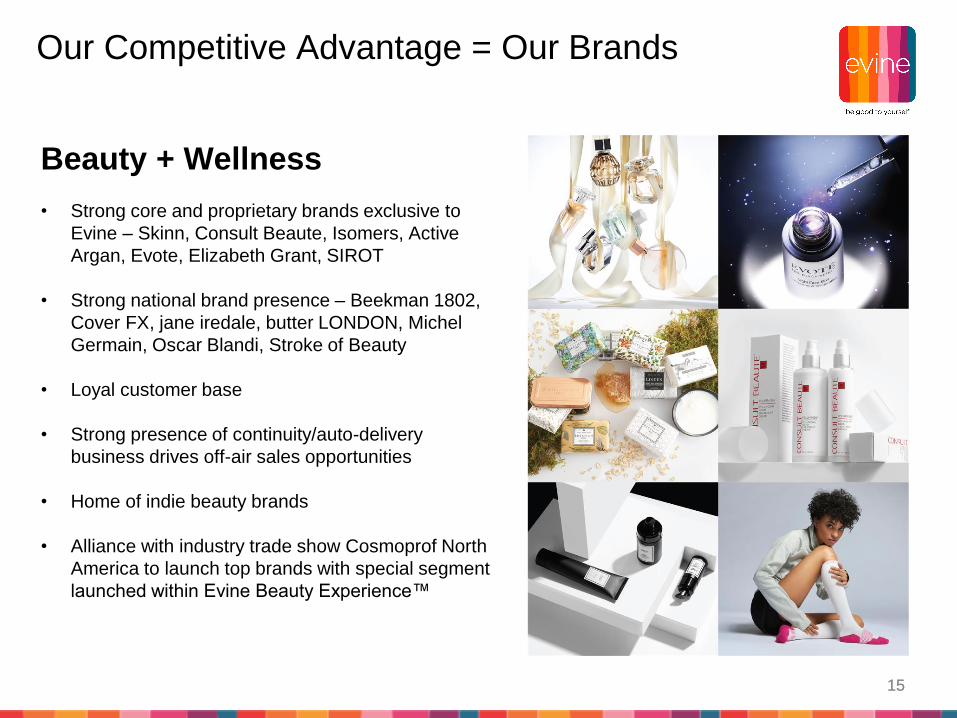
Beauty + Wellness
• Strong core and proprietary brands exclusive to
Evine – Skinn, Consult Beaute, Isomers, Active
Argan, Evote, Elizabeth Grant, SIROT
• Strong national brand presence – Beekman 1802,
Cover FX, jane iredale, butter LONDON, Michel
Germain, Oscar Blandi, Stroke of Beauty
• Loyal customer base
• Strong presence of continuity/auto-delivery
business drives off-air sales opportunities
• Home of indie beauty brands
• Alliance with industry trade show Cosmoprof North
America to launch top brands with special segment
launched within Evine Beauty Experience™
15

Our Competitive Advantage = Our Brands
16
Home
• Strong proprietary brands
• Innovative kitchen category anchored by celebrity
brands like Paula Deen, Todd English, Deadliest
Catch & more
• Strong national brand partnership with Waterford
• Company’s largest customer pool and strong new
customer acquisition
• Largest brand launch category for FY17
16

Our Competitive Advantage = Our Brands
17
Consumer Electronics
• Unique offers from national brands (Samsung,
Cobra, etc.)
• Strong Extended Assortment category
• Historically biggest category for holidays
• Higher ASP, which is driven from
higher-end product vs. our competitors
• Committed to branded or themed hours and custom
sets as needed for on-air product demonstrations
• Highly flexible scheduling that allows for
opportunistic promotions with key partners
17
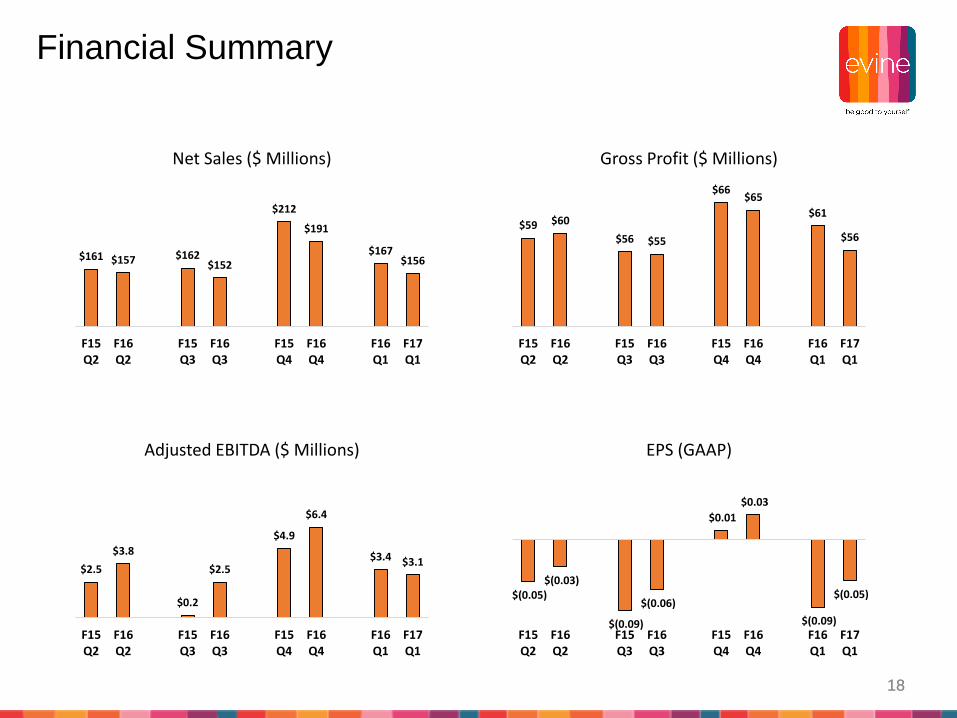
Financial Summary
18
$161 $157 $162$152
$212
$191
$167$156
F15Q2
F16Q2
F15Q3
F16Q3
F15Q4
F16Q4
F16Q1
F17Q1
Net Sales ($ Millions)
$59 $60
$56 $55
$66$65
$61
$56
F15Q2
F16Q2
F15Q3
F16Q3
F15Q4
F16Q4
F16Q1
F17Q1
Gross Profit ($ Millions)
$2.5
$3.8
$0.2
$2.5
$4.9
$6.4
$3.4 $3.1
F15Q2
F16Q2
F15Q3
F16Q3
F15Q4
F16Q4
F16Q1
F17Q1
Adjusted EBITDA ($ Millions)
$(0.05)$(0.03)
$(0.09)
$(0.06)
$0.01
$0.03
$(0.09)
$(0.05)
F15Q2
F16Q2
F15Q3
F16Q3
F15Q4
F16Q4
F16Q1
F17Q1
EPS (GAAP)
18

1919
Appendices
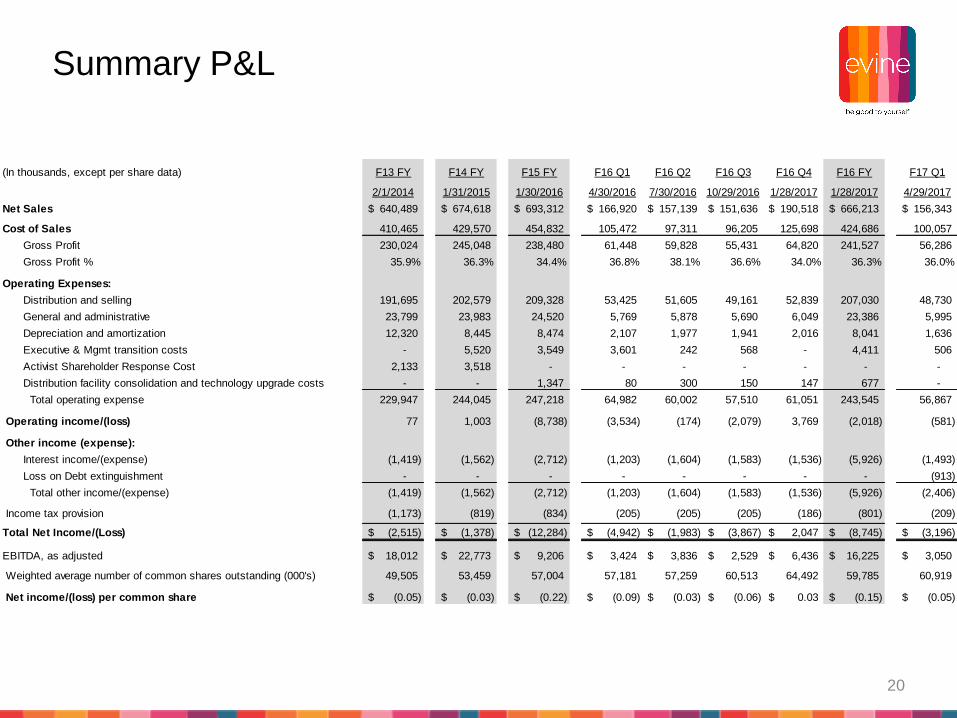
Summary P&L
(In thousands, except per share data) F13 FY F14 FY F15 FY F16 Q1 F16 Q2 F16 Q3 F16 Q4 F16 FY F17 Q1
2/1/2014 1/31/2015 1/30/2016 4/30/2016 7/30/2016 10/29/2016 1/28/2017 1/28/2017 4/29/2017
Net Sales 640,489$ 674,618$ 693,312$ 166,920$ 157,139$ 151,636$ 190,518$ 666,213$ 156,343$
Cost of Sales 410,465 429,570 454,832 105,472 97,311 96,205 125,698 424,686 100,057
Gross Profit 230,024 245,048 238,480 61,448 59,828 55,431 64,820 241,527 56,286
Gross Profit % 35.9% 36.3% 34.4% 36.8% 38.1% 36.6% 34.0% 36.3% 36.0%
Operating Expenses:
Distribution and selling 191,695 202,579 209,328 53,425 51,605 49,161 52,839 207,030 48,730
General and administrative 23,799 23,983 24,520 5,769 5,878 5,690 6,049 23,386 5,995
Depreciation and amortization 12,320 8,445 8,474 2,107 1,977 1,941 2,016 8,041 1,636
Executive & Mgmt transition costs - 5,520 3,549 3,601 242 568 - 4,411 506
Activist Shareholder Response Cost 2,133 3,518 - - - - - - -
Distribution facility consolidation and technology upgrade costs - - 1,347 80 300 150 147 677 -
Total operating expense 229,947 244,045 247,218 64,982 60,002 57,510 61,051 243,545 56,867
Operating income/(loss) 77 1,003 (8,738) (3,534) (174) (2,079) 3,769 (2,018) (581)
Other income (expense):
Interest income/(expense) (1,419) (1,562) (2,712) (1,203) (1,604) (1,583) (1,536) (5,926) (1,493)
Loss on Debt extinguishment - - - - - - - - (913)
Total other income/(expense) (1,419) (1,562) (2,712) (1,203) (1,604) (1,583) (1,536) (5,926) (2,406)
Income tax provision (1,173) (819) (834) (205) (205) (205) (186) (801) (209)
Total Net Income/(Loss) (2,515)$ (1,378)$ (12,284)$ (4,942)$ (1,983)$ (3,867)$ 2,047$ (8,745)$ (3,196)$
EBITDA, as adjusted 18,012$ 22,773$ 9,206$ 3,424$ 3,836$ 2,529$ 6,436$ 16,225$ 3,050$
Weighted average number of common shares outstanding (000's) 49,505 53,459 57,004 57,181 57,259 60,513 64,492 59,785 60,919
Net income/(loss) per common share (0.05)$ (0.03)$ (0.22)$ (0.09)$ (0.03)$ (0.06)$ 0.03$ (0.15)$ (0.05)$
20
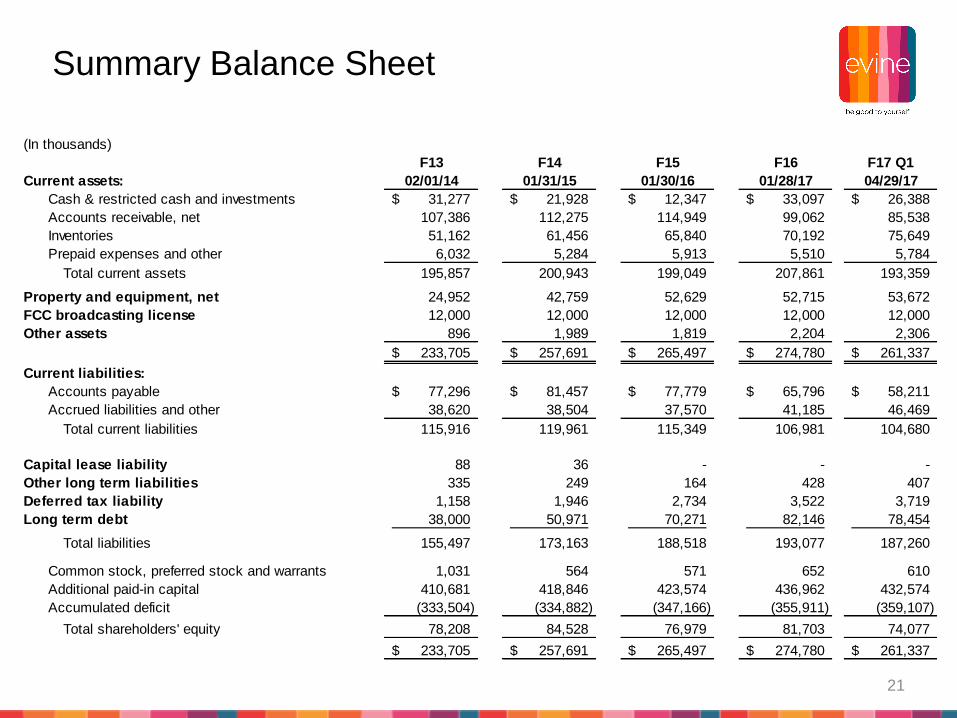
Summary Balance Sheet
(In thousands)
F13 F14 F15 F16 F17 Q1
Current assets: 02/01/14 01/31/15 01/30/16 01/28/17 04/29/17
Cash & restricted cash and investments 31,277$ 21,928$ 12,347$ 33,097$ 26,388$
Accounts receivable, net 107,386 112,275 114,949 99,062 85,538
Inventories 51,162 61,456 65,840 70,192 75,649
Prepaid expenses and other 6,032 5,284 5,913 5,510 5,784
Total current assets 195,857 200,943 199,049 207,861 193,359
Property and equipment, net 24,952 42,759 52,629 52,715 53,672
FCC broadcasting license 12,000 12,000 12,000 12,000 12,000
Other assets 896 1,989 1,819 2,204 2,306
233,705$ 257,691$ 265,497$ 274,780$ 261,337$
Current liabilities:
Accounts payable 77,296$ 81,457$ 77,779$ 65,796$ 58,211$
Accrued liabilities and other 38,620 38,504 37,570 41,185 46,469
Total current liabilities 115,916 119,961 115,349 106,981 104,680
Capital lease liability 88 36 - - -
Other long term liabilities 335 249 164 428 407
Deferred tax liability 1,158 1,946 2,734 3,522 3,719
Long term debt 38,000 50,971 70,271 82,146 78,454
Total liabilities 155,497 173,163 188,518 193,077 187,260
Common stock, preferred stock and warrants 1,031 564 571 652 610
Additional paid-in capital 410,681 418,846 423,574 436,962 432,574
Accumulated deficit (333,504) (334,882) (347,166) (355,911) (359,107)
Total shareholders' equity 78,208 84,528 76,979 81,703 74,077
233,705$ 257,691$ 265,497$ 274,780$ 261,337$
21

Adjusted EBITDA Reconciliation
(In thousands)
F13 F14 F15
FY FY FY Q1 Q2 Q3 Q4 FY Q1
Net income (loss) (2,515)$ (1,378)$ (12,284)$ (4,942)$ (1,983)$ (3,867)$ 2,047$ (8,745)$ (3,196)$
Adjustments:
Depreciation and amortization 12,585 8,872 10,327 3,040 3,070 3,093 2,006 11,209 2,604
Interest income (18) (10) (8) (2) (2) (3) (4) (11) (2)
Interest expense 1,437 1,572 2,720 1,205 1,606 1,586 1,540 5,937 1,495
Income taxes 1,173 819 834 205 205 205 186 801 209
EBITDA (as defined) 12,662 9,875 1,589 (494) 2,896 1,014 5,775 9,191 1,110
A reconciliation of EBITDA to Adjusted EBIDTA is as follows:
EBITDA (as defined) 12,662 9,875 1,589 (494) 2,896 1,014 5,775 9,191 1,110
Less:
Executive and management transition costs -$ 5,520$ 3,549$ 3,601$ 242$ 568$ -$ 4,411$ 506$
Distribution facility consolidation and technology upgrade costs - - 1,347 80 300 150 147 677 -
Activist Shareholder Response Costs 2,133 3,518 - - - - - - -
Shareholder Rights Plan costs - - 446 - - - - - -
Loss on debt extinguishment - - - - - - - - 913
Non-cash share-based compensation 3,217 3,860 2,275 237 398 797 514 1,946 521
Adjusted EBITDA 18,012$ 22,773$ 9,206$ 3,424$ 3,836$ 2,529$ 6,436$ 16,225$ 3,050$
F16 F17
22
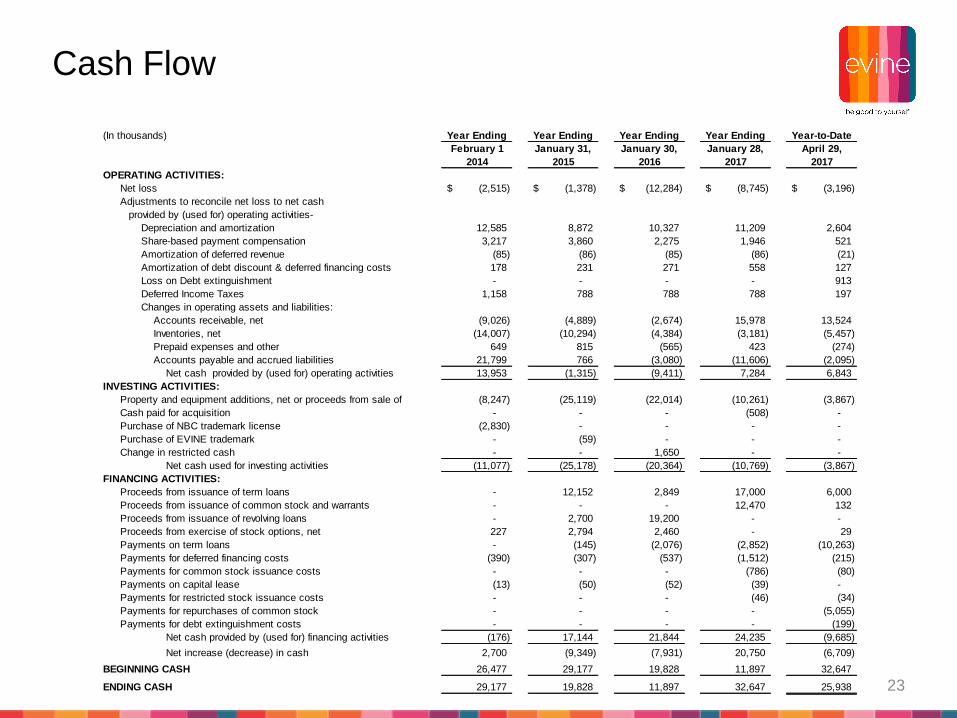
Cash Flow
(In thousands) Year Ending Year Ending Year Ending Year Ending Year-to-Date
February 1 January 31, January 30, January 28, April 29,
2014 2015 2016 2017 2017
OPERATING ACTIVITIES:
Net loss (2,515)$ (1,378)$ (12,284)$ (8,745)$ (3,196)$
Adjustments to reconcile net loss to net cash
provided by (used for) operating activities-
Depreciation and amortization 12,585 8,872 10,327 11,209 2,604
Share-based payment compensation 3,217 3,860 2,275 1,946 521
Amortization of deferred revenue (85) (86) (85) (86) (21)
Amortization of debt discount & deferred financing costs 178 231 271 558 127
Loss on Debt extinguishment - - - - 913
Deferred Income Taxes 1,158 788 788 788 197
Changes in operating assets and liabilities:
Accounts receivable, net (9,026) (4,889) (2,674) 15,978 13,524
Inventories, net (14,007) (10,294) (4,384) (3,181) (5,457)
Prepaid expenses and other 649 815 (565) 423 (274)
Accounts payable and accrued liabilities 21,799 766 (3,080) (11,606) (2,095)
Net cash provided by (used for) operating activities 13,953 (1,315) (9,411) 7,284 6,843
INVESTING ACTIVITIES:
Property and equipment additions, net or proceeds from sale of (8,247) (25,119) (22,014) (10,261) (3,867)
Cash paid for acquisition - - - (508) -
Purchase of NBC trademark license (2,830) - - - -
Purchase of EVINE trademark - (59) - - -
Change in restricted cash - - 1,650 - -
Net cash used for investing activities (11,077) (25,178) (20,364) (10,769) (3,867)
FINANCING ACTIVITIES:
4 Proceeds from issuance of term loans - 12,152 2,849 17,000 6,000
7 Proceeds from issuance of common stock and warrants - - - 12,470 132
3 Proceeds from issuance of revolving loans - 2,700 19,200 - -
6 Proceeds from exercise of stock options, net 227 2,794 2,460 - 29
5 Payments on term loans - (145) (2,076) (2,852) (10,263)
1 Payments for deferred financing costs (390) (307) (537) (1,512) (215)
Payments for common stock issuance costs - - - (786) (80)
2 Payments on capital lease (13) (50) (52) (39) -
Payments for restricted stock issuance costs - - - (46) (34)
Payments for repurchases of common stock - - - - (5,055)
Payments for debt extinguishment costs - - - - (199)
Net cash provided by (used for) financing activities (176) 17,144 21,844 24,235 (9,685)
Net increase (decrease) in cash 2,700 (9,349) (7,931) 20,750 (6,709)
BEGINNING CASH 26,477 29,177 19,828 11,897 32,647
ENDING CASH 29,177 19,828 11,897 32,647 25,938 23

Key Operating Metrics
F13 FY F14 FY F15 FY F16 Q1 F16 Q2 F16 Q3 F16 Q4 F16 FY F17 Q1
Net Shipped Units (000s) 7,152 9,055 9,853 2,417 2,461 2,253 3,132 10,263 2,580
Average Selling Price 81$ 67$ 64$ 62$ 57$ 60$ 54$ 57$ 54$
Return Rate % 22.3% 21.5% 19.8% 19.2% 19.8% 20.5% 18.4% 19.4% 18.8%
Digital Sales % 45.2% 44.6% 46.9% 48.8% 47.9% 49.0% 51.9% 49.5% 50.6%
Transaction Costs per Unit 2.48$ 2.52$ 2.84$ 2.82$ 2.63$ 3.25$ 2.61$ 2.81$ 2.68$
Total Variable Costs % of Net Sales 8.0% 8.7% 9.2% 10.0% 9.6% 10.6% 9.4% 9.9% 9.6%
Mobile % of Digital Sales 25.2% 33.5% 42.3% 45.6% 45.2% 45.9% 45.0% 45.4% 48.0%
Interactive Voice Response % 25% 29% 27% 26% 25% 24% 21% 24% 24%
Total Customers (000s)* 1,357 1,446 1,436 619 611 588 741 1,429 602
Average Purchase Frequency - Items 5.8 7.0 7.5 4.3 4.5 4.3 4.8 8.2 4.8
% of Net Merchandise Sales by Category
Jewelry & Watches 43% 42% 39% 43% 41% 42% 38% 41% 41%
Home & Consumer Electronics 35% 30% 31% 24% 21% 25% 31% 25% 22%
Beauty 11% 12% 14% 15% 16% 14% 17% 16% 15%
Fashion & Accessories 11% 16% 16% 18% 22% 19% 14% 18% 22%
100% 100% 100% 100% 100% 100% 100% 100% 100%
*Customers can be active within one to four quarters per year and therefore quarterly active customer counts are not additive.
24