investor presentation - trican well service ir... · cementing fracturing nitrogen . ... •...
TRANSCRIPT

Investor Presentation January 2016
This document contains statements that constitute forward-looking statements within the meaning of applicable securities legislation. These forward-looking statements include, among others, the Company’s prospects, expected revenues, expenses, profits, expected developments and strategies for its operations, and other expectations, beliefs, plans, goals, objectives, assumptions, information and statements about possible future events, conditions, results of operations or performance. These forward-looking statements are identified by their use of terms and phrases such as “anticipate,” “achieve”, “achievable,” “believe,” “estimate,” “expect,” “intend”, “plan”, “planned”, and other similar terms and phrases. Forward-looking statements are based on current expectations, estimates, projections and assumptions that involve a number of risks and uncertainties, which could cause actual results to differ materially from those anticipated. These risks and uncertainties include: fluctuating prices for crude oil and natural gas; changes in drilling activity; general global economic, political and business conditions; weather conditions; regulatory changes; and availability of products, qualified personnel, manufacturing capacity and raw materials. If any of these uncertainties materialize, or if assumptions are incorrect, actual results may vary materially from those expected.
FORWARD LOOKING STATEMENTS
2
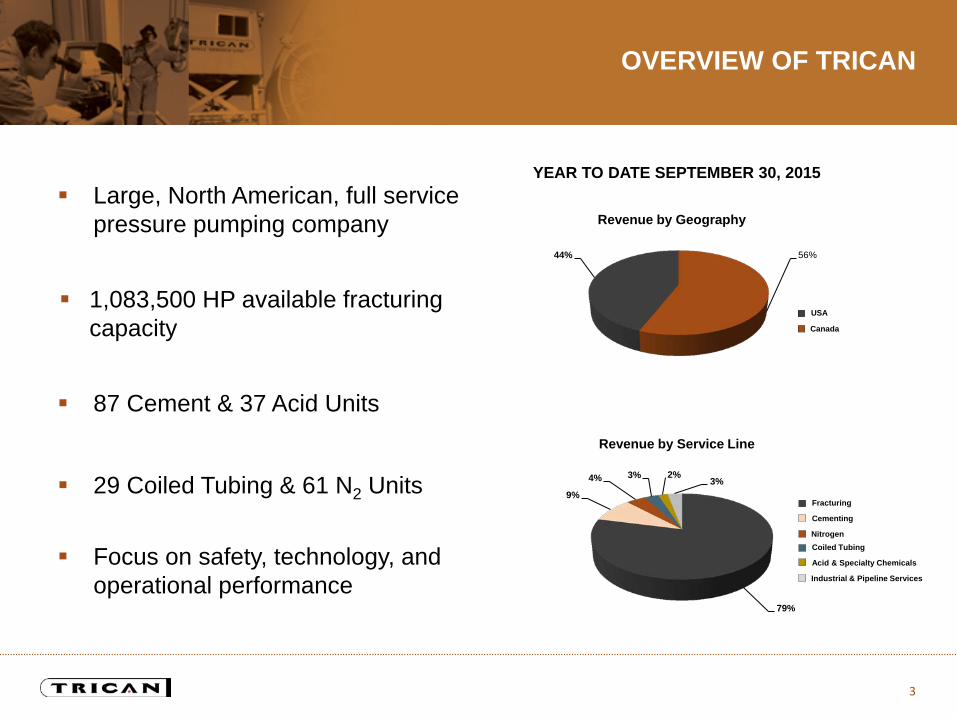
56% 44%
OVERVIEW OF TRICAN
Large, North American, full service pressure pumping company
1,083,500 HP available fracturing capacity
87 Cement & 37 Acid Units
29 Coiled Tubing & 61 N2 Units
Focus on safety, technology, and operational performance
Revenue by Geography
3
Revenue by Service Line
79%
9%
4% 3% 2% 3%
USA
Canada
Cementing
Fracturing
Nitrogen
Acid & Specialty Chemicals
Coiled Tubing
Industrial & Pipeline Services
YEAR TO DATE SEPTEMBER 30, 2015
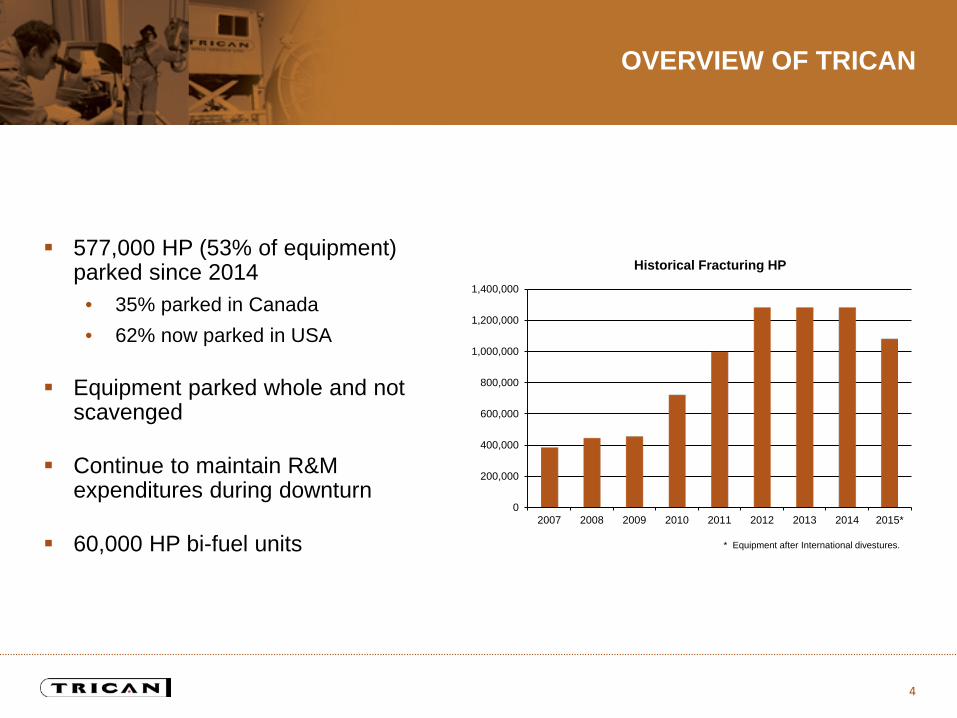
OVERVIEW OF TRICAN
577,000 HP (53% of equipment) parked since 2014
• 35% parked in Canada • 62% now parked in USA
Equipment parked whole and not scavenged
Continue to maintain R&M expenditures during downturn
60,000 HP bi-fuel units
* Equipment after International divestures.
0
200,000
400,000
600,000
800,000
1,000,000
1,200,000
1,400,000
2007 2008 2009 2010 2011 2012 2013 2014 2015*
Historical Fracturing HP
4
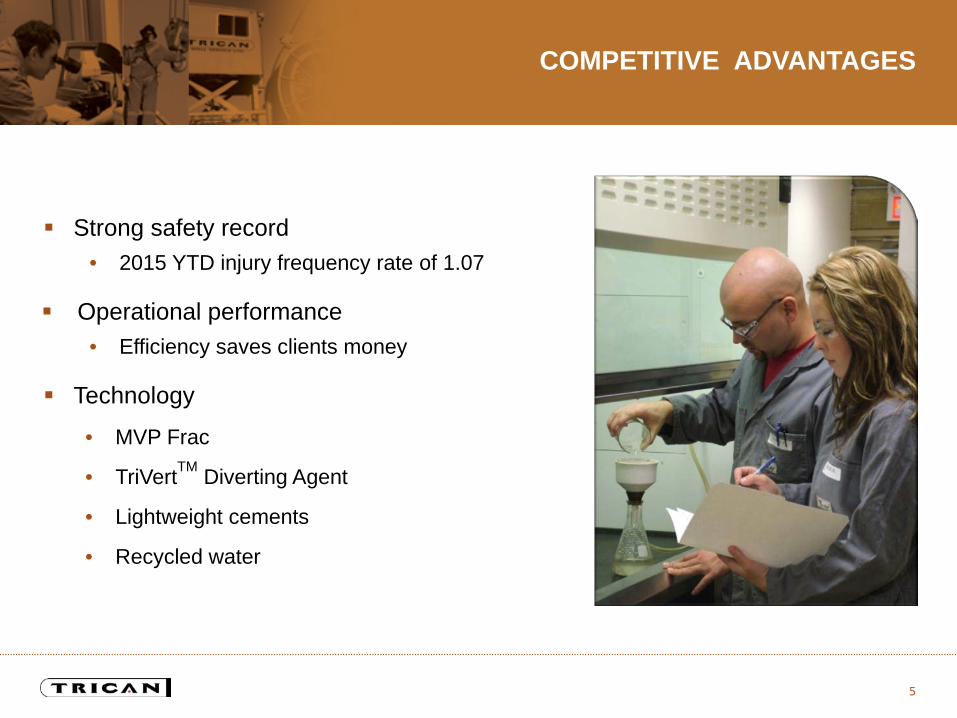
COMPETITIVE ADVANTAGES
Strong safety record • 2015 YTD injury frequency rate of 1.07
Operational performance • Efficiency saves clients money
Technology
• MVP Frac
• TriVertTM Diverting Agent
• Lightweight cements
• Recycled water
5
CANADA
6
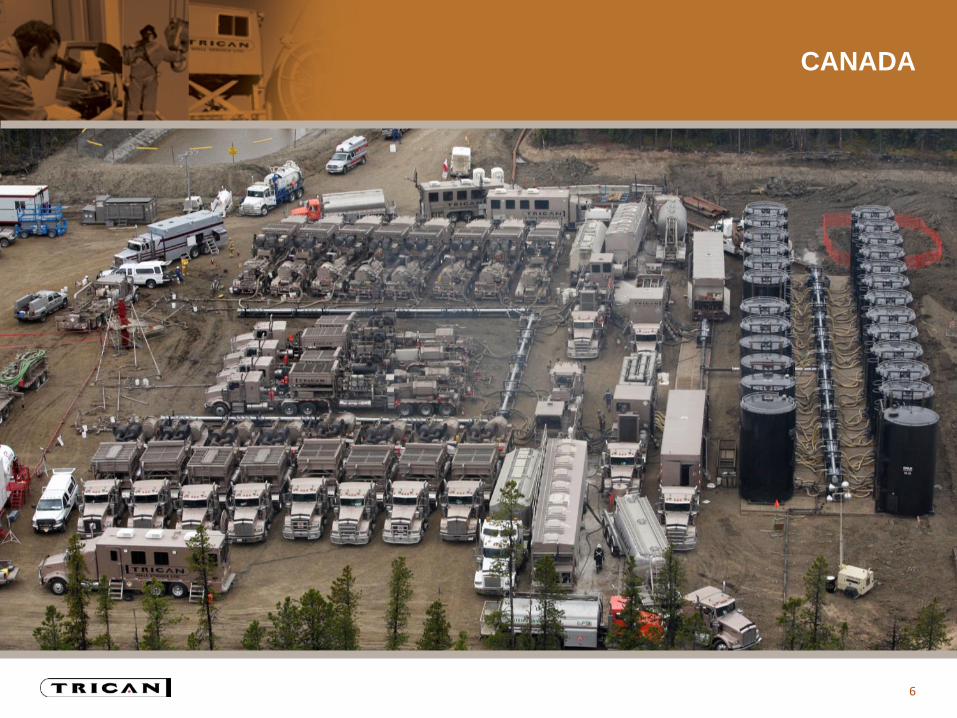
CANADA
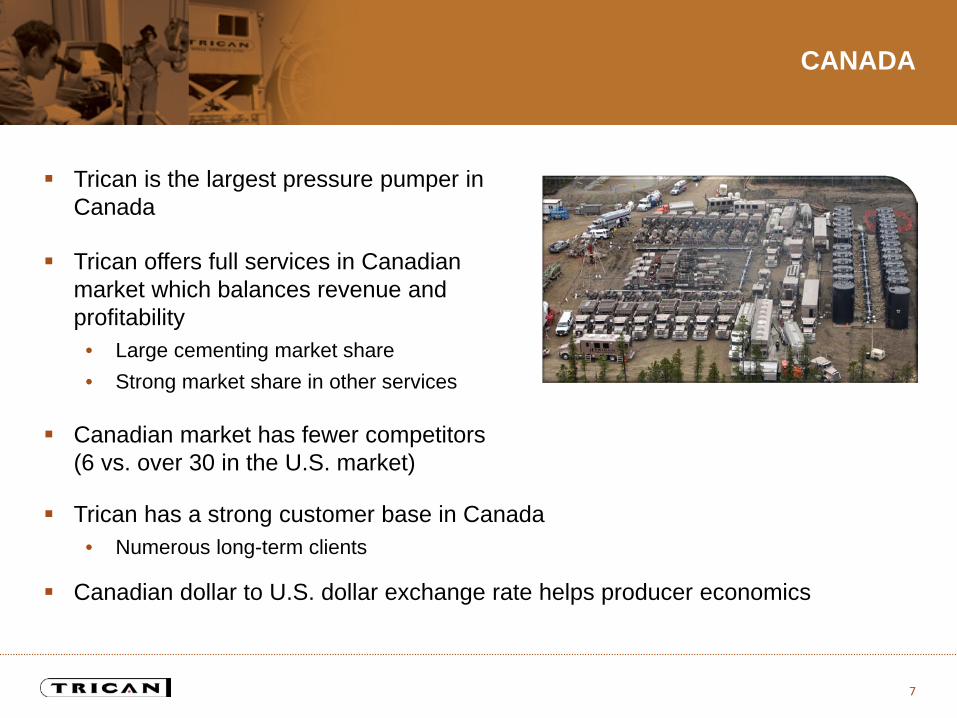
Trican is the largest pressure pumper in Canada
Trican offers full services in Canadian market which balances revenue and profitability
• Large cementing market share • Strong market share in other services
Canadian market has fewer competitors (6 vs. over 30 in the U.S. market)
7
Trican has a strong customer base in Canada • Numerous long-term clients
Canadian dollar to U.S. dollar exchange rate helps producer economics
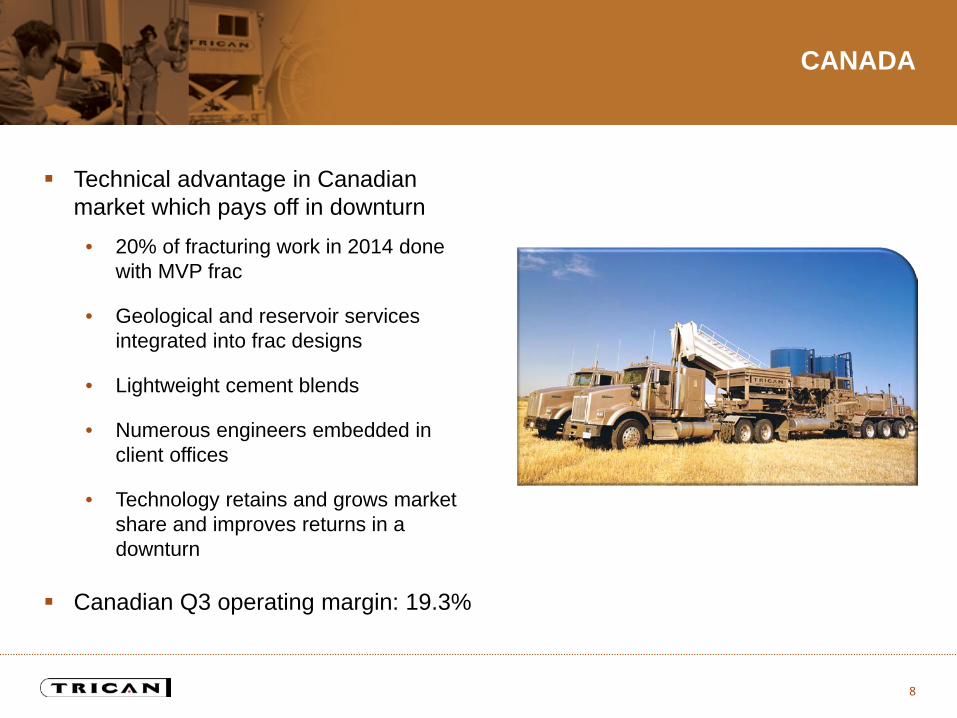
Technical advantage in Canadian market which pays off in downturn
• 20% of fracturing work in 2014 done with MVP frac
• Geological and reservoir services integrated into frac designs
• Lightweight cement blends
• Numerous engineers embedded in client offices
• Technology retains and grows market share and improves returns in a downturn
Canadian Q3 operating margin: 19.3%
CANADA
8
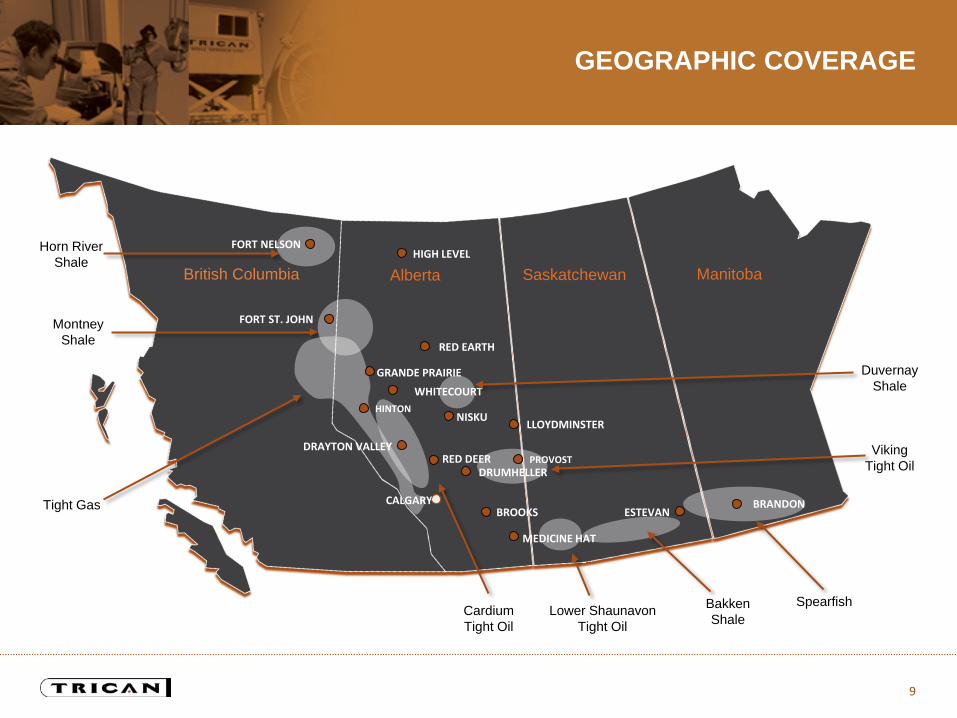
GEOGRAPHIC COVERAGE
Horn River Shale
Montney Shale
Bakken Shale
Cardium Tight Oil
Viking Tight Oil
Lower Shaunavon Tight Oil
HIGH LEVEL
RED EARTH
GRANDE PRAIRIE
WHITECOURT HINTON
FORT ST. JOHN
NISKU LLOYDMINSTER
RED DEER PROVOST DRUMHELLER
BROOKS
MEDICINE HAT
ESTEVAN
British Columbia Alberta Saskatchewan
FORT NELSON
Tight Gas
Duvernay Shale
DRAYTON VALLEY
CALGARY
Manitoba
BRANDON
Spearfish
9
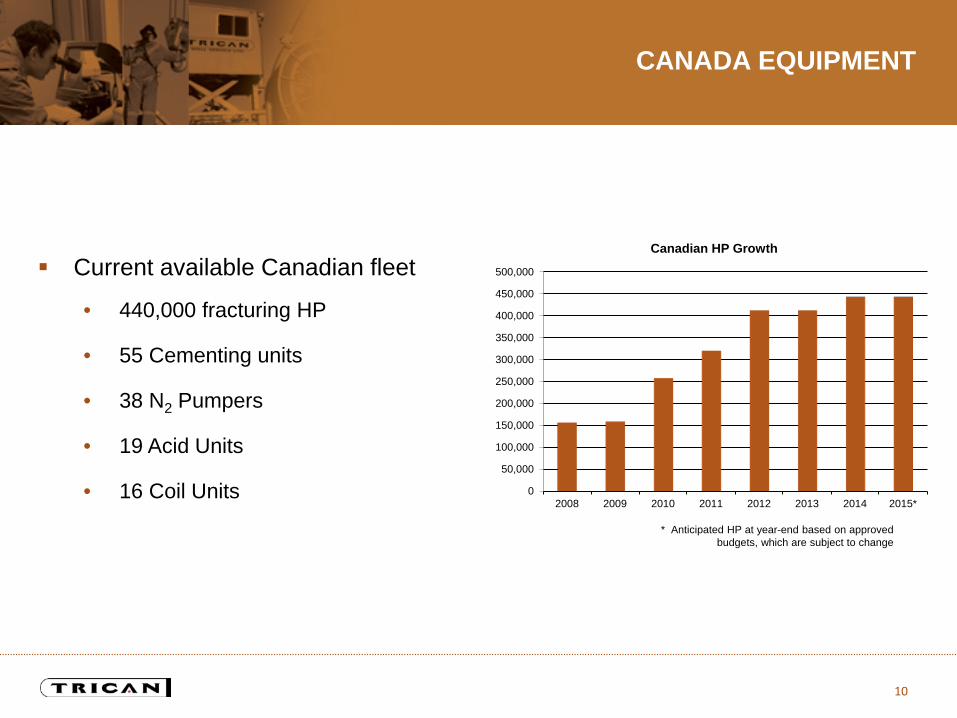
CANADA EQUIPMENT
Current available Canadian fleet
• 440,000 fracturing HP
• 55 Cementing units
• 38 N2 Pumpers
• 19 Acid Units
• 16 Coil Units
10
* Anticipated HP at year-end based on approved budgets, which are subject to change
0
50,000
100,000
150,000
200,000
250,000
300,000
350,000
400,000
450,000
500,000
2008 2009 2010 2011 2012 2013 2014 2015*
Canadian HP Growth
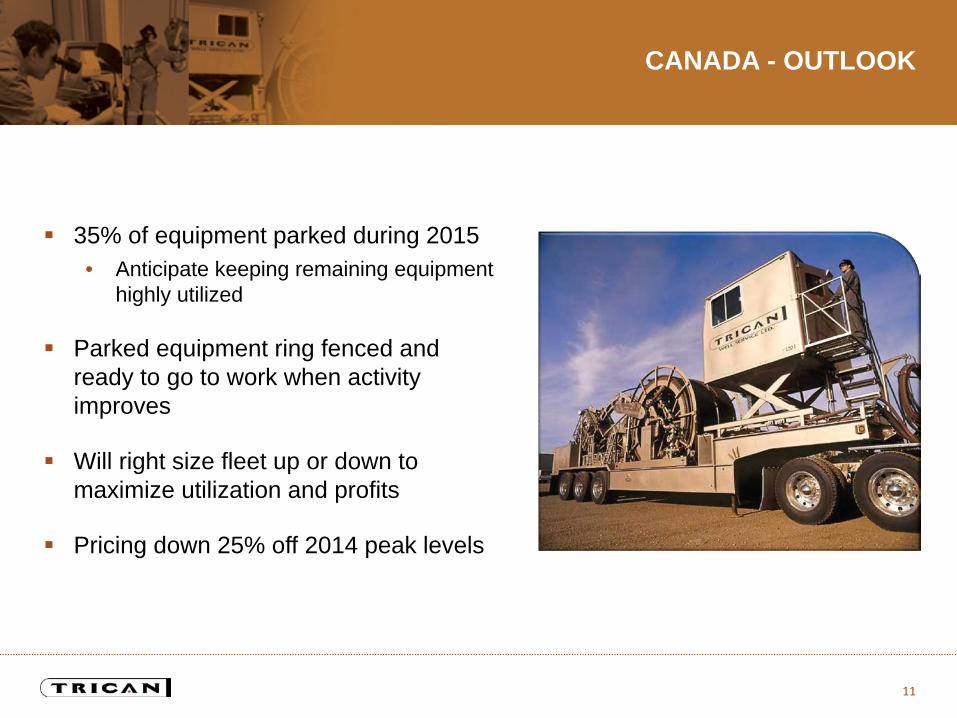
CANADA - OUTLOOK
35% of equipment parked during 2015 • Anticipate keeping remaining equipment
highly utilized
Parked equipment ring fenced and ready to go to work when activity improves
Will right size fleet up or down to maximize utilization and profits
Pricing down 25% off 2014 peak levels
11
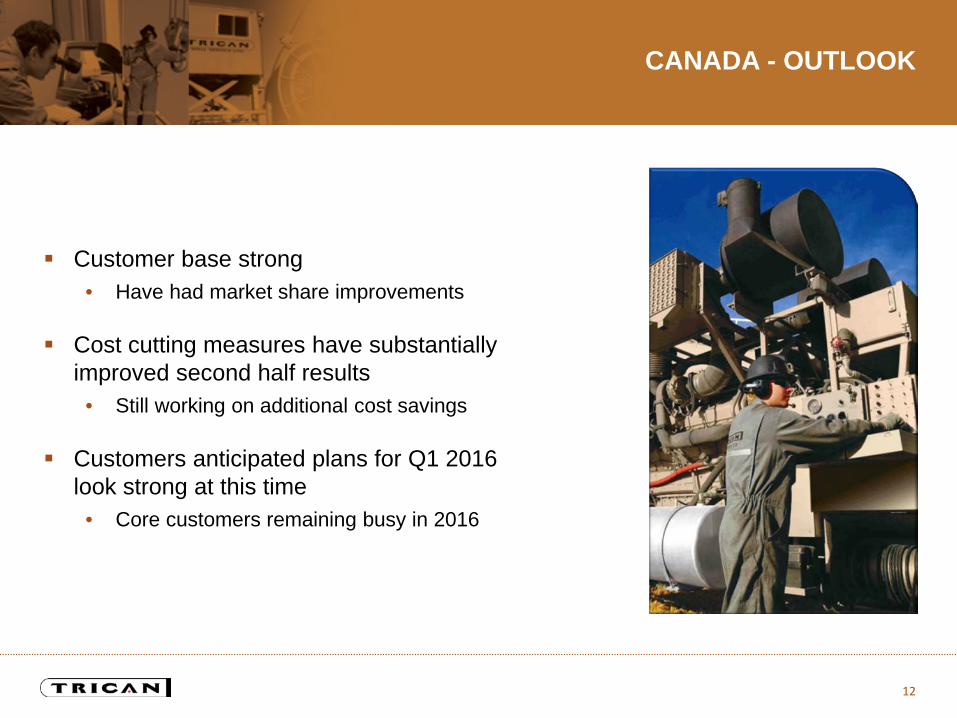
CANADA - OUTLOOK
Customer base strong • Have had market share improvements
Cost cutting measures have substantially improved second half results
• Still working on additional cost savings
Customers anticipated plans for Q1 2016 look strong at this time
• Core customers remaining busy in 2016
12
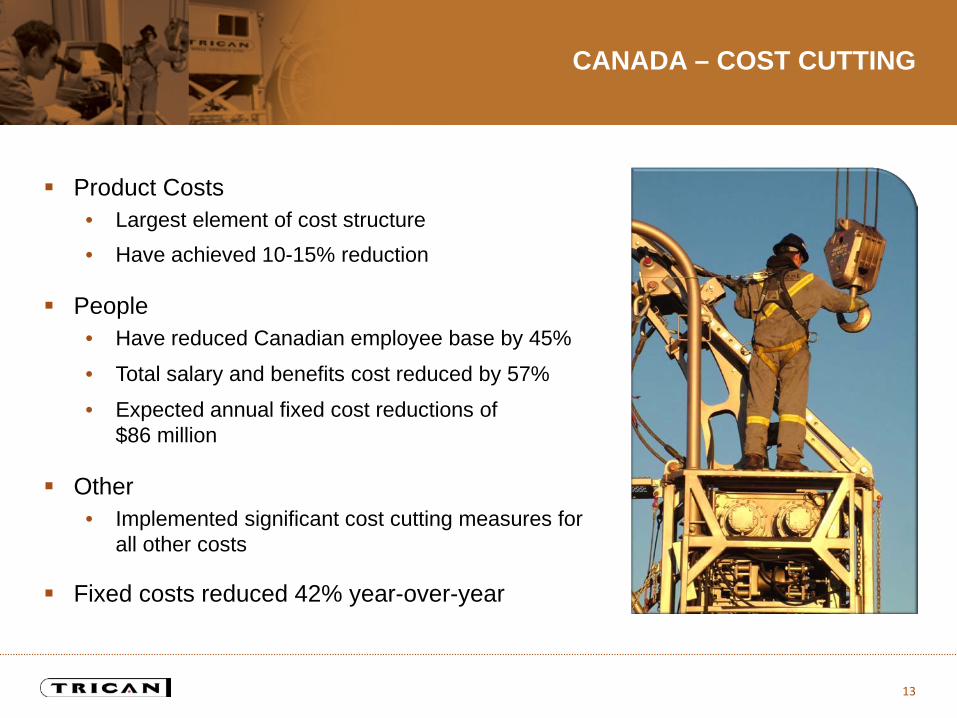
CANADA – COST CUTTING
Product Costs • Largest element of cost structure • Have achieved 10-15% reduction
People • Have reduced Canadian employee base by 45%
• Total salary and benefits cost reduced by 57%
• Expected annual fixed cost reductions of $86 million
Other • Implemented significant cost cutting measures for
all other costs
Fixed costs reduced 42% year-over-year
13
USA
14
HOUSTON
MATHIS
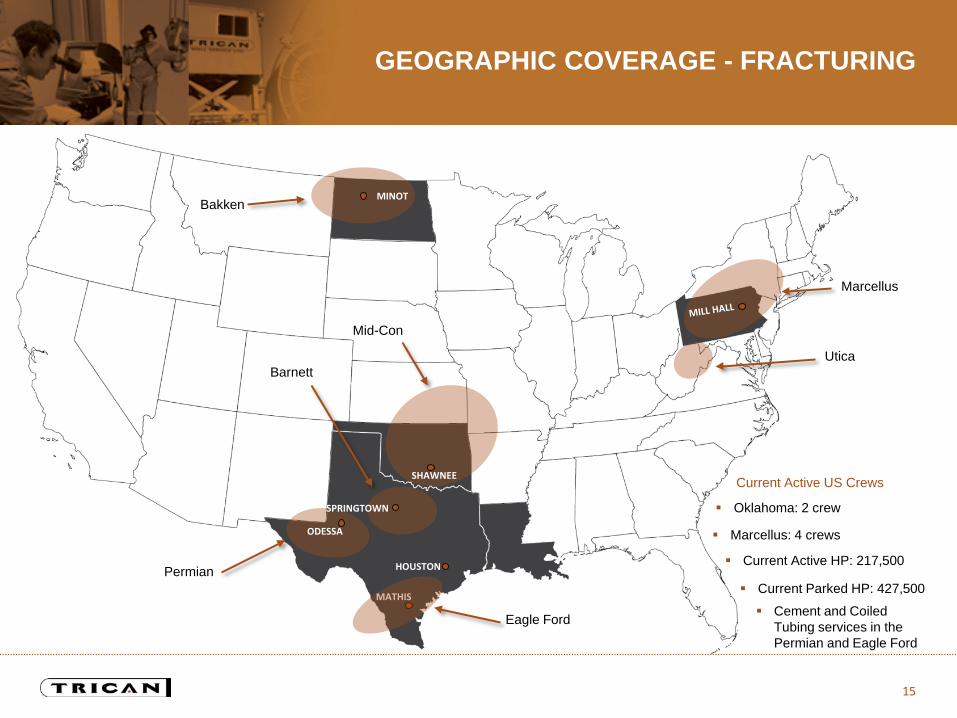
GEOGRAPHIC COVERAGE - FRACTURING
Oklahoma: 2 crew
Marcellus: 4 crews Current Active HP: 217,500
Bakken MINOT
Utica
Marcellus
ODESSA
Permian
SHAWNEE
Mid-Con
SPRINGTOWN
Barnett
Eagle Ford
Current Active US Crews
Current Parked HP: 427,500
15
Cement and Coiled Tubing services in the Permian and Eagle Ford
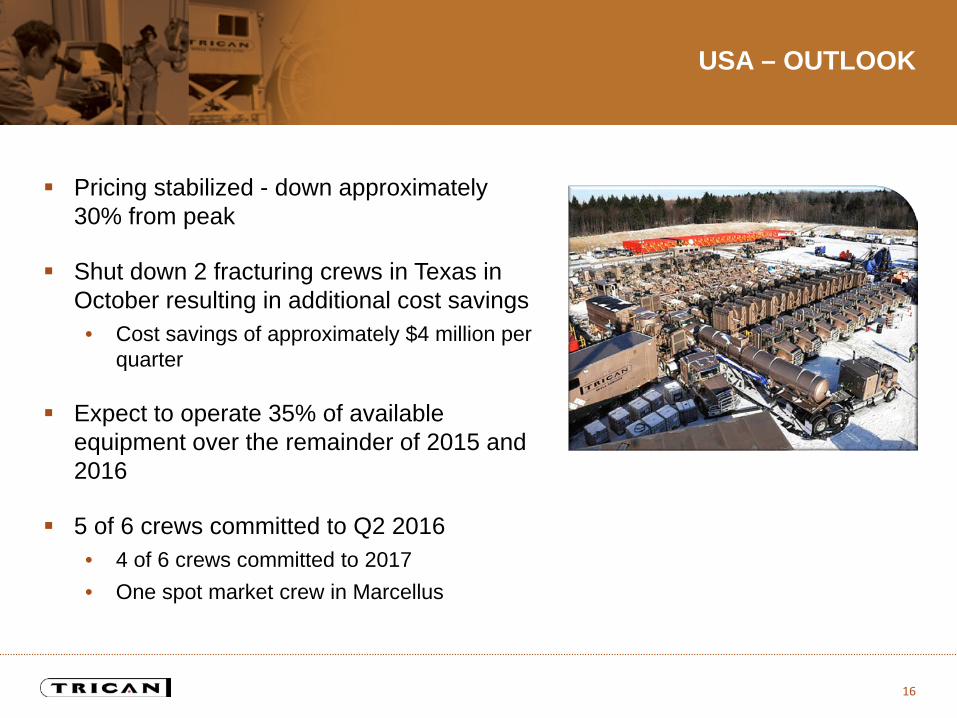
USA – OUTLOOK
Pricing stabilized - down approximately 30% from peak
Shut down 2 fracturing crews in Texas in October resulting in additional cost savings • Cost savings of approximately $4 million per
quarter
Expect to operate 35% of available equipment over the remainder of 2015 and 2016
5 of 6 crews committed to Q2 2016 • 4 of 6 crews committed to 2017 • One spot market crew in Marcellus
16
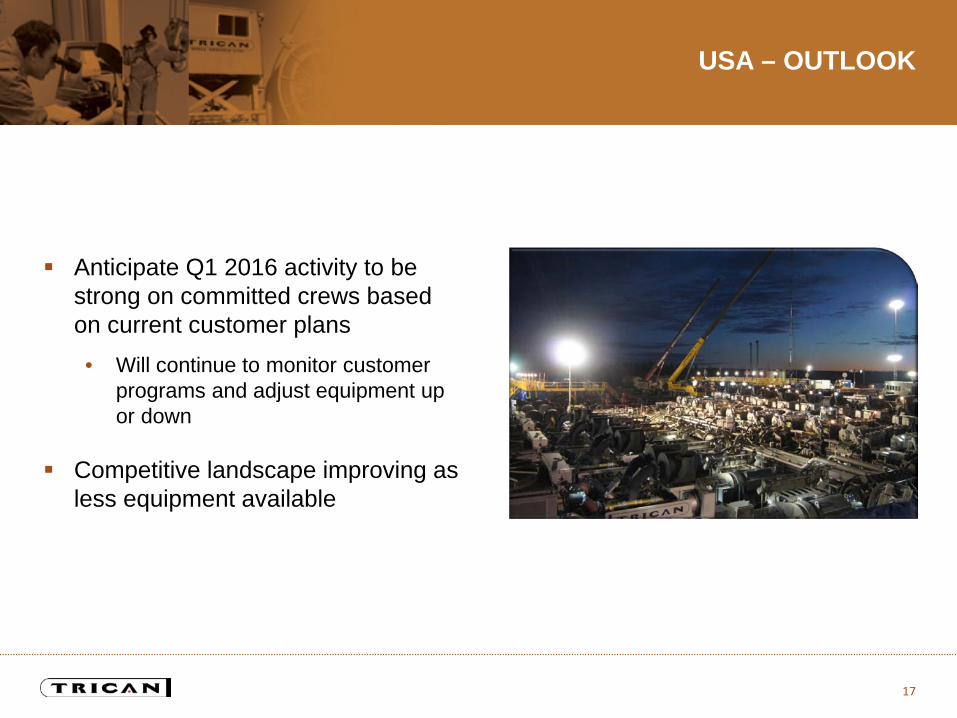
USA – OUTLOOK
Anticipate Q1 2016 activity to be strong on committed crews based on current customer plans • Will continue to monitor customer
programs and adjust equipment up or down
Competitive landscape improving as less equipment available
17
US - COST CUTTING
Product costs • Have achieved 15-25% reduction to date
People • Have reduced employee base by 60%
• Salary reductions of 10% on remaining employees
• Expected annual fixed cost reductions of $76 million
18
Equipment • Repair costs have not declined on a $/HP basis as we continue to maintain
equipment
• Parked equipment ring fenced and available to go to work
Fixed costs reduced 51% year-over-year and 16% sequentially
CORPORATE - COST CUTTING
People Costs • Salary and benefits reductions
- Salary reductions of 10%
- Temporary suspension of certain benefits
• Reduced Corporate employee base by 40%
• Total annualized cost reductions of $24 million
19
Other • Implemented significant cost cutting
measures for all other Corporate expenses
Corporate costs down 70% year-over-year
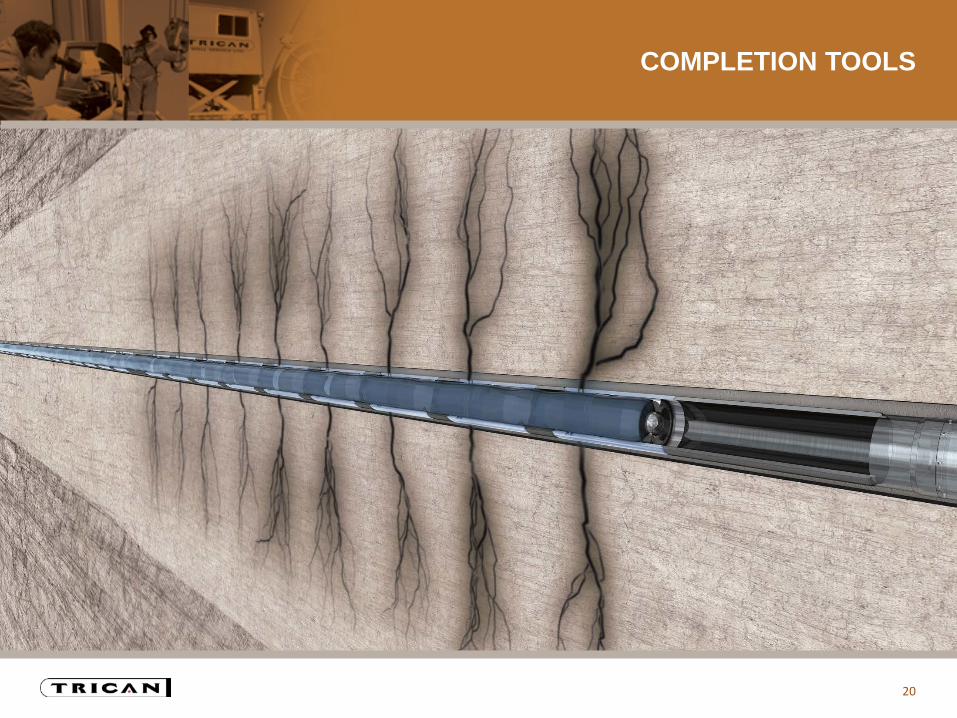
COMPLETION TOOLS
20
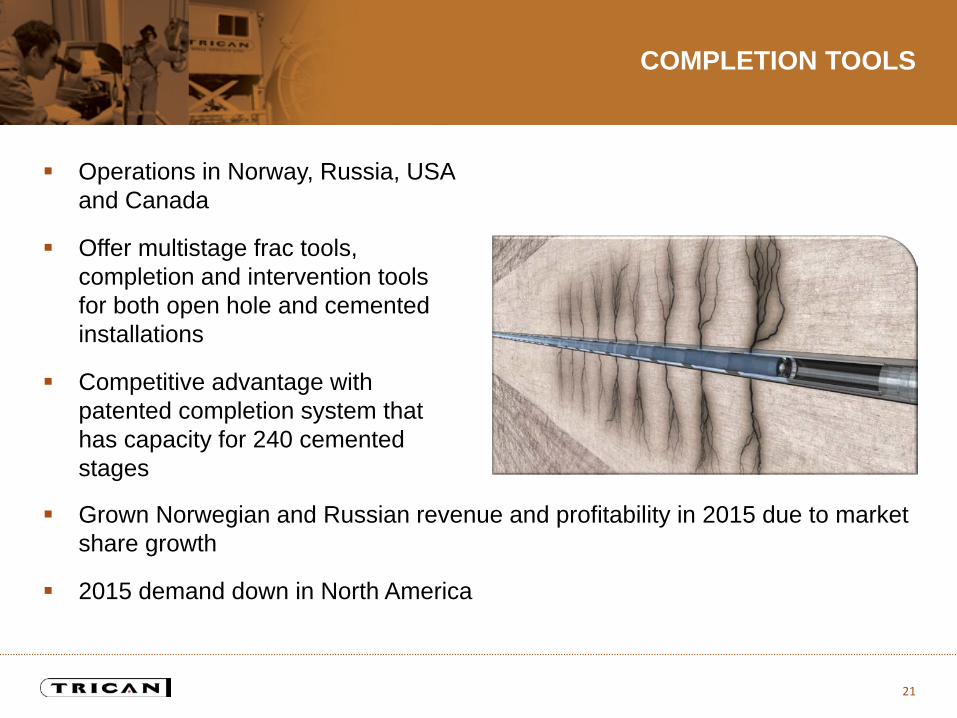
COMPLETION TOOLS
Operations in Norway, Russia, USA and Canada
Offer multistage frac tools, completion and intervention tools for both open hole and cemented installations
Competitive advantage with patented completion system that has capacity for 240 cemented stages
Grown Norwegian and Russian revenue and profitability in 2015 due to market share growth
2015 demand down in North America
21
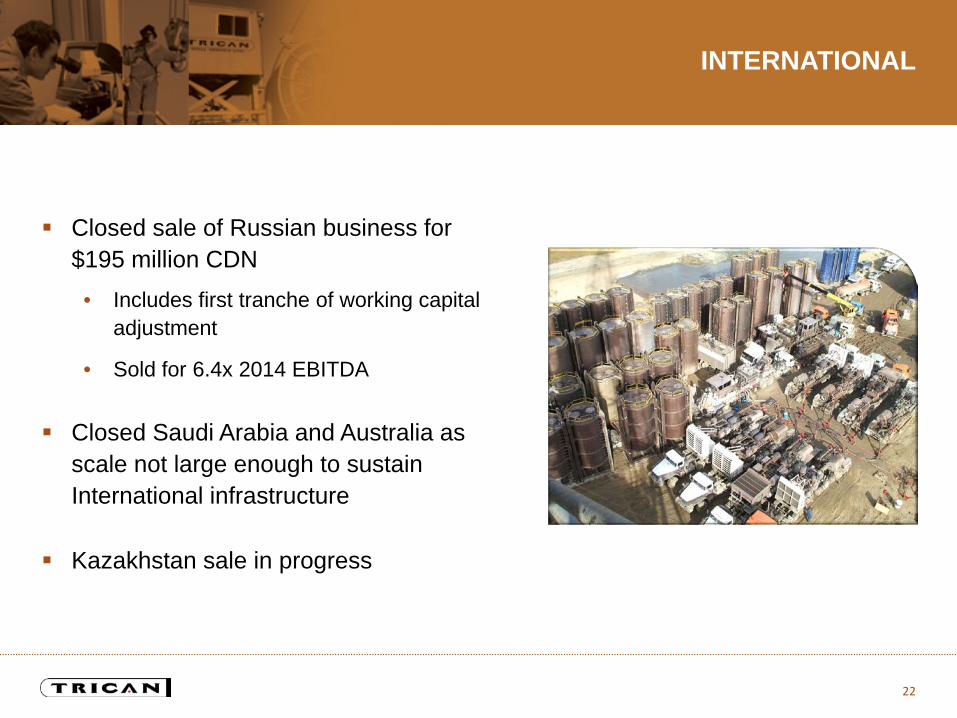
INTERNATIONAL
Closed sale of Russian business for $195 million CDN
• Includes first tranche of working capital adjustment
• Sold for 6.4x 2014 EBITDA
Closed Saudi Arabia and Australia as scale not large enough to sustain International infrastructure
Kazakhstan sale in progress
22
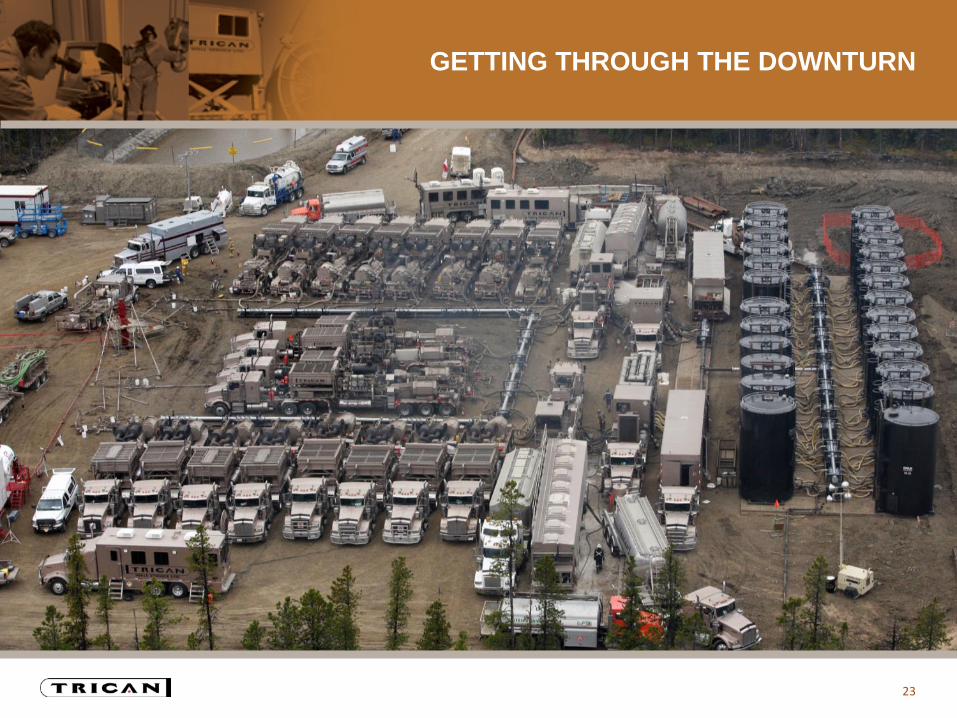
GETTING THROUGH THE DOWNTURN
23
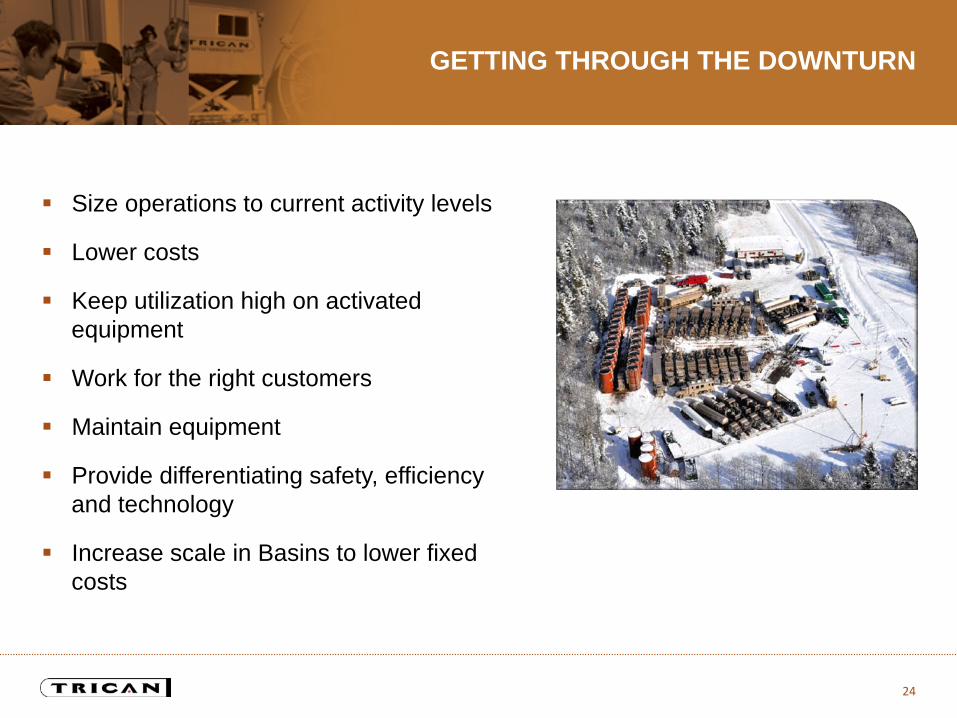
GETTING THROUGH THE DOWNTURN
Size operations to current activity levels
Lower costs
Keep utilization high on activated equipment
Work for the right customers
Maintain equipment
Provide differentiating safety, efficiency and technology
Increase scale in Basins to lower fixed costs
24
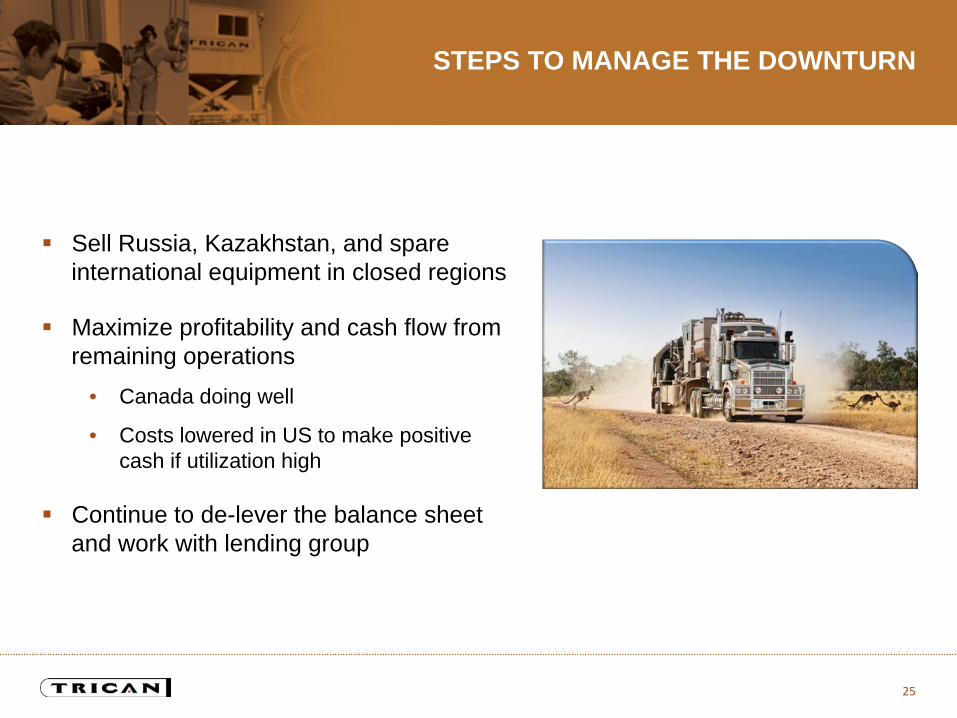
STEPS TO MANAGE THE DOWNTURN
Sell Russia, Kazakhstan, and spare international equipment in closed regions
Maximize profitability and cash flow from remaining operations
• Canada doing well
• Costs lowered in US to make positive cash if utilization high
Continue to de-lever the balance sheet and work with lending group
25
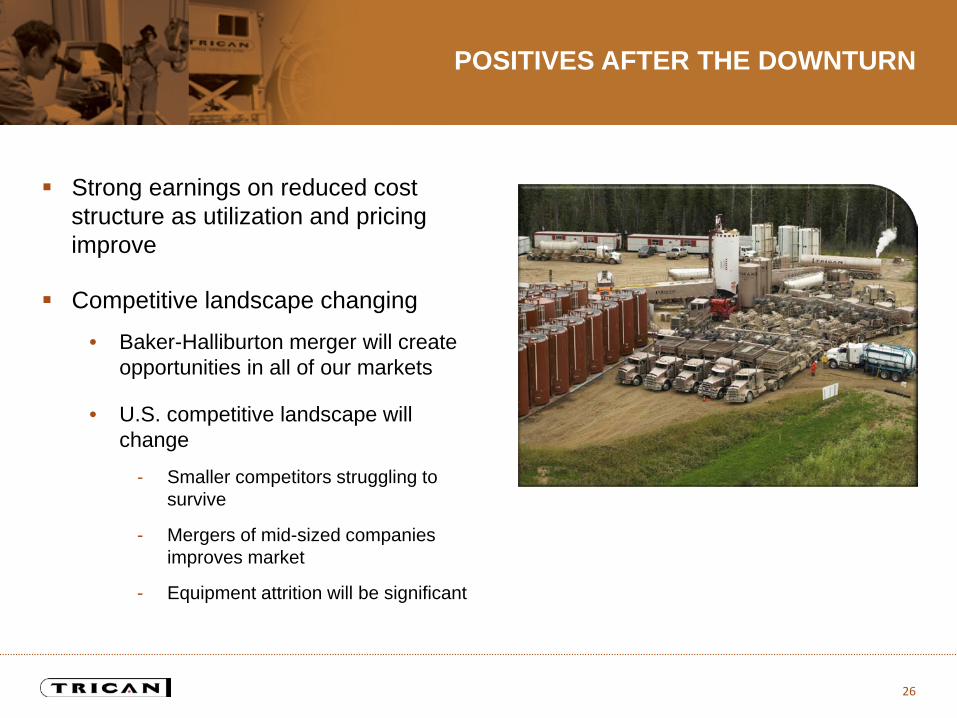
POSITIVES AFTER THE DOWNTURN
Strong earnings on reduced cost structure as utilization and pricing improve
Competitive landscape changing
• Baker-Halliburton merger will create opportunities in all of our markets
• U.S. competitive landscape will change
- Smaller competitors struggling to survive
- Mergers of mid-sized companies improves market
- Equipment attrition will be significant
26
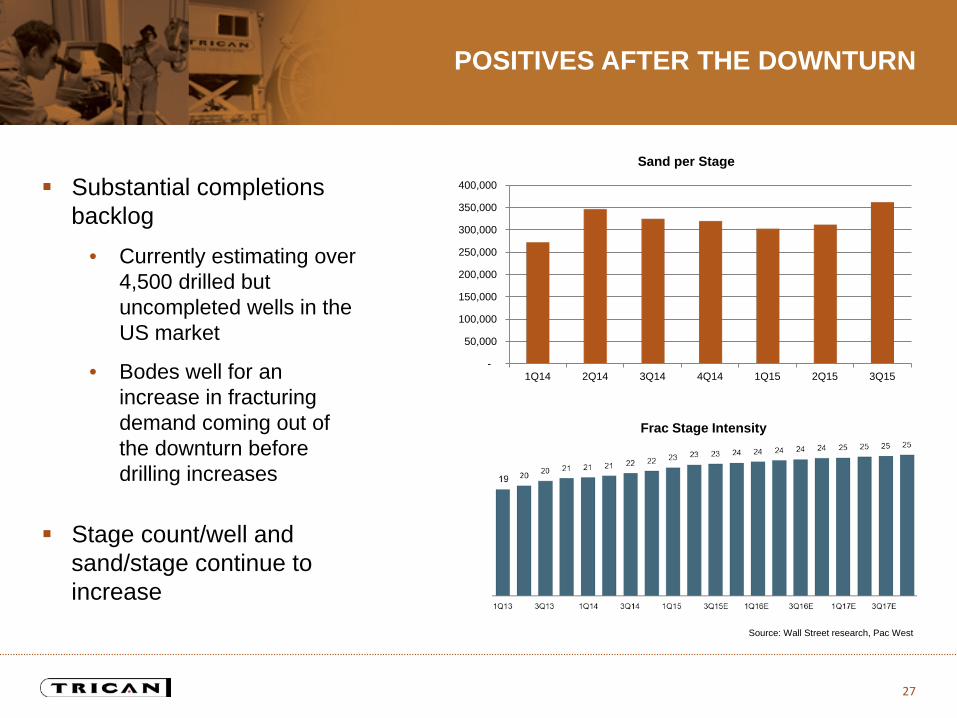
POSITIVES AFTER THE DOWNTURN
Substantial completions backlog
• Currently estimating over 4,500 drilled but uncompleted wells in the US market
• Bodes well for an increase in fracturing demand coming out of the downturn before drilling increases
Stage count/well and sand/stage continue to increase
27
-
50,000
100,000
150,000
200,000
250,000
300,000
350,000
400,000
1Q14 2Q14 3Q14 4Q14 1Q15 2Q15 3Q15
Sand per Stage
Frac Stage Intensity
Source: Wall Street research, Pac West
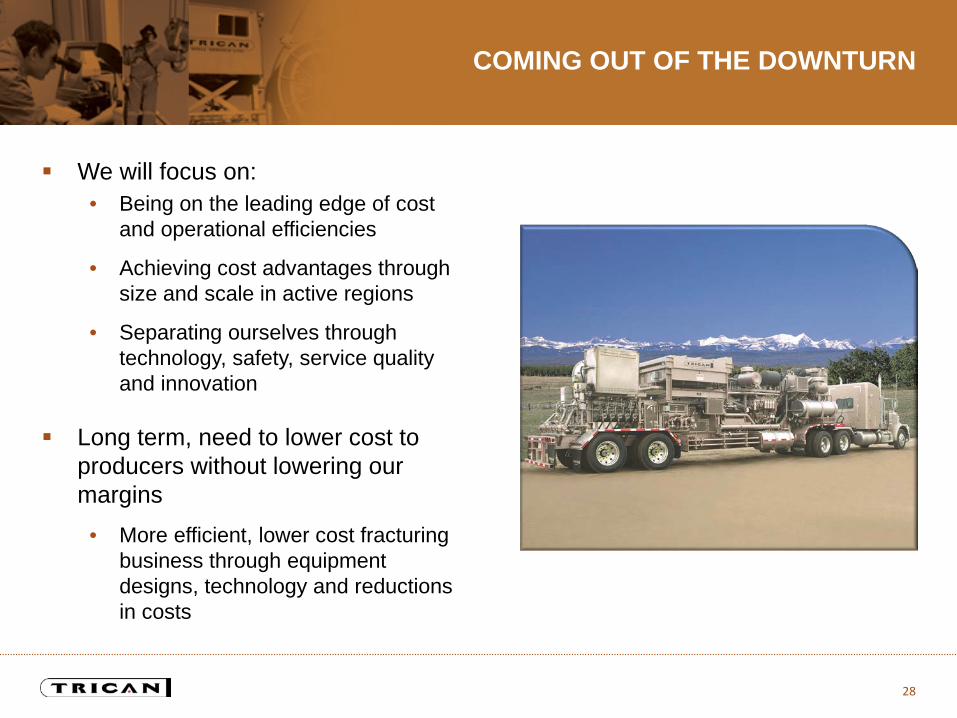
We will focus on: • Being on the leading edge of cost
and operational efficiencies
• Achieving cost advantages through size and scale in active regions
• Separating ourselves through technology, safety, service quality and innovation
Long term, need to lower cost to producers without lowering our margins
• More efficient, lower cost fracturing business through equipment designs, technology and reductions in costs
COMING OUT OF THE DOWNTURN
28
INNOVATION
29
INNOVATION
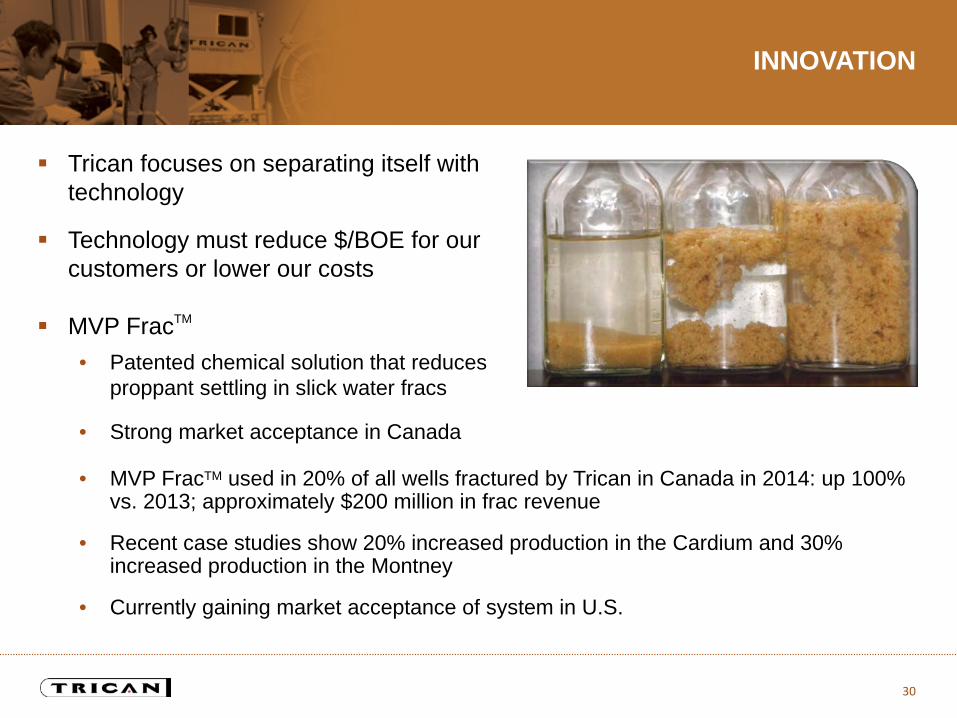
Trican focuses on separating itself with technology
Technology must reduce $/BOE for our customers or lower our costs
MVP FracTM
• Patented chemical solution that reduces proppant settling in slick water fracs
• Strong market acceptance in Canada
• MVP FracTM used in 20% of all wells fractured by Trican in Canada in 2014: up 100% vs. 2013; approximately $200 million in frac revenue
• Recent case studies show 20% increased production in the Cardium and 30% increased production in the Montney
• Currently gaining market acceptance of system in U.S.
30
INNOVATION
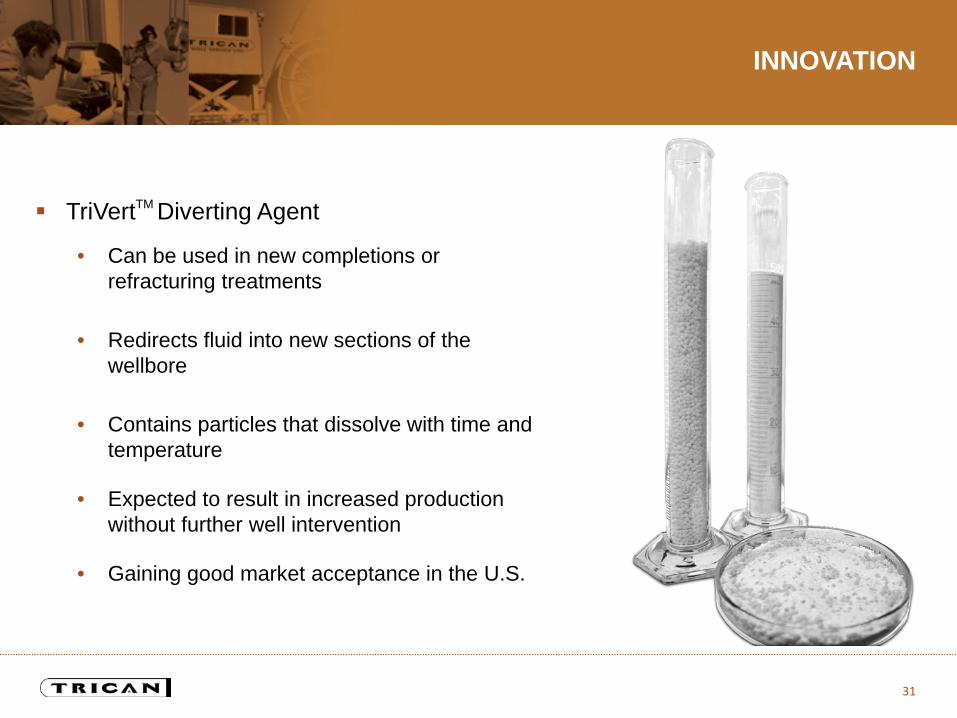
TriVertTM Diverting Agent
• Can be used in new completions or refracturing treatments
• Redirects fluid into new sections of the wellbore
• Contains particles that dissolve with time and temperature
• Expected to result in increased production without further well intervention
• Gaining good market acceptance in the U.S.
31
TRICAN RESERVOIR SOLUTIONS
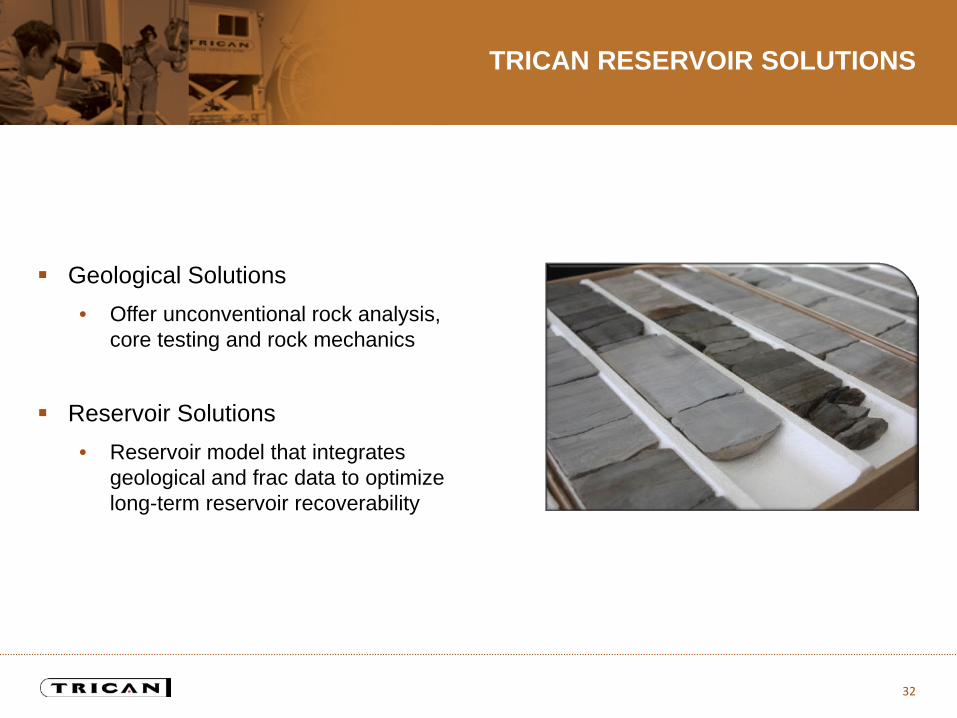
Geological Solutions • Offer unconventional rock analysis,
core testing and rock mechanics
Reservoir Solutions • Reservoir model that integrates
geological and frac data to optimize long-term reservoir recoverability
32
SUSTAINABLE INNOVATION
EcoClean Fluids • Continuing to expand our line of
environmentally friendly fracturing fluids
Water Management and Reduction • Developed a 100% recycled water
crosslinked fluid solution with no mechanical treatment
• Recycled water used on most fracturing projects in the U.S.
33
FINANCIAL OVERVIEW
34
DEBT STRUCTURE
Current outstanding and available debt at November 30, 2015
• $335 million in fixed rate notes payable - $147 million due by April 2016
• $235 million drawn on $410 million revolving credit facility
• $233 million in cash and available debt as of November 30
New covenant agreement in place
35
Managing cash flow and liquidity a key focus in 2015
Dividend suspended until financial performance improves
Total capital spend in 2015 expected to be approximately $30 million
• No expansion initiatives will be considered until financial performance improves
2016 Capex anticipated to be $20 to $30 million
CASH FLOW
36
INVESTMENT ADVANTAGES
Trading substantially below book value
Significant earnings potential on existing assets
High leverage on low cost structure coming out of downturn
Low capital expenditures in 2015 and 2016
Free cash flow in 2015
Strong Canadian business that is generating industry leading margins
Strong management team that has managed through numerous cycles
Equipment base not scavenged and ready to go when activity increases
37
SUMMARY
Number of Outstanding Shares (as of December 31, 2015):
• 148.9 million
Average Daily Volume (one month period): • 783,564 (as of December 31, 2015)
Directors/Officers Ownership: • 2.0% (approx. - diluted basis)
Market Cap: • $95 million as of December 31, 2015
38
Investor Presentation January 2016