investor presentations2.q4cdn.com/.../2015/june/june-2015-investor-presentation_v001_j… ·...
TRANSCRIPT
Investor
Presentation
June 2015
Stuart Bradie – President and Chief Executive Officer Brian Ferraioli – EVP and Chief Financial Officer Zachary Nagle – VP, Investor Relations
Forward-Looking Statements
2
This presentation contains “forward-looking statements” within the meaning of Section 27A of the Securities Act of 1933 and Section 21E of the
Securities Exchange Act of 1934. These forward-looking statements include statements regarding our plans, objectives, goals, strategies, future events,
future financial performance and backlog information and other information that is not historical information. When used in this presentation, the words
“estimates,” “expects,” “anticipates,” “projects,” “plans,” “intends,” “believes,” “forecasts” or future or conditional verbs such as “will,” “should,” “could,” or
“may,” and variations of such words or similar expressions are intended to identify forward-looking statements. All forward-looking statements are based
upon our current expectations and various assumptions. Our expectations, beliefs, and projections are expressed in good faith, and we believe there is
a reasonable basis for them. However, there can be no assurance that management’s expectations, beliefs, and projections will be achieved.
There are numerous risks and uncertainties, many of which are beyond our control, that could cause actual results to differ materially from the forward-
looking statements contained in this presentation. These risks and uncertainties include, but are not limited to: current or future economic conditions; our
ability to obtain and perform under contracts from existing and new customers, including the U.S. Government; exposure to cost overruns, operating
cost inflation and potential liability claims and contract disputes; access to trained engineers and other skilled workers; risks relating to operating through
joint ventures and partnerships; risks inherent in doing business internationally; potential tax liabilities; maritime risks; changes in the demand for our
services and increased competition; protection of intellectual property rights; risks associated with possible future acquisitions; risks related to our
information technology systems; impairment of goodwill and/or intangible assets; reduction or reversal of previously recorded revenues; risks relating to
audits and investigations, including by governments; compliance with laws and regulations, and changes thereto, including those relating to the
environment, trade, exports and bribery; our creditworthiness and ability to comply with the financial covenants in our credit agreement; and other risk
factors discussed in our most recently filed Form 10-K, any subsequent Form 10-Qs and 8-Ks, and other Securities and Exchange Commission filings.
All forward-looking statements attributable to us, or persons acting on our behalf, apply only as of the date made and are expressly qualified in their
entirety by the cautionary statements in this presentation. Except as required by law, we undertake no obligation to revise or update forward-looking
statements to reflect events or circumstances that arise after the date made or to reflect the occurrence of unanticipated events.
This presentation contains the financial measure “EBITDA,” which is not calculated in accordance with generally accepted accounting principles in the
U.S. (“GAAP”). A reconciliation of the non-GAAP financial measure EBITDA to the most directly comparable GAAP financial measure has been
provided in the Appendix to this presentation.
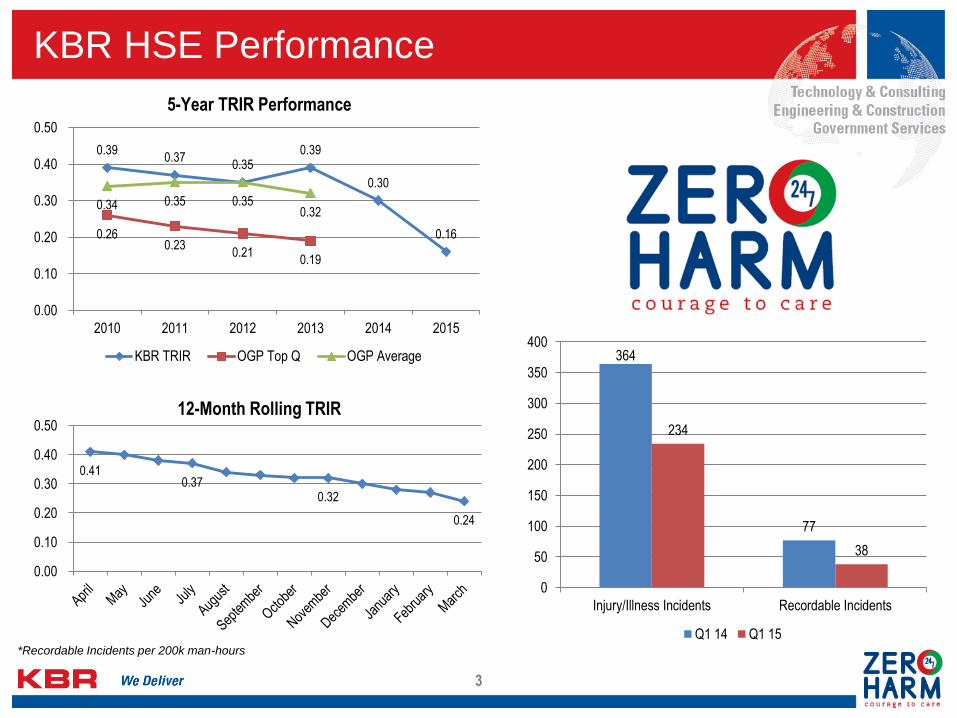
KBR HSE Performance
0.39 0.37
0.35 0.39
0.30
0.16 0.26 0.23
0.21 0.19
0.34 0.35 0.35 0.32
0.00
0.10
0.20
0.30
0.40
0.50
2010 2011 2012 2013 2014 2015
KBR TRIR OGP Top Q OGP Average
5-Year TRIR Performance
0.41 0.37
0.32
0.24
0.00
0.10
0.20
0.30
0.40
0.5012-Month Rolling TRIR
364
77
234
38
0
50
100
150
200
250
300
350
400
Injury/Illness Incidents Recordable Incidents
Q1 14 Q1 15
3
*Recordable Incidents per 200k man-hours
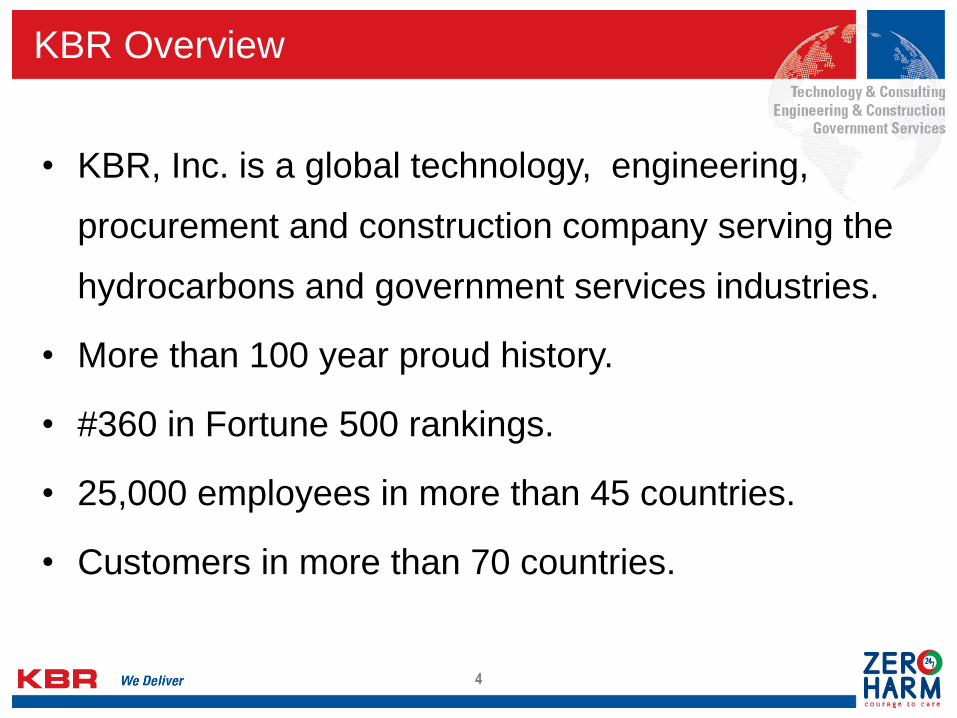
• KBR, Inc. is a global technology, engineering,
procurement and construction company serving the
hydrocarbons and government services industries.
• More than 100 year proud history.
• #360 in Fortune 500 rankings.
• 25,000 employees in more than 45 countries.
• Customers in more than 70 countries.
4
KBR Overview
• Company recently undertook a strategic review and the plan is
underway.
• Going forward, focus will be on differentiated offerings in core markets /
clients with emphasis on global hydrocarbons and international
government services.
• We have begun to streamline operations and significantly reduce costs.
• We have rebalanced our business portfolio.
• We will continue our efforts to commercially resolve disputes – i.e. less
litigation.
• We will continue to employ a balanced capital allocation policy.
5
KBR Overview
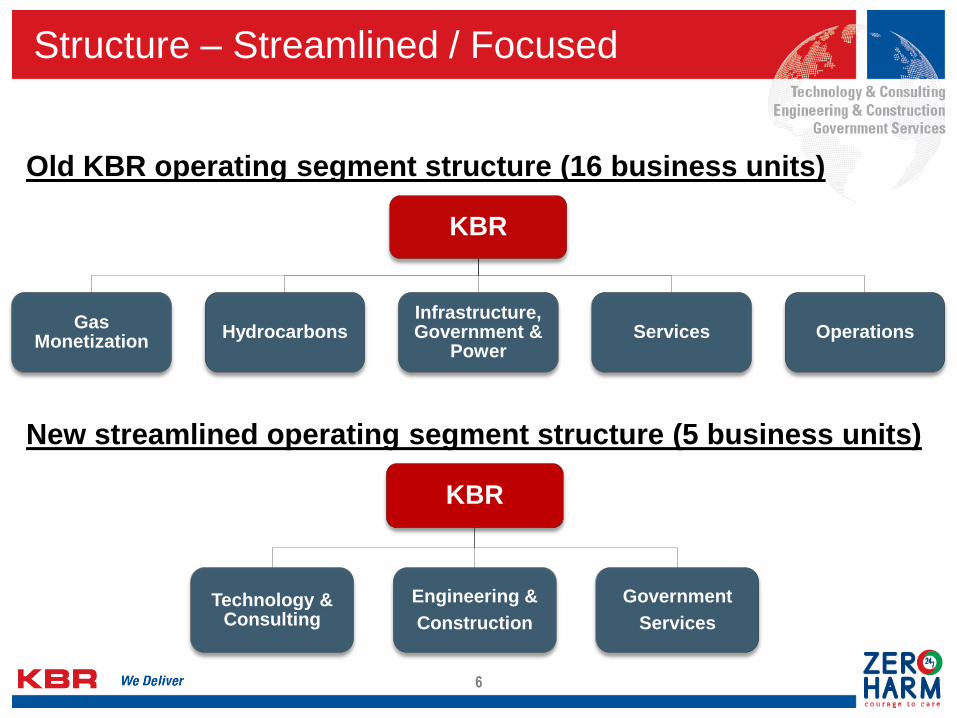
Old KBR operating segment structure (16 business units)
New streamlined operating segment structure (5 business units)
6
Structure – Streamlined / Focused
KBR
Gas Monetization
Hydrocarbons Infrastructure, Government &
Power Services Operations
KBR
Technology & Consulting
Engineering &
Construction
Government
Services
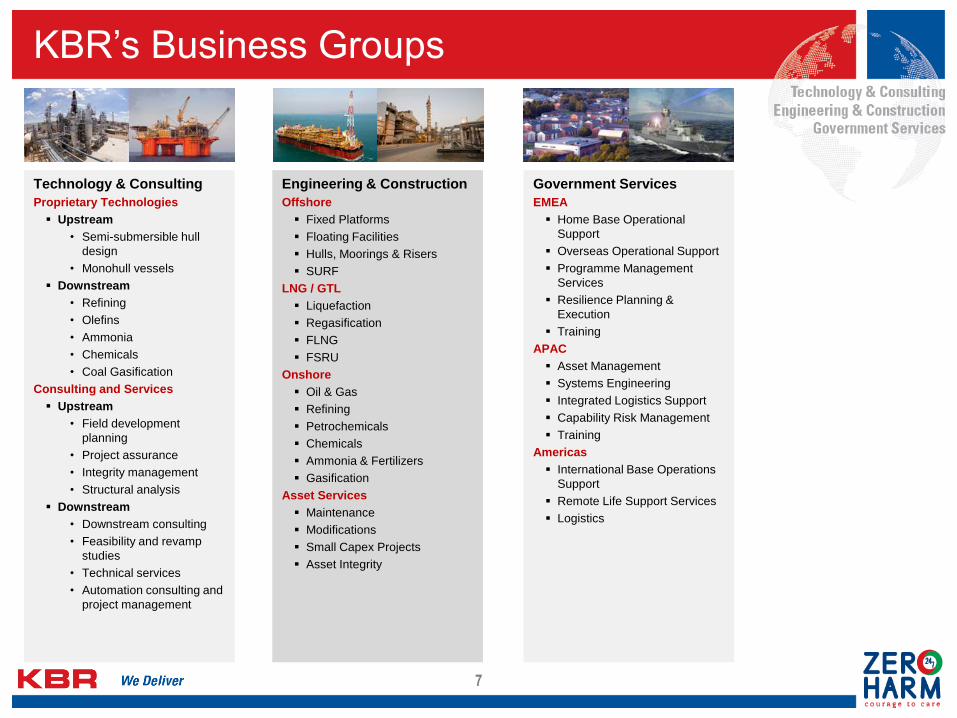
KBR’s Business Groups
Technology & Consulting
Proprietary Technologies
Upstream
• Semi-submersible hull
design
• Monohull vessels
Downstream
• Refining
• Olefins
• Ammonia
• Chemicals
• Coal Gasification
Consulting and Services
Upstream
• Field development
planning
• Project assurance
• Integrity management
• Structural analysis
Downstream
• Downstream consulting
• Feasibility and revamp
studies
• Technical services
• Automation consulting and
project management
Engineering & Construction
Offshore
Fixed Platforms
Floating Facilities
Hulls, Moorings & Risers
SURF
LNG / GTL
Liquefaction
Regasification
FLNG
FSRU
Onshore
Oil & Gas
Refining
Petrochemicals
Chemicals
Ammonia & Fertilizers
Gasification
Asset Services
Maintenance
Modifications
Small Capex Projects
Asset Integrity
Government Services
EMEA
Home Base Operational
Support
Overseas Operational Support
Programme Management
Services
Resilience Planning &
Execution
Training
APAC
Asset Management
Systems Engineering
Integrated Logistics Support
Capability Risk Management
Training
Americas
International Base Operations
Support
Remote Life Support Services
Logistics
7
8
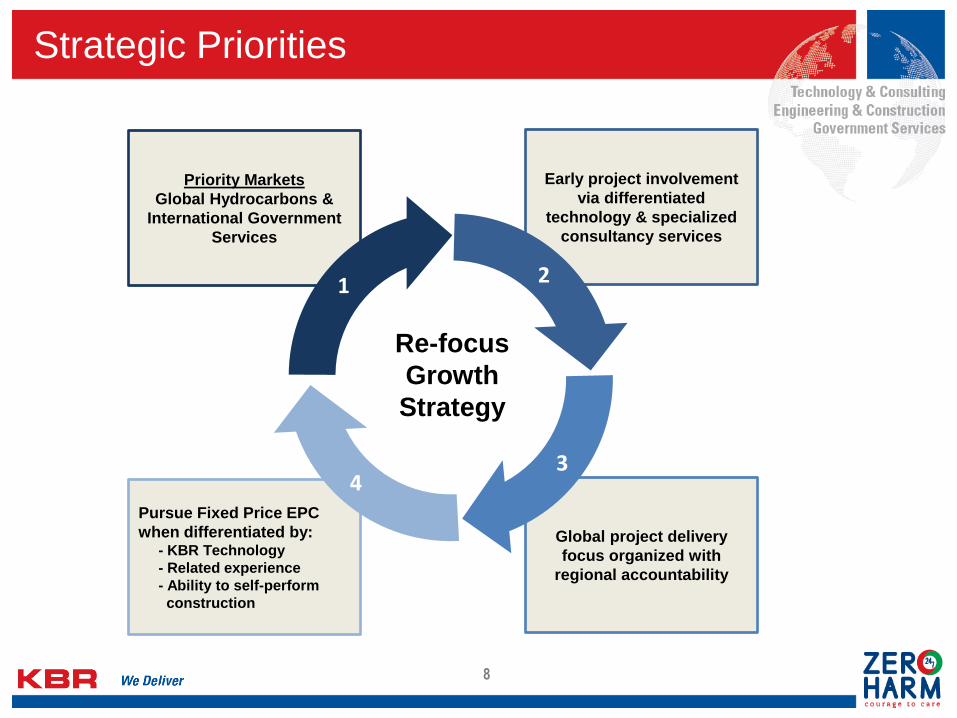
Strategic Priorities
Priority Markets
Global Hydrocarbons &
International Government
Services
Early project involvement
via differentiated
technology & specialized
consultancy services
Pursue Fixed Price EPC
when differentiated by: - KBR Technology
- Related experience
- Ability to self-perform
construction
Global project delivery
focus organized with
regional accountability
Re-focus
Growth
Strategy
1 2
3 4
9
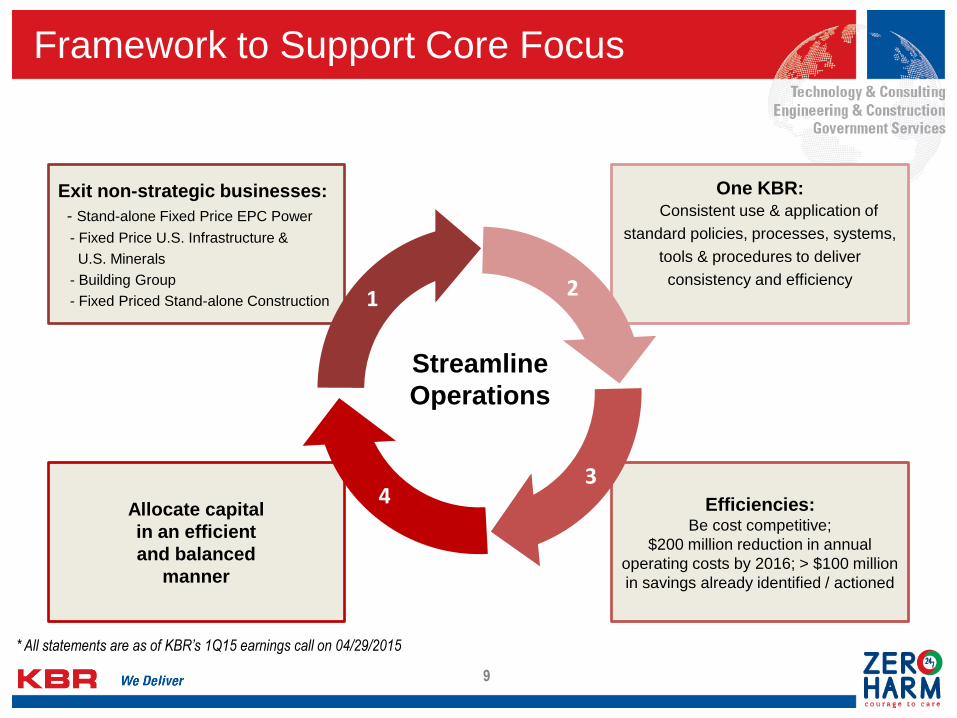
Framework to Support Core Focus
Exit non-strategic businesses:
- Stand-alone Fixed Price EPC Power
- Fixed Price U.S. Infrastructure &
U.S. Minerals
- Building Group
- Fixed Priced Stand-alone Construction
One KBR: Consistent use & application of
standard policies, processes, systems,
tools & procedures to deliver
consistency and efficiency
Allocate capital
in an efficient
and balanced
manner
Efficiencies: Be cost competitive;
$200 million reduction in annual
operating costs by 2016; > $100 million
in savings already identified / actioned
Streamline
Operations
1 2
3 4
* All statements are as of KBR’s 1Q15 earnings call on 04/29/2015
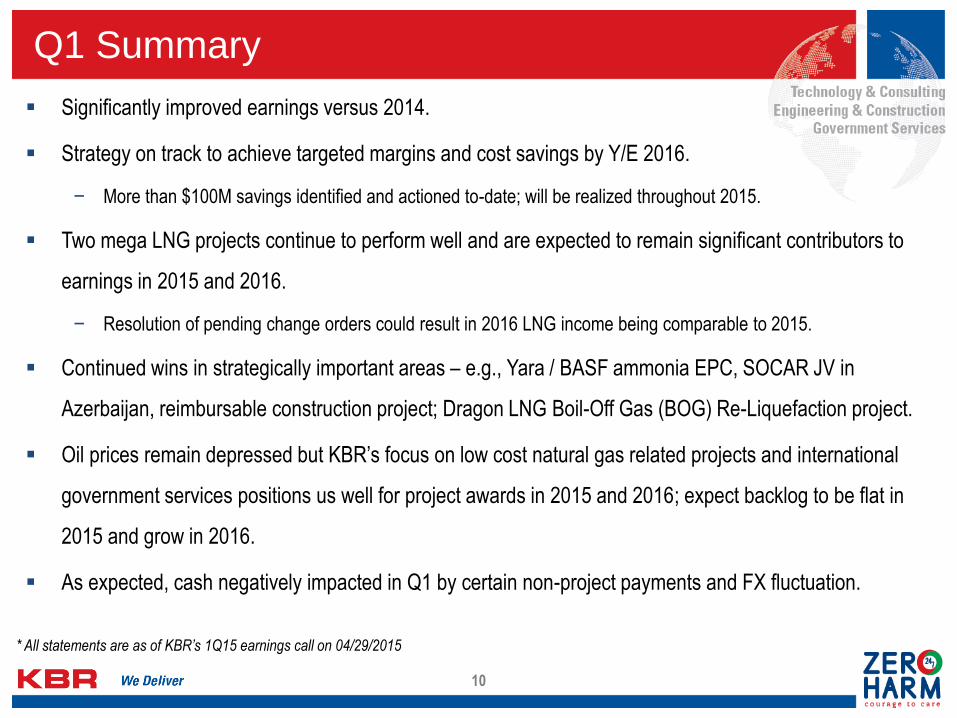
Significantly improved earnings versus 2014.
Strategy on track to achieve targeted margins and cost savings by Y/E 2016.
− More than $100M savings identified and actioned to-date; will be realized throughout 2015.
Two mega LNG projects continue to perform well and are expected to remain significant contributors to
earnings in 2015 and 2016.
− Resolution of pending change orders could result in 2016 LNG income being comparable to 2015.
Continued wins in strategically important areas – e.g., Yara / BASF ammonia EPC, SOCAR JV in
Azerbaijan, reimbursable construction project; Dragon LNG Boil-Off Gas (BOG) Re-Liquefaction project.
Oil prices remain depressed but KBR’s focus on low cost natural gas related projects and international
government services positions us well for project awards in 2015 and 2016; expect backlog to be flat in
2015 and grow in 2016.
As expected, cash negatively impacted in Q1 by certain non-project payments and FX fluctuation.
Q1 Summary
10
* All statements are as of KBR’s 1Q15 earnings call on 04/29/2015
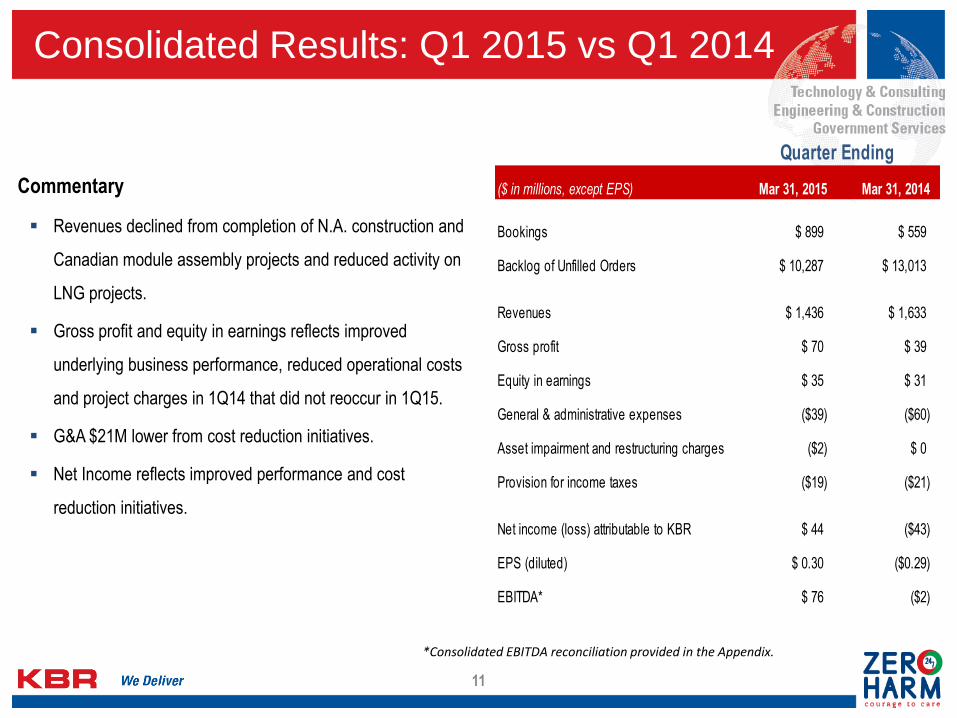
Consolidated Results: Q1 2015 vs Q1 2014
Commentary
Revenues declined from completion of N.A. construction and
Canadian module assembly projects and reduced activity on
LNG projects.
Gross profit and equity in earnings reflects improved
underlying business performance, reduced operational costs
and project charges in 1Q14 that did not reoccur in 1Q15.
G&A $21M lower from cost reduction initiatives.
Net Income reflects improved performance and cost
reduction initiatives.
11
*Consolidated EBITDA reconciliation provided in the Appendix.
($ in millions, except EPS) Mar 31, 2015 Mar 31, 2014
Bookings $ 899 $ 559
Backlog of Unfilled Orders $ 10,287 $ 13,013
Revenues $ 1,436 $ 1,633
Gross profit $ 70 $ 39
Equity in earnings $ 35 $ 31
General & administrative expenses ($39) ($60)
Asset impairment and restructuring charges ($2) $ 0
Provision for income taxes ($19) ($21)
Net income (loss) attributable to KBR $ 44 ($43)
EPS (diluted) $ 0.30 ($0.29)
EBITDA* $ 76 ($2)
Quarter Ending
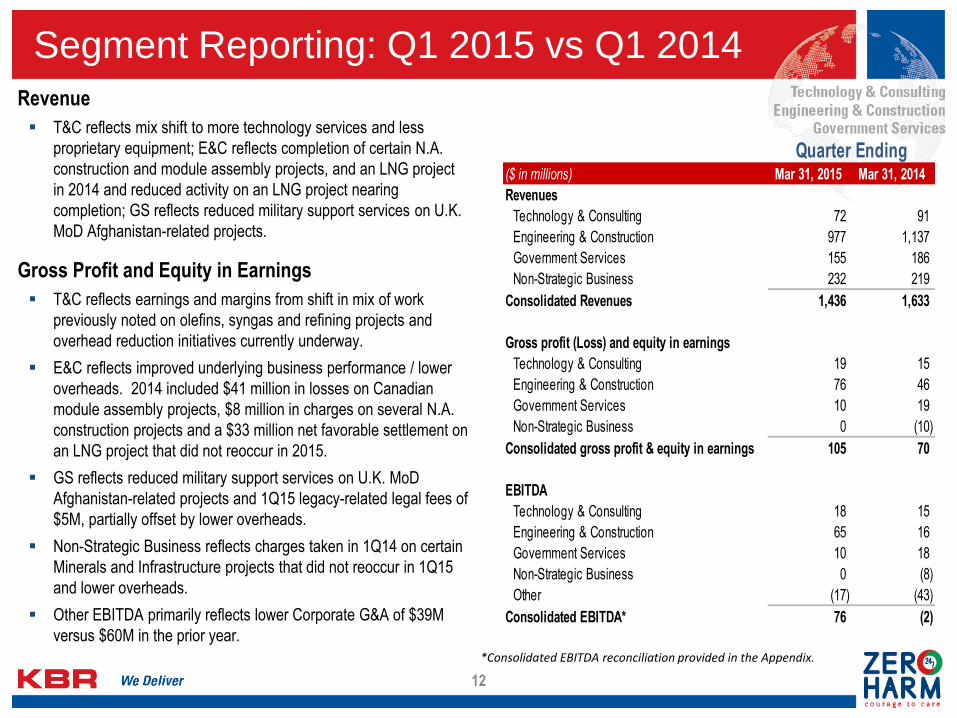
Segment Reporting: Q1 2015 vs Q1 2014
12
*Consolidated EBITDA reconciliation provided in the Appendix.
Revenue
T&C reflects mix shift to more technology services and less
proprietary equipment; E&C reflects completion of certain N.A.
construction and module assembly projects, and an LNG project
in 2014 and reduced activity on an LNG project nearing
completion; GS reflects reduced military support services on U.K.
MoD Afghanistan-related projects.
Gross Profit and Equity in Earnings
T&C reflects earnings and margins from shift in mix of work
previously noted on olefins, syngas and refining projects and
overhead reduction initiatives currently underway.
E&C reflects improved underlying business performance / lower
overheads. 2014 included $41 million in losses on Canadian
module assembly projects, $8 million in charges on several N.A.
construction projects and a $33 million net favorable settlement on
an LNG project that did not reoccur in 2015.
GS reflects reduced military support services on U.K. MoD
Afghanistan-related projects and 1Q15 legacy-related legal fees of
$5M, partially offset by lower overheads.
Non-Strategic Business reflects charges taken in 1Q14 on certain
Minerals and Infrastructure projects that did not reoccur in 1Q15
and lower overheads.
Other EBITDA primarily reflects lower Corporate G&A of $39M
versus $60M in the prior year.
($ in millions) Mar 31, 2015 Mar 31, 2014
Revenues
Technology & Consulting 72 91
Engineering & Construction 977 1,137
Government Services 155 186
Non-Strategic Business 232 219
Consolidated Revenues 1,436 1,633
Gross profit (Loss) and equity in earnings
Technology & Consulting 19 15
Engineering & Construction 76 46
Government Services 10 19
Non-Strategic Business 0 (10)
Consolidated gross profit & equity in earnings 105 70
EBITDA
Technology & Consulting 18 15
Engineering & Construction 65 16
Government Services 10 18
Non-Strategic Business 0 (8)
Other (17) (43)
Consolidated EBITDA* 76 (2)
Quarter Ending
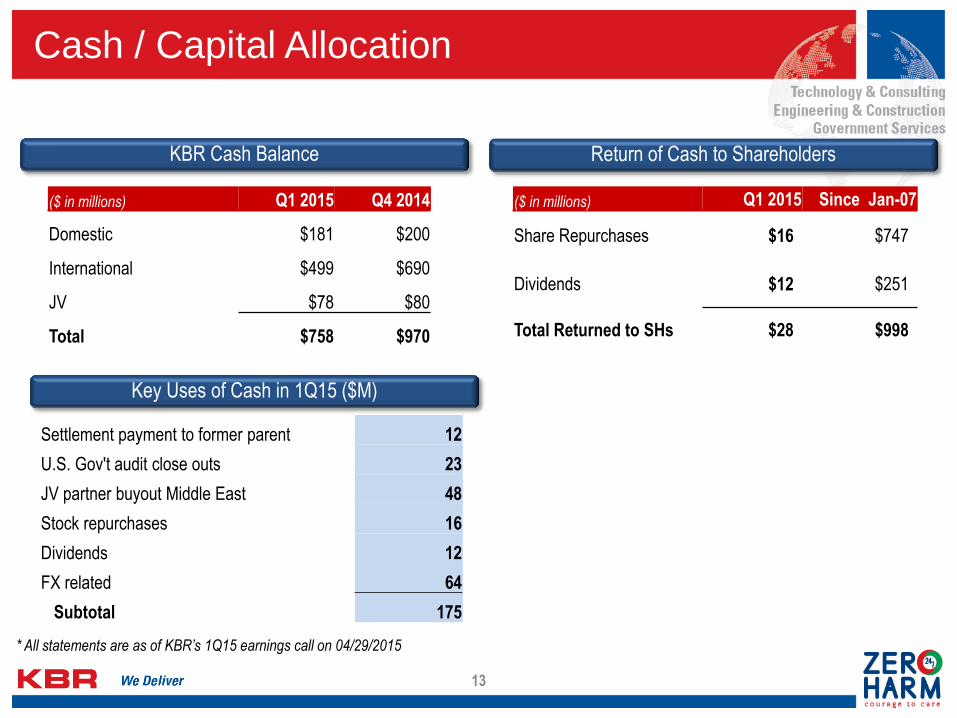
Cash / Capital Allocation
13
KBR Cash Balance Return of Cash to Shareholders
($ in millions) Q1 2015 Since Jan-07
Share Repurchases $16 $747
Dividends $12 $251
Total Returned to SHs $28 $998
($ in millions) Q1 2015 Q4 2014
Domestic $181 $200
International $499 $690
JV $78 $80
Total $758 $970
Key Uses of Cash in 1Q15 ($M)
Settlement payment to former parent 12
U.S. Gov't audit close outs 23
JV partner buyout Middle East 48
Stock repurchases 16
Dividends 12
FX related 64
Subtotal 175
* All statements are as of KBR’s 1Q15 earnings call on 04/29/2015
Market Outlook: Technology & Consulting
14
Technology market opportunities led by ammonia, refining, olefins & other chemicals –
received a significant order for license, basic engineering and pre-FEED work for a series
of ammonia plant revamps (Q2 award).
Award of Technical Services and EPC Pricing for potential appx. $2 billion ammonia/urea
complex in Mid-West USA.
Opportunities in China and elsewhere for VCC (Veba Combi-Cracker) technology and
converting heavy Hydrocarbons into lighter fuels, esp. diesel. Start-up of KBR’s VCC plant
in China has gone well. Several new VCC inquiries received.
Consulting opportunities in upstream E&P, onshore and offshore, midstream (gas
processing, transmission pipelines, terminals) and downstream (LNG, refining,
petrochemicals, fertilizers) albeit market is tight.
Continue to look for additional opportunities to expand T&C technology portfolio into new
products and services.
* All statements are as of KBR’s 1Q15 earnings call on 04/29/2015
Market Outlook: E&C
Q1 awards supporting strategic focus areas:
Yara / BASF grassroots ammonia complex, EPC award.
BG Alliance partnership award for front end project development.
Saudi Aramco - long term agreement for Offshore Oil & Gas Projects.
Major reimbursable construction services award.
EPCM award by Dragon LNG for Boil-Off Gas (BOG) Re-Liquefaction project.
Healthy base of large projects in backlog through 2015 & 2016:
Executing two mega-LNG projects – Gorgon and Ichthys.
Existing LNG projects expected to remain significant components of earnings in 2015 & 2016; resolution of
pending change orders could result in 2016 LNG income being comparable to 2015.
LNG prospects support backlog growth in 2016 and beyond.
Now executing four EPC ammonia/urea projects in North America utilizing KBR Technology, with two others under
pre-FEED stage.
15
* All statements are as of KBR’s 1Q15 earnings call on 04/29/2015
Market Outlook: E&C (Continued)
Good pipeline of near-term and long-term prospects:
Increased focus on Middle East opportunities (refining and petrochemicals).
Award of Technical Services and EPC Pricing for potential appx. $2 billion ammonia/urea complex in Mid-West USA.
Onshore upstream opportunities in Middle East & Caspian remain positive due to low cost to develop. JV with SOCAR – National
Oil Company of Azerbaijan also positions us well for offshore brownfield.
Offshore developments continue in GoM and West Africa. Additional offshore project opportunities for North Sea: Maersk
Culzean, UK, and Johan Sverdrup, Norway North Sea; Thailand, Qatar, & Indonesia.
Early work awarded (Offshore Oil & Gas) under the BG Global Alliance Agreement.
Major LNG developments in process:
• Continue to work on Shell Global LNG Agreement, with several assignments underway.
• KBR/JGC/Rekayasa JV continue FEED and EPC bid opportunity for Tangguh Train 3.
• KBR/SK JV services work commenced for Magnolia LNG on a medium scale sole-source LNG facility, leading to EPC
pricing in Q3.
• Pre-FEED work for a confidential LNG.
• FEED for Lloyds Energy on Black Sea LNG (nearshore FLNG facilities).
Bidding on 2 multi-billion USD LNG EPC contracts:
• Pacific Northwest bid in Q3 2014 – award date unclear.
• Tangguh LNG in Indonesia – award expected 2016.
• Lake Charles LNG – Technip/KBR JV not shortlisted as the JV was unwilling to accept unlimited fixed price construction risk
associated with the mechanical scope of work for a project of that magnitude on the U.S. Gulf Coast.
16
* All statements are as of KBR’s 1Q15 earnings call on 04/29/2015
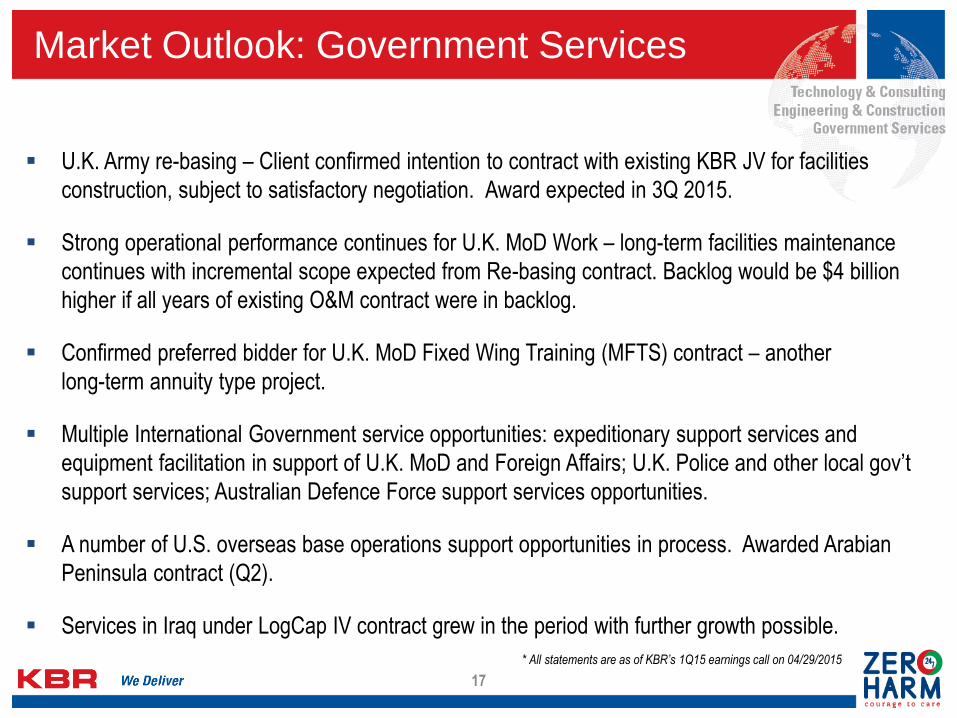
Market Outlook: Government Services
U.K. Army re-basing – Client confirmed intention to contract with existing KBR JV for facilities
construction, subject to satisfactory negotiation. Award expected in 3Q 2015.
Strong operational performance continues for U.K. MoD Work – long-term facilities maintenance
continues with incremental scope expected from Re-basing contract. Backlog would be $4 billion
higher if all years of existing O&M contract were in backlog.
Confirmed preferred bidder for U.K. MoD Fixed Wing Training (MFTS) contract – another
long-term annuity type project.
Multiple International Government service opportunities: expeditionary support services and
equipment facilitation in support of U.K. MoD and Foreign Affairs; U.K. Police and other local gov’t
support services; Australian Defence Force support services opportunities.
A number of U.S. overseas base operations support opportunities in process. Awarded Arabian
Peninsula contract (Q2).
Services in Iraq under LogCap IV contract grew in the period with further growth possible.
17
* All statements are as of KBR’s 1Q15 earnings call on 04/29/2015
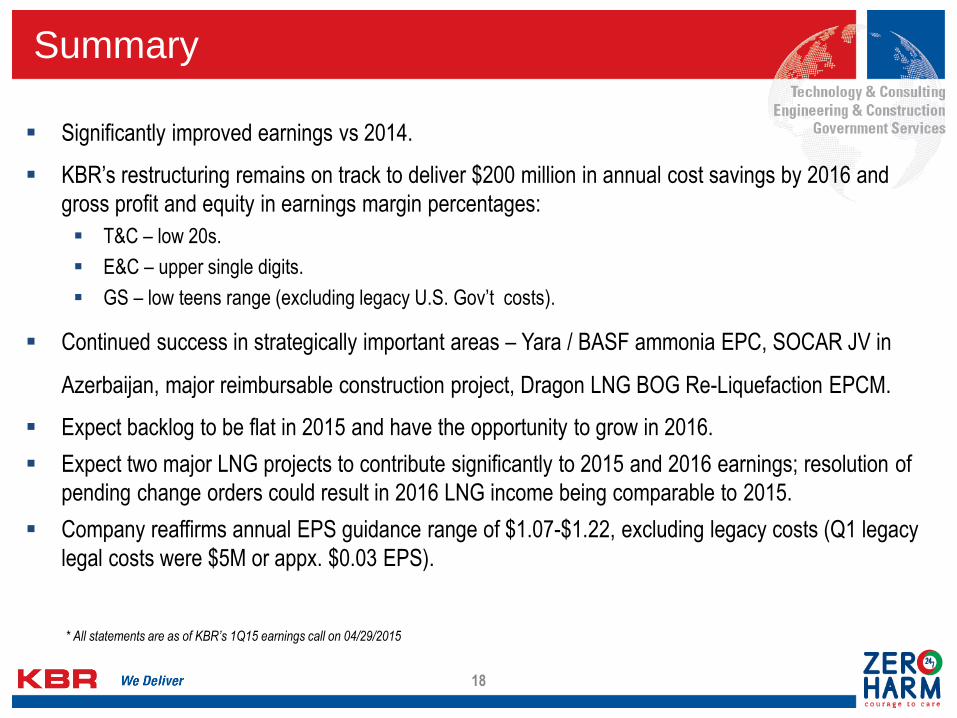
Summary
Significantly improved earnings vs 2014.
KBR’s restructuring remains on track to deliver $200 million in annual cost savings by 2016 and
gross profit and equity in earnings margin percentages:
T&C – low 20s.
E&C – upper single digits.
GS – low teens range (excluding legacy U.S. Gov’t costs).
Continued success in strategically important areas – Yara / BASF ammonia EPC, SOCAR JV in
Azerbaijan, major reimbursable construction project, Dragon LNG BOG Re-Liquefaction EPCM.
Expect backlog to be flat in 2015 and have the opportunity to grow in 2016.
Expect two major LNG projects to contribute significantly to 2015 and 2016 earnings; resolution of
pending change orders could result in 2016 LNG income being comparable to 2015.
Company reaffirms annual EPS guidance range of $1.07-$1.22, excluding legacy costs (Q1 legacy
legal costs were $5M or appx. $0.03 EPS).
18
* All statements are as of KBR’s 1Q15 earnings call on 04/29/2015
Appendix
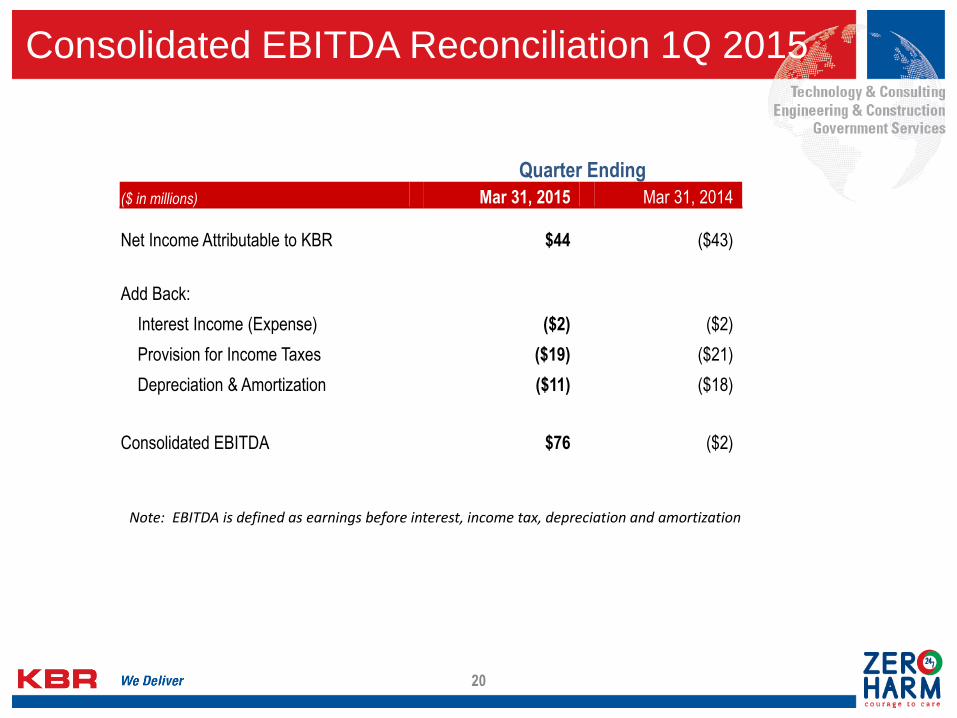
Consolidated EBITDA Reconciliation 1Q 2015
20
Note: EBITDA is defined as earnings before interest, income tax, depreciation and amortization
Quarter Ending
($ in millions) Mar 31, 2015 Mar 31, 2014
Net Income Attributable to KBR $44 ($43)
Add Back:
Interest Income (Expense) ($2) ($2)
Provision for Income Taxes ($19) ($21)
Depreciation & Amortization ($11) ($18)
Consolidated EBITDA $76 ($2)