investor relations overview - technip fmc
TRANSCRIPT

Investor Relations Overview
November 2020

Investor Relations Overview | 2
DisclaimerForward-looking statements
This communication contains “forward-looking statements” as defined in Section 27A of the United States Securities Act of 1933, as amended, and Section 21E of the United
States Securities Exchange Act of 1934, as amended. Words such as “guidance,” “confident,” “believe,” “expect,” “anticipate,” “plan,” “intend,” “foresee,” “should,” “would,” “could,”
“may,” “will,” “likely,” “predicated,” “estimate,” “outlook” and similar expressions are intended to identify forward-looking statements, which are generally not historical in nature.
Such forward-looking statements involve significant risks, uncertainties and assumptions that could cause actual results to differ materially from our historical experience and our
present expectations or projections, including the following known material factors: risks associated with disease outbreaks and other public health issues, including the
coronavirus disease 2019 (“COVID-19”), their impact on the global economy and the business of our company, customers, suppliers and other partners, changes in, and the
administration of, treaties, laws, and regulations, including in response to such issues and the potential for such issues to exacerbate other risks we face, including those related
to the factors listed or referenced below; risks associated with our ability to consummate our proposed separation and spin-off; unanticipated changes relating to competitive
factors in our industry; demand for our products and services, which is affected by changes in the price of, and demand for, crude oil and natural gas in domestic and international
markets; our ability to develop and implement new technologies and services, as well as our ability to protect and maintain critical intellectual property assets; potential liabilities
arising out of the installation or use of our products; cost overruns related to our fixed price contracts or capital asset construction projects that may affect revenues; our ability to
timely deliver our backlog and its effect on our future sales, profitability, and our relationships with our customers; our reliance on subcontractors, suppliers and joint venture
partners in the performance of our contracts; our ability to hire and retain key personnel; piracy risks for our maritime employees and assets; the potential impacts of seasonal and
weather conditions; the cumulative loss of major contracts or alliances; U.S. and international laws and regulations, including existing or future environmental regulations, that may
increase our costs, limit the demand for our products and services or restrict our operations; disruptions in the political, regulatory, economic and social conditions of the countries
in which we conduct business; risks associated with The Depository Trust Company and Euroclear for clearance services for shares traded on the NYSE and Euronext Paris,
respectively; the United Kingdom’s withdrawal from the European Union; risks associated with being an English public limited company, including the need for “distributable
profits”, shareholder approval of certain capital structure decisions, and the risk that we may not be able to pay dividends or repurchase shares in accordance with our announced
capital allocation plan; compliance with covenants under our debt instruments and conditions in the credit markets; downgrade in the ratings of our debt could restrict our ability to
access the debt capital markets; the outcome of uninsured claims and litigation against us; the risks of currency exchange rate fluctuations associated with our international
operations; risks related to our acquisition and divestiture activities; failure of our information technology infrastructure or any significant breach of security, including related to
cyber attacks, and actual or perceived failure to comply with data security and privacy obligations; risks associated with tax liabilities, changes in U.S. federal or international tax
laws or interpretations to which they are subject; and such other risk factors as set forth in our filings with the U.S. Securities and Exchange Commission and in our filings with the
Autorité des marchés financiers or the U.K. Financial Conduct Authority.
We caution you not to place undue reliance on any forward-looking statements, which speak only as of the date hereof. We undertake no obligation to publicly update or revise
any of our forward-looking statements after the date they are made, whether as a result of new information, future events or otherwise, except to the extent required by law.

Contents
1 Q3 2020 Financial and operational highlights
2 Company overview

Section 1:
Q3 2020 Financial and operational highlights

Investor Relations Overview | 5
Strong third quarter results
45% sequential growth in total
Company inbound orders
New project activity continues
despite challenging environment
Sequential improvement
across all business segments
Reflects stronger operational
performance and greater
benefit of cost savings
Reaffirming full year 2020 guidance
Winning Executing Transforming
$2.2B Inbound orders
9.6%Adjusted EBITDA1 margin
100%Targeted savings achieved
1Adjusted EBITDA is a non-GAAP measure. Adjusted EBITDA as presented excludes the impact of charges and credits from continuing operations as identified in the reconciliation of GAAP to non-GAAP
financial schedules included in the appendix.
Early achievement of $350+
million in run-rate savings
Business model, innovative
technologies and digital
solutions to drive further gains

Investor Relations Overview | 6
Resilient award activity
Payara
Mero 2
Assiut Hydrocracking complex1
Breidablikk2
Moerdijk plant modernization
5-year frame agreement
for products and services
High-specification gas
equipment and services
6 projects announced globally; $2.8 billion
aggregate contract value1
Middle East growth opportunities; leveraging
international strength of Surface Technologies
Subsea orders of $1.6 billion; confident in
full-year order outlook of $4 billion
Subsea front-end engineering activity trending
above expectations; 50% focused on iFEED™
Subsea award
Technip Energies award
Surface Technologies awardQ3 award highlights
1The Company is working with ANOPC to complete the remaining conditions precedent to enable project work to commence and will include the contract award in its inbound when all the requirements are fulfilled.2Inbound order was included in the Company’s first half 2020 results.
iEPCI™ in Malaysia

Investor Relations Overview | 7
Accelerating our digital transformation
Subsea Studio™ iComplete™
Creating value for our clients and TechnipFMC throughout the project lifecycle
Transforming conventional concept, FEED and tendering
phases into ultra-fast digital field development
Built using open digital architecture and fully integrated
with our suite of latest products and technologies
Integrated completions pad provides simplification and
greater efficiency, with digital automation and controls
Digital integration enables operators to make evidenced-
based decision throughout the process
Up to
50% Reduction in
FEED cycle
70%FEED studies
hosted on platform
50%Fewer
components
30%Reduction in
operating expenditures
Investor Relations Overview | 8
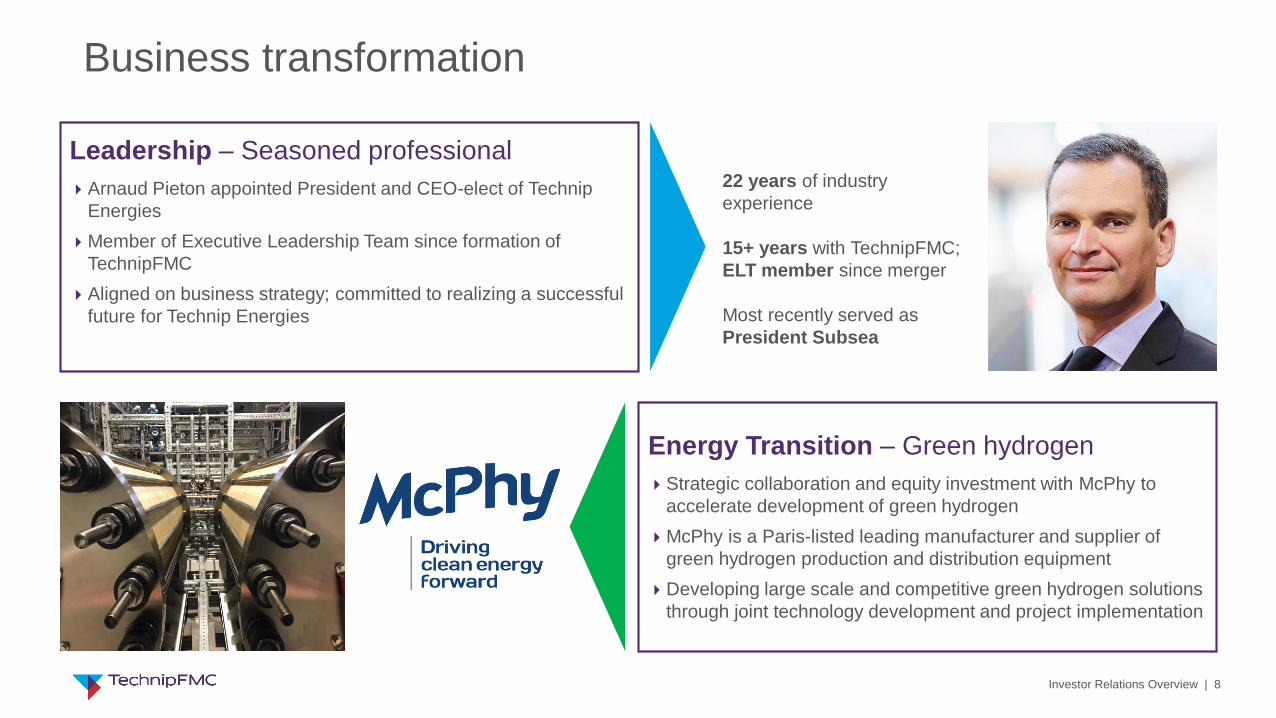
Business transformation
Leadership – Seasoned professional
Arnaud Pieton appointed President and CEO-elect of Technip
Energies
Member of Executive Leadership Team since formation of
TechnipFMC
Aligned on business strategy; committed to realizing a successful
future for Technip Energies
Energy Transition – Green hydrogen
Strategic collaboration and equity investment with McPhy to
accelerate development of green hydrogen
McPhy is a Paris-listed leading manufacturer and supplier of
green hydrogen production and distribution equipment
Developing large scale and competitive green hydrogen solutions
through joint technology development and project implementation
22 years of industry
experience
15+ years with TechnipFMC;
ELT member since merger
Most recently served as
President Subsea

Investor Relations Overview | 9
Company does not provide guidance for F/X or MRL which
together unfavorably impacted results by $0.12 per share
Revenue of $3.3 billion
Adjusted EBITDA of $321 million
Free cash flow of $95 million
Backlog of $19.6 billion
Q3 2020 EPS walk
Cash flow from operations of $168 million, free cash flow of $95 million in the quarter
Achieved full-year targeted run-rate savings of more than $350 million, ahead of schedule
Adjusted EBITDA improved sequentially across all segments, driven by strong project execution and cost reduction activities
Key highlights
1MRL = Mandatorily redeemable financial liability
Q3 2020 Company results
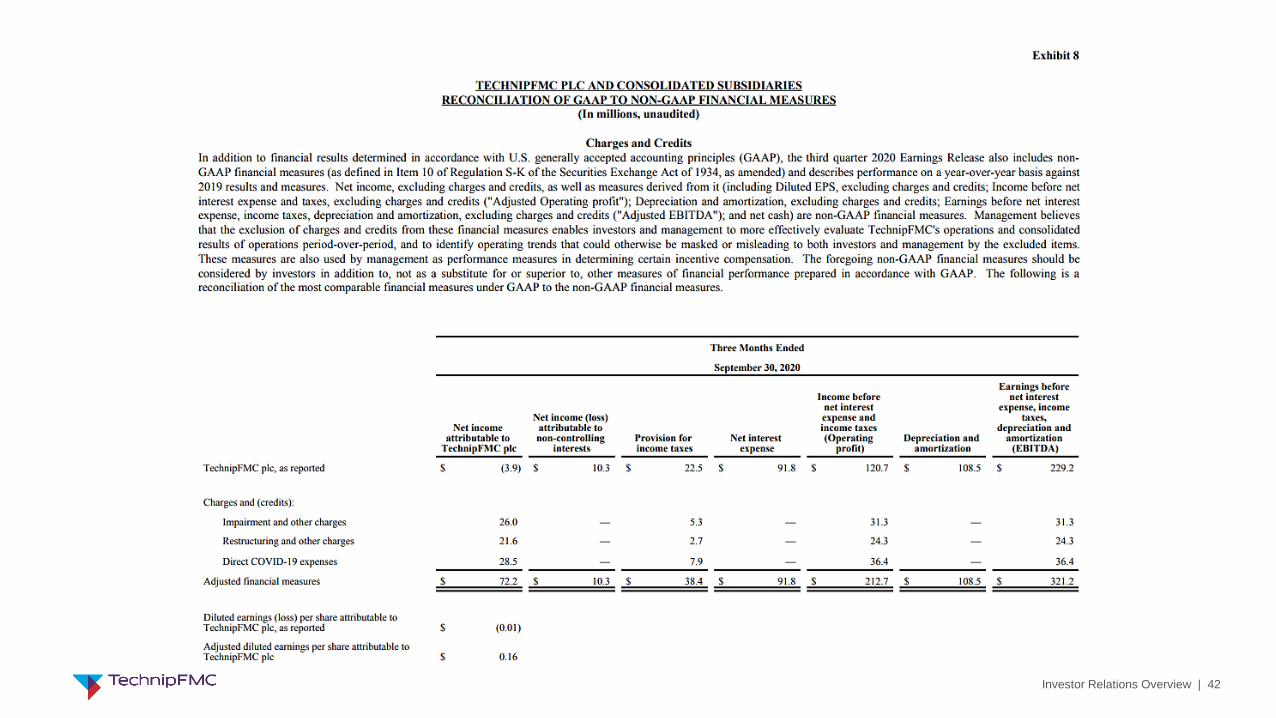
GAAP net income, as reported (3.9)$ (0.01)$
Charges and credits, after-tax 76.1$ 0.17$
Adjusted net income, as reported 72.2$ 0.16$
Other items impacting results:
Foreign exchange (F/X) gains, after-tax (7.0)$ (0.02)$
Increased liability payable to JV partners (MRL1) 61.9$ 0.14$
$ millions $ / share

Investor Relations Overview | 10
397
226
Revenue
3Q19 3Q20
1,596 1,608
Revenue
3Q19 3Q20
1,342
1,502
Revenue
3Q19 3Q20
10.4% 9.7%
Adjusted EBITDA margin
19.1%
10.9%
Adjusted EBITDA margin
11.2%
7.7%
Adjusted EBITDA margin
Q3 2020 Segment results
Subsea
+12%
USD, in millions
Operational highlights
Revenue increased 12%: driven by continued strong execution of our backlog; project activity was most significant in the United States, Norway and Africa
Adjusted EBITDA margin decreased 70 bps to 9.7%: higher activity and the benefits of our cost reduction initiatives were partially offset by the COVID-19 related inefficiencies
Inbound orders of $1.6 billion; book-to-bill of 1.1; period-end backlog at $7.2 billion
Technip Energies Surface Technologies
Operational highlights
Revenue increased 1%: benefited from the continued ramp-up of Arctic LNG 2 and higher activity on downstream projects, offsetting the anticipated decline in revenue from Yamal LNG
Adjusted EBITDA margin decreased 820 bps to 10.9%: reduced contribution from Yamal LNG and lower margin realization on early phase projects, including Arctic LNG 2
Inbound orders of $413 million; book-to-bill of 0.3; period-end backlog at $12.1 billion
Operational highlights
Revenue decreased 43%: sharp reduction in operator activity in North America; revenue outside of North America displayed resilience, with a more modest decline
Adjusted EBITDA margin decreased 350 bps to 7.7%: lower activity in North America driven by decline in rig count and completions-related activity, partially offset by cost reduction actions
Inbound orders of $208 million; book-to-bill of 0.9; period-end backlog at $369 million
USD, in millions USD, in millions
-70 bps +1% -820 bps -43% -350 bps

Investor Relations Overview | 11
4,809.54,904.5
4,121.3
73783
4,810
168
122 4,244
Q3 2020 cash flow
Q3 2020 Cash flow walk
Positive free cash flow of $95 million
▪ Increased $283 million sequentially; maintain
full-year guidance of neutral to $150 million
Capital expenditures of $73 million
▪ Decreased $21 million sequentially; maintain
full-year guidance of $300 million
Net cash increased $81 million
▪ Increased net cash position to $384 million
sequentially; includes significant debt reduction
Q3 2020 Items of note
Cash & cash
equivalents at
Jun 30, 2020
Cash flow
from
operating
activities
Decreased
borrowings
All other
(incl. FX)
Cash & cash
equivalents at
Sep 30, 2020
Capital
expenditures
(in $ millions)
Positive free cash flow
$95 million-$56
-$188
$95
-$200
-$100
$0
$100
$200
$300
1Q20 2Q20 3Q20 4Q20e
$149 - $299
2020e Free Cash Flow ($M)
Debt reduced by
$647 million
when including impacts
of amortization and
foreign exchange
Investor Relations Overview | 12
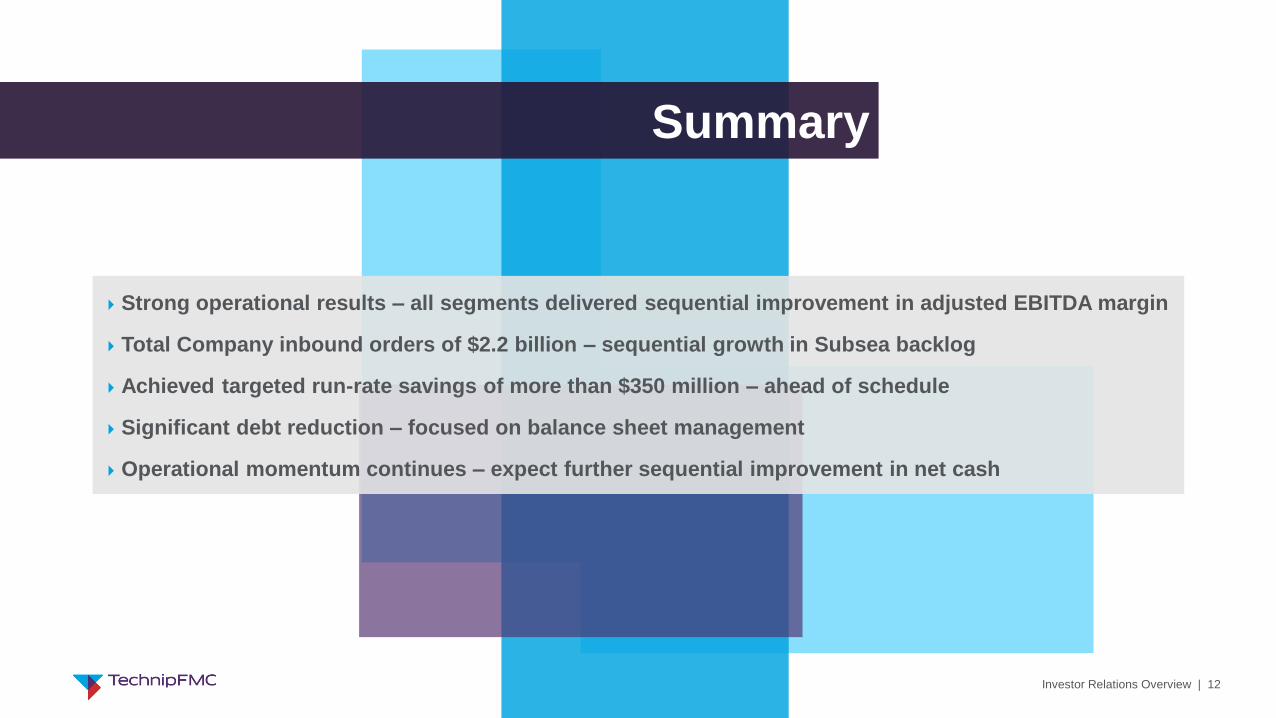
Summary
Strong operational results – all segments delivered sequential improvement in adjusted EBITDA margin
Total Company inbound orders of $2.2 billion – sequential growth in Subsea backlog
Achieved targeted run-rate savings of more than $350 million – ahead of schedule
Significant debt reduction – focused on balance sheet management
Operational momentum continues – expect further sequential improvement in net cash

Investor Relations Overview | 13
Section 2:
Company overview

Investor Relations Overview | 14
TechnipFMC snapshot
1Integrated solutions
provider for the oil and
gas industry
2Stock exchange
listings – NYSE
and Euronext Paris
>75%Total company revenue
outside of U.S.1
$13BTotal company
revenue2
$20BTotal company
backlog3
$4BTotal company cash
balance4
1 Trailing four quarters revenue as of September 30, 2020. Source: FTI Internal analysis.2 Trailing four quarters revenue as of September 30, 2020. Source: Form 10-Q filed on November 2, 2020; Form 10-K filed on March 3, 2020; Form 10-Q filed on November 12, 2019.3 Backlog as of September 30, 2020; Source: Form 10-Q filed on November 2, 2020.4 Cash and cash equivalents as of September 30, 2020; Source: Form 10-Q filed on November 2, 2020.

Investor Relations Overview | 15
SUBSEA
TECHNIP ENERGIES
SURFACE TECHNOLOGIES
Broadest portfolio of solutions for the oil & gas industry
▪ Products and systems used in deepwater exploration and production
of crude oil and natural gas
▪ Systems used to control the flow of crude oil and natural gas from the
reservoir to a host processing facility
▪ Integrated design, engineering, manufacturing and installation
services for infrastructure and subsea pipe systems
▪ Onshore facilities related to the production, treatment and
transportation of crude oil and natural gas, as well as transformation
of petrochemicals such as ethylene, polymers and fertilizers
▪ Combines engineering, procurement, construction and project
management within the entire range of fixed and floating offshore
crude oil and natural gas facilities
▪ Products and systems used in offshore exploration and
production of crude oil and natural gas
▪ Wellhead systems and high pressure valves and pumps
used in stimulation activities for oilfield service companies
▪ Full range of drilling, completion and production wellhead
systems

Investor Relations Overview | 16
Portfolio leverage to major energy platforms
>20%
Global production
delivered
World’s largest LNG
trains delivered
Subsea UnconventionalLNG
Of operating LNG
capacity1
Product
reliability
Integrated
offering
Leading positions in
several products
$1m savings per well;
unique growth platform
TechnologyExtending asset life
and improving returns
Transforming subsea
project economics
A growth engine
Subsea 2.0™
Revolutionary product
platform – simpler,
leaner, smarter
iEPCI™
iLoF™
7.8Mtpa
>105Mtpa
1 Percentage is based on 88.0 / 382.2 Mtpa (million metric tons per annum) of TechnipFMC / industry operating capacity as of December 31, 2018; source: IHS, TechnipFMC.

Investor Relations Overview | 17
Subsea competitive strengths
Market leading positions built
upon innovation and deep
industry knowledge
Differentiated offering of
integrated products, services:
iFEED™, iEPCI™ and iLoF™
Technology advancements to
drive greater efficiency and
simplification
FEED StudiesSubsea Production
SystemsFlexibles Umbilicals Installation iEPCITM Field Services

Investor Relations Overview | 18
34%
27%
39%
SPS / SURF - critical components of offshore development
Source: Morgan Stanley Research, TechnipFMC Internal Analysis Source: Wood Mackenzie, March 2020
Strong history of subsea tree orders
SPS / SURF is one of the largest
components of project costs
Subsea tree orders by region 2006-2019 (trees)
Brazil
All other regions
SPS / SURF
FPSO / Platform
Drilling / Well
Construction
Oil & gas industry has strong history
of subsea tree orders
0
100
200
300
400
500
600
2006 2007 2008 2009 2010 2011 2012 2013 2014 2015 2016 2017 2018 2019
462 452432
319
375
314
413
232
153
83
551
205
325281

Investor Relations Overview | 19
Improving project economics for deepwater projects
More than 400 deepwater discoveries
have yet to be developed
Good progress on deepwater cost
reductions with potential for additional
savings
Standardization, technology
and strong project execution can
deliver sustainable savings
Integrated business model
can reduce costs of SPS/SURF scope0
100
200
300
400
500
Historical costs Costs (-20%)
$20-40 $40-60 $60-80 $80-100 > $100
410 Projects
+40% to 60%
Source: Wood Mackenzie, Rystad

Investor Relations Overview | 20
Subsea offers a full suite of capabilities
Maximized
reliability
and uptime
Increased
aftermarket
capabilities
Improved
performance over
the life of field
Project ExecutionLife-of-Field
and Maintenance
Joint SPS+SURF R&D
for improved technology
application and
combination
Shortened time to first
oil and offshore
installation through
better planning
Reduced project
interfaces and
contingencies
Strengthen leverage
on procurement
Unique asset
and
technological
capabilities
Best possible
line-up to
undertake client
challenges
Rationalized subsea
architecture
and design
Optimized technology
applications
Improved field performance
Conceptual Design
& FEED1
1 Genesis Oil & Gas Consultants TechnipFMC
Engineering Procurement Equipment
supplyConstruction Installation
iFEED™ is an enabler iEPCI™ is a differentiatoriLoF™ is a growth engine

Investor Relations Overview | 21
Subsea – integrated approach redefining subsea project economics
Traditional approach
A field design incorporating Subsea 2.0™ and iEPCI™ can remove over
half of the subsea structures while maintaining the same field operability
Subsea 2.0™ an enabler to iEPCI™
Reduced material costs
Simplified equipment set-up
Optimized flow assurance
Reduced installation phase
Accelerated time to first oil
Key benefits
One global contractor
Integrated procurement
Optimized subsea architecture
Fewer subsea production system interfaces
Reduced flowline and riser lengths
Less complexity through reduced part counts
Enhancements

Investor Relations Overview | 22
Subsea – making subsea short-cycle with Subsea 2.0™ + iEPCI™
TechnipFMC is changing the subsea paradigm from a long-cycle to a short-cycle business,
using Subsea 2.0™ and a truly integrated approach (iEPCI™) to field development
Subsea 2.0™
iEPCI™6 monthschedulereduction
Break-even price
<$30/bblShell Kaikias

Investor Relations Overview | 23
Investor Relations Overview | 23
iEPCI™ – The industry standard
• iFEED™ conversion drives iEPCI™ momentum
• iEPCI™ >40% of TechnipFMC Subsea orders in 2019
• Expanding the iEPCI™ reach with new customers and alliances
$3B+iEPCI™
projects awarded
in 2019
6Repeat
iEPCI™
customers
5New
iEPCI™
alliances
iEPCI™ is a structural transformation iEPCI™ acceleration
• Widespread adoption of integrated model across regions and clients
• Integrated awards a growing proportion of Subsea order inbound
• iEPCI™ provides a differentiated growth engine for TechnipFMC
0%
20%
40%
60%
$0
$1
$2
$3
$4
2016 2017 2018 2019
iEPCI™ award value ($B) iEPCI™ % of FTI Subsea orders

Investor Relations Overview | 24
Investor Relations Overview | 24
Unique drivers of revenue growth
Subsea Services Alliance partners
• Long-term, mutually beneficial relationships
• iEPCI™ alliances utilize full integrated offering
• Exclusive alliances result in direct awards
• Diversified revenue base of approximately $1 billion
• Resilient, margin-accretive aftermarket services
• Service potential on ~50% of subsea installed base

Investor Relations Overview | 25
Investor Relations Overview | 25
Technology leadership
Using differentiated technologies to
bring significant additional value as
part of an integrated system
Applying Subsea digital and
automation technologies to transform
Surface Technologies
Utilizing mechatronics to transform
subsea production system via robotic
and mechanical systems integration
Integration technologies Digital and automation Robotics
Subsea 2.0™
iProduction™
Precision robotics for ROV
Subsea mechatronics
NextGensubsea controls
Surface production automation
Investor Relations Overview | 26
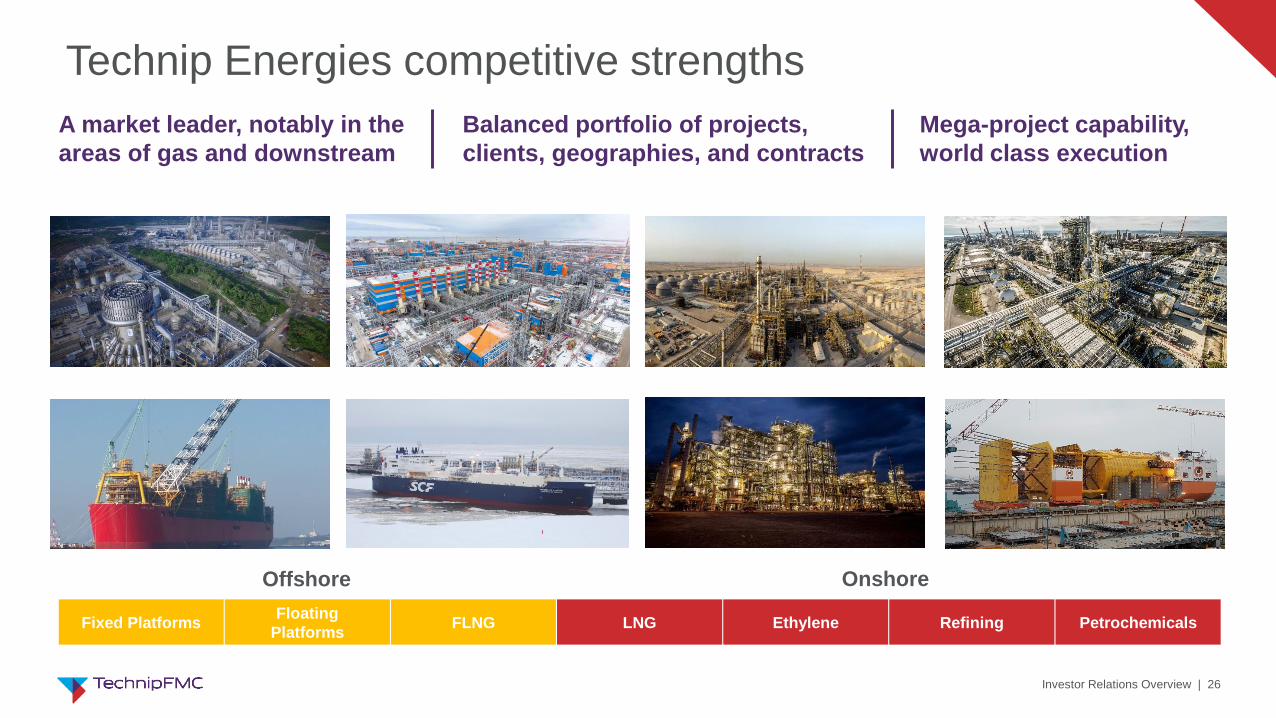
Technip Energies competitive strengths
Balanced portfolio of projects,
clients, geographies, and contracts
Fixed PlatformsFloating
PlatformsFLNG
A market leader, notably in the
areas of gas and downstream
Mega-project capability,
world class execution
LNG Ethylene Refining Petrochemicals
Offshore Onshore
Investor Relations Overview | 27
Investor Relations Overview | 27
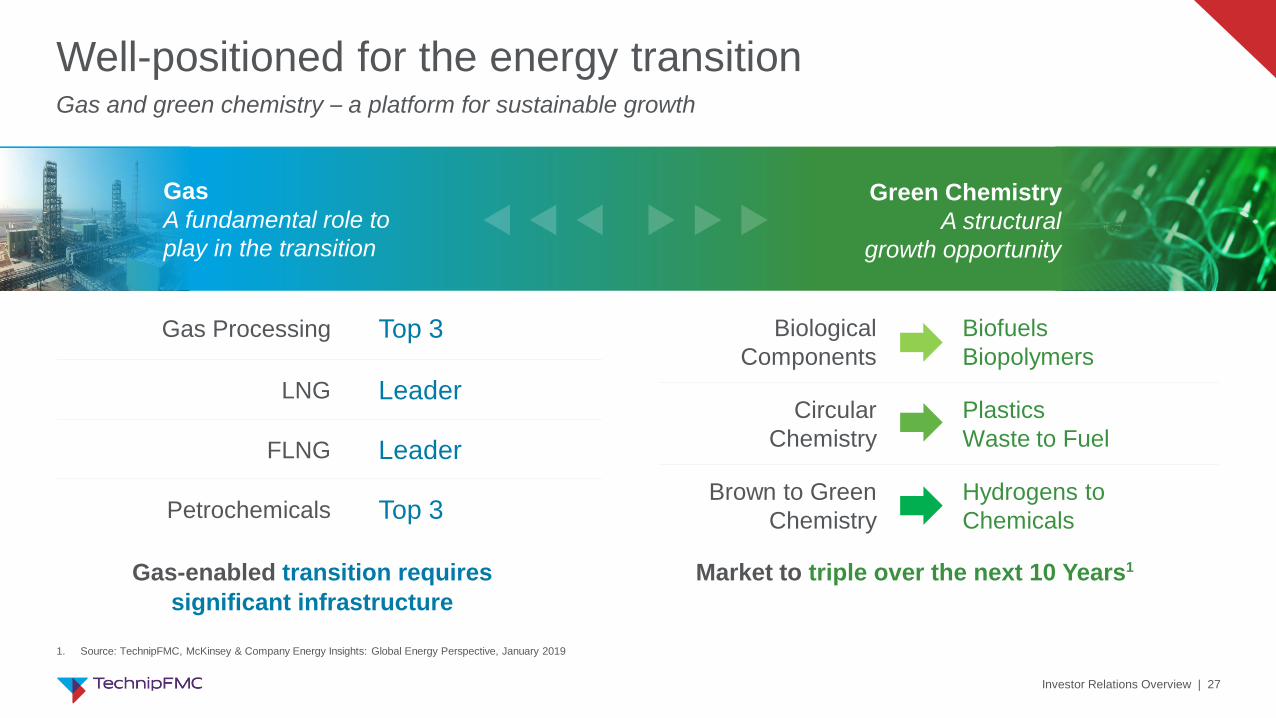
Biological
Components
Biofuels
Biopolymers
Circular
Chemistry
Plastics
Waste to Fuel
Brown to Green
Chemistry
Hydrogens to
Chemicals
Well-positioned for the energy transitionGas and green chemistry – a platform for sustainable growth
Gas-enabled transition requires
significant infrastructure
Market to triple over the next 10 Years1
Gas Processing Top 3
LNG Leader
FLNG Leader
Petrochemicals Top 3
Gas
A fundamental role to
play in the transition
Green Chemistry
A structural
growth opportunity
1. Source: TechnipFMC, McKinsey & Company Energy Insights: Global Energy Perspective, January 2019
Investor Relations Overview | 28
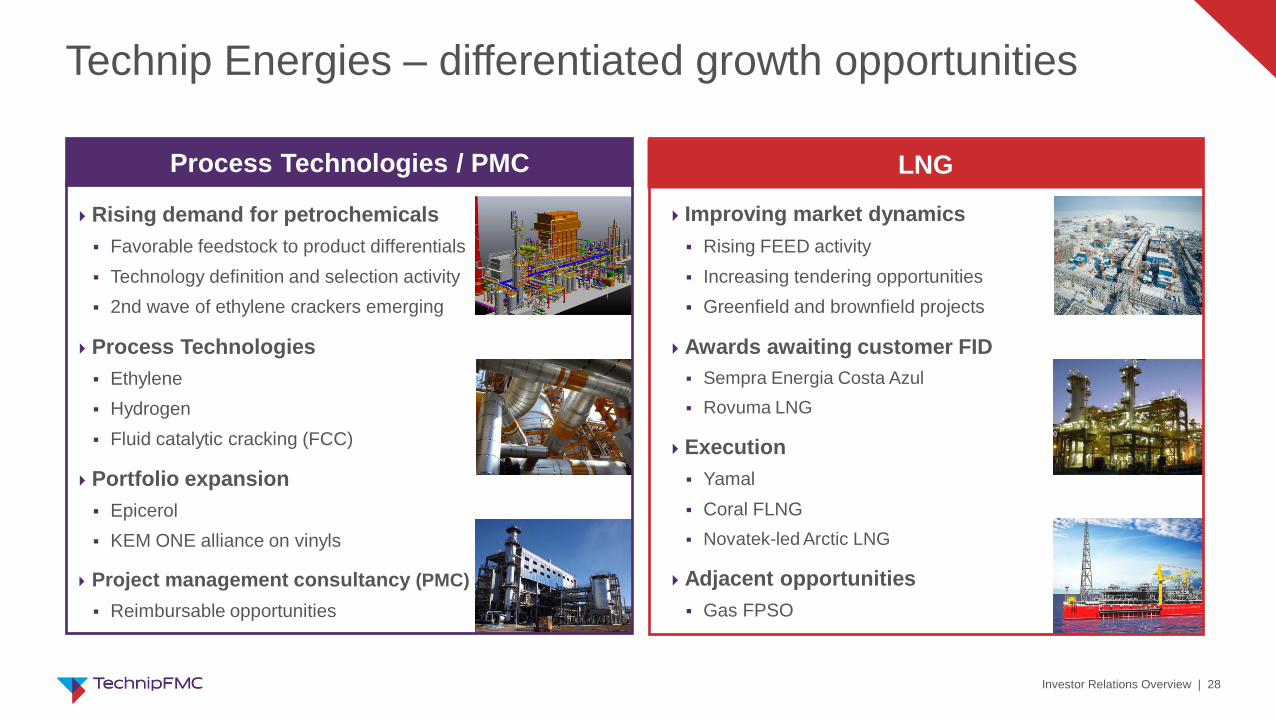
Technip Energies – differentiated growth opportunities
Process Technologies / PMC
Rising demand for petrochemicals
▪ Favorable feedstock to product differentials
▪ Technology definition and selection activity
▪ 2nd wave of ethylene crackers emerging
Process Technologies
▪ Ethylene
▪ Hydrogen
▪ Fluid catalytic cracking (FCC)
Portfolio expansion
▪ Epicerol
▪ KEM ONE alliance on vinyls
Project management consultancy (PMC)
▪ Reimbursable opportunities
LNG
Improving market dynamics
▪ Rising FEED activity
▪ Increasing tendering opportunities
▪ Greenfield and brownfield projects
Awards awaiting customer FID
▪ Sempra Energia Costa Azul
▪ Rovuma LNG
Execution
▪ Yamal
▪ Coral FLNG
▪ Novatek-led Arctic LNG
Adjacent opportunities
▪ Gas FPSO

Investor Relations Overview | 29
Investor Relations Overview | 29
50 year track record in LNG
• World’s first LNG Algeria (1964)
• World’s largest LNG trains Qatar
• Largest Arctic project Yamal
Pioneer in floating LNG (FLNG)
• World’s first FLNG delivered Petronas Satu in Malaysia
• World’s largest floating vessel Shell Prelude in Australia
• New frontier Eni Coral in Mozambique
Pioneer in modularization
• Onshore LNG trains on an unprecedented scale
• Greater cost and schedule certainty in extreme locations
105Mtpa
Global production
delivered
>20%
Of operating LNG
capacity
7.8Mtpa
World’s largest
LNG trains
delivered
Growth potential driven by LNG market leadership
Market leadership Diversity in projects and technologies
Next generation mid-scale LNG
• Economic solutions for smaller reserves (1-3 Mtpa)
• Standardized, modularized design enables repeatability
Pioneer in next generation FLNG
• Liquefaction engineered for minimal footprint
• Split construction to minimize module integration

Investor Relations Overview | 30
Investor Relations Overview | 30
A diversified pure-play with extensive capabilities
Projects• LNG
• Floating LNG
• Fixed and
floating platforms
Services• Feasibility studies
• Consulting
• Project management consultancy
Process Technology• Ethylene
• Hydrogen
• Oil refining
Products• Cryogenic loading arms
• Reformers, heat exchangers
• Furnaces
• Gas monetization
• Refining
• Ethylene,
petrochemicals
• Petrochemicals, polymers
• Gas monetization
• Renewables

Investor Relations Overview | 31
Surface Technologies competitive strengths
Stimulation, Flowback and Pumps
Leading market positions in
several niche product offerings
Drilling Completion Production Midstream
Wellhead Flowline
Delivering technology that
extends asset life, improves
returns
Integrated offering delivers up
to $1m in savings per well,
creates unique growth platform

Investor Relations Overview | 32
Subsea products
‣ Trees, manifolds, control, templates,
flowline systems, umbilicals & flexibles
‣ Subsea processing
‣ ROVs and manipulator systems
Subsea projects
‣ Field architecture, integrated design
‣ Engineering, procurement
Subsea services
‣ Drilling systems
‣ Installation using high-end fleet
‣ Asset management & production
optimization
‣ Field IMR and well services
Project management, proprietary
technology, equipment and early studies
to detailed design
‣ Offshore
Fixed platforms (jackets, self-elevating
platforms, GBS, artificial islands) and
floating facilities (FPSO, semi
submersibles, Spar, TLP, FLNG)
‣ Onshore
Gas monetization, refining,
petrochemicals, onshore pipelines,
furnaces, mining and metals
‣ Services
Project management consultancy,
process technologies, front-end
‣ Drilling, completion and production
wellhead equipment, chokes, compact
valves, manifolds and controls
‣ Treating iron, manifolds, and
reciprocating pumps for stimulation
and cementing
‣ Advanced separation and flow-
treatment systems
‣ Flow metering products and systems
‣ Installation and maintenance services
‣ Frac-stack and manifold rental and
operation services
‣ Flowback and well testing services
A unique global leader in oil and gas projects, technologies, systems and services
Comprehensive offering – from concept to project delivery and beyond
Subsea Technip Energies Surface Technologies

Appendix

Investor Relations Overview | 34
Glossary
Term Definition
Bcm Billion Cubic Meters per Annum
CAGR Compound Annual Growth Rate
E&C Engineering and Construction
FID Final Investment Decision
FLNG Floating LNG
F/X Foreign exchange
GOM Gulf of Mexico
HP/HT High Pressure / High Temperature
HSE Health, Safety and Environment
iEPCI™ Integrated Engineering, Procurement, Construction and
Installation
iFEED™ Integrated Front End Engineering and Design
iLOF™ Integrated Life of Field
LNG Liquefied Natural Gas
Term Definition
MMb/d Million Barrels per Day
MRL Mandatorily redeemable financial liability
Mtpa Million Metric Tonnes per Annum
NAM North America
RCF Revolving credit facility
ROIC Return on Invested Capital
ROV Remotely Operated Vehicles
ROW Rest of World

Investor Relations Overview | 35
Revenue in a range of $6.3–6.8 billion
EBITDA margin at least 10% (excluding charges and credits)
Revenue in a range of $950–1,150 million
EBITDA margin at least 5.5% (excluding charges and credits)
Revenue in a range of $5.3–5.6 billion
EBITDA margin at least 8.5% (excluding charges and credits)
Subsea Technip Energies Surface Technologies
Corporate expense, net $130 – 150 million
Net interest expense $80 – 90 million
(excluding the impact of revaluation of partners’ mandatorily redeemable financial liability)
Tax provision, as reported $80 – 90 million
Capital expenditures approximately $300 million
Free cash flow $0 – 150 million
(cash flow from operations less capital expenditures)
TechnipFMC
1Our guidance measures EBITDA margin (excluding amortization related impact of purchase price accounting, and other charges and credits), corporate expense, net, net interest expense (excluding the impact of
revaluation of partners’ mandatorily redeemable financial liability), and free cash flow are non-GAAP financial measures. We are unable to provide a reconciliation to a comparable GAAP measure on a forward-
looking basis without unreasonable effort because of the unpredictability of the individual components of the most directly comparable GAAP financial measure and the variability of items excluded from such
measure. Such information may have a significant, and potentially unpredictable, impact on our future financial results.
2020 Full-year financial guidance1 Updated October 21, 2020
2020 segment guidance is reflective of new business perimeters previously announced in 2019.
Businesses with ~$120 million of revenue in 2019, most of which was in Surface Technologies, are now included in Technip Energies guidance for 2020.
All segment guidance assumes no further material degradation from COVID-19 related impacts

Investor Relations Overview | 36
Subsea opportunities in the next 24 months1
Added
PROJECT UPDATES
Removed
PETROBRAS
Mero 2
PETROBRAS
Buzios 8
PETROBRAS
Mero 4
PETROBRAS
Buzios 6
EXXONMOBIL
Payara
PETROBRAS
Itapu*

Investor Relations Overview | 37
Financial disclosures – Yamal LNG
Project disclosure data
Source: Q3 2020 earnings release schedules (Exhibit 7)
Contract liabilities structure
Vendor
(cost)
Joint Venture
(profit)
Reduction in contract liabilities: $133mJune 30, 2020 to September 30, 2020
TechnipFMC(remains with FTI)
JV partners(included in MRL)
50% 50%
Payments to Vendors or JV partners
Continued strong execution will
reduce project cost, increasing
Joint Venture profit Expect Yamal LNG revenue contribution of $400 – 500
million in 2020
Additional items of note
September 30, 2020 June 30, 2020
Contract liabilities $ 963.8 $ 1,096.9
Mandatorily redeemable financial liability 281.7 219.8
Three Months Ended Three Months Ended
September 30, 2020 June 30, 2020
Cash required by operating activities $ (17.2) $ (20.7)
Settlements of mandatorily redeemable financial liability - (131.1)
TechnipFMC plc and Consolidated Subsidiaries
Business Segment Data for Yamal LNG Joint Venture
(In millions, unaudited)

Investor Relations Overview | 38
$36 million
$129 million
$509 million
$146 million
$828 million
$1,025 million
Subsea1
$7.2 billion
$1.1 billion $2.7 billion$3.4 billion
2022 & beyond2021
Technip Energies
2020 2022 & beyond2021
3Q 2020 Inbound orders: $1,607 million
3Q 2020 Inbound orders: $413 million
Surface Technologies
2020
$1.6 billion $5.8 billion $4.7 billion
2020 & 2021
3Q 2020 Inbound orders: $208 million
$418 million
Subsea
Technip Energies
20203
2021
2022+
$674 million
20203
2021
2022+
$1,999 million
Non-consolidated Backlog2
2 Non-consolidated backlog represents our
proportional share of backlog relating to joint
venture work where we do not have a majority
interest in the joint venture.3 3 months.
1 Backlog does not capture all revenue potential for subsea services.
Backlog visibility
$369 million
$20 million$369 million
$12.1 billion

Investor Relations Overview | 39
Select financial data
Revenue September 30, 2020 June 30, 2020 March 31, 2020 December 31, 2019 September 30, 2019 Inbound Orders (1) September 30, 2020 June 30, 2020 March 31, 2020 December 31, 2019 September 30, 2019
Subsea 1,501.8$ 1,378.5$ 1,253.1$ 1,486.8$ 1,342.2$ Subsea 1,607.1$ 511.7$ 1,172.1$ 1,172.3$ 1,509.9$
Technip Energies 1,608.2$ 1,538.3$ 1,547.7$ 1,832.4$ 1,596.3$ Technip Energies 412.8$ 835.8$ 560.6$ 1,114.5$ 696.0$
Surface Technologies 225.7$ 241.7$ 329.5$ 407.6$ 396.6$ Surface Technologies 207.5$ 187.1$ 366.3$ 431.6$ 404.7$
Corporate and Other -$ -$ -$ -$ -$ Corporate and Other
Total 3,335.7$ 3,158.5$ 3,130.3$ 3,726.8$ 3,335.1$ Total 2,227.4$ 1,534.6$ 2,099.0$ 2,718.4$ 2,610.6$
Adjusted EBITDA September 30, 2020 June 30, 2020 March 31, 2020 December 31, 2019 September 30, 2019 Order Backlog (2) September 30, 2020 June 30, 2020 March 31, 2020 December 31, 2019 September 30, 2019
Subsea 146.0$ 99.6$ 104.8$ 185.0$ 139.1$ Subsea 7,218.0$ 7,085.3$ 7,773.5$ 8,479.8$ 8,655.8$
Technip Energies 174.5$ 162.6$ 167.1$ 259.7$ 304.2$ Technip Energies 12,059.2$ 13,132.6$ 13,766.6$ 15,298.1$ 15,030.8$
Surface Technologies 17.3$ 8.3$ 24.5$ 55.9$ 44.4$ Surface Technologies 368.9$ 385.9$ 422.0$ 473.2$ 428.7$
Corporate and Other (16.6)$ (29.4)$ (76.2)$ (96.2)$ (108.5)$ Corporate and Other
Total 321.2$ 241.1$ 220.2$ 404.4$ 379.2$ Total 19,646.1$ 20,603.8$ 21,962.1$ 24,251.1$ 24,115.3$
Adjusted EBITDA Margin September 30, 2020 June 30, 2020 March 31, 2020 December 31, 2019 September 30, 2019 Book-to-Bill (3) September 30, 2020 June 30, 2020 March 31, 2020 December 31, 2019 September 30, 2019
Subsea 9.7% 7.2% 8.4% 12.4% 10.4% Subsea 1.1 0.4 0.9 0.8 1.1
Technip Energies 10.9% 10.6% 10.8% 14.2% 19.1% Technip Energies 0.3 0.5 0.4 0.6 0.4
Surface Technologies 7.7% 3.4% 7.4% 13.7% 11.2% Surface Technologies 0.9 0.8 1.1 1.1 1.0
Corporate and Other Corporate and Other
Total 9.6% 7.6% 7.0% 10.9% 11.4% Total 0.7 0.5 0.7 0.7 0.8
(1) Inbound orders represent the estimated sales value of confirmed customer orders received during the reporting period.
(2) Order backlog is calculated as the estimated sales value of unfilled, confirmed customer orders at the reporting date.
(3) Book-to-bill is calculated as inbound orders divided by revenue.
Three Months Ended
Three Months Ended
Three Months Ended Three Months Ended
Period Ended
Three Months Ended

Investor Relations Overview | 40

Investor Relations Overview | 41
Investor Relations Overview | 42

Investor Relations Overview | 43

Investor Relations Overview | 44

Investor Relations Overview | 45

Investor Relations Overview | 46

Investor Relations contacts
Matthew Seinsheimer
Vice President, Investor Relations
Tel.: +1 281 260 3665
Email: [email protected]
TechnipFMC.com
Phillip Lindsay
Director, Investor Relations (Europe)
Tel.: +44 (0) 20 3429 3929
Email: [email protected]