investor september 2011 presentation - eurazeors... · gaz et eaux then azeo gas and water utility,...
TRANSCRIPT

Accelerating change
September 2011
Investor
Presentation

INVESTOR PRESENTATION
Disclaimer
This document has been prepared by Eurazeo SA (“Eurazeo”) solely for the use of
presentations made to investors or analysts.
Eurazeo makes no representations or warranties that the information contained herein
is accurate, correct or complete.
The information set out herein is provided as of the date of the presentation and
Eurazeo is under no obligation to keep current the information contained in this
presentation. However, this information is subject to completion and/or revision and
Eurazeo has the right to change the content hereof, in its sole discretion, at any time
without prior notice.
This document may contain information regarding current or future transactions as
well as “pro forma” information to show Eurazeo as it would be after said transactions
have been completed. These forward-looking statements are provided for information
purposes only and are not guarantees of future performance.
No information provided on this document constitutes, or should be used or
considered as, an offer to sell or a solicitation of any offer to buy the securities or
services of Eurazeo or any other issuer in any jurisdiction whatsoever.
- 2 -

INVESTOR PRESENTATION
Contents
- 3 -
Eurazeo: professional shareholder
1st Half 2011 results
Appendices

INVESTOR PRESENTATION
Eurazeo in a nutshell
Large stakes in leading companiesA long term French investor
130 years existence, strong shareholders
Deep network and strong track record
Led by Patrick Sayer since 2002
Investment cases built on a 4-6 year horizon,
no exit constraints
Active portfolio management
Active support to portfolio companies
Regular portfolio reviews
One new investment and one exit in 2010
19 acquisitions by portfolio companies
in 2010 and in H1 2011
3 new investments announced in H1-2011
- 4 -
ServicesElis, Edenred,
Fraikin, Foncia
Mobility
& leisureAccor, APCOA,
Europcar
Real estateANF, Colyzeo
Otherincluding OFI
21%
28%
20%
14%
9%
8%
LuxuryMoncler
BtoB distributionRexel
A balanced portfolio
NAV* as of August 29, 2011 : €4.0bn, €63.3/share
(*) Based on the update of listed securities, cash assets and treasury shares as of August 29, 2011,
private assets being valued as of June 30, 2011 (see details and valuation methodology on page 66)

INVESTOR PRESENTATION
130 years active investing
Significant outperformance vs. key indices over 10 years
+35% vs CAC40, +29% vs LPX
200119691881 20092003 2005 2007
GAZ ET EAUX then AZEOGas and water utility, later investment company
EURAFRANCEInvestment company
EURAZEOMerger of Eurafrance and Azeo
Fraikin
Eutelsat
Terreal
Lazard
Chargeurs réunis
Chaussures André
Viniprix
Danone
Sofina
Société Générale
de Belgique
Generali
UAP
Pearson
Sidel
Infogrames
Ipsos
Sogeti
Virata
Oberthur
Saint-Gobain
Accor
B&B Hotels
Air Liquide
Rexel
APCOA
Elis
Sirti
Intercos Fonroche
Colyzeo Banca Leonardo
Europcar Accor
Veolia
- 5 -
2011
OFI PE
Foncia
Moncler

INVESTOR PRESENTATION
A leading professional investor in France
DEEP EXPERIENCE OF PRIVATE INVESTMENT
– Strong deal flow
– Experience across categories: growth capital,
mid-caps and large buyouts
– Strong relationships with company managements drive
significant proprietary deal flow and early access to
companies that are put up for sale
– Institutional status drives access to deals with families,
large corporations and entrepreneurs
A PROVEN CAPACITY IN PUBLIC INVESTMENTS:
ACCOR, EDENRED, REXEL,...
– Deep sector knowledge and strategic impact
– Strong French network and capacity to earn the trust
and respect of key independent directors
– Capacity to absorb short term market movements:
strong balance sheet and flexible exit timeframe
– Long term value creation perspective
Largest European public investmentcompanies in the LPX Europe index(in €bn and by market cap as of Sept. 2, 2011)
Ratos
Partners Group
Wendel
Eurazeo
3i
Intermediate Capital
GIMV
Electra PE
Marfin Investment
SVG Capital
3.3
3.3
2.2
2.2
1.1
0.9
0.6
2.7
0.2
0.2
- 6 -

INVESTOR PRESENTATION
Eurazeo targets companies with the potential for significant change
1/ Projects of all sizes: €15m to €500m equity and more
- Eurazeo: focus on mid- to large size companies
- Eurazeo PME (former OFI Private Equity Capital): complementary market segment –
SMEs with enterprise value below €150/200m
- Eurazeo Croissance: focus on fast-growing SMEs with strong transformation potential
- Portfolio balance / diversification: a major consideration
2/ Clear criteria
- Market leaders
- Quality of management
- Barriers to entry
- Profitability and recurring cash-flows
- A step change / a new direction or a significant transformation to be accomplished (strong
organic growth or bolt-on acquisitions, potential for sector consolidation, etc.)
3/ Target IRR 15-25% depending on risk profile
- 7 -

INVESTOR PRESENTATION
A portfolio of market leaders
(1) Direct holding, excluding Colyzeo
Current % of interestheld by Eurazeo
- 8 -
Long-term truck rental with a fleet of more than 50,000 vehicles
Short-term car rentals with a fleet of ca.200,000 vehicles
Parking operator with approx. 6,300 parking facilities under management
Rental and cleaning of textiles and hygiene services
Professional distribution of electrical equipment with 2,300 branches
French real estate investment company with downtown trophy assets in major French cities
Hotel manager: Accor operates in 90 countries with 145,000 employees
Leading player in the creation, developmentand production of color cosmetic products
Prepaid services designed to enhance individual well-being and the performance of organizations
51.7%
8.9%
8.9%
81.2%
85.1%
81.7%
13.2%
21.6%
33.6%
#1 IN THE WORLD
#1 IN LYONS AND MARSEILLES
#1 IN EUROPE
#1 IN THE WORLD
#1 IN EUROPE
#1 IN EUROPE
#1 IN THE WORLD
#1 IN FRANCE
#1 IN THE WORLD
1
Major player in photovoltaic industry in France 28.4% SMALL AND GROWING
1
Leader in residential real estate in France 40.0% #1 IN FRANCE

INVESTOR PRESENTATION
Accelerating change
TRANSFORMING STRATEGIES
- The Accor / Edenred stock demerger resulted in two focused world leading companies
- Accor refocused on core business, accelerated the change to a franchise and management contract
centered business model, and sold non-core assets
- From a passive to a very active development of ANF Immobilier real estate portfolio
- Implementing social and environmental guidelines across our portfolio
ACCELERATING GROWTH
- Transforming acquisitions: Rexel / Hagemeyer, Europcar / Vanguard EMEA, APCOA / CPS, B&B
Hotels / Villages Hôtel,
- Driving organic growth: sales-force recruitment (Elis), accelerating redesign and renovation
(Accor, ANF Immobilier, B&B Hotels,), creating new products & services (Edenred, Rexel)
- Investing in the future: new business models (Europcar urban mobility), new geographies (B&B
Hotels, Elis), renewable energy (Fonroche)
PENETRATING EMERGING MARKETS
- Accor objectives in China and India, South East Asia and Brazil
- Targeted external growth for Edenred in South America
- Rexel strengthening its position in China and penetrating Brazil and India
- 9 -

INVESTOR PRESENTATION
A long-term shareholder base and a strong corporate governance
(1) Only concert as of January 31, 2011
(2) Including 3.58% of treasury shares
(*) Voting rights
A strong corporate Governance
Separation of the roles of Chairman
and CEO
Independence of the Supervisory Board:
6 independent members out of 12
Audit Committee, Finance Committee,
Compensation and Appointments
Committee
Existence of a shareholder agreement
between founding families (former
SCHP)
Sofina
5.70%
(9.07%*)
Free float(2)
56.44%
(47.65%*)
Foundingfamilies(1)
19.93%
(19.42%*)
CréditAgricole
17.93%
(23.86%*)
- 10 -
Shareholding structure
as of August 31, 2011

INVESTOR PRESENTATION
3.0
2.4
1.5
1.3
1.4 1.3
Significant NAV increase
- 11 -
(1) With ANF taken at its NAV on the basis of an independent valuation of its assets (€39.6)
(2) Cash and treasury shares net of tax
(3) Restated for FY2010 distribution (bonus share and special distribution of ANF Immobilier shares)
(4) Proforma NAV includes investment in Moncler – Private assets valued as of June 30, 2011,
update of listed securities, cash assets and treasury shares as of August 29, 2011.
NAV/share in €
Additional NAV
with ANF taken
at its NAV(1)
NAV/share
+ €22
+ ~50%
Non listed
Listed
Cash(2)
44%
14%
38%
62.0 70.3 70.1
06/30/2010(3) 12/31/2010(3) 06/30/201106/30/2009(3) 12/31/2009(3)12/31/2008(3)
47.7 42.5 57.3

INVESTOR PRESENTATION
A solid financial situation
- 12 -
• No structural debt at Eurazeo level
• New investments with moderate leverage
• Successful refinancing of the revolving credit line
• Cash position proforma of investments in Foncia and Moncler
and sale of LT participations (Ipsos) ~€200m
(*) Consolidated leverage = (consolidated net debt – value of assets which do not contribute to adjusted consolidated EBITDA) / adjusted consolidated EBITDA
(in €m) H1 2011 H1 2010 %
Eurazeo cash position (NAV) 769.4 722.4 6.5%
Consolidated net debt 5,953.1 6,269.1 -5.0%
Consolidated leverage* 2.6x 3.2x -19%

INVESTOR PRESENTATION
Contents
- 13 -
Eurazeo: professional shareholder
1st Half 2011 results
Appendices

INVESTOR PRESENTATION
Contents
Positive momentum in 1st Half 2011
OFI Private Equity, Foncia and Moncler
Outlook
- 14 -
15
21
46

INVESTOR PRESENTATION
POSITIVE MOMENTUM IN 1ST HALF 2011
- 15 -

INVESTOR PRESENTATION
Positive momentum in 1st Half 2011
Strong operational performance of portfolio companies
Solid financial position
- 16 -
3 promising investments with transformation potential

INVESTOR PRESENTATION
Investment company
SME segmentReal estate
servicesLuxury
outerwear
Sustained investment activity
- 17 -
3 acquisitions performed in H1 2011, all offering significant transformation
and value creation potential
• Significant potential for return on investment and recurring capital gains with target investment of €50 to 100m annually (1 to 3 companies per year)
• Consolidation of Eurazeo‟s position across France‟s private equity market
Transformation and value creation potential:
• Recurring revenues and strong cash flow generation
• Untapped organic growth potential and opportunities for synergies between complementary activities
• Sustainable cash flow generation notably supported by solid growth prospects
• Numerous growth levers: new geographies, retail expansion, product offering
• Multiple: 11x LTM 06/11
EBITDA
• Multiple: 11.6x LTM 06/11
EBITDA
• Price: fully paid in Eurazeo shares
• Acquired assets valued at €68/new Eurazeo share

INVESTOR PRESENTATION
1st Half 2011 key figures
(in €m) H1 2011 H1 2010(1) Change*
CONSOLIDATED REVENUES 1,907.7 1,810.9 +5.3%
ADJUSTED EBIT(2) 200.5 186.2 +7.7%
NET INCOME GROUP SHARE - 106.3 92.9 n.a.
June 30, 2011 December 31, 2010 Change
NAV 4,398 4,281(3) +2.7%
NAV / share (in €) 70.1 70.3(3) -0.3%
CASH ASSETS 769 909 -15.4%
* Excluding B&B Hotels for the 1st Half of 2010
(1) 1st Half 2010 restated for the exit of B&B Hotels from the perimeter as of June 30 (2) Fully consolidated companies only
(3) Restated for special distribution of ANF shares, number of shares restated for capital increase in remuneration for OFI shares
- 18 -
INVESTOR PRESENTATION
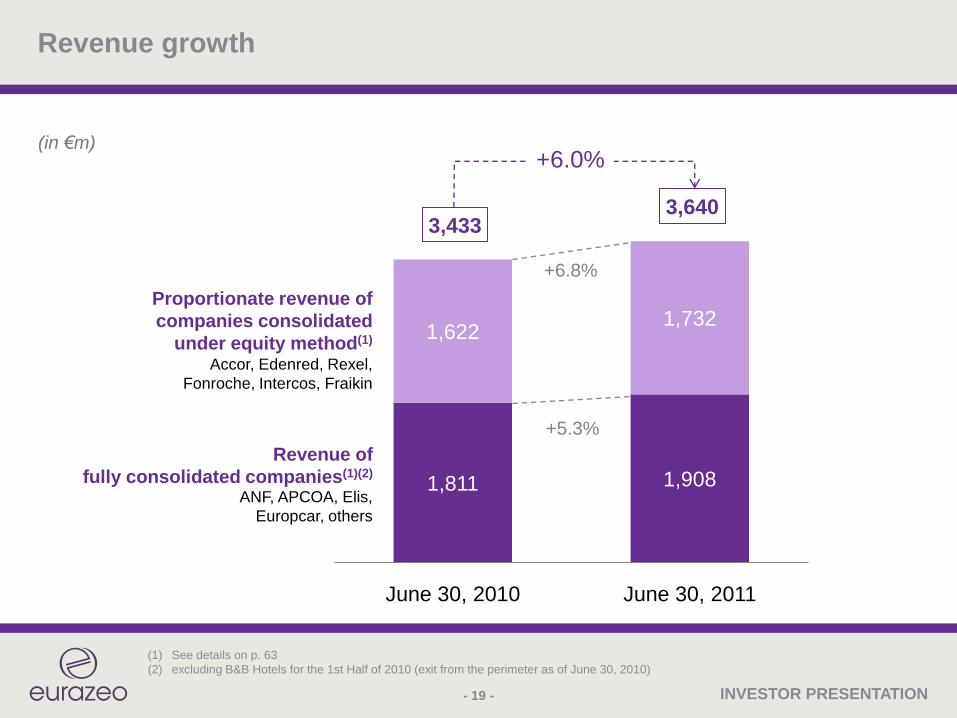
Revenue growth
- 19 -
1,811 1,908
1,6221,732
June 30, 2010 June 30, 2011
3,4333,640
Proportionate revenue of
companies consolidated
under equity method(1)
Revenue of
fully consolidated companies(1)(2)
+6.8%
+5.3%
Accor, Edenred, Rexel,
Fonroche, Intercos, Fraikin
ANF, APCOA, Elis,
Europcar, others
+6.0%(in €m)
(1) See details on p. 63
(2) excluding B&B Hotels for the 1st Half of 2010 (exit from the perimeter as of June 30, 2010)

INVESTOR PRESENTATION
Strong increase in companies‟ results
- 20 -
Fully consolidated
companies‟ adjusted EBIT
Profit from
equity affiliates
186.2200.5
9.5
35.2
H1 2010 H1 2011
195.8
235.7
+20.4%
(1) 2010 pro forma adjusted for exit of B&B Hotels
(1)
(in €m)

INVESTOR PRESENTATION
OFI PRIVATE EQUITY,
FONCIA AND MONCLER3 PROMISING INVESTMENTS
- 21 -

INVESTOR PRESENTATION
3 promising investments
+ Foncia + Moncler
- 22 -
Foncia: France‟s leader in residential real estate services,
recurring business and limited exposure to real estate cycle
Moncler: a unique luxury brand offering
significant growth potential, notably in emerging markets
OFI Private Equity:
a leading investment company targeting SME market

INVESTOR PRESENTATION- 23 -
becomes
3 promising investments:

INVESTOR PRESENTATION
OFI Private Equity is a natural complement for Eurazeo
An investment philosophy close to Eurazeo‟s A committed shareholder: majority position, solid governance, CSR approach
Similar investment criteria: quality of management, strong profitability and high growth potential, reliable and recurring cash flows, market leaders, portfolio diversification
Alignment of interests with portfolio company management teams
Recognized high quality management team Experience and track record of Olivier Millet and his team
Six-person investment team: Olivier Millet, 2 associate directors, 2 investment directors and 1 investment manager
Good track record since its creation in 2005 14 investments
4 divestitures with an overall multiple of 2.2x
1.4x current portfolio on the basis of June 30, 2011 NAV
Quality portfolio built around market leading companies
- 24 -

INVESTOR PRESENTATION
Attractive price and success of the public offer
Success of the simplified exchange public offer, Eurazeo now holds:
95.27%** of the capital and of the voting rights of OFI PEC
96.89% of the BSA 1 issued by OFI PEC
99.23% of the BSA 2 issued by OFI PEC
- 25 -
Eurazeo will proceed with a “squeeze out” procedure
on the OFI PEC residual shares, BSA1 and BSA2
The squeeze out should be effective before year‟s end
(*) Based on OFI PEC's June 2011 NAV and the announced valuation of the other acquired assets
(**) Not including OFI PEC treasury shares
Quality assets bought at attractive price:
- fully paid in Eurazeo shares
- acquired assets valued at €68/new Eurazeo share*

INVESTOR PRESENTATION
Eurazeo pme
- Ambition:
• Invest in companies with significant transformation potential, on the small and medium
entreprise market segment (investment size between €15m and €75m)
• Investment target of €50m to €100m per year (1 to 3 companies per year)
- In a dynamic market segment:
• LBO small-mid cap segment (EV between €15m and €200m)
• ~90 operations per year, 1 out of 3 being a secondary transaction
- 26 -

INVESTOR PRESENTATION
Diversified assets
- 27 -
8 investments,
6 majority(1)
Balanced between
Services and Industry
No single investment
more than 26% of
Gross Asset Value
(1) Dessange, FDS, Léon de Bruxelles, Mors Smitt, Gault & Frémont and Fondis. Minority Investments : IMV and BFR Groupe
Cash
26%
26%24%
7%
7%
2%3%
1%4%
€168.5mas at June 30, 2011

INVESTOR PRESENTATION
Solid growth across the portfolio
- 28 -
(*) Perimeter at June 30, 2011
Preliminary figures H1 2011 Actual H1 2010
In €m Nb. of companies Revenue EBITDA EBITDA Margin Revenue EBITDA EBITDA Margin
Majority* 6 175 27 15.4% 161 26 16.2%
Minority* 2 38 6 17.2% 48 7 15.6%
21.7
7.4
17.4
26.8
45.8
55.6
21.1
5.8
16
26.5
41.8
50.1 Openings of 7 new restaurants during the year 2011, 5 have been realised on the first semester
+1%
+11%
+27%
+3%
+9%
Change
+10%
External growth, +1% on a same basis perimeter (2 external growth operations in 2010 and 2011, together contributing €1,4M€ sales in Q2 2011)
Redeployment of its business activity Development of the product portfolio with new suppliers
in order to accelerate the group development
Good performance for the Dessange and Camille Albane franchises
Further international development
Further international development (direct setting-up or external growth)
Revenue (€m)
External growth: acquisition of STS Rail Ltd (Turnover 2010 : € 3,2M) in the UK in April 2011
H1 2010
H1 2011
Dessange
Gault & Frémont
Fondis
Mors Smitt
Siem/Flexitallic
Léon de Bruxelles

INVESTOR PRESENTATION- 29 -
3 promising investments:

INVESTOR PRESENTATION
Transaction overview
Transaction Purchase of 98.11% of Foncia from BPCE for €711m
ConsortiumGovernance shared equally between Eurazeo and Bridgepoint
Equity investment (before employees) of €197m for Eurazeo and €39m for Eurazeo Partners
BPCE
• €80m of equity instruments
• €20m of junior equity with returns capped at 10%
• €100m of redeemable bonds in shares protecting investors‟ return on investment
(i.e. repayment profile triggers only after investors money multiple exceeds 2.7x)
Financing
Prudent all-senior bank financing of €395m (maturity: 2017/2018), including a bullet tranche
of €300m and additional available financing facilities of €90m to finance
the company‟s development
Valuation €1,017m / €917m net of redeemable bonds, 11x LTM EBITDA June 11
- 30 -

INVESTOR PRESENTATION
A very attractive investment opportunity (1/2)
1. France‟s leader in residential real estate services
– 1st in France in lease management/rentals (8%), joint property (13%) and 4th in transactions
– Very fragmented market: less than 27% of the market in joint property and 16% for lease
management held by the top 3 players
– Strong Foncia brand
– Network of 577 branches in France with national coverage and homogenous work practices
2. Recurring revenues generated from a large and loyal client base
– 84% of revenues generated through recurring activities little affected by economic cycles
– Very large client base: 1 million joint-property dwellings, 252,000 lease management
properties
– Very long-term client relationships: 95% retention rate
- 31 -

INVESTOR PRESENTATION
A very attractive investment opportunity (2/2)
3. Strong cash flow generation
– A 90% EBITDA to cash transformation rate
– Business generates working capital resources, not needs
– Limited maintenance investment
– Moderate acquisition debt
4. A primary LBO offering opportunities for significant transformation
– Untapped organic growth potential: improving quality of service, cross-selling
complementary products to existing customer base
– Extended, standardized network enables absorption of new offices
– International expansion started in Germany, Switzerland and Belgium
A recurring activity offering significant value creation potential
- 32 -

INVESTOR PRESENTATION
36%
31%
16%
1%8%
8%
French leader in residential real estate services
- Leader in residential real estate services
- 3 complementary activities:
– Lease management / rentals
#1 in France (8% market share) with
252,000 dwellings under management
– Joint property management
#1 in France (13% market share) with
1 million dwellings under management
– Property transactions
#4 with 12,000 sales agreements
signed in 2010
- A business with strong recurrent
revenues (84% of revenues)
- A network of 609 branches,
of which 577 in France
- 7,000 employees of which 6,500 in France
(1) Including renting business (95% captive)
Lease management(1)/
Rentals
Joint property
Transaction
Associated services
International
Client accounts
2010 revenue by activity
Revenue by country
92%
5%
2%
1%
France
Switzerland
Germany
Belgium
Recurring
revenue: 84%
- 33 -

INVESTOR PRESENTATION
A steadily growing property management market
Market size
Business description Revenue sourcesMarket growth
Lease
management/
Rentals
€2.5 bn
• Management activities (accounting, administration and legal) and research for new tenants
• Long-term customer relationships (renewal rate 95 %)
• Recurring revenues linked to fees invoiced to owners and tenants
• Interest earned on client account placements
+ 3-4 %
per year
Joint property
management€1.4 bn
• Joint-property owners association administers property on behalf of all owners
• Long-term customer relations (renewal rate: 95 %)
• Recurring revenues linked to fees invoiced to joint-property owners
• Interest earned on client accounts
Associated
servicesN/A
• Financial management (SCPI, etc.), technical diagnoses, insurance brokerage and financing
• Revenues linked essentially to recurring business
• Significant source of synergies
Transactions €4.0 bn• Property value estimation,
organization of visits, preparation of pre-contracts
• More cyclical business (dependent on property market)
• Revenue proportional to volume / price of transactions
Variable
~84% of
Foncia‟s
business
~16% of
Foncia‟s
business
- 34 -
INVESTOR PRESENTATION
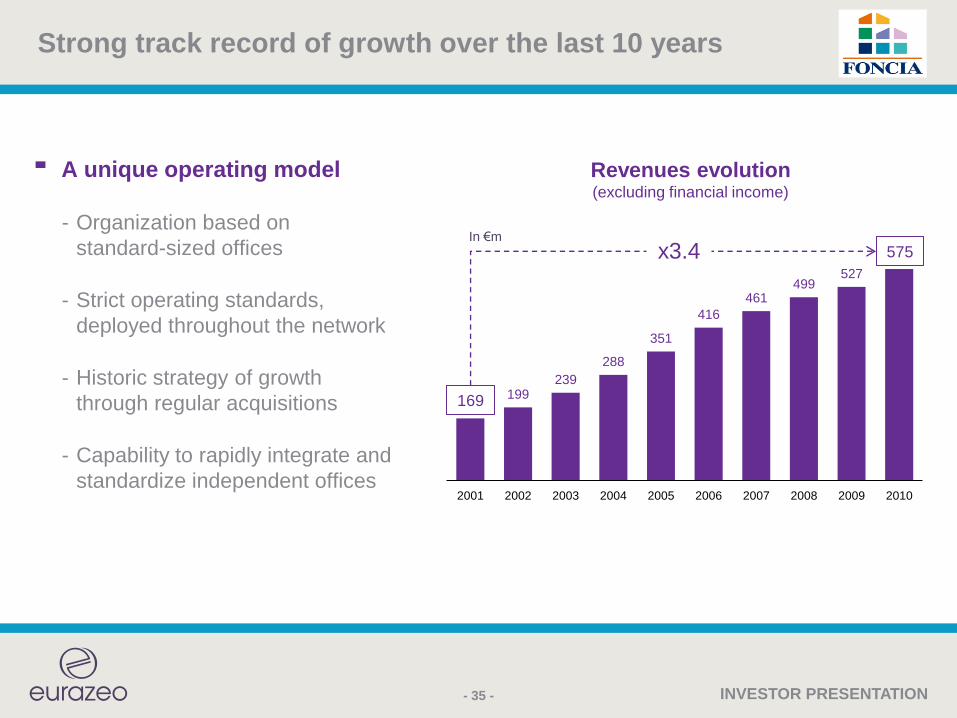
Strong track record of growth over the last 10 years
A unique operating model
Organization based on
standard-sized offices
Strict operating standards,
deployed throughout the network
Historic strategy of growth
through regular acquisitions
Capability to rapidly integrate and
standardize independent offices
169199
239
288
351
416
461499
527
575
2001 2002 2003 2004 2005 2006 2007 2008 2009 2010
Revenues evolution(excluding financial income)
169
575x3.4In €m
- 35 -

INVESTOR PRESENTATION
Strong transformation potential
Ambition: make Foncia the benchmark reference
in residential real estate services
• Promote commercial synergies between
the different disciplines
• Develop new product offering
• Reinforce organic growth culture and quality
of joint-property management services
• Improve quality and perception of services
• Develop new product offering
• Develop operational efficiency sources
reinforcing leadership competitive advantages
• Secure synergies from acquisitions
Transactions
Lease
management/
Rentals
Associated
services
Joint-property management
(1 million dwellings in France)
Administrative and support functions
- 36 -

INVESTOR PRESENTATION
Financials
- 37 -
January – June (€m) H1-2011 H1-2010Reported
changeFull Year 2010
Revenue 297.7 285.2 +4.4% 580.4
Normalized EBITDA (1)
% margin
45.0
15.1%
42.4
14.9%+6.1%
80.1
13.8%
(1) EBITDA normalized for non recurring items accounting practices and other items as identifed in the due diligence process.
Reported numbers might differ
LTM Normalized EBITDA(1)
As of June 2011 = €82.8m

INVESTOR PRESENTATION- 38 -
3 promising investments:

INVESTOR PRESENTATION
Key elements of the transaction
- 39 -
Moncler Key figures€429m sales and €102m of EBITDA in 2010
50 operated stores* for the Moncler brand, as of today
Purchase Price Eurazeo is purchasing a 45%-stake in the Company for a price of €418m
Transaction value€1.2bn Entreprise Value
11.6x LTM June 2011 EBITDA
Shareholder structure
Governance
Mr. Remo Ruffini to remain Chairman of the Board
Eurazeo will appoint 5 board members, including the Vice-Chairman,
Mr. Remo Ruffini 3 board members, Carlyle and Mittel each 1 board member
CalendarExpected closing Q4 2011
Financing and equity syndication in progress
45%
32%
17.8%
5%
Eurazeo
R. Ruffini
0,3% S. Buongiovani
Carlyle
Mittel
38%
48%
13.5%
R. Ruffini
Carlyle
Mittel0,5% S. Buongiovani
(*) Operated stores include urban stores, ski resorts stores, shops in shops and outlets – excluding franchises (2) and corners (9)

INVESTOR PRESENTATION
Investment case
The luxury market presents attractive fundamentals and is complementary
to Eurazeo‟s portfolio
The luxury apparel & accessories market is estimated at €100bn and is forecasted to grow at 6-7% p.a.
Few companies with critical mass such as Moncler are available
Strong growth prospects supported notably by an increasing exposure to emerging markets
Moncler opened 4 stores in China, and expects to open 5 more in 2011
Strong potential in Korea and Russia
Roll-out geographical reach in the USA
High profitability levels and solid cash conversion rate
Seasoned and well regarded management team that has built Moncler‟s success story
Limited acquisition debt resulting in significant operating and financial flexibility (<2.5x leverage)
Exit options: sale to a strategic
- 40 -
Moncler is an attractive investment for Eurazeo

INVESTOR PRESENTATION
Moncler is pursuing its growth
and diversification strategy (1/2)
- 41 -
51%49%
Rest of the world
Italy
H1 2010
Sales
Moncler brand:
continued
geographical
diversification
41%
59%
Strong growth
for the group and
for the Moncler
brand in H1 2011
H1 2011
Sales
Sales growth Vs H1 2010
Group +19%
Moncler brand +35%

INVESTOR PRESENTATION
Moncler is pursuing its growth
and diversification strategy (2/2)
- 42 -
23%
77%
Wholesale
Operated stores
H1 2010
Sales
Moncler brand:
Continued shift
to retail
29%
71%
H1 2011
Sales
Moncler brand:
seasonal rebalancing
Spring-Summer 2011 collection sales in retail
and wholesale showing strong results
• H1 2011 like-for-like growth in Moncler stores at 12%
• 2012 Spring-Summer collection orders show a good trend

INVESTOR PRESENTATION
Pursuing expansion of retail network
- 43 -
2010 To date End 2011
Europe 24 29 34
Asia 13 17 24
North America 3 4 4
Total 40 50 62
Number of Operated Stores
Evolution of
retail network
• 22 openings expected in
2011, versus 15 openings
in 2010 and 11 in 2009
• Balanced focus on Europe
and Asia in 2011
Expand focus
Increase penetration
Strongly develop operated stores in top end locations
Intensify efforts on underpenetrated markets with strong potential

INVESTOR PRESENTATION
1st Half 2011 highlights
- 44 -
• Strong performance of Moncler Division (+35%), both in wholesale and retail and across key geographies
• Other Brands: +1.9%, mainly due to retail development which offsetsa lower performance in wholesale
January – June
(€m)H1 2011 H1 2010
Reportedchange
Revenue 189.3 158.7 +19.3%
EBITDA
% margin
30.4
16.0%
26.0
16.4%
+16.6%

INVESTOR PRESENTATION
Investment perspectives
Growth remains very strong in H1 and is expected to continue
• All openings for 2011 are well advanced and most of them secured
• Orders in the wholesale channel are above previous year
Preparation of the transaction‟s closing
• Antitrust
• Debt financing (limited leverage)
• Equity syndication
- 45 -
Expected closing in Q4 2011

INVESTOR PRESENTATION
OUTLOOK
- 46 -

INVESTOR PRESENTATION
Still seizing opportunities
Sale of stake in LT Participations (Ipsos) to Sofina SA
Increased stake in Intercos:
- from 25.1% to 33.6% following purchase of 50% of Euraleo
from Gruppo Banca Leonardo
Reinvestment of €10m in Fonroche to finance its growth
Banca Leonardo: successful disposal of DNCA
- 47 -

INVESTOR PRESENTATION
A well-balanced and diversified portfolio
- 48 -
(1) With ANF taken at its NAV on the basis of an independent valuation of its assets (€39.6)
(2) Cash and treasury shares net of tax
(3) Restated for FY2010 distribution (bonus share and special distribution of ANF Immobilier shares)
(4) Proforma NAV includes investment in Moncler – Private assets valued as of June 30, 2011, update of listed securities, cash assets and
treasury shares as of August 29, 2011,
NAV/share in €
1.3
1.4 1.3Additional NAV
with ANF taken
at its NAV(1)
NAV/share
62.0 70.3 70.1
+ €8
Non listed
Listed
Cash(2)
ServicesElis, Edenred,
Fraikin, Foncia
Mobility
& leisureAccor, APCOA,
Europcar
Real estateANF, Colyzeo
Otherincluding OFI
21%
28%
20%
14%
9%
8%
LuxuryMoncler
BtoB distributionRexel
Pro forma(4) NAV as of August 29, 2011
A further balanced portfolio
€4.0bn €63.3/share
June 30, 2010(3)
44%
42%
14%
34%
47%
19%
38%
47%
15%
December 31, 2010(3) June 30, 2011

INVESTOR PRESENTATION
To conclude
3 promising acquisitions
Strong operational performance of portfolio companies
- 49 -
Resilience of Eurazeo‟s model
and confirmed value creation potential

INVESTOR PRESENTATION
Contents
- 50 -
Eurazeo: professional shareholder
1st Half 2011 results
Appendices
INVESTOR PRESENTATION
APPENDICES
including Group Companies‟ detailed information
- 51 -

INVESTOR PRESENTATION
Appendices
- 52 -
Financial appendices
Group companies‟ detailed information
Other information

INVESTOR PRESENTATION
1ST HALF 2011 RESULTS
- 53 -

INVESTOR PRESENTATION
1st Half 2011 consolidated results
Operational performance in H1 2011
- 54 -

INVESTOR PRESENTATION
Consolidated scope as of June 30, 2011
- 55 -
06/2011
Consolidated companies 188
Fully consolidated 181
Equity method 7

INVESTOR PRESENTATION
Results analysis
- 56 -
* 06/2010 Proforma : deconsolidation of B&B Hotels as of January 1, 2010.
(1) Before changes in derivatives, fair value adjustments of investment properties, depreciation and amortization of intangibles, available for sale
securities and equity affiliates as well as amortization of allocated goodwill
(2) Excluding impact from derivatives
(3) Including restructuring charges of - €2.5m in 2011, €1.3m in 2010 and €24.0m in 2009
(4) Before depreciation and amortization of intangibles, available for sale securities and equity affiliates as well as amortization of allocated goodwill
ANF Immobilier 38.1 27.2 19.5 18.9
APCOA 13.8 12.6 12.6 15.3
Elis 87.2 84.2 84.2 81.2
Europcar 61.4 62.2 62.2 42.6
B&B Hotels - - 12.5 10.2
Adjusted EBIT (1) 200.5 186.2 191.0 168.2Net cost of financial debt of above companies (2) (238.2) (228.3) (235.4) (224.9)
Earnings for equity affiliates 35.2 9.5 9.5 (27.5)
Cost of net financial debt Accor/Edenred (LH19) (2) (17.7) (18.3) (18.3) (20.6)
Change in value of investment properties 18.1 9.6 6.3 (61.0)
Capital gains or losses - 217.2 217.2 44.9
Revenues of holding sector 34.4 25.3 25.3 40.9
Net cost of financial debt of holding sector (2) (24.4) (31.8) (31.8) (7.7)
Operating costs of holding sector (24.5) (30.8) (30.8) (25.8)
Change from derivatives (rates and shares) (49.5) (4.3) (4.3) (22.7)
Other incomes and expenses (3) (10.6) (15.3) (17.9) (49.0)
Income tax 7.5 (0.2) (0.6) 54.0
Income before depreciation and amortization (4) (69.2) 118.9 110.4 (131.2)
Group share (80.0) 122.8 118.4 (86.9)Minorities share 10.8 (3.9) (8.0) (44.2)
Depreciation and amortization (30.3) (33.8) (33.8) (46.6)
Consolidated income IFRS (99.5) 85.1 76.6 (177.8)
Group share (106.3) 92.9 88.5 (120.9)Minorities share 6.8 (7.8) (11.9) (56.9)
in € million 06/2011 06/2010* 06/2010 06/2009

INVESTOR PRESENTATION
Change in net income compared to Pro Forma* June 2010
- 57 -
85
14
269
29 -45-99
-217
IFRSNet income
06/2011
IFRSNet income
06/2010*
Other items**
Increase in companies‟results
consolidatedunder equity
method
Increase in companies‟ operating income
Change inderivatives
(in €m)
(*) Pro forma reflecting exit of scope of B&B Hotels
(**)Including increase in revenues of Holding activity (+€9m) and positive change of financing costs
and overheads of holding activity (+€14m).
Change in fair value of investment properties
Changein realized
capital gains
-217

INVESTOR PRESENTATION
A solid financial situation
- 58 -
(in €m) H1 2011 H1 2010 %
Eurazeo cash position (NAV) 769.4 722.4 6.5%
Consolidated net debt 5,953.1 6,269.1 -5.0%
Consolidated leverage* 2.6x 3.2x -19%
• New investments with moderate leverage
• Successful refinancing of the revolving credit line
• Cash position proforma of investments in Foncia and Moncler
and sale of LT participations (Ipsos) ~€200m
(*) Consolidated leverage = (consolidated net debt – value of assets which do not contribute to adjusted consolidated EBITDA) / adjusted consolidated EBITDA
Subsequent events:
INVESTOR PRESENTATION
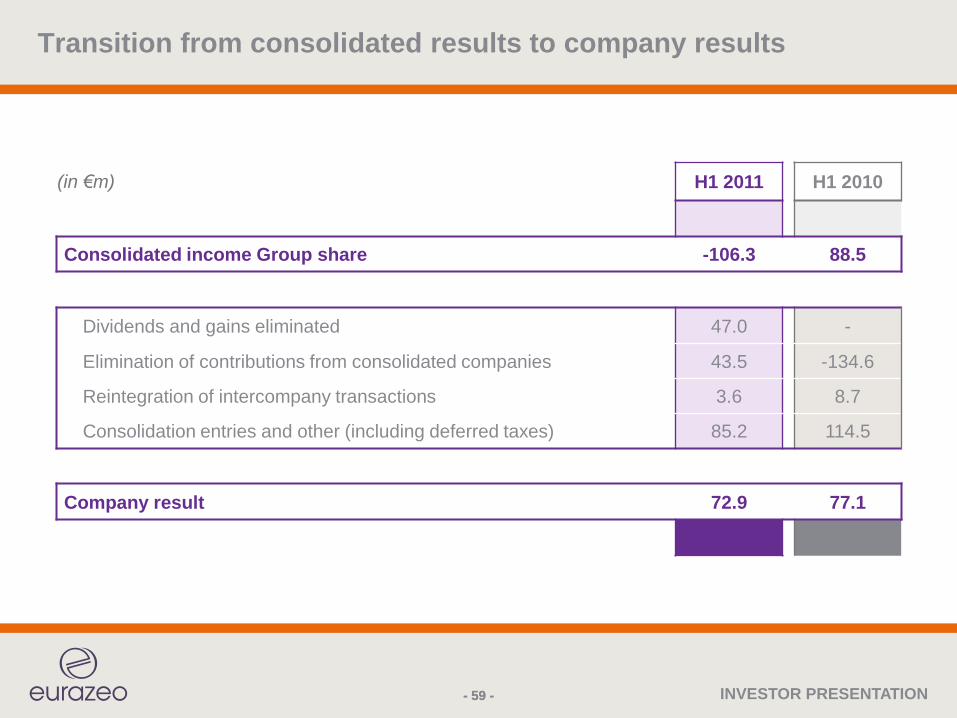
Transition from consolidated results to company results
- 59 -- 59 -
(in €m) H1 2011 H1 2010
Consolidated income Group share -106.3 88.5
Dividends and gains eliminated 47.0 -
Elimination of contributions from consolidated companies 43.5 -134.6
Reintegration of intercompany transactions 3.6 8.7
Consolidation entries and other (including deferred taxes) 85.2 114.5
Company result 72.9 77.1

INVESTOR PRESENTATION
Strong increase in companies‟ results
- 60 -
(1) 2010 pro forma adjusted for exit of B&B Hotels.
(in €m) H1 2011 H1 2010(1) %
Consolidated revenues 1,907.7 1,810.9 +5.3%
Europcar 61.4 62.2 -1.3%
Elis 87.2 84.2 +3.5%
APCOA 13.8 12.6 +9.6%
ANF 38.1 27.2 +40.1%
Adjusted EBIT 200.5 186.2 +7.7%
Profit from equity affiliates 35.2 9.5 +269.1%
Total 235.7 195.8 +20.4%

INVESTOR PRESENTATION
Use of cash
- 61 -
909
557
December 31,
2010
in €m
• Cash proforma of investment of Moncler ~€200m
• Successful refinancing of Eurazeo‟s syndicated credit line during summer 2011
(102)
(64)
(67)75
(154)
(40)
Dividends
received
Dividends
paidReimbursement
of Immobilière
Bingen‟s debtFinancial costs
Fonroche & Foncia
invest. & sale
of LT (Ipsos)
Other
August 29,
2011
Amount: €1bn Maturity: July 2016

INVESTOR PRESENTATION- 62 -
1st Half 2011 consolidated results
Operational performance in H1 2011

INVESTOR PRESENTATION
6,163
910
559
501
359
45
2,973
5,745
904
522
461
330
34
2,849
Rexel
Europcar
Elis
Edenred**
APCOA
ANF
Accor
Revenue growth across the board
- 63 -
REVENUES (€m)
Strong momentum in Latin America. Improvement in Europe, reflecting first signs of stabilization in Central Europe
Sustained growth of financial revenues: +16.0%
Strong growth led by steady rise in occupancy rates and a gradual recovery in average room rates
Continued volume recovery in the various segments, mainly airports, on-street and shopping centers, and solid commercial performance
Acceleration of Hotel and Health segments growth, recovery of Industry segment in France.International: growth in all geographies
Growth on a comparable basis in H1 2011 in all geographies (Europe +5.6%, North America +7.9%, Asia-Pacific +6.6%) supported by prices increases and accelerating growth in volume
H1 2010
H1 2011
+7.8%
+5.8%
+2.3%
+0.1%
+9.8%
+6.1%
(*) Change „2011/2010‟ at constant perimeter and exchange rates (**) Including Financial Revenues
Change lfl*
Market recovery limited to low-contributive segments and increased competition
Selective approach of business with sustained pricing strategy and exit from unprofitable contracts
+9.1%
+4.4%
+7.1%
+0.7%
+8.6%
+7.3%
Change
Like-for-like growth driven by the increase in city-center retail rents & residential vacancy reduction
Excluding one-off effect of litigation with PrintempsDepartment Store (+€7.8m): +12.3%
+36%+33%

INVESTOR PRESENTATION
334
61
174
167
24
31
199
257
62
167
155
21
27
156
Rexel
Europcar
Elis
Edenred
APCOA
ANF
Accor
Portfolio companies grew operating profit
- 64 -
Operating flow-through ratio before digital extra costsclose to 50%Operating EBIT (excl. Financial revenues): +10.8% lflFinancial EBIT: +16.0% lfl
Change lfl*
Significant growth as a result of volume effect and good drop-through ratio (49% at the group level, despite the impact of Ivory Coast and Egypt)
Profitability improvement driven by revenue growth combined with tight cost control, more selective commercial policy and successful contracts renegotiation in the UK
Negative mix effect due to lower profitability of international activities
2010 comparison basis is high due to non-recurring items. Excl. one-off effect: +5.7%
EBITDA margin up 90bps mainly thanks to increasein gross margin (+10bp) and good control over costs
+10.1%
+44.0%
+1.0%
-1.9%
+12.1%
+29.4%
(*) Change „2011/2010‟ at constant perimeter and exchange rates(1) EBIT for Accor and Edenred, EBIT restated for interest expense included in fleet operating lease rents for Europcar,
EBITDA for Rexel, recurring EBITDA for ANF, EBITDA for all other companies(2) Including Financial Revenues
OPERATING PROFIT (1) (€m)H1 2010
H1 2011
(2)
Reinvestment of productivity gains and pricing strategy into brand enhancement and new marketing initiatives
Stable operating margin on tight fleet management and cost control despite modest revenue growth
Profitability increase due to rise in rents+11.4%
Change
+10.8%
+27.6%
+4.0%
-1.3%
+8.0%
+29.7%
+11.4%

INVESTOR PRESENTATION
Rexel
Europcar
Elis
Edenred
APCOA
ANF
Accor
Net debt
- 65 -
NET DEBT*1 (€m)H1 2010
H1 2011LEVERAGE1,2
Quasi debt-clearing at year end. Impact of the asset disposal program.
Limited use of debt
Debt increase driven by a weak performance in H2-2010 and contract renegotiation in the UK. Stable leverage
Impact of demerger costs (€ 42m), dividend (€ 127m) and change in exchange rates (€ 79m)
Impact of international acquisitions (Spain, Switzerland, Italy) and IT investment
Slight increase of cost of vehicle per unit and refinancing cost impact
Strong cash flow generation2,364
3,528
1,940
338
634
489
559
2,535
3,358
1,857
320
602
472
964
Rexel
Europcar
Elis
Edenred
APCOA
ANF
Accor
%/pt Change „H1 2011/H1 2010‟
+6.4%
-0.0x
+0.2x
+9.0%
+0.0x
+0.0x
-0.9x
-42.0%
+3.7%
+5.3%
+5.6%
+4.5%
+5.1%
-6.7%
40%
31%
16.7%
23.1%
30%
30%
11.7x
11.9x
3.9x
3.0x
5.3x
5.3x
5.5x
5.5x
(*) End of June debt(1) Accor: excluding discontinued operations (Edenred, demerged during the period, and Groupe Lucien Barrière and the Onboard Train Services
business, reclassified in discontinued operations in accordance with IFRS 5). Ratio S&P – FFO/Net debt including fixed leasing.(2) Edenred: Ratio S&P – FFO/Net debt ANF: LTV ratioEuropcar : leverage calculated as Net debt including leasings/EBITDAAPCOA, Elis, Rexel: net debt / EBITDA

INVESTOR PRESENTATION
Eurazeo‟s NAV as of June 30, 2011
- 66 -
% held No. shares
Share price
in €
NAV as of
June 30, 2011 (in €m)
With ANF at NAV(1)
ANF @ €39.6
Private investments 1,521.3
Groupe OFI(1) 128.7
Public investments 1,512.9
Rexel 21.55% 57,923,503 16.60 961.6
LT (Ipsos) 24.98% 32.46 55.2
Accor 8.85% 20,101,821 29.17 586.3
Edenred 8.90% 20,101,821 20.13 404.7
Net debt Accor/Edenred -494.9
Accor/Edenred net*(2) 20,101,821 496.1
Real Estate 563.2 661,5
ANF net 51.72% 14,337,178 32.70 468.8 567,0
Colyzeo and Colyzeo 2(2) 94.4
Other public shares 0.0
Danone (pledged EB) 2.53% 16,433,370 42.60 700.0
Debt Danone (EB) -700.0
Danone net 0.0
Other assets 23.8
Eurazeo Partners 8.3
Other (SFGI, ...) 15.4
Cash 769.4
Non-affected debt -110.3
Tax on latent capital gains
and other tax assets-104.9 -124.2
Treasury shares 3.42% 2,145,140 94.0
TOTAL VALUE OF ASSETS AFTER TAX 4,398.0 4 ,477.0
NAV PER SHARE 70.1 71.4
NUMBER OF SHARES 62,743,286 62,743,286
(*) Net of allocated debt(1) OFI PEC shares are valued on the basis of the NAV communicated by OFI PEC. OFI PE Commandite shares and Eurazeo-PME shares
are valued at their acquisition price. The NAV presented here includes OFI PEC‟s holdings of 76.4%.(2) Accor/Edenred shares held indirectly through Colyzeo funds are included on the line for these funds.
Methodology: compliant
with IPEV guidelines
- Private investments:
valuation primarily based
on multiples of comparables
or of transactions. Values
retained were the subject
of a detailed review by an
independent professional
appraiser
- Public companies: average
over a 20-day period of the
volume-weighted share price

INVESTOR PRESENTATION
Eurazeo‟s NAV as of August 29, 2011
Methodology: compliant
with IPEV guidelines
- Private investments: based
on June 30, 2011 valuation
- Update of listed securities,
cash assets and treasury
shares as of August 29, 2011
(*) Net of allocated debt (1) OFI PEC shares are valued on the basis of the NAV communicated by OFI PEC. OFI PE Commandite shares and Eurazeo-PME shares
are valued at their acquisition price. The NAV presented here includes OFI PEC‟s holdings of 95.3%.(2) Accor/Edenred shares held indirectly through Colyzeo funds are included on the line for these funds.
% held No. shares
Share price
in €
NAV as of August 29,
2011 (in €m)
With ANF at NAV(1)
ANF @ €39.6
Private investments 1,732.7
Groupe OFI(1) 157.6
Public investments 1,101.7
Rexel 21.55% 57,923,503 13.74 735.9
Accor 8.85% 20,101,821 24.81 498.7
Edenred 8.90% 20,101,821 17.88 359.4
Net debt Accor/Edenred -492.2
Accor/Edenred net*(2) 20,101,821 365.8
Real Estate 541.8 669.9
ANF net 51.63% 14,337,178 30.61 439.9 567.0
Colyzeo and Colyzeo 2(2) 102.9
Other public shares 0
Danone (pledged EB) 2.53% 16,433,370 42.60 700.0
Debt Danone (EB) -700.0
Danone net 0
Other assets 21.4
Eurazeo Partners 7.0
Other (SFGI, ...) 14.4
Cash 557.1
Non-affected debt -110.3
Tax on latent capital gains
and other tax assets-85.0 -110.2
Treasury shares 3.58% 2,259,617 81.0
TOTAL VALUE OF ASSETS AFTER TAX 3,997.9 4,100.9
NAV PER SHARE 63.3 64.9
NUMBER OF SHARES 63,141,655 63,141,655
- 67 -

INVESTOR PRESENTATION
Appendices
- 68 -
Financial appendices
Group companies‟ detailed information
Other information

INVESTOR PRESENTATION
Strong 1st Half 2011 revenue performance,up 5.8% like-for-like to €2,973m, led by steady rise in occupancy rates and a gradual recovery in average room rates
Successful disposal of Le Nôtresold to Sodexo at an enterprise value of €75m; Closing expected by the end of September
Successful refinancing of existing facility, with €1.5 bn Syndicated Line of Credit
ECONOMIC INTEREST
8.85%EQUITY METHOD
- 69 -

INVESTOR PRESENTATION
1st Half 2011 highlights
- 70 -
H1 like-for-like Q2 2011
Hotels +5.9% +6.1%
Upscale and Midscale Hotels +6.0% +6.2%
Economy Hotels excluding the U.S. +6.4% +6.7%
Economy Hotels in the U.S. +3.7% +3.4%
Acceleration of the performance in the 2nd Quarter
France: strong performance in the 2nd
Quarter. Revenues up 7.4% like-for-like in Up & Midscale and 5.7% in the Economy also thanks to the Paris Airshow in June
H1 like-for-like Total
EBITDAR +9.7% €897m
EBIT +44% €199m
Robust growth of EBITDAR and EBIT
Good flow-through ratio standing at 49% at the group level, despite the impact of Ivory Coast and Egypt
Accor is on track to meet its full year target of 30,000 new rooms and the two-year target of €1.2bn impact on the net debt from asset disposal
- 13,700 rooms were opened in the period, 78% of which under management and franchise contracts, in line with the asset right strategy
- Two Sale & Management-Back agreements signed in July: Pullman Bercy (€105m - 6.5% yield) and Sofitel Paris Arc de Triomphe (€69m)
On May, Accor closed a €1.5bn syndicated line of credit with a group of leading banks
- Replacing the €2bn syndicated credit facility signed in June 2007, subsequently reduced to €1.7bn, expiring in June 2012
- This new five-year facility will lengthen the average maturity of Accor‟s financing at favorable conditions

INVESTOR PRESENTATION
Financials
Note: PF = Pro Forma = Excluding discontinued operations (Edenred, demerged during the period, and Groupe Lucien Barrière
and the Onboard Train Services business, reclassified in discontinued operations in accordance with IFRS 5).
January – June (€m) H1-2011 H1-2010Reported
change
Comparable
change
Revenue 2,973 2,849 +4.4% +5.8%
EBITDAR
% margin
897
30.2%
835
29.3%
+7.5%
+0.9pt
+9.7%
+1.1pt
EBIT
% margin
199
6.7%
156
5.5%
+27.6%
+1.2pt
+44.0%
+2.0pt
Net debt 559 964 -42.0%
IFRS
- 71 -

INVESTOR PRESENTATION
European leader in hospitality and world leader
in prepaid services
Key strengths Major global Hotels group
Global leader in vouchers, 30 million users per year
Successful implementation of a clear and ambitious strategy
Refocus on the hotel business and Services segment
“Asset-right” strategy decreasing volatility
Recognized brands covering every segment of the hotel sector, from luxury to budget
Hotels‟ EBITDAR margin in top quartile
Prepaid Services model: strong growth and highly cash flow generative
Strong expansion opportunity
Resilience of the budget hotel segment and prepaid services
The deal Date of initial investment: May 2005 through Colyzeo
Increased stake: May 2008 in concert with Colony (27.26% as of Feb. 01, 2011)
Eurazeo‟s investment: €489m in equity and €468m in initial gross debt
Eurazeo‟s direct share: 8.86% as of December 31, 2010,2 seats on a 11-members Board of Directors (in addition to the respective 2 seats granted to Colony)
Financing Eurazeo‟s pro-rated stake of nominal of debt on LH19: €488m (after refinancing)
Maturity: 2015 (extended in November 2010)
Covenants: LTV and Accor‟s/Edenred‟s share liquidity
Key figures Key value-added plans Effective demerger
Hotels: Development of franchise model and acceleration of asset disposals
(€m) 2008 2009 PF 2010
Consolidated data as reported
Revenues 6,776 5,490 5,948
EBITAR 1,872 1,518 1,814
EBIT 569 235 446
Net debt 750 1,321 730
- 72 -
Note: PF = Pro Forma = Excluding discontinued operations (Edenred, demerged during the period, and Groupe Lucien Barrière
and the Onboard Train Services business, reclassified in discontinued operations in accordance with IFRS 5).

INVESTOR PRESENTATION
Intense business activitywith strong financial results
Guidance reiterated
INTEREST
51.7%FULLY CONSOLIDATED
- 73 -

INVESTOR PRESENTATION
1st Half 2011 highlights
Strong financial results
- 2011 H1 Rents +36% ; like-for-like growth by 12% ; 23% on city-center portfolio
- 15% increase in recurring cash-flow
- Printemps (Lyons) renewal rent fixed by Court at €2.1m (vs. €0.4m)
One-off impact on revenues for €7.8m (June 2006- Dec 2010)
Appraisal = €1,607m
- NAV= €40.5 per share
- Low gearing, LTV= 30%
In market liquidity
- Integration of EPRA Index still an objective for March 2012
- 74 -

INVESTOR PRESENTATION
Financials
January – June (€m) H1-2011 H1-2010 Reported changeComparable
change
Rents 45.2 34.0 33.0% 35.8%*
City-center 28.8 17.7
B&B 16.5 16.2
EBITDA
Recurring EBITDA
% margin
38.3
30.5
81.6%
27.4
27.4
80.6%
40.0%
11.4%
1pts
Current cash flow
Recurring cash flow
Per share
29.6
21.7
0.80
18.9
18.9
0.69
56.8%
15.3%
15.1%
15.2%
NAV 40.5 38.5 5.2%
LTV 30% 30% -
IFRS
- 75 -
* Including one-off impact from Printemps; recurring rents: +12.3%

INVESTOR PRESENTATION
Lyons
- 76 -

INVESTOR PRESENTATION
Marseilles
- 77 -

INVESTOR PRESENTATION
Sustained growth in revenueon the back of continued traffic recovery in existing contracts
Recovery in EBITDA margin thanks to the successful renegotiation of UK contracts, a more selective approach on new business and a tight control on costs
Net debt under control,with continued improvement in liquidity management and working capital
INTEREST
81.2%FULLY CONSOLIDATED
- 78 -

INVESTOR PRESENTATION
1st Half 2011 highlights
H1 2011 revenues of €359.5m, up 9.1% vs. H1 2010 on a reported basis and +7.8% on a comparable basis
- Strong performance in the existing business, with rebound in all key segments
- Sustained commercial performance
H1 2011 EBITDA of €23.6m, up 10.8% vs. H1 2010 on a reported basis and +10.1% on a comparable basis
Clean-up of the legacy issues, which have affected the company in the past, and initiatives to enhance the quality of the business, which should both continue to benefit the company in H2 2011
- Successful renegotiation of main loss-making contracts in the UK, which should fully benefit
the company in H2 2011
- More selective approach on new business, to enhance the margin and the cash generation of the portfolio
- Continued control on costs
- 79 -

INVESTOR PRESENTATION
Financials
January – June (€m) H1-2011 H1-2010Reported
change
Change at constant
exchange rates
Revenue 359.5 329.6 +9.1% 7.8%
EBITDA
% margin
23.6
6.6%
21.3
6.5%+10.8% 10.1%
Net debt 634 602
- 80 -

INVESTOR PRESENTATION
European leader in the management of paid car parks
The deal Date of initial investment: April 2007
Purchase price multiple: 16.5x LTM* EBITDA
Enterprise value: €885m (€391m in equity)
Vendor: Investcorp
1st investment of Eurazeo in a non-French company
Eurazeo‟s share: 81.2% as of December - 5 seats on a 6-member Board of Directors
Key strengths Parking market growth driven by:
Growing population leading to increase in the number of cars
Substitution from unpaid to paid parkings
Outsourcing of parking management
Favorable price trend
Strong competitive position: #1 in Europe in terms of parking spaces (1.3 m)
Largest airport car park operator in Europe
Diversified client base and good visibility on contracts
Ongoing value creation initiatives (improvement of operational performance, procurement, yield management, new business,…)
Balanced portfolio: Multi-contract (80% lease, 20% management), multi-country (18), multi-segment (active on every market segment)
Financing Net debt as at December 31, 2010: €608m
Maturity: 2014
Senior and 2nd lien debt, 100% bullet financing
80% hedged until 2012
Key figures (as reported)Key value-added plans
3 key acquisitions:
CPS Europe (#2 on-street player in the UK) WPS (Germany) RPS (Sweden)
Major effort put on overhead optimization
Zero Base program on 3 items: Cost and quality efficiencies, yield management and procurement
(€m) 2006 2007 2008 2009 2010
Consolidated data German standards
Revenues 490 589 642 640 700
EBITDA 53 57 63 53 51
Net debt 596 555 591 608
* LTM: Last Twelve Months
- 81 -

INVESTOR PRESENTATION
Robust growth in H1 2011, with an acceleration in Q2:
Issue volume up 10% like-for-like,with 21% growth in Latin America
Funds from operations up 20% like-for-like,in line with the Group‟s guidance of normalized growth over 10% per year like-for-like
EBIT up 12.1% like-for-like, operating flow-through ratio of 49% before digital extra costs
FY 2011 EBIT target: €340m to €360m
INTEREST
8.90%EQUITY METHOD
- 82 -

INVESTOR PRESENTATION
1st Half 2011 highlights
- 83 -
LflIssue Volume France
Rest of Europe Europe
Latin America
H1 2011 +10.0% +2.3% -0.3% +0.6% +21.0%
o/w Q1 +9.0% +2.9% -2.0% -0.3% +20.5%
o/w Q2 +10.9% +1.7% +1.3% +1.4% +21.5%
Issue Volume: faster growth in Q2, reflecting robust business
in Latin America and first signs of stabilization in Central Europe
Robust business in Employee Benefits (+10% lfl in H1),
Expense Management (+19% lfl in H1) and Public Social
Programs (+17% lfl in H1)
Incentive & Reward negatively impacted by the B2C Kadéos
gift activity (-3% lfl in H1)
Europe: excluding CONSIP contract loss in Italy,
Q2 lfl growth would be up +3.7% (vs. +2.2% in Q1),
reflecting first signs of stabilization in Central Europe
Latin America: Strong momentum in Q2, thanks to job
creation and higher penetration rates and face value
Issue Volume:
Operating revenue (excluding financial revenue):
Operating EBIT (excluding financial revenue):
• Up +10.8% like-for-like, operating flow-through ratio of 49% before digital extra costs
• +1.8 pts lfl improvement before digital extra costs of operating EBIT as a % of operating revenue
LflOperating revenue France
Rest of Europe
Latin America
H1 2011 +9.2% -0.3% +3.0% +18.5%
o/w Q1 +6.6% -1.1% -1.1% +17.4%
o/w Q2 +11.7% +0.6% +7.5% +19.5%
France: Positive trends in meal vouchers: up +4.2% lfl in Q2 (vs. +2.9% lfl in Q1)
Still a difficult situation in the B2C gift segment, due to business disruption with the largest distributor FNAC (down -36.0% lfl in Q2)
Rest of Europe: Better trends in core business mainly driven by first signs of stabilization in Central Europe

INVESTOR PRESENTATION
Financials
January – June (€m) H1-2011 H1-2010 Reported changeComparable
change
Issue Volume 7,264 6,615 +9.8% +10.0%
Operating Revenue 456 422 +8.1% +9.2%
Financial Revenue 44 39 +14.8% +16.0%
Total Revenue 501 461 +8.6% +9.8%
Operating EBIT
% Op. EBIT/IV
123
1.7%
116
1.8%
+5.7% +10.8%
Total EBIT 167 155 +8.0% +12.1%
Net debt 338 320
IFRS
- 84 -

INVESTOR PRESENTATION
European leader in hospitality and world leader
in prepaid services
Key strengths Major global Hotels group
Global leader in vouchers, 30 million users per year
Successful implementation of a clear and ambitious strategy
Refocus on the hotel business and Services segment
“Asset-right” strategy decreasing volatility
Recognized brands covering every segment of the hotel sector, from luxury to budget
Hotels‟ EBITDAR margin in top quartile
Prepaid Services model: strong growth and highly cash flow generative
Strong expansion opportunity
Resilience of the budget hotel segment and prepaid services
The deal Date of initial investment: May 2005 through Colyzeo
Increased stake: May 2008 in concert with Colony (27.26% as of Feb. 01, 2011)
Eurazeo‟s investment: €489m in equity and €468m in initial gross debt
Eurazeo‟s direct share: 8.90% as of December 31, 2010,2 seats on a 12-members Board of Directors (in addition to the respective 2 seats granted to Colony)
Financing Eurazeo‟s pro-rated stake of nominal of debt on LH19: €488m (after refinancing)
Maturity: 2015 (extended in November 2010)
Covenants: LTV and Accor‟s/Edenred‟s share liquidity
Key figuresKey value-added plans Effective demerger
Services: Continuation of strong dynamic development (country/product) and resume acquisitions
(€m) 2007 2008 2009 2010
Consolidated data
Revenues 837 946 902 965
Operating EBIT 224 236 233 248
Net debt 429 323 303 25
- 85 -

INVESTOR PRESENTATION
Growth driven by acceleration of hotel and
health segments growth, recovery of industry
segment in France and international
development
Sales +7.1% and EBITDA +4.0%
INTEREST
81.7%FULLY CONSOLIDATED
- 86 -
INVESTOR PRESENTATION
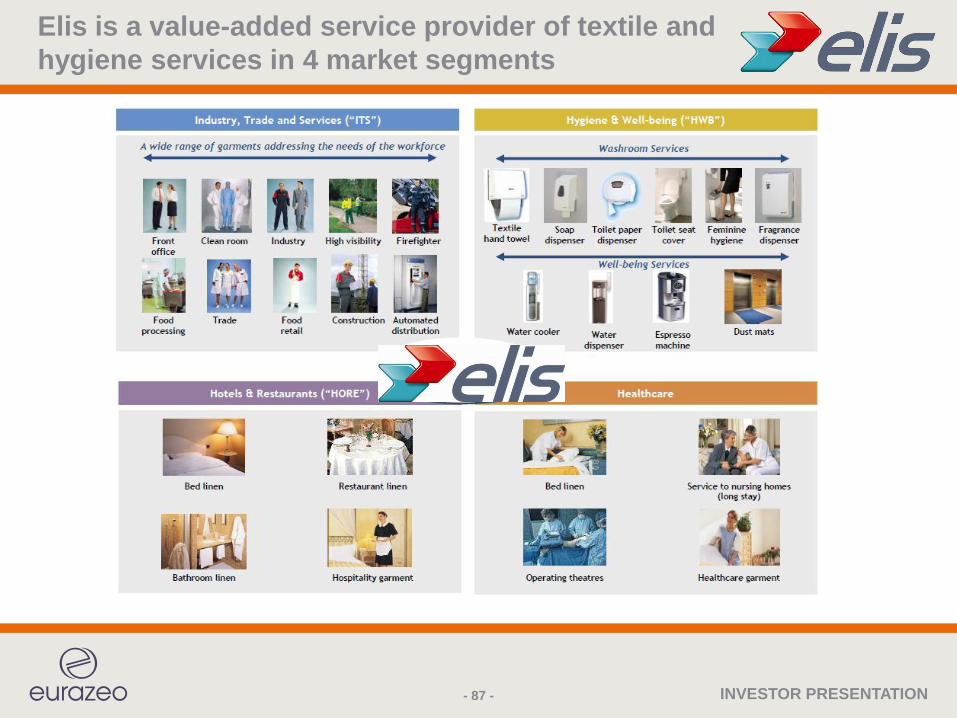
Elis is a value-added service provider of textile and
hygiene services in 4 market segments
- 87 -

INVESTOR PRESENTATION
1st Half 2011 highlights
- 88 -
H1 2011 Like-for-like
Sales +7.1% +2.3%
France +2.1% +2.0%
Hotels & Restaurants +5.1% • Acceleration of the growth
Industry, Trade and Services +1.9% • Slight recovery
Health market +3.4% • Continued growth
International +38.2% +3.2%
Production +5.0% +5.1%
Sales
H1 2011 Like-for-like
EBITDA +4.0% +1.0%
EBITDASlight decrease in margin due to:
• Greater weight of international (margin
slightly lower than in France) in growth
• Excluding one-off effect,
H1 2011 EBITDA: +5.7%

INVESTOR PRESENTATION
Financials
- 89 -
January – June (€m) H1-2011 H1-2010Reported
change
Like-for-like
change
Revenue 559.0 522.0 +7.1% +2.3%
EBITDA
% margin
173.6
31.0%
166.9
32.0%
+4.0% +1.0%
Net debt 1,940 1,857

INVESTOR PRESENTATION
Launch of new products
Product innovation
- 90 -
Extremely promising start of Duo ‘duvet+bedding’ launched in February 2011
More than 50 customers have signed for a monthly revenue of €70k (or €840k on an annual basis)
Ramp-up of Range Exclusiv’ launched in 2010
(1) Rebased to 100
100129 130
166
287
396
469500
532
100
150
200
250
300
350
400
450
500
550
600
nov.-10 déc.-10 janv.-11 févr.-11 mars-11 avr.-11 mai-11 juin-11 juil.-11
Range Exclusiv'
Turnover Evolution (1) - Europe

INVESTOR PRESENTATION
Market opening:
First University Hospital (CHU) in France
- 91 -
• Elis continues to open the market
(defined as service of rental and
maintenance of textile)
• The conversion to outsourcing
of textile maintenance in public
hospitals represents a significant
market and may contribute to the
reduction of costs in the hospitals
This is a key achievementElis has just been selected to outsource
the laundry of Caen University
Hospital. Beyond the contract size,
it is essential to notice that this is
the first university hospital of France
outsourcing this activity.
This Hospital becomes the largest
Healthcare institution of Elis.

INVESTOR PRESENTATION
60
70
80
90
100
ID‟Elis continuous improvement
- 92 -
2010
2011
DecemberOctoberAugustJuneAprilFebruary
The ID‟Elis program continues to deliver
(*) Rebased to 100
An effort has been undertakento reduce the number of Service reps who don‟t develop their customers
60
70
80
90
100
DecemberOctoberAugustJuneAprilFebruary
Continued reduction of detergents per Kg Continued reduction of energy per Kg
20%
30%
40%
50%
60%
DecemberOctoberAugustJuneAprilFebruary
Rate of service reps who haven‟t signed new
contracts qualified as rate of non-signature

INVESTOR PRESENTATION
European policy for
Human Resources development
• Development of partnerships with
Engineering Schools (ex: ENSAM) and
Business Schools (ex: EUROMED) to attract
strong candidates with solid potential
• Start of a European recruitment policy
• Exchange program of middle managers
within the European countries
• Creation of new tools to improve visibility
of Elis brand Vs potential candidates
all over Europe
- 93 -

INVESTOR PRESENTATION
Acquisitions / strategic agreements
Status on integration of September 2010 acquired businesses in Spain
• 2 factories have been closed and production has been reallocated to reduce logistic costs
• Integration of acquired businesses (customer relationship, invoicing and accounting)
within Elis IT systems
• Reorganization of deliveries to optimize logistic costs under process (several routes already
saved but remaining potential identified)
• Overall reorganization costs slightly above expectations
Elis continues to expand in Spain and Switzerland:
• As a result of the acquisition of Blanchatel in H1 2011:
- More than 350 collaborators in Switzerland spread over 7 industrial sites
- Consolidated annual revenues exceeding 34 million Euros in Switzerland
- Reinforcement of leadership in Swiss Romandy in rental and cleaning of textiles for the hospitality and healthcare sectors
• Exclusive agreement with LHA laundry (Andalucia):
- An Elis service center will be created in the premises of the laundry. LHA will concentrate on the production
- With Seville and Archidona, improved coverage of Andalucia (area of more than 10 million inhabitants)
- 94 -

INVESTOR PRESENTATION
European leader in textile rental and cleaning
The deal Date of initial investment: October 2007
Purchase price multiple: 7.3x LTM* EBITDA
Enterprise value: €2,276m (€393m in equity)
Vendor: PAI partners
Eurazeo‟s share: 81.8% - 5 seats on a 7-member Board of Directors
Key strengths European leader with a market share of approx.12% and strong leader in France
Steady growth over the past 40 years and resilient business
Demonstrated capacity to withstand difficult market conditions (SARS, September 11,…)
Long term contracts (3 to 4 years on average)
Consolidation opportunities
Development of cross-selling
Key figures (as reported)
Key value-added plans 8 bolt-on acquisitions in 2010 (International: 4, mainly Switzerland and Spain, France: 4, 5 in 2009, 6 in 2008 and 2 in 2007 (CWS France and CWS Spain)
Significant improvement program launched beginning 2009 on three items:
Revenue growth Cost control Improvement of working capital
Numerous growth initiatives in 2010: Reinforcement of international sales force and of marketing and commercial structure in France
(€m) 2006 2007 2008 2009 2010
Consolidated data
Revenues 936 993 1 036 1 042 1 068
EBITDA 291 318 327 335 347
Net debt 1,842 1,878 1,868 1,920
* LTM: Last Twelve Months
Financing Debt as of december 31, 2010: €1,920m
Maturity : 2014-2017
- 95 -

INVESTOR PRESENTATION
Stable profit and new investments
despite adverse market conditions
3Y Plan initiatives underwayINTEREST
85.1%FULLY CONSOLIDATED
- 96 -
INVESTOR PRESENTATION
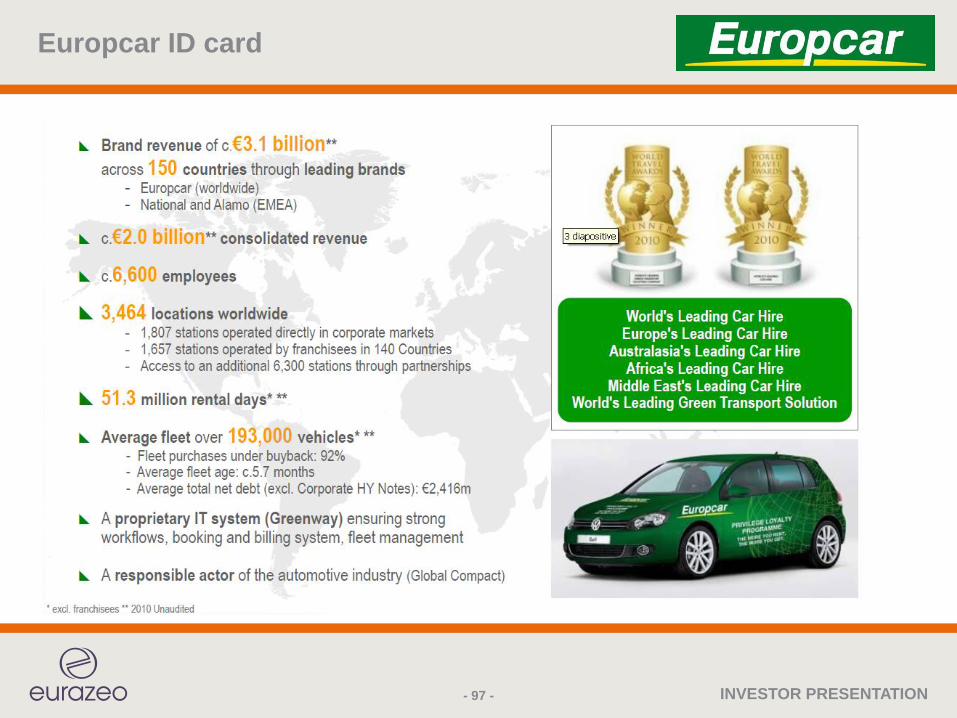
Europcar ID card
- 97 -

INVESTOR PRESENTATION
The European leader with global reach
- 98 -

INVESTOR PRESENTATION
1st Half 2011 highlights
Revenue and adjusted operating income stable vs H1 2010
- Market: recovery limited to low-contributive segments and increased competition
- Europcar: selective approach of business with sustained pricing strategy
(RPD improvement of 1.5% at constant exchange rates) and exit from unprofitable contracts
- Reinvestment of productivity gains and pricing strategy into brand enhancement
and new marketing initiatives
- Stable operating margin on tight fleet management and cost control despite modest revenue
growth
3Y Plan initiatives underway
- Systematic customer satisfaction assessment
- Advertising campaigns
- Sponsoring initiatives (Team Europcar)
- Innovation into new urban mobility solutions (car2go)
- 99 -

INVESTOR PRESENTATION
Financials
(1) Excluding acquisition-related and reorganization expenses, as well as non-recurring items, and after add-back of interest expense included in fleet operating lease rents
(2) Net debt at constant exchange rates including notional debt related to fleet operating lease agreements for €1,329m at end June 2011 (€1,104m at end June 2010)
At constant exchange rates Reported
January - June (€m) H1-2011 H1-2010
At 2011
exch. rates
Change H1-2011 H1-2010 Change
Revenue 909.6 908.4 +0.1% 909.6 903.5 +0.7%
Adjusted Operating Income(1)
% margin
61.4
6.7%
62.5
6.9%
-1.9% 61.4
6.7%
62.2
6.9%
-1.3%
Average net debt(2) 3,110 3,024 +2.8% 3,110 3,019 +3.0%
Average operating net debt(excluding corporate High Yield Notes)
2,285 2,224 +2.7% 2,285 2,219 +2.9%
- 100 -

INVESTOR PRESENTATION
European leading car rental company
The deal Date of initial investment: May 2006
Purchase price multiple: 16.5x 2006 EBIT
Enterprise value: €3,083m (€782m in equity, €663m post syndication)
Vendor/seller: Volkswagen
Eurazeo‟s share: 85.1% - 5 seats on a 6-member Board of Directors
Key strengths Growth perspective: market penetration lower in Europe versus U.S.
Leadership position in Europe + strengthening opportunities in U.S. and Australia/Asia through alliances and acquisitions
Operational excellence, notably through a performing IT system and an efficient fleet management
Long-term relationships with car manufacturers and >90% of fleet covered by buyback agreements
Diversification of fleet composition
Quality of teams and a strong corporate culture
Financing Net debt as at December 31, 2009: €2,849 m
Maturity:
Corporate debt: 2013-2018
Fleet debt: 2012-2017
Key figures (as reported)
(€m) 2006 2007 2008 2009 2010
Consolidated data
Revenues 1,469 2,047 2,091 1,851 1,973
Adjusted EBIT 168 276 253 213 243
Average net debt 2,461 3,178 3,532 3,088 3,220
Key value-added plans Acquisition of Vanguard in „07: Europcar became #1 in the UK and strengthened its leadership in Europe
Commercial strategic Alliance with Enterprise, #1 in the U.S.
Acquisition of master franchisee in Australia/New Zealand in 2008
Strong pricing discipline and improved operating and cash efficiency
Proven ability to adapt fleet and cost to lower demand over the crisis
Development of a mobility service (Hamburg, Germany)
- 101 -

INVESTOR PRESENTATION
Solid organic sales growth
Improved profitability
Strengthened financial structure
INTEREST
21.6%EQUITY METHOD
- 102 -

INVESTOR PRESENTATION
Q2 and 1st Half 2011 and highlights
- 103 -
+6.1%
+18.0%
+6.6%
+7.9%
+5.6%
Group
Latin America
Asia Pacific
North America
Europe
Group
(1)
Solid organic sales growth (+6.1%) in H1 2011
• 3rd consecutive quarter in growth in volumes
• Tougher comparable base: Q2 2010 marked the return of the growth
4.9%
5.7%
Q2 2010 Gross margin improvement
Opex reduction
Q2 2011
+10bps
+70bps
(2)
+80bps
• +10bps increase in gross margin in Q2
• EBITA(2) margin up 80bps to 5.7% in Q2
(2)
Improved profitability
Strengthened financial structure
• Free cash flow before interest & tax of €123m
• Indebtedness ratio at 3.0x EBITDA at June 30 (vs 3.19x at Dec 31, 2010)
• Enhanced financial flexibility and extended debt maturity through a €500m bond issue in May 2011
(1) Q2 2011 over Q2 2010 Growth
(2) At comparable scope of consolidation and exchange rates, excluding the non-recurring effect related
to changes in copper-based cables price and before amortization of purchase price allocation

INVESTOR PRESENTATION
Financials
January – June (€m) H1-2011 H1-2010Reported
change
Like-for-like and
same-day change
Revenue 6,163 5,745 +7.3% +6.1%
EBITA
% margin
334
5.4%
257
4.5%+29.7% +29.4%
Net debt 2,364 2,535
- 104 -

INVESTOR PRESENTATION
Worldwide leading distributor of electrical supplies
The deal Date of initial investment: March 2005
Purchase price multiple: 10.3x 2004 EBITDA
Enterprise value: €3,700m (€464m equity share of Eurazeo, co-investor alongside CD&R and MLPE)
Vendor: PPR
Eurazeo‟s share: 21.7% - 3 seats on a 10-member Board of Directors
Key strengths A world leader: #1 in North America, #1 in Asia-Pacific and #2 in Europe
Fragmented market with further potential for consolidation
Well-balanced portfolio of diversified countries and segments
Strong cash generation even in downturn
Sizeable organic growth opportunities: emerging markets prospects and extension of product range
Strong management team with considerable experience in business-to-business distribution
Reactivity in cost structure managementFinancing Debt as at December 31, 2010: €2,273m
3,2x Net debt/EBITDA
Key figures (as reported)
Key value-added plans 2 transforming acquisitions
Gexpro (US): Rexel becomes #1 in the US
Hagemeyer (Neth.): Expansion of European footprint
Development of promising markets: Renewable energies, energy savings, expertise in specific verticals (mining, oil & gas, utilities) and value-added supply chain services
Gross margin improvement through private label offering and supplier relationship management
Working capital optimization, logistics and capexmonitoring
Consolidated data 2005 2006 2007 2008 2009 2010
Revenues 7 377 9,299 10,704 12,862 11,307 11,960
EBITA 372 581 658 630 450 616
Net debt 2 191 2,861 1,607 2,932 2,401 2,273
- 105 -

INVESTOR PRESENTATION
Strong growth and good profitability
Promising international development
€10m additional investment to support international activities and development in other renewable energies
INTEREST
28.4%EQUITY METHOD
- 106 -

INVESTOR PRESENTATION
1st Half 2011 highlights
Strong financial performance
- EBITDA: up to €16.1m (6 months 2011) vs. €1.0m (6 months 2010)
- Consolidated sales: €66.4m (6 months 2011) vs. €13.0m sales (6 months 2010)
Very promising development in Puerto Rico
- Advanced discussions on a 40 MW contract in Puerto Rico
- Continued efforts to start activities in Africa, India and Brazil
- 107 -
Eurazeo has re-invested €10m in June 2011 to support Fonroche‟s
developments outside France and in other renewable energies

INVESTOR PRESENTATION
Financials
(€m)Jan-June 2011
(6 months)
Jan-June 2010
(6 months)
Revenue 66.4 13.0
EBITDA
% margin
16.1
24.3%
1.0
7.6%
Net debt 53.9 (6.2)
- 108 -

INVESTOR PRESENTATION
Long term rental activity still low but strong rebound in short term rental
Strong increase in profitability thanks to the continuing costs and organizational streamlining policy
INTEREST
13.2%EQUITY METHOD
- 109 -

INVESTOR PRESENTATION
1st Half 2011 highlights
Sales decrease limited to 2.0%, thanks to a balanced effect:
- Long term contract hire sales decrease by 4.6% versus H1 2010
- However, the commercial activity suggests an improvement in activity
in the coming months
- Short term rental sales, still very strong, increase by 12.9% versus H1 2011
Profitability
- Strict control over operations costs and overheads enables the company to further
improve its operational margin
- Further improvement expected in 2011 thanks to initiatives launched on purchases
and to the merger of the two French networks
- As during all the crisis, capital gains on resale of used trucks remain positive
- 110 -

INVESTOR PRESENTATION
Financials
January – June (€m) H1-2011 H1-2010
Revenue 338.1 345.1
EBITA Rental
% of sales
54.5
16.1%
54.3
15.8%
Capital Gains 2.7 1.9
EBITA
% of sales
57.4
17.0%
56.5
16.4%
- 111 -

INVESTOR PRESENTATION
Net revenues up 17% to €73.6m, net profit down 32% to €6.1m due to approximately €8m exceptional items affecting the yoy comparison
Wealth Management is stable after the 2010 impressive growth, while the Advisory business shows significant growth
Successful disposal of DNCA to TA Associates and brokerage activities to Kepler focusing on the core businesses
INTEREST
19.4%
- 112 -

INVESTOR PRESENTATION
1st Half 2011 highlights
Advisory recovers from the crisis especially in the second quarter
- Although the M&A market especially in Italy is still suffering the effects of the crisis, Banca Leonardo performed well in the first semester
- Among others, Leonardo advised Eurazeo and Bridgepoint to acquire Foncia, and on the sale of Italian Network from Gaz de France to the F2i – AXA consortium
Wealth management performance is in line with prior year- Assets under management increased to €5.2bn, from €5.1m as of December 2010 and from €4.9m
as of June 2010
- French structure of Banque Leonardo is being strengthened
€272m proceeds from the sale of DNCA to TA Associates occurred in July- Banca Leonardo keeps 10% interests in Newco and will distribute products in Italy
- Thanks to this sale, a significant dividend could be distributed in 2012
5% stake in Kepler thanks to the sale of “Brokerage and Research”
Strengthening core businesses, M&A advisory and Private Banking- New MDs to be hired to develop the advisory business as well as additional private bankers
- Streamlining of other activities and staff reduction consistently with the disposal of non core activities such as those sold to Kepler
- 113 -

INVESTOR PRESENTATION
Financials
(1) Pro-forma to exclude DNCA (2) H1 2011 after - €1.6m extraordinary losses following an asset sales, H1 2010 including €6.5m non recurring profits
(3) €5,105m as of December 2010 (4) €37m dividends distributed on May 2011 (o/w €6m for Eurazeo)
January – June (€m) H1-2011 H1-2010 (1) Change
Total net revenue 73.6 62.7 +17.3%
Group profit (2)
% margin
6.1
8.3%
9.0
14.3%-31.9%
Total customer financial assets(3) 5,247 4,856 +8.1%
Total equity(4) 547.9 553.0 -0.9%
- 114 -

INVESTOR PRESENTATION
INTEREST
25.1%(1)
EQUITY METHOD
- 115 -
1. On July 2011, Eurazeo bought 50% of Euraleo from Gruppo Banca Leonardo: Eurazeo now fully owns Euraleo
and the economic interest in Intercos passed from 25.1% to 33.6%.
Percentage of control does not change
Sales and EBITDA continue significant
year-on-year increases, confirming 2010
positive trend after 2009 poor results
Order intake and order book even higher than in 2008
Eurazeo increased its stake in Intercosand the economic interest is now 33.6% (1)
INVESTOR PRESENTATION

INVESTOR PRESENTATION
1st Half 2011 highlights
Very strong performance in the first semester
- YTD business volume (Order volume & Sales) is ca. 15% above previous year; order book well ahead of previous year and currently at same level as in June 2008
- EBITDA is ca. 23% above previous year (+€2.8m), EBITDA margin increased by 0.8 pp
- Business growth is still driven by US (+27% or +€8.3m sales yoy(1)) and Skin Care (+43% or +€4.4m(1)). Europe, flat in 2010, is increasing at a faster pace this year (+8.7% or +€6.1m (1))
Net debt decrease to €210.8m (- €50m vs June 2010) as a result of:
- €50m preferred equity injection from majority shareholder Mr. Ferrari
- Several extraordinary and non cash items (refinancing fees and fair value adjustments) and the debt service off-set the positive operating cash flows (ca. €13m on a LTM basis)
- Operating cash flows are slightly negative in H1 2011 (-€1m) because of typical seasonality and to sustain business growth : YTD sales have been only partly cashed-in to date and inventory increased in preparation of higher sales in second part of the year
Willingness to exploit valuable growth opportunities and be closer to the customers
- Serving customer globally improving cost position, optimizing industrial footprint
- New project to open a factory in Brazil, leveraging on existing customers to better serve the 3rd cosmetic market worldwide (1st in terms of volumes) and enabling the entrance into other Latin American countries
- 116 -
1. Changes at current exchange rates and before intercompany eliminations

INVESTOR PRESENTATION
Financials
- 117 -
January – June(€m) H1-2011 H1-2010 Change
Revenue 129.5 112.8 +14.7%
EBITDA
% margin
15.1
11.7%
12.3
10.9%
+22.8%
+0.8 pp
Net debt (1) 210.8 261.0 -19.2%
Average
€/USD 1.40 1.33 +5.3%
End of the period
€/USD1.45 1.23 +17.9%
1. (i) M. Ferrari subscribed and paid up for €25m preferred equity in December 2010 and €25m in March 2011;
(ii) IRS fair value as of June 2011 : €3.9m

INVESTOR PRESENTATION- 118 -
FOCUS
managed by

INVESTOR PRESENTATION
Léon de Bruxelles
- 119 -
• The French specialist in Belgian bistro (mussels/french fries)
• Leader of the diversified themed restaurant market
• 64 restaurants at the end of June 2011
• Able to handle 5 to 7 restaurant openings a year
Activity
Key events• Turnover increase by +10.9% and by + 4.6% on a comparable range
• Openings of 7 new restaurants during the year 2011, 5 have been realized
on the first semester
• Sale of 6 restaurant buildings finalized on the second semester
• A franchise contract has been signed for the opening of a restaurant
in London during the second semester
Turnover (in €m)
At 30/06/2011 55.6
At 30/06/2010 50.1
Var. +11%

INVESTOR PRESENTATION
Dessange International
- 120 -
Key events
• Good performance for the Dessange and Camille Albane franchises
• Completion of the acquisition of the Dessange master franchise in the U.S.
• Further international development
Turnover (in €m)
At 30/06/2011 26.8
At 30/06/2010 26.5
Var. +1%
• 1,000 franchised hair salons under three highly renowned trade names:DESSANGE Paris, Camille Albane and Frédéric Moréno
• Franchise: securing of franchise revenues with guaranteed minimum
• Distribution in the three cosmetics networks of products conceived and made by Dessange
• Dessange Paris Brand licenses (esp. L‟Oréal) for a product sale in department stores
• 40% of the salons outside France
• Around 20 owned and operated “showcase” salons and ownership of the plant that produces the products sold by the network
Activity

INVESTOR PRESENTATION
• World leader of industrial sealing solutions made for refineries, chemical
and petrochemical plants, nuclear power stations and gas pipelines
• Integration of 3 companies:
Siem (Oct. 2006), leader in France
Flexitallic (Oct. 2007), with production sites in the US, the UK and China,
and a distribution network covering 46 countries
- Novus (April 2008), operating in the UK and Middle-East
Financière de Siam
- 121 -
Activity
Key events• Realization of operational synergies, integration of Flexitallic UK
and Novus, implementing centralized corporate functions
• Ongoing finalization of acquisition of 2 UK-based companies
(£2.5m turnover each)
• Further international development (direct setting-up or external growth)
Turnover (in €m)
At 30/06/2011 45.8
At 30/06/2010 41.8
Var. +10%

INVESTOR PRESENTATION
Mors Smitt
- 122 -
• World leader of electromecanical relays:
for the international railway market
(rolling stock and infrastructures)
• Established in more than 25 countries
• 79% of the turnover realised outside France
Activity
Key events • Good visibility on the activity
• Refinancing of the mezzanine the 31st of March 2011
• Great prospects for the new energy measurement systems (MSAV)
with the main world manufacturers
• Potential slow-down on the Chinese railway market due to political issues
• External growth: acquisition of STS Rail Ltd (turnover 2010: €3.2m) in the
UK in April 2011, company located near Birmingham and manufacturing
electromechanical relays according to British specifications
Turnover (in €m)
At 30/06/2011 21.7
At 30/06/2010 21.1
Var. +3%
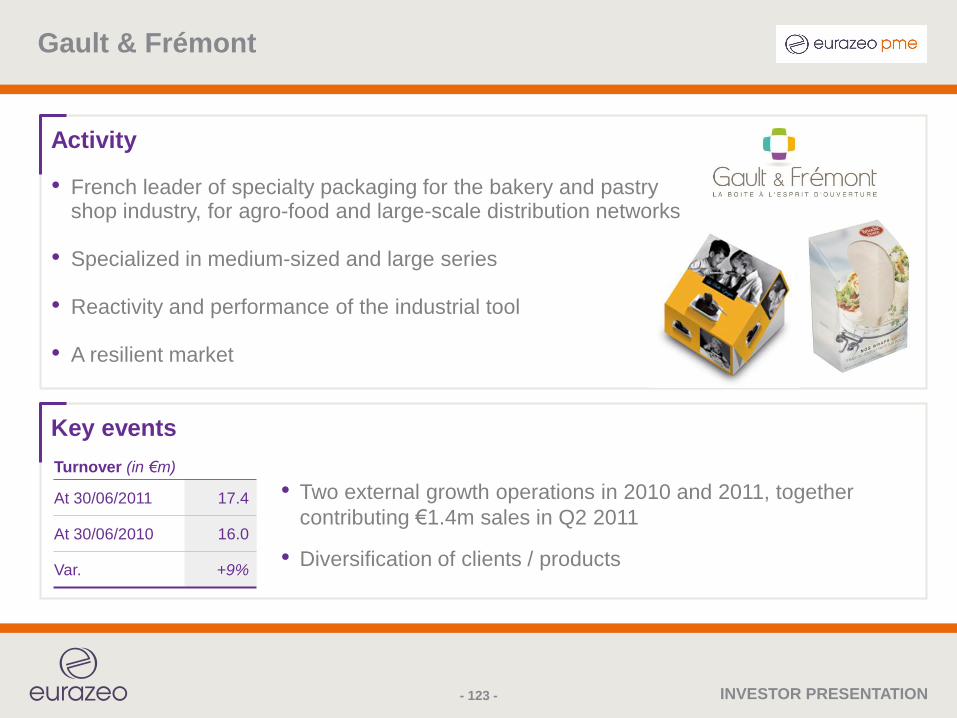
INVESTOR PRESENTATION
Gault & Frémont
- 123 -
• French leader of specialty packaging for the bakery and pastry shop industry, for agro-food and large-scale distribution networks
• Specialized in medium-sized and large series
• Reactivity and performance of the industrial tool
• A resilient market
Activity
Key events
• Two external growth operations in 2010 and 2011, together
contributing €1.4m sales in Q2 2011
• Diversification of clients / products
Turnover (in €m)
At 30/06/2011 17.4
At 30/06/2010 16.0
Var. +9%

INVESTOR PRESENTATION
Appendices
- 124 -
Financial appendices
Group companies‟ detailed information
Other information

INVESTOR PRESENTATION
A pluridisciplinary team of investment professionals
- Patrick SAYER, CEO, 53. Joined Eurazeo in May 2002 after a 20-year experience in investment banking and private equity
- Bruno KELLER, COO, 56. Joined Eurafrance and Gaz et Eaux in 1990 after a 14-year experience in audit and CFO positions
- Philippe AUDOUIN, CFO, 54. Joined Eurazeo in 2002 after a 10-year experience in financial, administrative
and HR positions, including the management and monitoring of investment portfolios
- Virginie MORGON, Director of Investments, 41. Joined Eurazeo in January 2008 after
15 years in investment banking at Lazard in New York, London and Paris
- Luis MARINI-PORTUGAL, Director of Investments, 41. Joined Eurazeo‟s investment team in 1999 after a 6-year experience
in M&A, leveraged finance and financial analysis at JP Morgan in London and Paris.
- Fabrice DE GAUDEMAR, Director of Investments, 37, joined Eurazeo in 2000 after an experience as project manager
for the French Ministry of Defense
Executive Board: investment and management skills
Investment Team: financial engineering
know-how and sector-specific expertise
- A team of close to 20 professionals with proven
know-how in financial engineering and sector-specific
expertise
Management and teams incentivized on value creation
- 125 -

INVESTOR PRESENTATION
A long-term shareholder base and a strong corporate governance
- 126 -
1. Michel David-Weill (3)
Chairman of the Supervisory Board,
Chairman of the Finance Committee
Current term of office expires: 2014
43,089 shares
Corporate Director
2. Jean Laurent* (1) (3)
Vice Chairman of the Supervisory Board
Chairman of the Audit Committee
Current term of office expires: 2013
400 shares
Chairman of the Supervisory Board
of “Foncière des Régions”
3. Jean Gandois* (1) (2) (3)
Chairman of the Compensation and
Appointment Committee
Current term of office expires: 2013
401 shares
Member of the Boards of Directors of
Institut Curie and Vigeo
4. Antoine Bernheim
Current term of office expires: 2012
2,959 shares
Corporate Director
6. Richard Goblet d‟Alviella* (1) (2)
Current term of office expires: 2012
431 shares
Vice Chairman and Managing Director
of Sofina SA
7. Olivier Merveilleux du Vignaux (2)
Current term of office expires: 2014
321 shares
Partner, MVM Search Belgium
9. Anne Lalou* (3)
Current term of office expires: 2014
262 shares
Kea & Partners
10. Bertrand Badré (1) (3)
Current term of office expires: 2014
315 shares
5. Roland du Luart de Montsaulnin*
Current term of office expires: 2012
1,102 shares
Vice President of the French Senate
8. Jacques Veyrat* (3)
Current term of office expires: 2013
262 shares
Chairman and Chief Executive Officer,
Louis Dreyfus SAS
11. Georges Pauget (2)
Current term of office expires: 2012
250 shares
Chairman of AMUN DI and of the SAS
“Économie et Finance Stratégie”
12. Kristen van Riel (3)
Current term of office expires: 2013
250 shares
Chairman of International Real
Returns France SAS and the Edouard
Family Trust Company, Inc.
13. Bruno Roger (3)
Honorary Chairman of the
Supervisory Board
Current term of office expires: 2014
108,530 shares
Chairman, Lazard Frères (SAS) and
Compagnie Financière Lazard Frères
(SAS) and Chairman and CEO, Lazard
Frères Banque
14. Jean-Pierre Richardson (1)
Current term of office expires: 2014
428 shares
Chairman and Chief Executive Officer,
Joliette Matériel SA
15. Marcel Roulet (1) (3)
Current term of office expires: 2014
561 shares
Consultant, Corporate Director
Non voting members
(*) Independent member.
(1) Member of the Audit Committee.
(2) Member of the Compensation and Appointment Committee.
(3) Member of the Finance Committee.

INVESTOR PRESENTATION
Financial agenda
November 10, 20113rd Quarter 2011 Revenues
March 16, 2012FY2011 Revenues & Results
May 10, 20121st Quarter Revenues
August 29, 20121st Half Revenues & results
- 127 -

INVESTOR PRESENTATION
About us
www.eurazeo.com
Research on Eurazeo
• Alpha Value Catherine Radiguer
• Cheuvreux Amandine Latour
• Deutsche Bank David Cerdan
• Exane BNP-Paribas Charles-Henri de Mortemart
• Goldman Sachs Markus Iwar
• HSBC Pierre Bosset
• JP Morgan Cazenove Christopher Brown
• Kepler Pierre Boucheny
• Oddo Quentin Philippe
• SG Patrick Jousseaume
• UBS Denis Moreau
Investor Relations contactsCarole Imbert
+ 33 (0)1 44 15 16 76
Sandra Cadiou
+ 33 (0)1 44 15 80 26
Eurazeo shares
• ISIN code: FR0000121121
• Bloomberg/Reuters: RF FP, Eura.pa
• Indices: SBF120, DJ EURO STOXX, DJ STOXX
EUROPE 600, MSCI, NEXT 150, LPX Europe,
CAC MID&SMALL, CAC FINANCIALS
• 63,141,655 shares in circulation
• Statutory threshold declarations 1%
- 128 -