investors’ day
TRANSCRIPT

Investors’ Day Rüschlikon, 8 December 2015

Investors' Day | Rüschlikon, 8 December 2015
Time Content Management
10.00 – 10.30 Registration
10.30 – 12.00 Group strategic framework Michel M. Liès
Capital allocation at the core of our strategy David Cole
12.00 – 13.00 Lunch break
13.00 – 13.35 Life Capital Thierry Léger
13.35 – 14.10 Corporate Solutions Agostino Galvagni
14.10 – 14.30 Break
14.30 – 15.15 Reinsurance Christian Mumenthaler
15.15 – 15.30 Wrap-up Michel M. Liès
Agenda Investors’ Day 2015
2

Group strategic framework
Michel M. LièsGroup Chief Executive Officer

Investors' Day | Rüschlikon, 8 December 2015
Outperform our peers
• Reinsurance
• Asset Management
• Admin Re®
Smart expansion
• Corporate Solutions
• Longevity & Health
• High Growth Markets
Current position
The leading player in the wholesale
re/insuranceindustry
Strategic goal:
Swiss Re's current strategy has been successful
4

Investors' Day | Rüschlikon, 8 December 2015
Life Capital1
Reinsurance
• To be a focused, lean, global player in large commercial business
• To be a recognised force in the closed life book market
• To be the world's leading reinsurer
• The foundation of our strengths
• A key opportunity for growth
• Providing cash dividends
Corporate Solutions
Swiss Re Group
Admin Re®
Current position
Strategic goal
Current position
Strategic goal
Current position
Strategic goal
P&C L&H
Our business model has positioned Swiss Re as a leading player
5
1 As of 1 January 2016

Investors' Day | Rüschlikon, 8 December 2015
1 EPS CAGR of 10% has been adjusted to 5% for 2015 to account for the distribution of excess capital through the special dividend of USD 1.1bn in April 2015. Methodology is in line with the approach taken for the special dividend of USD 1.6bn paid in April 2014 and USD 1.5bn paid in April 2013
2 Assumes constant foreign exchange rate3 Excl. CPCI4 Cumulative dividends included in ENW per share were translated from CHF to USD using the fx rate of the dividend payment date; dividends included for 2011: USD
3.1 (CHF 2.75), 2012: USD 6.4 (CHF 3.00, or USD 3.3, in addition to the 2011 dividend), 2013: USD 14.5 (CHF 7.50, or USD 8.05, in addition to the 2011 and 2012 dividends), 2014: USD 23.5 (CHF 8.00, or USD 9.03, in addition to the 2011, 2012 and 2013 dividends), 2015: USD 31.1 (CHF 7.25, or USD 7.61 in addition to the 2011, 2012, 2013 and 2014 dividends)
Delivering on the 2011-2015 financial targets has been and remains Swiss Re's top priority
6
3
ROE 700 bps above risk free average over 5 years (2011-2015)
9.2 9.6
13.4 13.7
10.5
14.5
2010 2011 2012 2013 2014 9M2015
avg.2011-2015E
in %
= reported ROE
= 700 bps above US Gov 5 years
8.57.8 8.2 8.6 8.5
89.7 87.8
105.2
123.1
135.7140.9 144.5
2010 2011 2012 2013 2014 H12015
2015E
= reported ENWPS includingcumulative dividends in USD4
= ENWPS @ 10% avg. annual growth (base: 2010)
ENW per share growth plus dividends 10% avg. annual growth rate over 5 years
in USD
98.7
108.5119.4
131.3
3
6.6
7.7
11.913.0
10.210.7
9.2
2010 2011 2012 2013 2014 9M2015
2015E
in USD2
= reported EPS
= EPS @10% avg. annual growth (base: 2010), adjusted for special dividends1
EPS 10% average annual growth rate, adjusted for special dividends1
7.38.0 8.4 8.8

Investors' Day | Rüschlikon, 8 December 2015
We have delivered a market leading total return to our shareholders
7
Swiss Re had one of the highest annualised total returns to shareholders compared to samples of insurers and reinsurers and to reference indices over the period from 2011 to 2015
12%
11%
8%
5%
4% 12%
9%MSCI Index5
STOXX Europe600 Insurance 14%
Sample ofre/insurers4
10%2 22%
15%
Swiss Re
Sample ofreinsurers3
Annualised total return to shareholders (2011-2015)1
1 31 December 2010 to 30 November 2015, based on USD2 Includes special dividends3 Weighted average of Everest Re, Hannover Re, Munich Re, RGA, RenRe, SCOR4 Weighted average of ACE, Allianz, AIG, AXA, XL Group, Zurich, and reinsurers mentioned in footnote 35 MSCI Daily Total Return Gross World Index
Dividend driven returnShare price development

Investors' Day | Rüschlikon, 8 December 2015
Swiss Re faces various challenges and opportunities
8
Low margins
Evolution of primary players with rich
customer insights
Low yield, low growth environment;regulatory changes
Current
Future
Impact of technology
Industry consolidation
Volatility in High Growth Markets
Reshuffling of value chain
New and enlarging risk pools
Investors' Day | Rüschlikon, 8 December 2015
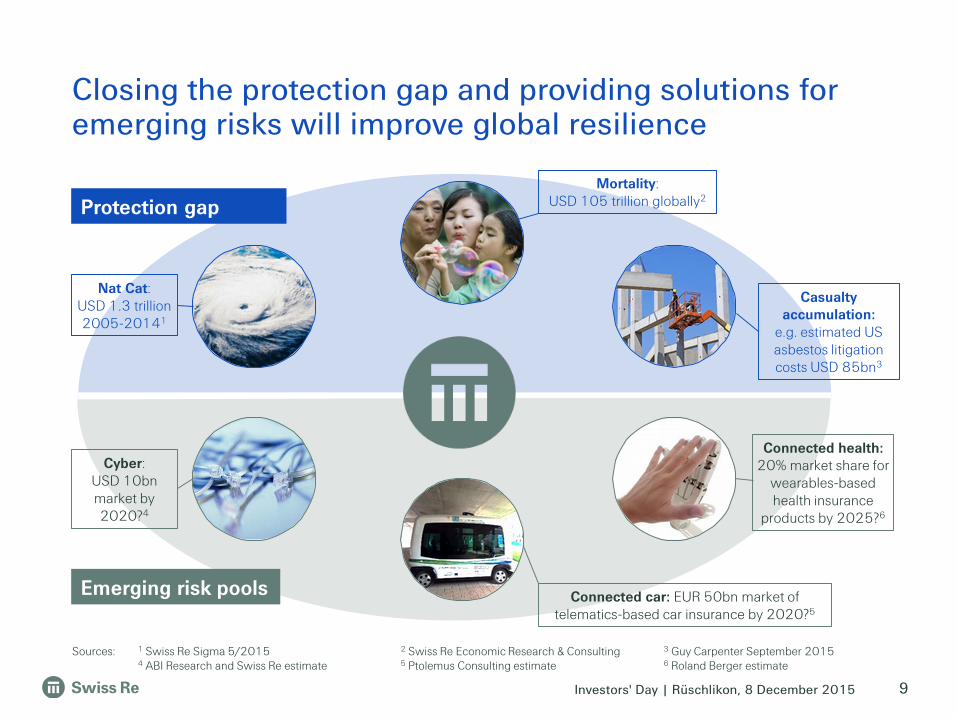
Closing the protection gap and providing solutions for emerging risks will improve global resilience
9
Nat Cat: USD 1.3 trillion 2005-20141
Mortality:USD 105 trillion globally2
Casualty accumulation:
e.g. estimated US asbestos litigation costs USD 85bn3
Connected car: EUR 50bn market of telematics-based car insurance by 2020?5
Connected health: 20% market share for
wearables-based health insurance
products by 2025?6
Emerging risk pools
Protection gap
Sources: 1 Swiss Re Sigma 5/2015 2 Swiss Re Economic Research & Consulting 3 Guy Carpenter September 20154 ABI Research and Swiss Re estimate 5 Ptolemus Consulting estimate 6 Roland Berger estimate
Cyber: USD 10bn market by 2020?4
Investors' Day | Rüschlikon, 8 December 2015
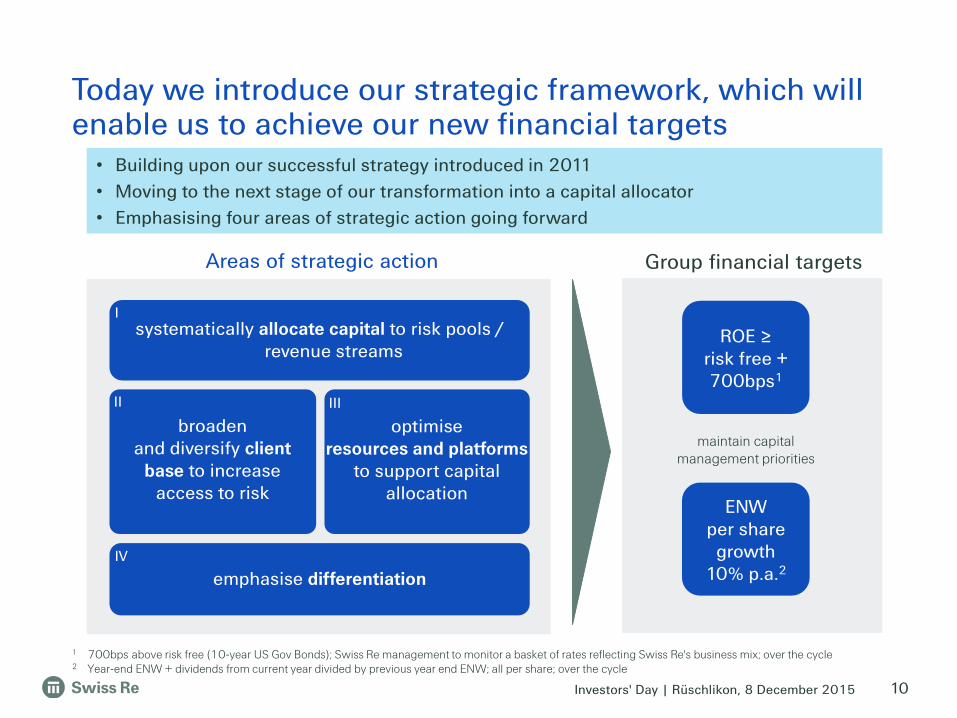
Today we introduce our strategic framework, which will enable us to achieve our new financial targets
10
Areas of strategic action
broadenand diversify client
base to increase access to risk
optimise resources and platforms
to support capital allocation
systematically allocate capital to risk pools / revenue streams
emphasise differentiation
I
II III
IV
Group financial targets
maintain capital management priorities
ROE ≥risk free + 700bps1
ENWper share
growth10% p.a.2
• Building upon our successful strategy introduced in 2011
• Moving to the next stage of our transformation into a capital allocator
• Emphasising four areas of strategic action going forward
1 700bps above risk free (10-year US Gov Bonds); Swiss Re management to monitor a basket of rates reflecting Swiss Re's business mix; over the cycle2 Year-end ENW + dividends from current year divided by previous year end ENW; all per share; over the cycle

Investors' Day | Rüschlikon, 8 December 2015
Successful aspects of our business model are affirmed under our strategic framework
11
Group strategic framework focuses on systematically allocating capital and resources to provide optionality for value creation
• Continued focus on wholesale re/insurance
• Pursue selected strategic initiatives to access attractive risk poolsWholesale
re/insurance
Global scale and
diversification
• Global reach enabling efficient capital allocation to achieve profitable growth
• Benefits from geographic, business mix and client segment diversification
• Superior balance sheet, credit rating and solvency position allowing flexibility
• Underwriting and asset management discipline with superior risk selectionBalance sheet
for risk
Premium brand
• A leading reinsurance franchise with over 150 years of history
• A preferred partner resulting in long and deep client relationships
Strategic controller
• Group focus on strategy, capital and talent while empowering Business Units to execute
• Business Unit structure benefits from flexibility and efficiency

Investors' Day | Rüschlikon, 8 December 2015
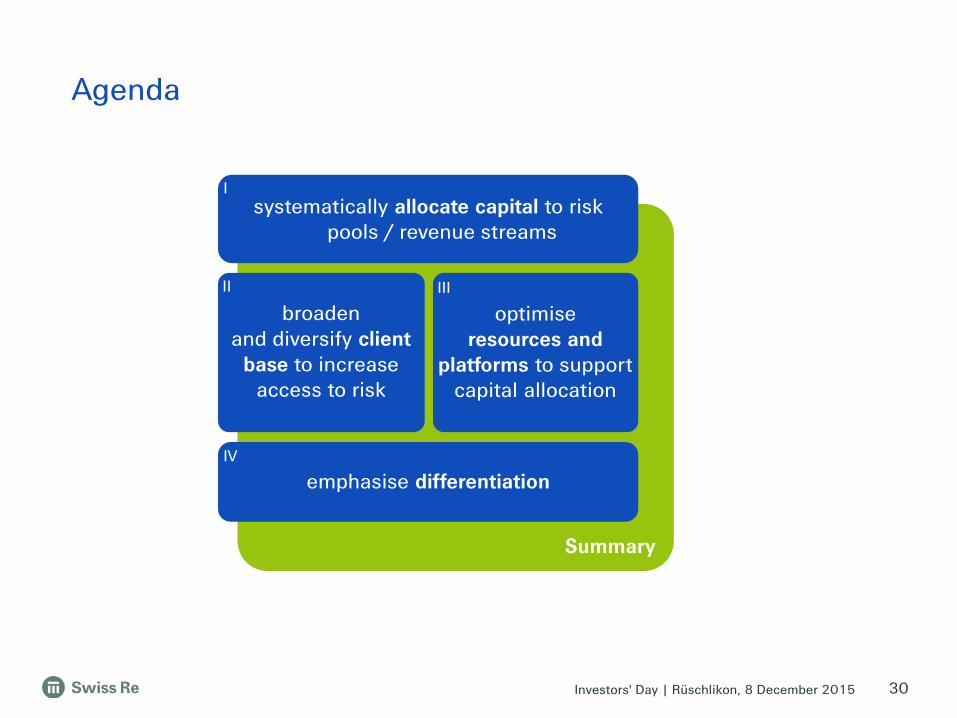
Agenda
12
broadenand diversify client
base to increase access to risk
optimise resources and
platforms to support capital allocation
systematically allocate capital to risk pools / revenue streams
emphasise differentiation
I
II III
IV

Investors' Day | Rüschlikon, 8 December 2015
Key drivers leading to outperformance in value creation
13
I
II III
IV
A multi-risk book provides numerous advantages in addition to capital related diversification benefits
1 EVM, US GAAP, cash flow
Risk selection
Capitalallocation
Portfoliomanagement
Extensive R&D providing a competitive advantage (requires economies of scale)
Active monitoring and hedging of liabilities and continued optimisation of the asset portfolio
Capital deployment based on expected return
Proprietary modelling capabilities to quickly adapt models based on lessons learnt and outlook
Maximise absolute economic profit subject to risk tolerance constraints
Optimal portfolio mix to meet different hurdle rates1

Investors' Day | Rüschlikon, 8 December 2015
Swiss Re actively manages liability and asset risk pools
14
Asset risk pools
Liability risk pools
Mortality
Longevity
Health
Property
Specialty
Casualty
• Swiss Re benefits from diversification through access to different pools of liability and asset risks
• Group has the flexibility to (re-)allocate capital between lines of business, asset classes and regions
Cash and short-term investments
Government bonds
Equities & alternatives
Credit investments
I
II III
IV
P&C Reinsurance L&H Reinsurance Corporate Solutions Life Capital1
1 Effective 1 January 2016Note: Bars illustrate current exposure to risk pools
Illustrative

Investors' Day | Rüschlikon, 8 December 2015
Swiss Re’s portfolio selection maximises value creation
15
Bubble size reflects asset allocation
• Asset risk selection is based on the requirement to match insurance liabilities within strict risk limits and the search for attractive risk-return patterns
• Liability risk selection balances Swiss Re’s profitability levels and attractiveness of markets
• Swiss Re targets an optimal portfolio of asset and liability risks to balance short-term targets with long-term shareholder value creation
I
II III
IV
Credit Investments
Equities & alternatives (incl. PrincipalInvestments)
Risk HighLowLow
Re
turn
Government bonds
Selected asset risks
High
Cash and short-term investments
High risk/return
Low risk/return
Bubble size reflects premium volume
Risk HighLowLow
Re
turn
High risk/return
Low risk/return
Selected liability risks
High
Property Re(incl. Nat Cat)
Health Re
Specialty Re
Property Commercial
Note: Return based on historic 3 year economic profitability. Risk based on standalone SST risk capital requirements.
Specialty Commercial

Investors' Day | Rüschlikon, 8 December 2015
Agenda
16
broadenand diversify client
base to increase access to risk
optimiseresources and
platforms to support capital allocation
systematically allocate capital to risk pools / revenue streams
emphasise differentiation
I
II III
IV

Investors' Day | Rüschlikon, 8 December 2015
Three ways to broaden and diversify our access to risk
17
I
II III
IV
Geographies
• Extend leadership in mature markets
• Maintain market leadership in High Growth Markets (HGM)
Clients Risks
• Offer tailored solutions
• Access new clients
• Develop innovative approaches
• Leverage Swiss Re’sknowledge and thought leadership
• Enhance capabilities and new products

Investors' Day | Rüschlikon, 8 December 2015
Geographies – Dedicated initiatives in place to maintain leading position in HGM
18
Dedicated strategic initiatives across Swiss Re in place to remain the leading wholesale re/insurer in HGM
Reinsurance
Expansion in focus countries
• Organic growth
• Partnerships
Corporate Solutions
Further broadening the footprint
• Organic growth
• New offices
• Acquisitions
Aspiration for 2020
30%
20202012 2014
27%15%
30% HGM premium share
Principal Investments Swiss Re Group
Optimise diversification
• Coordination and advisory for HGM
Investment in selected HGM countries
• Increase exposure
• Complement HGMfocus of Business Units
I
II III
IV

Investors' Day | Rüschlikon, 8 December 2015
Clients – Broadening our access through profitable growth initiatives
19
Corporate Solutions Life Capital
Large corporates Insurance companies
Mid-size corporates
New forms of exposure to client pools
Continued focus
• Dedicated growth initiatives targeting Regional & National companies in Reinsurance, mid-size corporates in Corporate Solutions, and distribution partners in Life Capital
• Innovative approaches to access new client pools, extending beyond the traditional business models
Dedicated growth initiatives
Global insurance companies
Large insurance companies
Regional and National insurance companies
Governments & supranationals
Reinsurance
Principal Investments
Distribution partners
I
II III
IV
Pension funds

20
I
II III
IV
VietnamAgriculture yield cover
Pacific Islands Earthquake and
tropical cyclone risk
UruguayEnergy
production shortfalls
due to drought
IndiaWeather insurance
for farmers
CaribbeanHurricane,
earthquake and excess rainfall risk
BeijingAgricultural risk
TurkeyEarthquake pool
Louisiana Hurricane risk
MexicoEarthquake/hurricane
and livestock risk
BangladeshFlood
insurance
African Risk CapacityGovernment drought
insurance pool
FloridaHurricane risk
United KingdomFlood risk
Shenzhen typhoon/rainfall Thailand
Crop insurance
• First dedicated public sector team in the reinsurance industry
• Over 200 closed transactions since 2006
• Develop insurance, reinsurance and capital markets solutions onall perils (natural disasters, weather risks, pandemics, etc.)
• Global footprint
• Pioneer in emerging and industrialised markets
Clients – Swiss Re Global Partnerships enables the Group to broaden our client base and address the protection gap

Investors' Day | Rüschlikon, 8 December 2015
Health lines are emerging as key markets
Risks – Selected access to additional risk pools
21
Focusing on product development leveraging aging, technology, and data to increase share in global medical reinsurance
Helping establish infrastructure debt as tradable asset class to strengthen long-term investors’ capacity to support the real economy
Investing significantly in the understanding of cyber risks, rolling out solutions prudently in the primary and reinsurance space
Building on excellent biometric data to develop innovative solutions in the primary insurance and reinsurance market
I
II III
IV
Infrastructure investment enhances economic growth
Expected % of GDP spending requirement in infrastructure vs
historicals
Required spending(to achieve 1.7% p.a. real GDP growth)
Historical average, 2002-11
Global health premiums,USD bn
Infrastructure investmentsHealth portfolio
USD 105tr mortality protection gap
Mortality gapCyber
USD 2bn premiums globally in 2014
Source: Swiss Re Economic Research & Consulting; Swiss Re estimates; McKinsey Global Institute
2.9
2.8
Continental Europe
Europe2.6
UK and Ireland 3.4
2.3
2.31 000
500
0
1 500
2 000
20
15
E
20
05
20
25
E
20
20
E
20
10
5-10
2015E
6-10
2025E
2.6
2020E
3
12-18
7-84-6
2-5
0.5
USRoW
Cyber market premiums (base case), USD bn
Mortality protection gap by region, USD trn
5823
17
7Europe
NorthAmerica
Latin America
Asia

Investors' Day | Rüschlikon, 8 December 2015
Agenda
22
broadenand diversify client
base to increase access to risk
optimiseresources and
platforms to support capital allocation
systematically allocate capital to risk pools / revenue streams
emphasise differentiation
I
II III
IV

Investors' Day | Rüschlikon, 8 December 2015
Swiss Re optimises resources and platforms to support capital allocation
23
Examples
Dynamic and forward-looking capital allocation supported by agile resources and platforms
• Use of smart analytics and cognitive computing to improve our underwriting capabilities (e.g. impact from 200 examples identified)
Smart analytics
• Alignment of the workforce to actively support our HGM strategy (e.g. increase of FTE in Latin America and Asia by 421% and 66% respectively since 2011)
Talent
• Leverage distribution platforms to maximise value from our wholesale model (e.g. distribution partnerships in Life Capital via elipsLife and iptiQ)
Distribution platforms
• Flexible access to funding for our businesses (e.g. access to external funding recently established for Swiss Re Ltd, Corporate Solutions and Life Capital)
Funding platform
• Simplification, modernisation, and integration of IT architecture (e.g. 20% net reduction of applications, consolidation to two main data centres)
IT platforms
• Continued development of our AM capabilities (e.g. first Swiss company to receive Renminbi Qualified Foreign Institutional Investor license)
Asset Management
I
II III
IV

Investors' Day | Rüschlikon, 8 December 2015
`
Long-term focus Corporate SolutionsPrincipal Investments (PI)
Targeted by Reinsurance and Corporate SolutionsLong-term focus Reinsurance
HGM
Swiss Re has more than doubled its workforce in HGMsbetween 2011 and 2015
24
India2
China
Indonesia
Brazil
Mexico
1 Including Shared Service Centre of 430 FTEs in 2011 and 580 FTEs in 20152 Bangalore 41% of Asian FTEs in 2015
We successfully increased our workforce in HGMs and will continue in line with our 2020 aspiration
Latin America FTEs
~730
Jun 2015Jan 2011
~140
Asia FTEs
~1 4301
Jun 2015Jan 2011
~8601
Africa FTEs
~60
Jun 2015Jan 2011
~40
I
II III
IV

Investors' Day | Rüschlikon, 8 December 2015 25
Swiss Re adopts smart analytics and cognitive computing to further extend its competitive positioningSelected examples from over 200 delivered cases
Transparent motor China
Reinsurance
For China, we have built a sophisticated model predicting motor accident frequencies leveraging a wide range of data sources
Rapid sales analytics
Corporate Solutions
Improve sales effectiveness: binding likelihood increases by 20% when sales activities happen after quotes
Screening risk engineering reports
Through text analytics, we structure a large number of property risk reports, reducing the single risk report analysis time down from 4 hours to real time
Contract intelligence hub
Group
Client and market intelligence
Reinsurance
We have developed an advanced contract analytics solution covering all re/insurance contracts from all lines which allows us to analyse clauses
Analysing internal and external communication, we quantify Swiss Re client relationships and identify hot topics and market trends
• Competence centre for smart analytics (30 data scientists, 200 smart analytics affine re/insurance professionals)
• Cognitive computing competence centre which Swiss Re is jointly building with IBM
I
II III
IV
Corporate Solutions

Investors' Day | Rüschlikon, 8 December 2015
Agenda
26
broadenand diversify client
base to increase access to risk
optimiseresources and
platforms to support capital allocation
systematically allocate capital to risk pools / revenue streams
emphasise differentiation
I
II III
IV

Investors' Day | Rüschlikon, 8 December 2015
Active differentiation remains pivotal to extending our lead as a knowledge company and allocator of risk capital
27
'We’re smarter together'
Client relationships
• Preferred partner
• Decade-long relationships
• Global presence and broad product offering
Knowledge company
• Thought leadership
• Technical expertise
• Risk insights and modelling
• Proprietary data and research
Financial strength
• Capital strength
• Financial flexibility
• Integrated risk management and systematic ALM
• Distinctive access to contingent capital
I
II III
IV

Investors' Day | Rüschlikon, 8 December 2015
Swiss Re benefits from direct access to clients in all Business Units
28
• Swiss Re differentiation based on unique access to clients and development of tailored risk solutions
• Direct client interactions also for intermediated business
Percentage of premiums derived from non-intermediated business, 9M 2015
1 Reflects Admin Re®
I
II III
IV
P&C Reinsurance L&H Reinsurance Life Capital1Corporate Solutions
52% 11% 100%96%

Investors' Day | Rüschlikon, 8 December 2015
Delivering distinctive thought leadership, R&D and industry dialogue through unique channels
29
Industry-leading “sigma” publications
Distinctive thought leadership State-of-the art delivery
Large and highly educated pool of talents
• 300 FTEs working on research matters
• 30 FTEs in Economic Research & Consulting, 50 FTEs in nat cat modelling
Client and expert events
• 100+ client and expert events per year hosted at the Centre for Global dialogue for 1 000+ clients (15 000+ people)
• 50+ client training courses offered
On-the-go access to knowledge
Research and publications in
partnership with leading institutions
I
II III
IV
Our thought leadership is a true driver of business impact: highly informed decisions, access to world-class talents, state-of-the-art support for clients, impacting societal development
First-class client events
Acclaimed proprietary research into trends and products
Wide-ranging global database, covering all types of insurance markets and products
Investors' Day | Rüschlikon, 8 December 2015
Summary
broadenand diversify client
base to increase access to risk
optimiseresources and
platforms to support capital allocation
systematically allocate capital to risk pools / revenue streams
emphasise differentiation
I
II III
IV
Agenda
30

Investors' Day | Rüschlikon, 8 December 2015
Current
Future
Our strategic framework positions us strongly vis-à-vis current and future challenges and opportunities
31
Growing tailored solutions
Broadening our access to client and risk pools
Optimised AM and funding
Agile capital (re-)allocation & wholesale approach
Investing to differentiate on knowledge leadership
Creating optio-nality through strategic partnerships
Embedding cognitive computing in our UW
Bringing new sustainable solutions to the market
Examples Examples
Low margins
Low yield, low growth environ-ment; regulatory
changes
Evolution of primary players
with rich customer insights
Impact of technology
Industry conso-lidation
Volatility in High Growth
Markets
Reshuffling of value chain
New and enlarging risk pools

Investors' Day | Rüschlikon, 8 December 2015
• P&C Reinsurance remains a key contributor through differentiation and underwriting discipline
• L&H Reinsurance benefits from increasing demand
• Corporate Solutions expands into Primary Lead and broadens the footprint
• Life Capital pursues growth opportunities
• Focus on attractive opportunities above our return hurdles
• Sustain long-term earnings through effective portfolio steering
• Deliver market leading returns
Our four areas of strategic action create long-term value for our shareholders
32
Profitability: ROE
Growth: ENW per share
broadenand diversify client
base to increase access to risk
optimise resources and
platforms to support capital allocation
systematically allocate capital to risk pools / revenue streams
emphasise differentiation
I
II III
IV
Capital allocation at the core of our strategyDavid ColeGroup Chief Financial Officer

Investors' Day | Rüschlikon, 8 December 2015
Reinsurance
Life Capital4
Swiss Re Ltd
USD 2.2bn2USD 3.0bn2USD 8.0bn2 USD 1.4bn2
Reinsurance Corporate Solutions Admin Re®
1 Distribution to shareholders of approx. USD 10.6bn from 2012 to 2015 incl. USD 2.6bn dividends paid end of April 2015 and up to CHF 1.0bn for the public share buy-back
2 Internal dividend flows from January 2012 to September 20153 PI has paid to Group dividends of USD 0.4bn between 2012 and September 20154 As of 1 January 20165 Transaction completion expected early 2016
1.0
12
1.2
14 15
2.73.1
13 151312
0.30
1.0
1.8
14
0.2
13
0
14 15
0.7
12
0.5
1413
1.1
15
0.40.4
12
0.4
Inorganic Deleveraging Organic
P&C L&H
Swiss Re’s capital allocation aims to deliver sustainable shareholder value
34
Usage of funds
Capital return
USD 10.6bn1 distributionto shareholders
PI3
Agile use of funds to deliver shareholder value:
• Capital return of up to USD 10.6bn to shareholders since 2012
• Acquisitions, e.g. Sun Alliance China, Guardian5
• Significant deleveraging
• Organic growth through capital (re-) allocation

Investors' Day | Rüschlikon, 8 December 2015
We use a holistic capital management and performance framework to systematically allocate capital
35
Performance measurement
Evaluate performance and (re-)allocate capital
• Monitor performance based on an integrated KPI framework
• Relentlessly re-allocate capital (away from underperforming portfolios and towards best performing ones)
Generate sustainable shareholder value
• Close the protection gap and respond to emerging risk pools by delivering innovative solutions
• Leverage distinctive skills and capabilities of Swiss Re Group
Strategic ambition
Define capital allocation for liability and asset risk pools
• 45 liability portfolios and key asset classes considered for capital allocation
• Assess risk pools based on historic performance and future outlook
• Optimise financial metrics (EVM, US GAAP, cash flow) and risk appetite
Capital allocation
Execute capital allocation to portfolios
• Business Units proactively plan and execute on shared vision for the target liability portfolio to deliver sustainable shareholder value
• Capture attractive market opportunities accordingly
Business planning
II III
IV
I
1
2
3
4

Investors' Day | Rüschlikon, 8 December 2015
We allocate capital to risk portfolios in a consistent manner across the Group
36
US GAAP perfor-mancemetric
EVM perfor-mancemetric
• Developed single-year and multi-year view of performance on portfolio level
• Use key financial metrics as support for capital (re-) allocation decisions
• Break down Group targets to liability portfolios
Illustrative – performance per portfolio• Cash flows discounted and recognised at inception
• Capital costs recognised
• Cash flows recognised over lifetime of contract
• Capital costs not taken into account
Illustrative – performance per portfolio

Investors' Day | Rüschlikon, 8 December 2015 37
Swiss Re continues to maintain a high quality, well-balanced investment portfolio
• High-quality credit investments have been steadily added to the portfolio since the re-balancing in 2013
• Additional investments include a diversified mix of corporate bonds across various currencies, high quality loans, securitised products and credit ETFs
• Equities and alternative investments were reduced in 2014 through sales of equity securities and hedge fund redemptions
• Acquisition of Guardian is expected to increase the Group’s overall allocation to credit by approximately 6%pts. The quality of the credit portfolio remains high
23%17% 12% 11%
32% 39%41%
37%
33% 35% 38% 44%
11% 8% 8% 7%1% 1% 1% 1%
0%
10%
20%
30%
40%
50%
60%
70%
80%
90%
100%
End FY 2013 End FY 2014 End Q3 2015 End Q3 2015(Estimated pro formaimpact of Guardian)
Other
Equities & alternatives (incl.Principal Investments)
Credit investments
Government bonds
Cash and short-terminvestments

Investors' Day | Rüschlikon, 8 December 2015
6.3%
5.0%5.3%
4.7%
1.8%
3.5%
4.4%4.0%
3.6% 3.7% 3.8%
0%
1%
2%
3%
4%
5%
6%
7%
2005 2006 2007 2008 2009 2010 2011 2012 2013 2014 9M 2015
10-year avg US Treasury risk-free rates ROI Running yield
• Asset re-balancing helped mitigate the effect of low yields on the return on investments in recent years
• Decline in interest rates has only been partially reflected in the running yield development, demonstrating the impact of re-balancing on portfolio income
• Notwithstanding the recent performance, a prolonged low yield environment would likely represent a headwind to the investment result going forward
38
Steady investment performance through active asset re-balancing despite continued low yield environment
1 Historical ROIs as published; 2011 and later based on new calculation method, as initially disclosed at Investors' Day 2012
1

Investors' Day | Rüschlikon, 8 December 2015
2013 201420122011
We will maintain a dynamic allocation of capital under our strategic framework
39
1 Dividends based on year accrued2 Excludes BU-funded and debt-funded acquisitions
Acqui-sitions2
-
Divestments
0.2
0.9
Dividends1
2.6
Business reinvestmentsAcqui-
sitions2
-
Divestments
0.6
1.4
Dividends1
2.8
Business reinvestments
0.2
Dividends1
1.1
Divestments
Business reinvestments
1.5
Acqui-sitions2
1.1
Dividends1
3.1
Divestments
-
Business reinvestments
1.3
In 2015
• Share buy-back has started, for an amount up to CHF 1.0bn purchase value
• Announced acquisition of Guardian will absorb GBP 1.0bn in early 2016
• Group capitalisation remains very strong
Swiss Re Group view, end of year figures, USD bn
-
Acqui-sitions2
Net Income 2.6Shareholders’ equity 29.6
Net Income 4.2Shareholders’ equity 32.9
Net Income 4.4Shareholders’ equity 31.9
Net Income 3.5Shareholders’ equity 34.8

Investors' Day | Rüschlikon, 8 December 2015
Swiss Re's risk tolerance criteria are the basis for our capital management, risk steering and limit setting
After an extreme loss event (99% shortfall)
able to meet
Extreme loss criteria
Group
Rating AARespectability criteria
Liquidity
• Level reflects regulatory and client expectations
• To have sufficient capital to be in a position to continue to write new business, for all major entities
• Sufficient liquidity to fund subsidiary recapitalisations where needed and cover committed requirements in the year following the stress loss
Capital criteria Liquidity criteria
Swiss Solvency Test 100%
Swiss Solvency Test 185%
40
Risk tolerance represents the amount of risk Swiss Re is willing to accept within the constraints imposed by its capital and liquidity resources, its strategy, and the regulatory and rating agency environment
Risk tolerance objectives:
• Maintain capital and liquidity that are sufficiently attractive from a client perspective, and that meet regulatory requirements and client expectations ("respectability criteria")
• Be able to continue to operate following an extreme loss event ("extreme loss criteria")
• Avoid material operational risks that could subject the Group to large operational losses with corresponding consequences from an economic, reputational or regulatory perspective
Funding amounts required to be held at the Swiss Re Ltd level, as well as the external dividend proposals take into consideration both sets of constraints

Investors' Day | Rüschlikon, 8 December 2015
208% 213% 223%245% 241%
48.7
SST 1/2012SST 1/2011
18.5 19.819.1
40.7
SST 1/2013
38.552.2
21.6
SST 1/2015
52.6
23.6
SST 1/2014
Swiss Re's very strong capital position enables the capital allocator role for the Group
41
Swiss Re’s capitalisation remains very strong across multiple metrics
• Group SST ratio comfortably above respectability level; impact of the acquisition of Guardian is expected to be approximately 20-25%pts
• Swiss Re's excess capital is well above the capital required for a S&P AA rating
• Group accessible capital (after deduction of Principal Investments) amounted to USD 4.5bn at the end of Q3 2015
SST target capitalSST risk-bearing capital
185% Group SST respectability level
USD bn
SST ratio

Investors' Day | Rüschlikon, 8 December 2015
We ensure an integrated approach to managing current and future risks
42
Development since SST 1/2015
• Pre-Guardian, SST target capital decreased mainly due to higher interest rates reducing the market value margin, which forms part of the SST adjustments
• Guardian acquisition is expected to add market (credit spread) and credit (default & migration) risk, while the insurance risk of the transaction is expected to add to Swiss Re's insurance risk diversification
USD m, pre-tax1
Economic net worth +216 +411
Change in interest rates +50bps +100bps
Change in credit spreads +50bps +100bps
Economic net worth -3 754-1 944
Change in market values2 -10% -25%
Economic net worth -958 -2 394
SST 1/2015 in USD bn
1 All sensitivities are assumed to have taken effect on 31 December 2014 and no management actions are included in this analysis2 Equities and alternative investments, excl. real estate
Diversification benefit 13.3
2.9Credit (incl. credit UW)
19.2
SST target capital 23.6
SST adjustments 4.4
99% TailVar
Life and Health 8.0
Property and Casualty 9.5
Financial market 12.1
Group regulatory capital requirement Sensitivities on ENW

Investors' Day | Rüschlikon, 8 December 2015
One regime more conservative than the other
We have gained extensive experience in complying with economic solvency regimes
43
Swiss Re operates under a comprehensive economic and risk based solvency regime since 2008
• SST is a more conservative economic-based regime than Solvency II
• EU confirmed equivalence with Solvency II
• Swiss Re’s internal model serves both SST and Solvency II; both the Swiss regulator (FINMA) and Luxembourg’s regulator (CAA) have provided regulatory approval
• Initial application of Standard Formula approach under Solvency II
• Continued engagement with the PRA on future internal model approval
UK
• Swiss Re's internal model approved by the local regulator (CAA)
• External auditor issued an unqualified positive assurance opinion on the internal model for 2013, 2014 and 2015
Luxembourg Key differences: SST vs Solvency II (internal model)
SST Solvency II
Risk measure • Based on 99% TailVaR • Based on 99.5% VaR
Market value margin/
Risk margin
• Part of available and required capital
• Part of technical provisions
Deferred Tax• Not accounted for • Loss absorbing effect
on required capital
Operational risk • Qualitative treatment • Quantitative treatment
Valuation (discounting)
• Market consistent valuation based on replication
• Option for volatility or matching adjustments

Investors' Day | Rüschlikon, 8 December 2015
33.937.2 38.4 37.5
5.46.5 6.6 6.4
9.57.0 5.4 4.9
8.5 6.7 6.5 6.0
31%24%
21% 20%
14% 15% 15% 15%
0%
10%
20%
30%
40%
50%
60%
70%
80%
90%
100%
2012 2013 2014 H1 2015
Core capital Total hybrid incl. contingent capitalSenior debt LOCSenior leverage plus LOC ratio Subordinated leverage ratio
USD bn
Achieved USD 5.8bn of net deleveraging6 ahead of our 2016 target of more than USD 4bn7
4 5
1
2 3
Senior leverage plus LOC ratio target range: 15-25%
Subordinated leverage ratio target range: 15-20%
1 Core capital of Swiss Re Group is defined as economic net worth (ENW) 5 Subordinated debt divided by sum of subordinated debt and ENW 2 Senior debt excluding non-recourse positions 6 Total from end 2012 to Investors’ Day 2015, based on Q3 2015 carrying values3 Unsecured LOC capacity and related instruments (usage is lower) 7 Announced at Investors’ Day 20134 Senior debt plus LOCs divided by total capital
Our Group capital structure is well within our leverage ratio target range, providing further flexibility
44

Investors' Day | Rüschlikon, 8 December 2015
Letters of credit
Senior debt
Sub-ordinated debt
Further reduction in line with reducing requirements in Reinsurance
Support business growth in Life Capital in line with leverage targets
Further optimisation of capital structure and cost of capital
Innovative capital instruments to
strengthen Group capital base
Subject to FINMA approval
Significant progress or fully realised
Continue to implement contingent capital road-map focusing on Group Holding level
Outlook
Swiss Re’s target capital structure and financial flexibility is supported by strong funding platforms
45
Established access to external funding
in all Business Units to fund ongoing
capital and liquidity requirements
Contingent capital
Established funding platform at Swiss Re Ltd with the first pre-funded subordinated debt facility in November 2015
Corporate Solutions
Reinsurance
Group
Outlook
Life Capital
Change since 2012

Investors' Day | Rüschlikon, 8 December 2015
Group financial targets
Systematic capital allocation is essential for achieving our Group and Business Unit targets
46
• 10-15% ROE over the cycle
• 10-12% ROE over the cycle
• 10-15% ROE over the cycle
• 6-8% ROE mid-term
1 Management to monitor a basket of rates reflecting Swiss Re's business mix
L&H Reinsurance Corporate Solutions Life CapitalP&C Reinsurance
Rf+700bps
Over the cycle2016
10% per annum
2015 Over the cycle2016
700bps above risk free (10-year US Gov Bonds1)
ROE ENW per share growth
Year-end ENW + dividends from current year divided by previous year end ENW; all per share
Business Unit targets

Investors' Day | Rüschlikon, 8 December 2015
Aligning the measurement of our financial targets with underlying fundamentals
47
• Reflects the long-term ambition of the Group
• Encompasses both industry and economic cycles
Over the cycle
• Increases ambition of the Group
• Reflects shift towards longer duration business
10-year risk free rate
ROE
• USD remains Swiss Re’s largest currency exposure
• Management to monitor a basket of rates reflecting Swiss Re'sbusiness mix
Basket of rates
ROE
• Change to EVM methodology, including setting capital cost parameters
• Adjustments to be recorded in the opening balance of 2016 ENW
Economic growth
ENW

Investors' Day | Rüschlikon, 8 December 2015 48
Swiss Re’s capital allocation aims to deliver sustainable shareholder value
We confirm our capital management priorities
• Ensure superior capitalisation at all times and maximise financial flexibility
• Grow the regular dividend with long-term earnings, and at a minimum maintain it
• Deploy capital for business growth where it meets our strategy and profitability requirements
• Repatriate further excess capital to shareholders
We aim to deliver long-term shareholder value
• Strategic framework enabling systematic allocation of capital to risk pools
• Very strong capital position across multiple metrics
• Steady investment performance through active asset re-balancing despite continued low yield
• Capital structure comfortably within our leverage ratio target ranges, providing flexibility
• Swiss Re Ltd and all Business Units have established access to external funding

Life Capital
Thierry LégerCEO Life Capital (effective 1 January 2016)

Investors' Day | Rüschlikon, 8 December 2015
Life Capital combines primary Life & Health insurance expertise and businesses…
in USD bn in %
1 Share of Swiss Re Group’s Economic Net Worth deployed across Business Units (excl. Group Items), 30 June 20152 Transaction completion expected early 2016
9M 15
0.3
0.9
0.5
FY 14FY 13
1.2
FY 12
Gross cash generation Return on Equity
• Swiss Re’s Life Capital Business Unit will manage closed and open life and health books
• Composed of Admin Re® (plus Guardian2) and existing primary life and health activities
• Significant cash generation
10%
Economic Net Worth1
9M 15
6.1
FY 14
0.6
6.1
2.6
6.8
7.7
FY 13
3.8
6.8
FY 12
ROE excl. US exit impact
Admin Re®Admin Re®
50

Investors' Day | Rüschlikon, 8 December 2015
…with attractive growth opportunities based on a few key trends…
Trends in L&H
Aging societyIncrease in longevity, health, and care needs
Regulatory reformsComplex regulatory environment
Customer engagement
Fair treatment of legacy clients requires active management
TechnologySystem changes lead to costly investments in legacy platforms
Disruption in distribution channelsEfficient distribution is key
Protection gapMortality and morbidity gap in high growth and mature markets
Efficient capital allocationClients not willing to have capital tied-up in legacy operations
51

Investors' Day | Rüschlikon, 8 December 2015
…and expanded access to Life & Health risk pools
Closed book~ 4m policies
~ USD 40bn assets
Open book~ 0.5m policies
~ USD 0.3bn assets
• Leading closed life book consolidator: focus on UK; investigate opportunities outside the UK
• Create value through operational, capital and asset management synergies
• Selective growth in Admin Re®
Ambition:
• Diversify our L&H book to generate stable returns for shareholders
• Provide excellent service and positive experience to our policyholders
• Deliver 6-8% ROE in the mid-term
• Grow new business in individual and group L&H through partnerships
• Further establish elipsLife (group L&H) and iptiQ (white-labelling)
Note: Approximate number of policies and assets (excl. policyholder assets) as at December 2014, including assumption of closing Guardian
52
Investors' Day | Rüschlikon, 8 December 2015
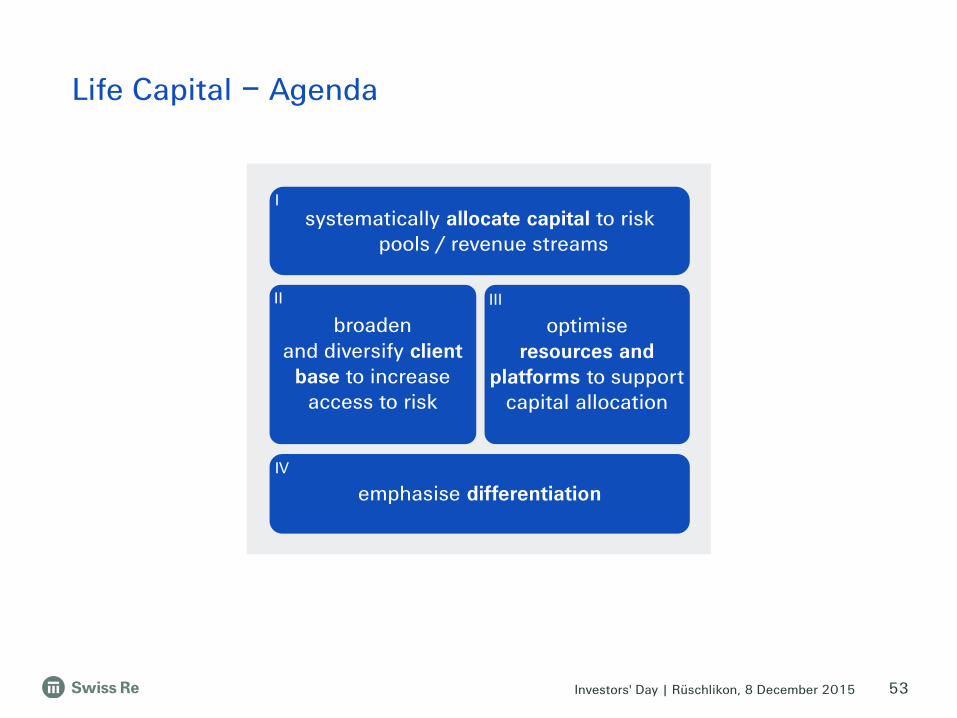
Life Capital – Agenda
53
broadenand diversify client
base to increase access to risk
optimise resources and
platforms to support capital allocation
systematically allocate capital to risk pools / revenue streams
emphasise differentiation
I
II III
IV

Investors' Day | Rüschlikon, 8 December 2015
We will systematically allocate capital to attractive and growing Life & Health risk pools…
I
II III
IV
Aim is to build a balanced portfolio benefiting from diversity of risks
54
• Mortality & morbidity risk
• Persistency risk
• Indirect equity risk• Persistency risk
• Longevity risk• Credit/spread risk
Unit-linked policies Annuities Biometric protectionExample products
Health
Mortality
Closed book Open book
Longevity
Liability risk pools
Illustrative
Note: Bars illustrate current exposure to risk pools

Investors' Day | Rüschlikon, 8 December 2015
…and attractive revenue streams – Guardian acquisition as an example
Diversified product mix
In %
Enhanced investment portfolio
In %
Post Guardian
acquisition
32 20
60 71
6
111 0
8
• Demonstrates Admin Re®’s position as a leading closed life book consolidator in the UK
• Transaction in excess of Group’s 11% ROE hurdle rate
Acquisition diversifies Admin Re®’s portfolio
• Long-term dominance of pensions policies
• The Guardian acquisition is expected to rebalance the product mix, with a majority of annuity policies
Continued focus on quality investment portfolio
• Guardian brings approx. GBP 12.5bn of assets to the balance sheet
• Increased allocation to investment grade credit improves asset yields with acceptable risk exposures
Post Guardian
acquisition
End Q3 2015 pro forma
Term or protection
Policies administered for 3rd parties Annuities
Unit linked / savings
I
II III
IV
55
Equities & alternatives
Other
Cash and short-term investments
Credit investments
Government bonds
End Q3 2015
37 36
13 2112
13
38 30
End Q3 2015 pro formaEnd Q3 2015

Investors' Day | Rüschlikon, 8 December 2015
We actively manage in-force portfolios to enhance cash generation
Proven track record in extracting maximum value from closed books
0.7
1.0
2016-2018E
1.7
0.3
9M 15FY 14
0.8
FY 13
0.9
0.7
0.20.5
0.4
1.2
FY 12
Admin Re®
Sales proceeds
Guardianin USD bn
Operational integration
Asset optimisation
Risk diversification
Debt funding
• Driving economies of scale with system and operational standardisation
• Managing asset portfolio to optimise expected yield and capital required
• Harnessing diversity in risks to deliver balance in capital and surplus
• Accessing debt funding to provide efficient and appropriate leverage
Gross Cash Generation
56
I
II III
IV
Investors' Day | Rüschlikon, 8 December 2015
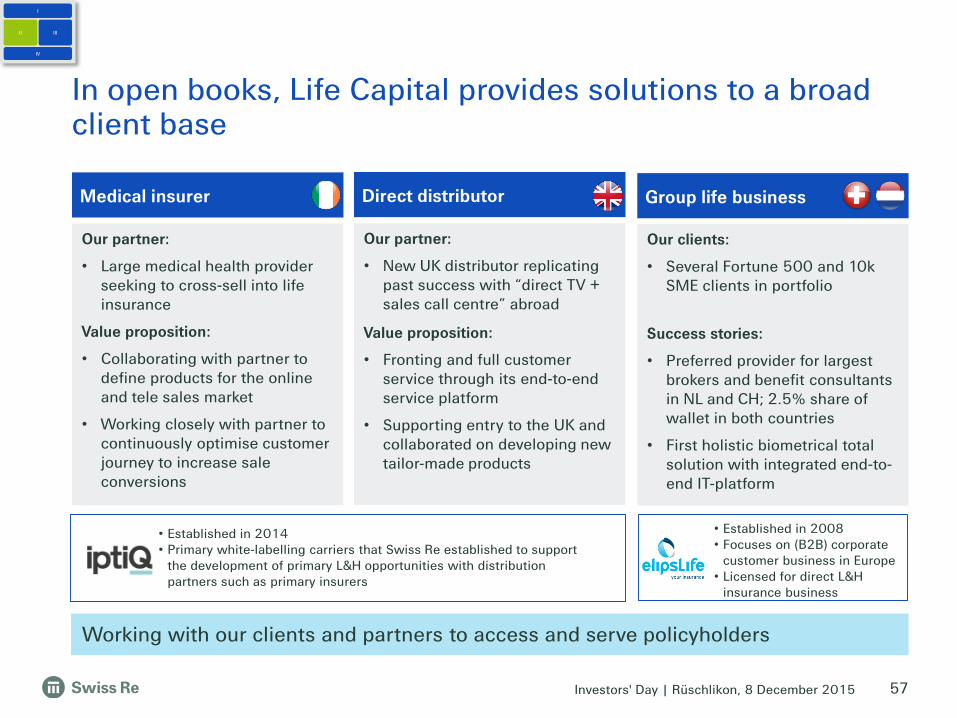
In open books, Life Capital provides solutions to a broad client base
57
I
II III
IV
Working with our clients and partners to access and serve policyholders
Medical insurer
Our partner:
• Large medical health provider seeking to cross-sell into life insurance
Value proposition:
• Collaborating with partner to define products for the online and tele sales market
• Working closely with partner to continuously optimise customer journey to increase sale conversions
Group life business
Our clients:
• Several Fortune 500 and 10k SME clients in portfolio
Success stories:
• Preferred provider for largest brokers and benefit consultants in NL and CH; 2.5% share of wallet in both countries
• First holistic biometrical total solution with integrated end-to-end IT-platform
• Established in 2014• Primary white-labelling carriers that Swiss Re established to support
the development of primary L&H opportunities with distribution partners such as primary insurers
• Established in 2008• Focuses on (B2B) corporate
customer business in Europe• Licensed for direct L&H
insurance business
Direct distributor
Our partner:
• New UK distributor replicating past success with “direct TV + sales call centre” abroad
Value proposition:
• Fronting and full customer service through its end-to-end service platform
• Supporting entry to the UK and collaborated on developing new tailor-made products

Investors' Day | Rüschlikon, 8 December 2015
Life Capital has the ability to broaden its geographic presence
I
II III
IV
Closed book Open book
Selective European presence
• Market presence in several European countries, e.g. UK, Switzerland, Netherlands
Future opportunities
• Opportunities in other key insurance markets
UK and Ireland – “strong market presence”
• UK closed book market estimated at over GBP 400bn reserves
• Admin Re® has been involved in the processes for all material transactions during 2015
• Presence established in Ireland with acquisition of Guardian
Continental Europe – “future opportunities”
• Continental Europe with potential to develop functioning closed book markets
• Continental Europe demonstrates business trends similar to those that prompted closed book activity in the UK
58
Investors' Day | Rüschlikon, 8 December 2015
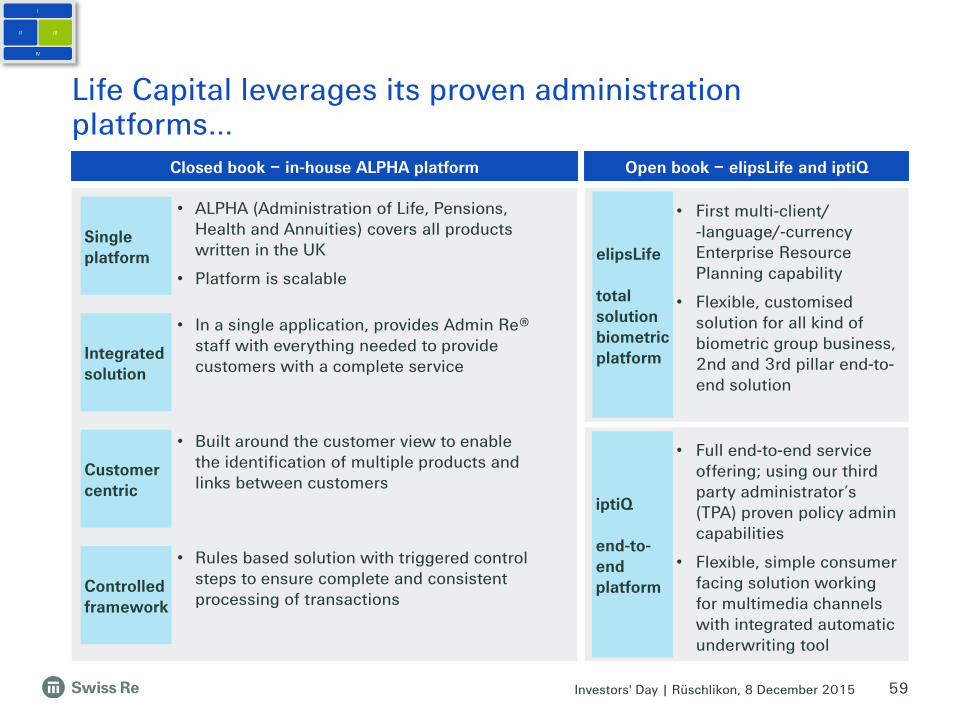
• First multi-client/-language/-currency Enterprise Resource Planning capability
• Flexible, customisedsolution for all kind of biometric group business, 2nd and 3rd pillar end-to-end solution
Life Capital leverages its proven administration platforms…
I
II III
IV
Closed book – in-house ALPHA platform Open book – elipsLife and iptiQ
• Full end-to-end service offering; using our third party administrator’s (TPA) proven policy admin capabilities
• Flexible, simple consumer facing solution working for multimedia channels with integrated automatic underwriting tool
Single platform
Integrated solution
Customer centric
Controlled framework
59
iptiQ
end-to-end platform
elipsLife
total solution biometric platform
• ALPHA (Administration of Life, Pensions, Health and Annuities) covers all products written in the UK
• Platform is scalable
• In a single application, provides Admin Re® staff with everything needed to provide customers with a complete service
• Built around the customer view to enable the identification of multiple products and links between customers
• Rules based solution with triggered control steps to ensure complete and consistent processing of transactions

Investors' Day | Rüschlikon, 8 December 2015
3.5
4.5
0.5
1.0
4.0
3.5
5.0
2.0
3.0
0
2.5
1.5
2006
1.5
0.2
2007
0.4
1.0
20082004
0.9
2.8
0.9
2014
in million
2015E
0.4
2013
3.3
20122011
3.63.1
3.9
2009
4.3
0.3
3.0
0.2
20052003
0.8
3.9
0.8
0
0.2
2010
Policy count
…and continues to support Swiss Re clients
Acquisitions Current closed books
Strong track record in successfully executing deals with long-term partners
AvivaHeritage
ZurichLife
BarclaysLife
MetLife
HSBC
ZurichLife
GELife
60
Guardian1 Growth in 2016
• 0.5m open book policies
• Future policy growth from open/closed books
I
II III
IV
Virgin Money
Life
1 Presented on a pro forma basis for 2015, transaction completion expected early 2016
Windsor Life

Investors' Day | Rüschlikon, 8 December 2015 61
• Important asset in acquiring closed books• Key element in developing new partnerships and sourcing distribution partners• Interaction and reputation with regulators
There are 4 key differentiators for Life Capital
• Superior client satisfaction and robust client response
• Offering client-centric products
• Exploring new propositions, e.g. Flexible Retirement Accounts; white-labelling life insurance solutions
Customer serviceIntegration & execution capabilities
Biometric data & knowledge
• Track record in acquiring closed books
• Demonstrated value extraction
• Operational excellence
• Integrated IT systems and service model which allow high speed to market
• Extensive granular biometric risk data
• Capability to make more accurate pricing decisions
• Provision of leading-edge automated and flexible underwriting engine
• Ability to design products tailored to clients’ needs
I
II III
IV
Trusted brand

Investors' Day | Rüschlikon, 8 December 2015
Summary and Q&A
broadenand diversify client
base to increase access to risk
optimiseresources and
platforms to support capital allocation
systematically allocate capital to risk pools / revenue streams
emphasise differentiation
I
II III
IV
Life Capital – Agenda
62

Investors' Day | Rüschlikon, 8 December 2015
Life Capital expected to be a strong contributor to the Swiss Re Group
• Focus on successful integration of Guardian
• Continue to seek attractive acquisition targets in the UK closed books market and potentially in Continental Europe
• Accelerate growth in Europe and replicate the model in the US for open books
• Deliver 6-8% ROE in the mid-term
• Life Capital Business Unit builds on the Group’s strengths
• Attractive growth opportunities
• Differentiation through proven operating platforms, customer service, knowledge and trusted brand
• Building a balanced book of business
• Strong gross cash generation
Conclusion
Outlook & priorities
63

Corporate Solutions
Agostino GalvagniCEO Corporate Solutions

Investors' Day | Rüschlikon, 8 December 2015 65
On track to deliver against 2015 targets
in USD bn in %
1 Share of Swiss Re Group’s Economic Net Worth deployed across Business Units (excl. Group Items), 30 June 2015Note: Gross premiums written including premium for insurance in derivative form, net of internal fronting for the Reinsurance Business Unit; ROE shown from 2012 as Corporate Solutions has been reported as separate segment from Q1 2012; 9M 2015 ROE is annualised
3.9
2.7
4.2
2.6
3.4
Gross premiums written Return on Equity
• Commercial insurance Business Unit of the Swiss Re Group
• A key opportunity for growth10%
Economic Net Worth1
Target range 2015: 4-5
2012 2013 2014 9M 2015
~4
2012 2013 2014 2015E20112010
7.4
9.6
12.5
18.7
Target range 2015: 10-15
Baseline year
Investors' Day | Rüschlikon, 8 December 2015
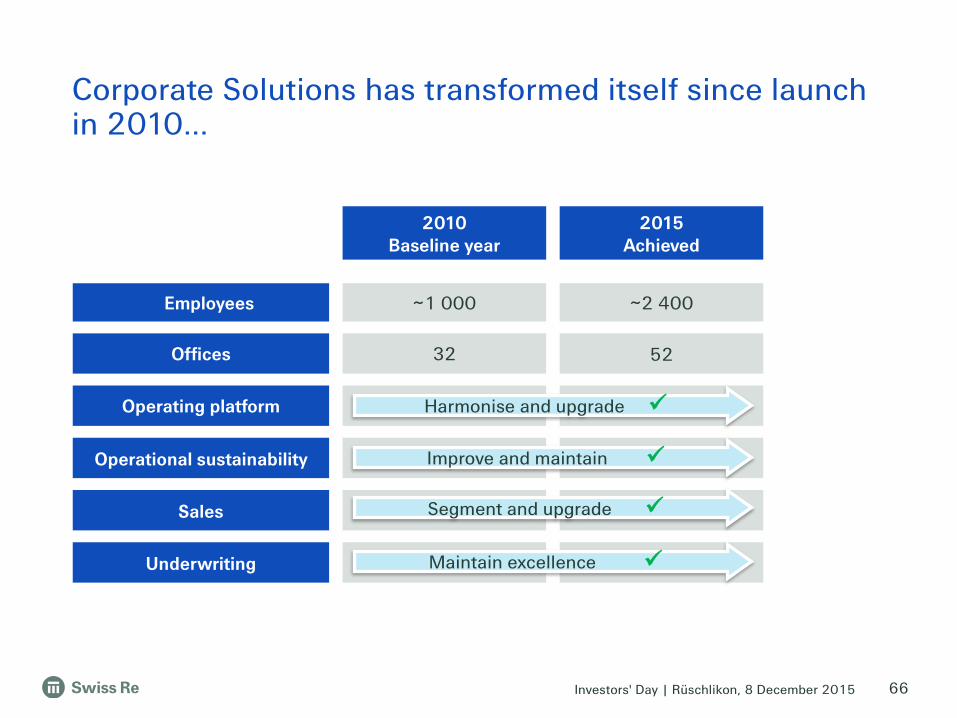
2010Baseline year
2015 Achieved
Employees ~1 000 ~2 400
Offices 32 52
Operating platform
Operational sustainability
Sales
Underwriting
Harmonise and upgrade
Improve and maintain
Corporate Solutions has transformed itself since launch in 2010…
66
Maintain excellence
Segment and upgrade

Investors' Day | Rüschlikon, 8 December 2015 67
Liabilities
• Composition of funding changed with the introduction of subordinated debt
7.1
8.9
3.4
9.9
6.8
3.9
+26%Assets under management
Reinsurance recoverables
Other assets
-28%
2011 9M 2015
Assets
• Assets under management to gradually replace reinsurance recoverables which produce no investment income
2011 9M 2015
Equity
Subordinated debt
OtherLiabilities
2.3 2.4
17.817.0
…and so has our balance sheet, aligning with peers
0.5
Note: Corporate Solutions has been reported as separate segment from Q1 2012, with pro forma figures available for the prior year
in USD bn in USD bn

Investors' Day | Rüschlikon, 8 December 2015
Corporate Solutions – Agenda
68
broadenand diversify client
base to increase access to risk
optimise resources and
platforms to support capital allocation
systematically allocate capital to risk pools / revenue streams
emphasise differentiation
I
II III
IV

Investors' Day | Rüschlikon, 8 December 2015 69
Our portfolio is well diversified across lines of business, geographies and industries
By line of business By geography
By industry
Property
Casualty
Special Lines
GPW
29%
21%
36%
14%
Asia Pacific
EMEA
North America
Latin America
8%
GPW
Credit & Surety
9M 2015
57%
24%
11%
9M 2015
GPW
Note: Gross premiums written (GPW) including premium for insurance in derivative form, net of internal fronting; Special Lines includes Aviation & Space, Engineering, Marine and Energy Offshore; portfolio composition by industry relates to 9M 2015
14%
29%
21%
36%
5%4%
10%
16%
8%7%16%
4%3%
27%
Food & Tobacco
Retail & Trading
Life Sciences
Professional Services
Aviation
Transportation
Engineering & Construction
Credit, Agriculture, Weather
Energy & Utilities
Mining
I
II III
IV

Investors' Day | Rüschlikon, 8 December 2015
We delivered strong profitable growth compared to peers since 2010…
70
Co
mb
ine
d r
ati
o 2
011
–2
01
4
Gross premiums growth 2010 – 2014 CAGR
80%
95%
110%13%
86%
16%-6% 5%
• Since 2010, continuously benchmarking ourselves against a selected set of 8 peers
Corporate Solutions
Insurers with global master policy capabilities
Insurers with multiregional focus
Insurers with wholesale focus
Source: Swiss Re Economic Research & Consulting Note: Peer group average weighted premium growth is in USD; Corporate Solutions combined ratio 2011-2013 is on basis of estimated total financial contribution to Swiss Re Group (ie Corporate Solutions business written, as shown at Investors' Day 2012, incl. development of historical loss reserves remaining in Reinsurance); combined ratio is shown starting 2011 as Corporate Solutions has been reported as separate segment from Q1 2012, with pro forma figures available for the prior year
Quadrants are determined based on average combined ratio and gross premiums compound annual growth rate (CAGR) over the years; bubble size = 2014 base
I
II III
IV

Investors' Day | Rüschlikon, 8 December 2015
…but are very careful in the current market
71
Source: Swiss Re Economic Research & ConsultingNote: Peer group average weighted premium growth is in USD; due to consolidation in market number of peers reduced to 7 over the period
• Focused on maintaining underwriting discipline
Corporate Solutions
Insurers with global master policy capabilities
Insurers with multiregional focus
Insurers with wholesale focus
Gross premiums growth9M 2015 vs. 9M 2014
Co
mb
ine
d r
ati
o 9
M 2
01
5
92%
-19%
85%
104%
95%
-8% 15%-2%
Quadrants are determined based on average combined ratio and average gross premium growth rates; bubble size = 9M 2015 base where available, otherwise H1 2015
I
II III
IV

Investors' Day | Rüschlikon, 8 December 2015
The commercial insurance market is very diverse and fragmented. Corporate Solutions ranks 25th overall...
72
Source: Swiss Re Economic Research & ConsultingNote: 2014 commercial insurance market premium: USD 740bn. In case of players writing business other than commercial insurance, only the commercial insurance premiums are shown
Players beyond top-30
Insurers with global master policy capabilities Insurers with regional focus
Insurers with wholesale focusInsurers with multiregional focus
Top 11-30 represent ~15% of market
Top-10 represent ~20% of market
Corporate Solutions
4.2
Top-30
I
II III
IV

Investors' Day | Rüschlikon, 8 December 2015 73
…but is a leader in the Excess Layer Market, and expandinginto the next segment
2014 commercial insurance market premium: USD 740bn
70
130
270
210
Wholesale
Retail
Granularity of distribution
Administrative load
Deal complexity
Main characteristics
Deal size
in USD bn
Primary Lead (mid-sized corporations)
Excess Layers(large corporations)
SMEs
Workers’ Compensation and Commercial Auto
Pe
ne
tra
tio
n
Source: Swiss Re Economic Research & Consulting
60Global Master Policies
I
II III
IV

Investors' Day | Rüschlikon, 8 December 2015
We are on our way to become a Primary Lead insurer
74
Ambition: Generate additional premiums of USD 1.0bn – 1.5bn by 2020
Primary Lead capabilities (in place or to be rolled-out in 2016)
Latin America: • Colombia (Casualty; 2016: Property)• Brazil (Property, Marine; 2016:
Casualty)
North America: • Canada (P&C)• US (Property, FinPro; 2016: Casualty)
EMEA: • Italy (P&C, FinPro, Marine) • France (P&C, Marine)• Germany (P&C; 2016: FinPro)
• UK (2016: P&C, FinPro)• Netherlands (2016: P&C)• South Africa (2016: P&C)• Switzerland (2016: P&C, FinPro)
Asia Pacific: • China (P&C)• Singapore (Casualty, FinPro)• Australia (2016: Property)
Capabilities being developed:
• Products: Develop primary products in line with local standards; ability to price primary products
• Services: Establish local services (esp. Claims and Risk Engineering)
• Systems: Integrate management of co-insurance panels into current platforms and processes
I
II III
IV

Investors' Day | Rüschlikon, 8 December 2015
Our distribution footprint is global and growing…52 offices across 20 countries
Local presence & insurance license
Local insurance license
Local presence & reinsurance license
EMEA: 12 offices
North America: 23 offices
Note: Latin America includes Miami as hub for the region
75
Latin America: 7 offices
Asia Pacific: 10 offices
I
II III
IV

Investors' Day | Rüschlikon, 8 December 2015
…and we strengthened our presence in our 12 key High Growth Markets
No local presenceAlready well covered Local presence to be strengthened
76
I
II III
IV
South AfricaOffice opened in 2015
SingaporeInsurance license obtained in 2013
IndiaTurkey UAEDubai office opened
in 2012
BrazilUBF acquisition in 2011
Chile
ColombiaSeguros Confianzaacquisition in 2014
Hong Kong
MalaysiaReinsurance license obtained in 2015, Origination/UW out of Singapore
ChinaSun Alliance China
acquisition in 2015
Mexico

Investors' Day | Rüschlikon, 8 December 2015
We hired ~2 000 new employees since launch in October 2010…
77
2010Baseline year
33
2015 Achieved
Nu
mb
er
of
em
plo
yee
s
~1 000
~2 400
~600 Inorganic growth
Organic growth
Intra Group shifts ~600
Attrition
~200 (~600) ~600
Replacements
~25%~7%
X%Share of High Growth Markets
• Tailor-made onboarding programme
• Employee engagement index 12% above global financial insurance industry
• Share of staff in High Growth Markets increased to ~25%
I
II III
IV

Investors' Day | Rüschlikon, 8 December 2015 78
• Productivity gains achieved through:
– Re-design and simplification of end-to-end underwriting process
– More efficient allocation of underwriting tasks, leveraging service centres
– Re-shaping of IT landscape
Work units per FTE Premiums per FTE
+23% productivity
increase
2013 H1 2015 2013 H1 2015
+10% productivity
increase
Note: Work units per FTE are transactional actions related to handling submissions, submitting quotes and binding transactions. FTE are weighted: underwriters/originators: 1, business support: 0.5, service centre support: 0.25; productivity metrics are rolling full-year views available since 2013; lower increase in Premium per FTE compared to Work units per FTE mainly reflects shift towards smaller deal size
~110~135
~2.9~3.2
in USD m
I
II III
IV
…and we significantly increased our productivity

Investors' Day | Rüschlikon, 8 December 2015 79
Three key factors differentiate us from competitors
Corporate Solutions' value proposition
~500 transactions with USD 100m capacity or more
in 2014
Opens doors and attracts talents• Leading brand
• Financial strength
• "We are here to stay“
• Large net capacity
• Innovation
Supported by
– Superior underwriting knowledge
– Disciplined cycle management
– Proactive claims management
~40 innovative transactions
in 2014
I
II III
IV

Investors' Day | Rüschlikon, 8 December 2015
Innovation capabilities in several areas, acknowledged by the market
80
Bespoke structures
• Multi-line/multi-yearsolutions
• Non-damage business interruption
• Parametric solutions
Derivative solutions
• Temperature and weather related derivatives
• Crop shortfall derivatives
New risks
• Cyber risk: Partnership with IBM
I
II III
IV
Awards
Innovative transaction of the year in Switzerland
2015
First solar radiation index transaction in China
2015
Energy Risk Weather House of the year
2012, 2013, 2014

Investors' Day | Rüschlikon, 8 December 2015
Summary and Q&A
broadenand diversify client
base to increase access to risk
optimise resources and
platforms to support capital allocation
systematically allocate capital to risk pools / revenue streams
emphasise differentiation
I
II III
IV
Corporate Solutions – Agenda
81

Investors' Day | Rüschlikon, 8 December 2015
• Ambition to grow, further increasing Corporate Solutions’ relevance to the Swiss Re Group
• Key initiatives for growth beyond 2015 are
– Expanding into Primary Lead and
– Further broadening of the footprint
• Continue to carefully navigate the current market with unchanged focus on profitability
• On track to deliver against 2015 targets
• Transformed into a larger and more solid player, with a
– Distinct value proposition building on our leading brand, large net capacity and innovation capabilities
– Leadership position in the Excess Layer Market
– Distribution network of 52 offices in 20 countries
Key messages
82
Conclusion
Outlook & priorities

Christian MumenthalerCEO Reinsurance
Reinsurance

Investors' Day | Rüschlikon, 8 December 2015 84
Swiss Re’s largest Business Unit delivers strong results
1 Share of Swiss Re Group’s Economic Net Worth deployed across Business Units (excl. Group Items), 30 June 2015
Combined ratio and operating margin Return on Equity
• Wholesale reinsurance leader offering products and related services in property and casualty, as well as in life and health
• Foundation of Swiss Re Group’s strength
• Strong performance over the last years and YTD
L&H
P&C49%
31%
Economic Net Worth1
in %
80.7 84.883.8 83.7
P&C: Combined ratio
8.6
FY 14 9M 15FY 13FY 12
5.8
2.6
10.7
L&H: Operating margin
17.0
23.3
9M 15FY 12 FY 14FY 13
-7.9
26.026.7 26.7
6.4
8.9
in %
P&C L&H

Investors' Day | Rüschlikon, 8 December 2015
Reinsurance – Agenda
85
broadenand diversify client
base to increase access to risk
optimise resources and
platforms to support capital allocation
systematically allocate capital to risk pools / revenue streams
emphasise differentiation
I
II III
IV

Investors' Day | Rüschlikon, 8 December 2015
Key success factors:
• Integrated economic framework to steer both P&C and L&H Reinsurance businesses, including planning, pricing and reserving
• Active portfolio steering between and within P&C and L&H Reinsurance businesses
• Separation of pricing and costing to enable transparent decision making
• Feedback loop allows to optimise costing
Swiss Re - Steering Framework
86
Since 2006 we have a Group-wide process for business steering and underwriting which is successfully applied in Reinsurance
StrategyLearning
Capitalallocation
&Target
setting
Decision making
Portfolio-& perform-
ancemeasure-
ment
EVM
1
2
3
4
I
II III
IV
1
2
3
4

Investors' Day | Rüschlikon, 8 December 2015
We shifted the portfolios in line with our underwriting framework and growth strategy
P&C Reinsurance portfolio composition1
1 Data before external retro and other items; average Q3 2015 FX rates used for all years; Line of business split does not include High Growth Markets business
L&H Reinsurance portfolio composition1
US GAAP Gross Earned Premiums US GAAP Gross Earned Premiums
22% 24% 22% 22% 19% 16%
18% 17% 18% 17%15%
15%
15% 13% 10% 9%10% 10%
17%11%
13% 14%15% 17%
9%
9% 11% 10%8% 11%
11% 12% 9%14% 10%
14% 15% 15% 18% 20% 21%
9M 201520142013201220112010
4%
Property Non-Prop
Property Prop / Fac
Specialty
Casualty (excl. Motor)
Motor
HGM (Motor China only)
HGM (excl. Motor China)
74% 73% 70% 67% 64% 60%
19% 20% 23% 25% 28%31%
7% 7% 7% 7% 8% 9%
9M 201520142013201220112010
LifeHGM Health
I
II III
IV
87
• P&C: High Growth Markets driver for growth; reduction of Property since 2013 due to price developments
• L&H: continuous growth of Health and business in High Growth Markets
Investors' Day | Rüschlikon, 8 December 2015
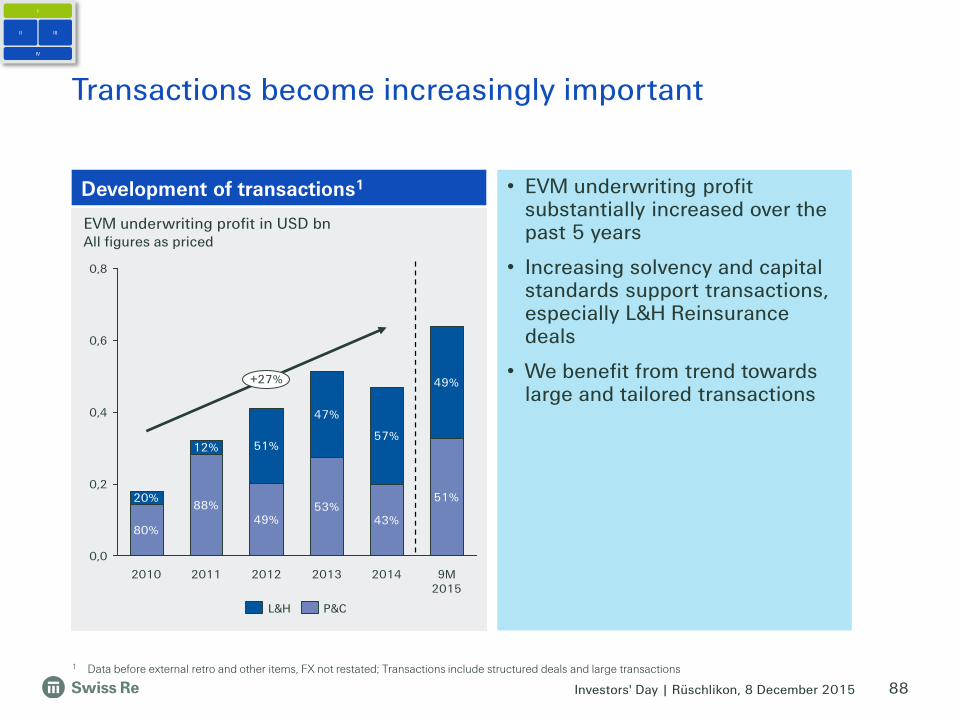
Transactions become increasingly important
88
0,4
0,6
0,2
0,0
0,8
9M 2015
49%
51%
+27%
2014
43%
57%
2013
53%
47%
2012
49%
51%
2011
88%
12%
2010
80%
20%
Development of transactions1
EVM underwriting profit in USD bnAll figures as priced
L&H P&C
1 Data before external retro and other items, FX not restated; Transactions include structured deals and large transactions
I
II III
IV
• EVM underwriting profit substantially increased over the past 5 years
• Increasing solvency and capital standards support transactions, especially L&H Reinsurance deals
• We benefit from trend towards large and tailored transactions

Investors' Day | Rüschlikon, 8 December 2015
0%
10%
20%
30%
40%
50%
9M 201520122010 2014201320112009
Operating income2Revenues1
P&C – Swiss Re has been consistently outperforming the market with regards to profitability
89
• Average revenue share of 21%
• Average profit share of 30%
Swiss Re P&C Reinsurance revenues and operating income2 share vs other reinsurers 40%
Market share of top 7 reinsurers
In 2011, the industry experienced extraordinary high natural catastrophe losses. Swiss Re was hit to a lesser extent than peers.
I
II III
IV
1 Revenues exclude net realised investment gains 2 Operating income is income before tax and before interest for financial debt, excluding net realised investment gains (losses) Top 7 reinsurers include: Swiss Re, Munich Re, Hannover Re, PartnerRe, SCOR, Everest Re, AlleghanySource: Swiss Re Economic Research and Consulting

Investors' Day | Rüschlikon, 8 December 2015
-10%
0%
10%
20%
30%
40%
9M 201520122010 2014201320112009
90
L&H – Swiss Re with significant portion of profit pool
1 Revenues exclude net realised investment gains; limited comparability due to different accounting standards of peer group; Top 6 reinsurers include Swiss Re, Munich Re, Hannover Re, PartnerRe, SCOR, RGA
2 Operating income is income before tax and before interest for financial debt, excluding net realised investment gains (losses) Source: Swiss Re Economic Research and Consulting
• Average revenue share of 23%
• Average profit share of 25%
Swiss Re L&H Reinsurance revenues and operating income2 share vs other reinsurers
70%
Market share of top 6 reinsurers
I
II III
IV
2014 was impacted by Swiss Re’s decisive management actions in respect of pre-2004 US YRT business and the unwind of a funding structure.
Operating income2Revenues1

Investors' Day | Rüschlikon, 8 December 2015 91
L&H Reinsurance shows strong underlying results – well on track to achieve 2015 ROE target
• L&H Reinsurance well on track to achieve its ROE target of 10-12%
• Management of in-force blocks of business continues to be a key priority
• 2014 results impacted by decisive management actions, setting the foundation for profitable growth
• 9M 2015 operating income and margins have developed within expected range
• Mortality/morbidity experience vs. expected is also tracking within our expected volatility
Return on Equity
1 Model/assumption changes in relation to VA/GMDB/B36 are shown as part of “Model/assumption changes”2 Adjusted for realised gains/losses and model-/assumption-updates, and large one offs, net of tax3 Same as described in footnote 2 and for USD 5.5bn equity capital base, announced in the June 2013 Investors’ Day
Operating income adjustments
• Mortality/morbidity experience vs. expected 138 -16
• Model/assumption changes1 -87 81
• VA/GMDB/B361 -1 12
• Other one-offs -623 0
Operating margin, % 2.6 10.7
FY 2014 9M 2015
Operating income of which approximately 331 986
I
II III
IV
in USD m
-7.9
17.0
5.7
11.8
6.5
12.6
FY 2014 9M 2015
ROE, reported
ROE, adjusted
ROE, adjusted on USD5.5bn equity
2
3
in %

Investors' Day | Rüschlikon, 8 December 2015 92
Four focus areas to broaden and diversify client base to increase access to risk
High Growth MarketsContinue to expand geographically, and be the global leader
Regionals & Nationals (R&N)Significant growth in volume and number of clients since start of initiative
CasualtyWe actively manage the Casualty business according to the pricing cycle
HealthAddressing the health-protection need of the ageing population
I
II III
IV
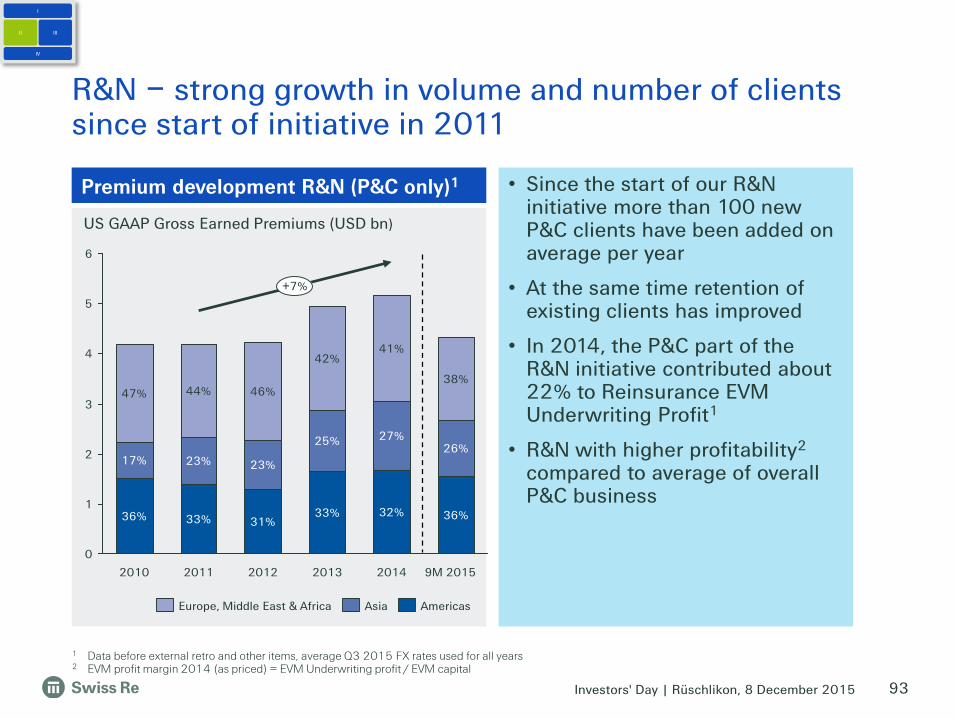
Investors' Day | Rüschlikon, 8 December 2015 93
R&N – strong growth in volume and number of clients since start of initiative in 2011
Premium development R&N (P&C only)1
2
1
5
0
6
4
344%
2014
38%
26%27%
41%
2013
32%
2012
31%
46%
23%
2011
33%
2010
36%
17%
47%
23%
42%
33%
25%
36%
+7%
9M 2015
US GAAP Gross Earned Premiums (USD bn)
Asia AmericasEurope, Middle East & Africa
1 Data before external retro and other items, average Q3 2015 FX rates used for all years2 EVM profit margin 2014 (as priced) = EVM Underwriting profit / EVM capital
I
II III
IV
• Since the start of our R&N initiative more than 100 new P&C clients have been added on average per year
• At the same time retention of existing clients has improved
• In 2014, the P&C part of the R&N initiative contributed about 22% to Reinsurance EVM Underwriting Profit1
• R&N with higher profitability2
compared to average of overall P&C business

Investors' Day | Rüschlikon, 8 December 2015 94
Casualty – we pro-actively manage the Casualty business according to the pricing cycle
Premium development Casualty1
7
6
5
4
3
2
1
0
27%
2011
18%
5%
15%
12%
33%
18%
2010
36%
4%16%
10%
13%
21%
+17%
4%
15%
4%
9M 2015
29%
5%
12%
16%
27%
12%
2014
26%
31%
10%
10%
37%
12%
2013
27%
5%12%
10%
26%
21%
2012
18%
5%
US GAAP Gross Earned Premiums (USD bn)
Casualty EMEA
Casualty AsiaMotor Americas
Motor Asia
Motor EMEA
Casualty Americas
1 Data before external retro and other items, average Q3 2015 FX rates used for all years2 EVM profit margin 2014 (as priced) = EVM Underwriting profit / EVM capital
I
II III
IV
• In 2014, Casualty contributed around 11% to Reinsurance EVM Underwriting Profit1
• EVM profit margin2 in 2014 at ~7%; further reduction of low-margin business expected (China Motor QS)
• We pursue a profitability-focused expansion, taking into account relevant factors, e.g.
– rate developments
– macro economics
– social, regulatory and legal developments
– cession rates

Investors' Day | Rüschlikon, 8 December 2015
US GAAP Gross Earned Premiums (USD bn)
Health – addressing the health-protection need of the ageing population
1
3
4
2
08%
+21%
9M 2015
34%
59%
7%
35%
2014
58%
2013
67%
68%
25%
9%
24%
9%
2010
8% 8%
65%
21%
2011
69%
2012
28%
AmericasAsiaEurope, Middle East & Africa
Premium development Health1
1 Data before external retro and other items, average Q3 2015 FX rates used for all years2 EVM profit margin 2014 = EVM Underwriting profit / EVM capital
I
II III
IV
95
• Increasing demand for primary health products, particularly in Asia and the US
• Cessions to the reinsurance market are expected to increase in line with growth in the primary market
• In 2014, Health business represented about 12% of Reinsurance EVM Underwriting Profit1
• Profitability2 of Health book slightly above average of overall reinsurance profitability

Investors' Day | Rüschlikon, 8 December 2015
US GAAP Gross Earned Premiums (USD bn)
• Significant growth achieved over past years, especially in Asia
• Volume reduction of low-margin China Motor QS due to C-ROSS2
• Profitability3 of remaining High Growth Markets business in line with overall book
• Our current focus
– Establish high performing local teams
– Further enhance client loyalty in selected segments
– Support efforts to increase overall market penetration
96
High Growth Markets – continue to expand geographically
5
4
2
3
1
0
6
39%
10%
+17%
12%
9M 2015
44%
17%
26%
20142011
35%
28%
2010
13% 12%
41%
16%
16%
12%
37%
34%
19%
2012 2013
35%
19%
34%
16%
42%
27%
15%
1 Data before external retro and other items, average Q3 2015 FX rates used for all years2 C-ROSS = China Risk Oriented Solvency System3 EVM profit margin 2014 (as priced) = EVM underwriting profit / EVM capital
Americas
Motor China
Europe, Middle East & Africa
Asia
Premium development HGM1
I
II III
IV

Investors' Day | Rüschlikon, 8 December 2015 97
High Growth Markets – shift of resources ongoing
1 Client Markets and Underwriting/Products
Allocation of Reinsurance origination1 staff
11%
13%16%
17% 17%
2%3% 4% 5% 5%
2% 2% 2% 2% 2%
2014
1 728
2012
82%
1 503
2013
77%
1 691
79%
85%
2011
1 584
H1 2015
1 740
76%
HGM - Africa HGM - LatAm HGM - Asia Mature Markets
I
II III
IV
Since inception of our High Growth Market (HGM) initiative in 2011 we have systematically re-allocated client facing functions to growth areas

Investors' Day | Rüschlikon, 8 December 2015 98
R&N – substantial productivity gains
Market underwriter concept Fitting offering
Launched globally
20 markets
I
II III
IV
• Client buying preferences have been assessed in detail
• Goal is to deliver appropriate offerings based on individual client needs
• 840 client facing staff members have been trained on the learnings from the assessment
• Market underwriter concept, launched in 2010, is currently applied in 20 markets globally; further roll-out in progress
• Number of programmes led by market underwriters grows in all regions1
• Market underwriters contribute ~25% to EVM underwriting profit of overall R&N in-force P&C treaty portfolio
1 e.g. for P&C treaty business from 2013 to 2015: +37% in Americas, +21% in Asia, +33% in EMEA
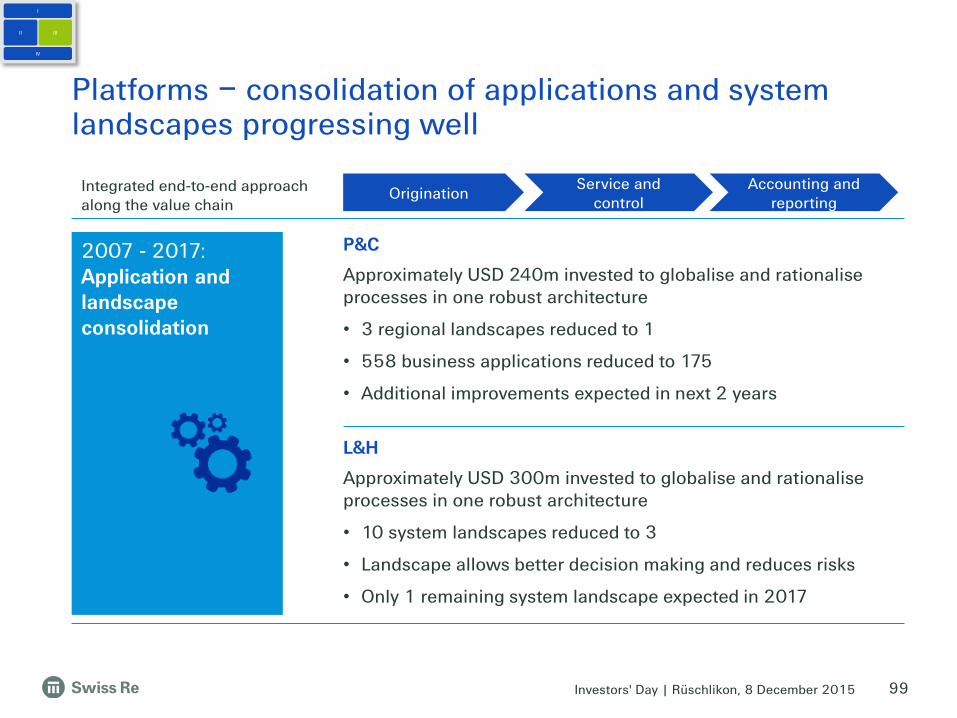
Investors' Day | Rüschlikon, 8 December 2015 99
Platforms – consolidation of applications and system landscapes progressing well
2007 - 2017:Application and landscape consolidation
Integrated end-to-end approach along the value chain
OriginationService and
controlAccounting and
reporting
P&C
Approximately USD 240m invested to globalise and rationalise processes in one robust architecture
• 3 regional landscapes reduced to 1
• 558 business applications reduced to 175
• Additional improvements expected in next 2 years
L&H
Approximately USD 300m invested to globalise and rationalise processes in one robust architecture
• 10 system landscapes reduced to 3
• Landscape allows better decision making and reduces risks
• Only 1 remaining system landscape expected in 2017
I
II III
IV

Investors' Day | Rüschlikon, 8 December 2015
Client relationships
Knowledge company
100
Our differentiation is based on three key pillars
Financial strength
• Very strong capital position (e.g. SST 1/2015 for SRZ: 217%)
• SRZ rating: S&P AA-, Moody’s Aa3, A.M. Best: A+; all stable outlook
• Leading and highly diversified global reinsurer
• Highly interactive client relationship model
• Long lasting and sustainable relationships
• Franchise value further improved
• Employees combine a wide range of technical expertise
• Commitment to sharing knowledge
• Wide spectrum of products and value-added services
I
II III
IV

Investors' Day | Rüschlikon, 8 December 2015 101
Client relationships – we have a “high touch” interaction model
Global Client
14+ interactions over last 5 years
Swiss Re
• We have documented more than 3 interactions a day between Swiss Re and a Global Client over the past 5 years
• This involved 291 employees from Swiss Re and that Global Client
36
40 41
42
20
25
30
35
40
45
0
10000
20000
30000
40000
50000
60000
70000
80000
90000
H1 2015
2014201320122011
30
Phone callsNet Promoter Score (NPS) Meetings
Visualisation of an interactive client relationship NPS in line with client interactions increase
• From 2011 to 2014, we have quadrupled our documented client interactions and improved our Net Promoter Score (NPS) from 30 to 41
• Strong franchise value confirmed by Flaspöhlerratings: Swiss Re moved up to #1 or #2 in all markets from 2011 to 2015 (except #3 in Latin America P&C Reinsurance)
NPS scoreNumber of client interactions
I
II III
IV

Investors' Day | Rüschlikon, 8 December 2015
Development of 100 largest P&C and L&H Reinsurance clients
102
Client relationships – we maintain long lasting and stable relationships with our clients
~75% of total premiums on average
99% retention rate
~8% annual premium increase
EVM premiums, 2010-2014
I
II III
IV
• Business from long lasting and stable client relationships contributes to a large part of our overall result
• Remarkable retention and premium growth rate illustrate the success of our dedicated client focus
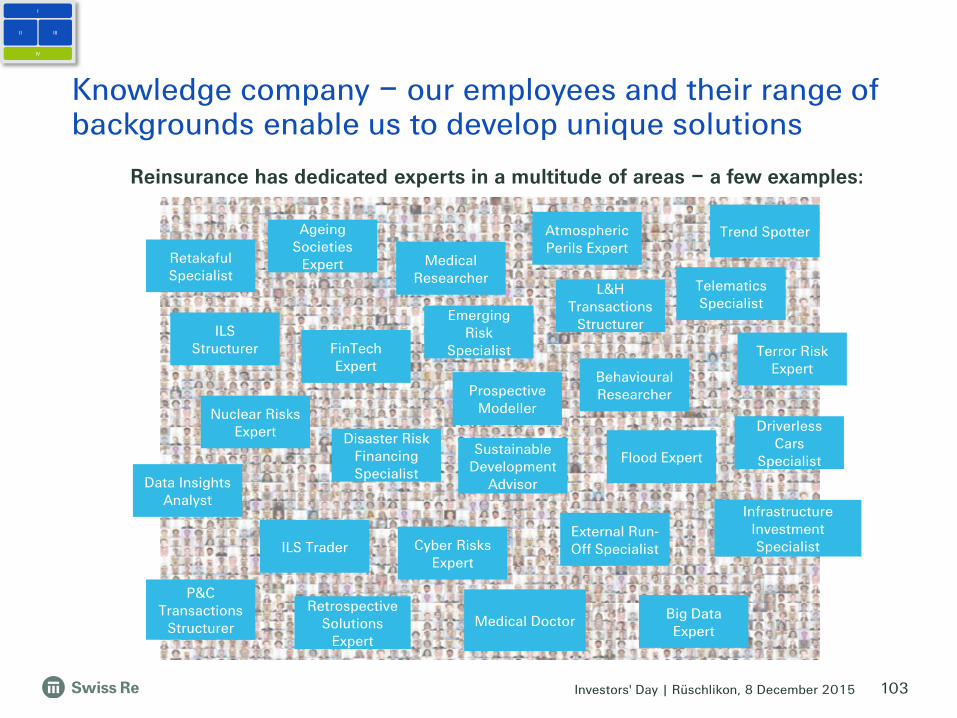
Investors' Day | Rüschlikon, 8 December 2015 103
Knowledge company – our employees and their range of backgrounds enable us to develop unique solutions
Reinsurance has dedicated experts in a multitude of areas – a few examples:
Ageing Societies
Expert Medical Researcher
Atmospheric Perils Expert
Big Data Expert
Emerging Risk
Specialist
Disaster Risk Financing Specialist
Nuclear Risks Expert
Cyber Risks Expert
Prospective Modeller
Telematics Specialist
Terror Risk Expert
Trend Spotter
ILS Structurer
P&CTransactions
Structurer
L&H Transactions
Structurer
Flood Expert
Data Insights Analyst
Behavioural Researcher
Driverless Cars
Specialist
FinTechExpert
Infrastructure Investment Specialist
Sustainable Development
Advisor
ILS Trader
RetakafulSpecialist
External Run-Off Specialist
Retrospective Solutions
Expert
Medical Doctor
I
II III
IV

Investors' Day | Rüschlikon, 8 December 2015
Knowledge sharing
Unique tools
Mutual growth
104
Knowledge company – full service support to clients with wide spectrum of products and services
Supporting clients with traditional and innovative reinsurance solutions
I
II III
IV
Directly supporting clients, e.g.
• New/ co- product development (e.g. senior cancer products)
• Portfolio/risk analysis, cat modelling advisory
• Solvency II consulting
• Rating exposure support
Wide range of client workshops and training, e.g.
• Training for insurers (e.g. Insurance Management Simulation): >600 single participants from over 40 countries in classroom courses and >800 in eLearnings by year end 2015
• Product development workshops (e.g. accident and health products)
• Emerging risks workshops and risk engineering services (on-site)
Unique systems and simulation tools, e.g.
• CatNet – natural hazard information and mapping system
• SwiftRe – online self-service facultative reinsurance platform
• Magnum – automated underwriting system for L&H
• L&H Guidelines – internet based underwriting manuals and claims guide

Investors' Day | Rüschlikon, 8 December 2015 105
Knowledge company – financial benefits from our differentiation approach
Privatedeals
Share of wallet above
defined threshold
Preferential terms &
conditions
~40% of Globals EVM underwriting profit originated as result of differentiation
~40%~60%
Share of contribution margin from differentiation
Data is limited to Treaty only (2014)
Differentiation example for Globals
I
II III
IV
1.
2.
3.
Differentiation benefits built on 3 sources
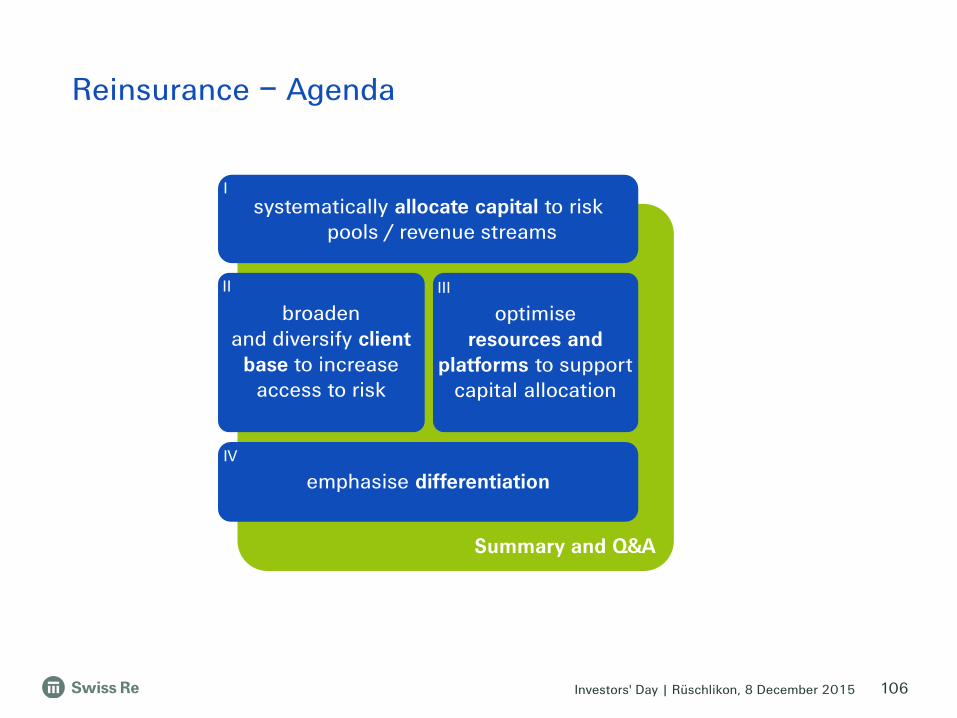
Investors' Day | Rüschlikon, 8 December 2015
Reinsurance – Agenda
106
Summary and Q&A
broadenand diversify client
base to increase access to risk
optimise resources and
platforms to support capital allocation
systematically allocate capital to risk pools / revenue streams
emphasise differentiation
I
II III
IV

Investors' Day | Rüschlikon, 8 December 2015 107
Reinsurance Strategy remains valid and strongly contributes to the Group’s strategic framework
• P&C environment will continue to be challenging – we will stay disciplined and committed to profitability
• Growth aspirations focused on selected areas – dedicated strategic initiatives in place
• Differentiation continues to be key – financial strength undisputed, client interaction model unique, knowledge company approach continuously professionalised
• Reinsurance is a key contributor to the overall Group performance
• Proven track record in portfolio steering – consistent outperformance
• Significant growth achieved in targeted areas – High Growth Markets, R&N, Health, Casualty and Transactions
• Productivity gains – resource shifts to HGM, consolidation of platforms in P&C and L&H, simplified underwriting for R&N
• Differentiation at the core of Reinsurance strategy – results measured and proven
Conclusion
Outlook & priorities

Wrap-up
Michel M. LièsGroup Chief Executive Officer

Investors' Day | Rüschlikon, 8 December 2015
Systematic capital allocation to risk pools is at the core of our strategy
109
Broad and diversified access to risk pools
Capital markets Risk pools
Client segments
Economic based performance
steering
Continuous knowledge building
Capital (re-) allocation
Long-term shareholder value
Access/cost of funding
Capital management
priorities

Investors' Day | Rüschlikon, 8 December 2015
broadenand diversify client base to
increase access to risk
optimiseresources and platforms to
support capital allocation
systematically allocate capital to risk pools / revenue streams
emphasise differentiation
I
II III
IV
110
Our strategic framework will drive value creation
Financial strength
Client relationships
Knowledge company
Target liability portfolio
Strategic asset allocation
Business steering
Leadership across geographies
Protection gap and emerging risks
Innovation with clients
Talent &
footprint
IT & smart analytics
ALM capabilities

Investors' Day | Rüschlikon, 8 December 2015
Delivering on our new financial targets is our top priority
111
1 Management to monitor a basket of rates reflecting Swiss Re's business mix
Profitability:ROE ≥ risk free + 700bps
Growth:ENW per share 10% p.a.
Rf+700bps
Over the cycle2016
10% per annum
2015 Over the cycle2016
700bps above risk free (10-year US Gov Bonds1)
ROE ENW per share growth
Year-end ENW + dividends from current year divided by previous year end ENW; all per share
We confirm our capital management priorities
• Ensure superior capitalisation at all times and maximise financial flexibility
• Grow the regular dividend with long-term earnings, and at a minimum maintain it
• Deploy capital for business growth where it meets our strategy and profitability requirements
• Repatriate further excess capital to shareholders

Investors' Day | Rüschlikon, 8 December 2015
Our vision
We make the world more resilient.
Our mission
Together, we apply fresh perspectives, knowledge and capital to anticipate and manage risk. That’s how we create smarter solutions for our clients, helping the world rebuild, renew, and move forward.

Investors' Day | Rüschlikon, 8 December 2015

Investors' Day | Rüschlikon, 8 December 2015
Corporate calendar & contacts
Investor Relations contacts
Hotline E-mail+41 43 285 4444 [email protected]
Philippe Brahin Jutta Bopp Chris Menth +41 43 285 7212 +41 43 285 5877 +41 43 285 3878
Simone Lieberherr Iunia Rauch-Chisacof+41 43 285 4190 +41 43 285 7844
Corporate calendar
201623 February Annual Results 2015 Conference call16 March Publication of Annual Report 2015 and EVM 201522 April 152nd Annual General Meeting Zurich29 April First Quarter 2016 Results Conference call
Investors' Day | Rüschlikon, 8 December 2015
Certain statements and illustrations contained herein are forward-looking. These statements (including as to plans objectives, targets and trends) and illustrations provide current expectations of future events based on certain assumptions and include any statement that does not directly relate to a historical fact or current fact.
Forward-looking statements typically are identified by words or phrases such as “anticipate“, “assume“, “believe“, “continue“, “estimate“, “expect“, “foresee“, “intend“, “may increase“ and “may fluctuate“ and similar expressions or by future or conditional verbs such as “will“, “should“, “would“ and “could“. These forward-looking statements involve known and unknown risks, uncertainties and other factors, which may cause Swiss Re’s actual results of operations, financial condition, solvency ratios, capital or liquidity positions or prospects to be materially different from any future results of operations, financial condition, solvency ratios, capital or liquidity positions or prospects expressed or implied by such statements or cause Swiss Re to not achieve its published targets. Such factors include, among others:
• further instability affecting the global financial system and developments related thereto;
• deterioration in global economic conditions;
• Swiss Re’s ability to maintain sufficient liquidity and access to capital markets, including sufficient liquidity to cover potential recapture of reinsurance agreements, early calls of debt or debt-like arrangements and collateral calls due to actual or perceived deterioration of Swiss Re’s financial strength or otherwise;
• the effect of market conditions, including the global equity and credit markets, and the level and volatility of equity prices, interest rates, credit spreads, currency values and other market indices, on Swiss Re’s investment assets;
• changes in Swiss Re’s investment result as a result of changes in its investment policy or the changed composition of its investment assets, and the impact of the timing of any such changes relative to changes in market conditions;
• uncertainties in valuing credit default swaps and other credit-related instruments;
• possible inability to realise amounts on sales of securities on Swiss Re’s balance sheet equivalent to their mark-to-market values recorded for accounting purposes;
• the outcome of tax audits, the ability to realise tax loss carryforwards and the ability to realise deferred tax assets (including by reason of the mix of earnings in a jurisdiction or deemed change of control), which could negatively impact future earnings;
• the possibility that Swiss Re’s hedging arrangements may not be effective;
• the lowering or loss of one of the financial strength or other ratings of one or more Swiss Re companies, and developments adversely affecting Swiss Re’s ability to achieve improved ratings;
• the cyclicality of the reinsurance industry;
• uncertainties in estimating reserves;
• uncertainties in estimating future claims for purposes of financial reporting, particularly with respect to large natural catastrophes, as significant uncertainties may be involved in estimating losses from such events and preliminary estimates may be subject to change as new information becomes available;
• the frequency, severity and development of insured claim events;
• acts of terrorism and acts of war;
• mortality, morbidity and longevity experience;
• policy renewal and lapse rates;
• extraordinary events affecting Swiss Re’s clients and other counterparties, such as bankruptcies, liquidations and other credit-related events;
• current, pending and future legislation and regulation affecting Swiss Re or its ceding companies, and the interpretation of legislation or regulations by regulators;
• legal actions or regulatory investigations or actions, including those in respect of industry requirements or business conduct rules of general applicability;
• changes in accounting standards;
• significant investments, acquisitions or dispositions, and any delays, unexpected costs or other issues experienced in connection with any such transactions;
• changing levels of competition; and
• operational factors, including the efficacy of risk management and other internal procedures in managing the foregoing risks.
These factors are not exhaustive. Swiss Re operates in a continually changing environment and new risks emerge continually. Readers are cautioned not to place undue reliance on forward-looking statements. Swiss Re undertakes no obligation to publicly revise or update any forward-looking statements, whether as a result of new information, future events or otherwise.
This communication is not intended to be a recommendation to buy, sell or hold securities and does not constitute an offer for the sale of, or the solicitation of an offer to buy, securities in any jurisdiction, including the United States. Any such offer will only be made by means of a prospectus or offering memorandum, and in compliance with applicable securities laws.
Cautionary note on forward-looking statements