iodine clock project - green river college 163/chem 163 labs/lab 1... · exothermic reaction...
TRANSCRIPT

Lab 1 – Chemistry 163 – K. Marr
Revised Spring 2014 Green River Community College - Page 1 of 13
Lab 1. Kinetics of the Iodine Clock Reaction Prelab Assignment
Before coming to lab…
1. Read the lab thoroughly.
2. Follow the guidelines in the "Lab Notebook Policy and Format for Lab Reports" handout and the “Lab
Report Checklist” on page 9 to complete in your lab notebook the following sections of the report for
this lab exercise: Title, Introduction, Materials/Methods and Data Tables. Use the data tables provided
for Parts 1 – 3.
3. For the materials and methods section, simply cut and paste into your notebook the procedures for
parts 1 – 3 on pages 4 – 6, but trim the handout pages so they do not cover the entire notebook page.
You will need two copies of the procedure, one for the original pages and one for the carbon copy
pages. You will need to devise and record your own procedure and data table for part 4!
4. Ensure that the table of contents of your lab notebook is current.
5. Answer the pre-lab questions in the spaces provided at the end of this lab exercise—i.e. the last three
pages of this lab. Background information can be found in Chapter 16, especially sections 16.1-16.3
in your textbook (Silberberg 6th ed).
Introduction
The major goal of this investigation is to determine the factors, both qualitatively as well as quantitatively,
that affect the rate of the iodine clock reaction described below. More specifically, by systematically varying
the concentration of the reactants and measuring the initial reaction rate you will determine the rate law and
the rate constant of reaction 1, below. Next, by carrying out the reaction at several different temperatures you
will determine the activation energy of reaction 1. Lastly, you will investigate the effect of metal ion
catalysts on the rate and activation energy of reaction 1.
The iodine clock reaction is a well-known and memorable chemical reaction where colorless solutions are
mixed and, after a period of time ranging from seconds to minutes, the solution suddenly turns bluish–black.
The reaction you will study is the oxidation–reduction reaction between the peroxydisulfate ion and the
iodide ion, a reaction that is relatively slow at room temperature:
slow
Reaction 1. S2O82-
(aq) + 2 I-
(aq) 2 SO42-
(aq) + I2 (aq)
A starch indicator, which turns blue-black in the presence of iodine, has been added to the reaction mixture.
However, the color does not show right away because a second reaction (reaction 2) takes place, in which
thiosulfate ions consume the iodine molecules as soon as they are produced in reaction 1. fast Reaction 2. I2 (aq) + 2 S2O3
2-(aq) 2 I
-(aq) + S4O6
2-(aq)
fast Reaction 3. I2 (aq) + Starch Starch-I2(aq) (Bluish-black)
Since the first reaction is slow, and the second is fast, the iodine molecules are not present long enough to
react with the starch and produce the color. Hence, it is only after all of the S2O3–2
has been used up that
iodine accumulates, then combines with the starch, and the solution turns blue–black.
Although three reactions are involved, the reaction between peroxydisulfate and iodide ions (reacton1) is the
one of interest. The second reaction (rxn 2) is only used to delay the reaction between iodine and starch (rxn
3)—in other words, all of the thiosulfate must be consumed before the color changes. Without the thiosulfate
ions present, the iodine molecules produced from the 1st reaction would slowly build up and the solution
would gradually darken, making it difficult to identify a definitive point at which the reaction involving the
thiosulfate (rxn 2) is over.
Lab 1 – Chemistry 163 – K. Marr
Revised Spring 2014 Green River Community College - Page 2 of 13
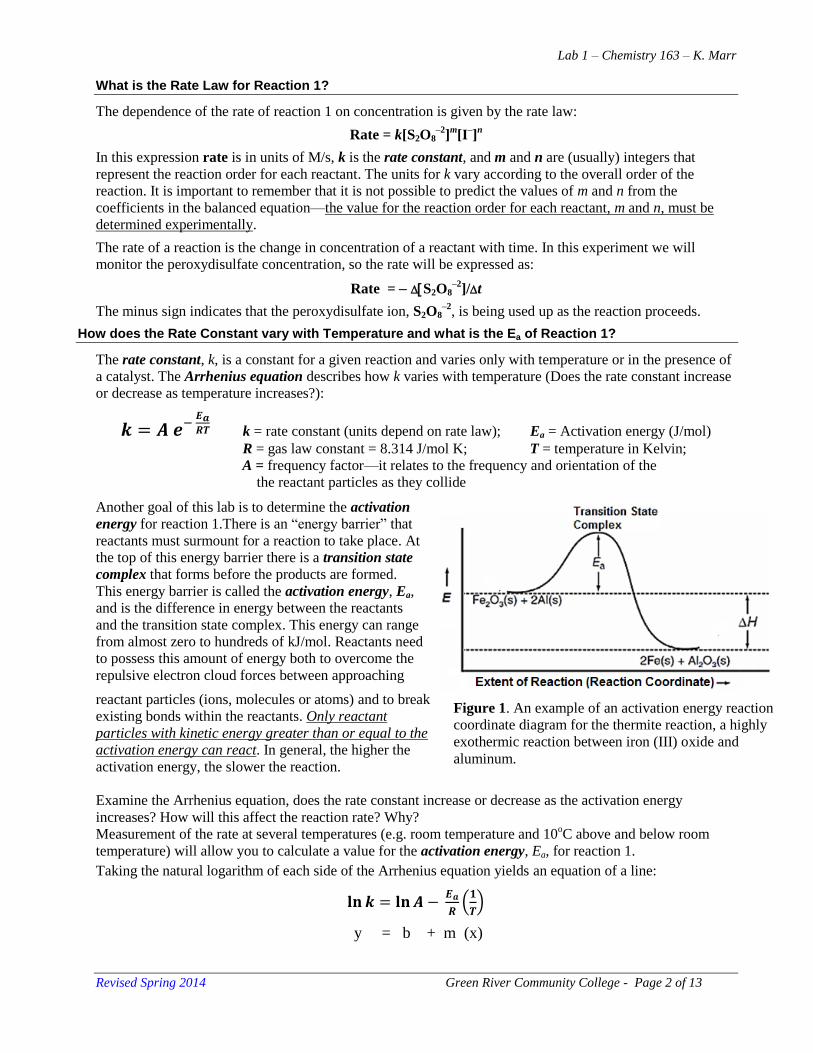
Figure 1. An example of an activation energy reaction
coordinate diagram for the thermite reaction, a highly
exothermic reaction between iron (III) oxide and
aluminum.
What is the Rate Law for Reaction 1?
The dependence of the rate of reaction 1 on concentration is given by the rate law:
Rate = k[S2O8–2
]m[I
–]
n
In this expression rate is in units of M/s, k is the rate constant, and m and n are (usually) integers that
represent the reaction order for each reactant. The units for k vary according to the overall order of the
reaction. It is important to remember that it is not possible to predict the values of m and n from the
coefficients in the balanced equation—the value for the reaction order for each reactant, m and n, must be
determined experimentally.
The rate of a reaction is the change in concentration of a reactant with time. In this experiment we will
monitor the peroxydisulfate concentration, so the rate will be expressed as:
Rate = S2O8–2
]/t
The minus sign indicates that the peroxydisulfate ion, S2O8–2
, is being used up as the reaction proceeds.
How does the Rate Constant vary with Temperature and what is the Ea of Reaction 1?
The rate constant, k, is a constant for a given reaction and varies only with temperature or in the presence of
a catalyst. The Arrhenius equation describes how k varies with temperature (Does the rate constant increase
or decrease as temperature increases?):
k = rate constant (units depend on rate law); Ea = Activation energy (J/mol)
R = gas law constant = 8.314 J/mol K; T = temperature in Kelvin;
A = frequency factor—it relates to the frequency and orientation of the
the reactant particles as they collide
Another goal of this lab is to determine the activation
energy for reaction 1.There is an “energy barrier” that
reactants must surmount for a reaction to take place. At
the top of this energy barrier there is a transition state
complex that forms before the products are formed.
This energy barrier is called the activation energy, Ea,
and is the difference in energy between the reactants
and the transition state complex. This energy can range
from almost zero to hundreds of kJ/mol. Reactants need
to possess this amount of energy both to overcome the
repulsive electron cloud forces between approaching
reactant particles (ions, molecules or atoms) and to break
existing bonds within the reactants. Only reactant
particles with kinetic energy greater than or equal to the
activation energy can react. In general, the higher the
activation energy, the slower the reaction.
Examine the Arrhenius equation, does the rate constant increase or decrease as the activation energy
increases? How will this affect the reaction rate? Why?
Measurement of the rate at several temperatures (e.g. room temperature and 10oC above and below room
temperature) will allow you to calculate a value for the activation energy, Ea, for reaction 1.
Taking the natural logarithm of each side of the Arrhenius equation yields an equation of a line:
(
)
y = b + m (x)
Lab 1 – Chemistry 163 – K. Marr
Revised Spring 2014 Green River Community College - Page 3 of 13
Hence, a plot of ln k vs. 1/T should yield a straight line with a negative slope. The slope can then be used to
calculate the activation energy of reaction 1. What do you need to multiply the slope by to find the value of
the activation energy?
How does a Catalyst affect the Rate and the Ea of Reaction 1?
The final goal of this lab is to determine the effect that a catalyst will have on the rate of reaction for reaction
1. A catalyst is a substance that increases the rate of reaction (both in the forward and reverse directions)
without being consumed in the reaction. Catalysts often allow the reactants to react using a reaction pathway
(or mechanism) that is lower in activation energy than without the presence of the catalyst. Three metal ion
catalysts will be investigated in this lab, Cu2+
ion from copper (II) sulfate, Mg2+
ion from magnesium sulfate
and Cr3+
ion from Chromium (III) sulfate.
For example, with the Cu2+
ion as the catalyst, reaction 1 can be written:
Cu2+
Reaction 1. S2O82-
(aq) + 2 I-
(aq) 2 SO42-
(aq) + I2 (aq)
Go to page 4 for the procedure….

Lab 1 – Chemistry 163 – K. Marr
Revised Spring 2014 Green River Community College - Page 4 of 13
Procedure
Materials
1. Obtain the following items from the lab cart or your drawer:
Stopwatch
Six 250 mL beakers
Six 50 or 100 mL graduated cylinders (use the ones in your drawer plus those on the cart!)
Several clean dry 250 mL Erlenmeyer flasks.
2. Clean and dry six beakers from your lab drawers for the following amounts of solutions; label them so
that you don’t mix them up! Record the identities and actual concentrations of all solutions in your lab
notebook. You will need approximately (please don’t take more than needed):
250 mL of 0.200 M NaI
200 mL of 0.200 M NaCl
200 mL of 0.00500 M Na2S2O3
100 mL of 1% starch solution
200 mL of 0.100 M K2SO4
250 mL of 0.100 M K2S2O8
3. Each of the graduated cylinders must be used for only one solution. Label the six graduated cylinders with the names of the six solutions. Make sure that the cylinders are clean and dry.
Part 1. How does the Concentration of Reactants affect the Rate of Reaction 1? (Work in teams of 4)
4. Record the temperature of the NaI and the K2S2O8 in the beaker. They should be similar.
5. Trial 1:
a.) Using the exact volumes listed for trial 1 in table 1 (measured to the nearest 0.1 mL), add to a 250
mL Erlenmeyer flask all of the solutions except the K2S2O8 (in the order listed above) and swirl
gently to mix.
b.) While one partner monitors the stopwatch, another adds the K2S2O8 to the flask all at once. Begin
timing at the instant the K2S2O8 solution is added. Swirl to get the K2S2O8 solution thoroughly
mixed. Stop timing the instant the solution turns blue. Do not look away from the flask—if you do
you may miss it! It may take up to five minutes for the color to change!
6. Before doing trials 2 – 5, below, go to step 11 of part 2 and do the trials your group is assigned (either
trials 6 and 9 (even-numbered groups) or trials 7 and 8 (odd-numbered groups).
7. Trials 2 and 3: Repeat steps 4 and 5, above, using the solution volumes for the 2nd
and 3rd
trials as shown
in table 1 below.
Table 1. Solution volumes in mL to use in each trial to determine the effect of reactant concentration
Trial
0.200 M
NaI
0.200 M
NaCl
0.00500 M
Na2S2O3
1%
Starch
0.100 M
K2SO4
0.100 M
K2S2O8
Total
Volume
temp
(oC)
Time (s)
Predicted Actual
1 20.0 20.0 20.0 10.0 20.0 20.0 110.0
2 20.0 20.0 20.0 10.0 0.0 40.0 110.0
3 40.0 0.0 20.0 10.0 20.0 20.0 110.0
4 ? ? 20.0 10.0 ? ? 110.0
5 20.0 20.0 20.0 mL of
0.00250 M 10.0 20.0 20.0 110.0
Lab 1 – Chemistry 163 – K. Marr
Revised Spring 2014 Green River Community College - Page 5 of 13
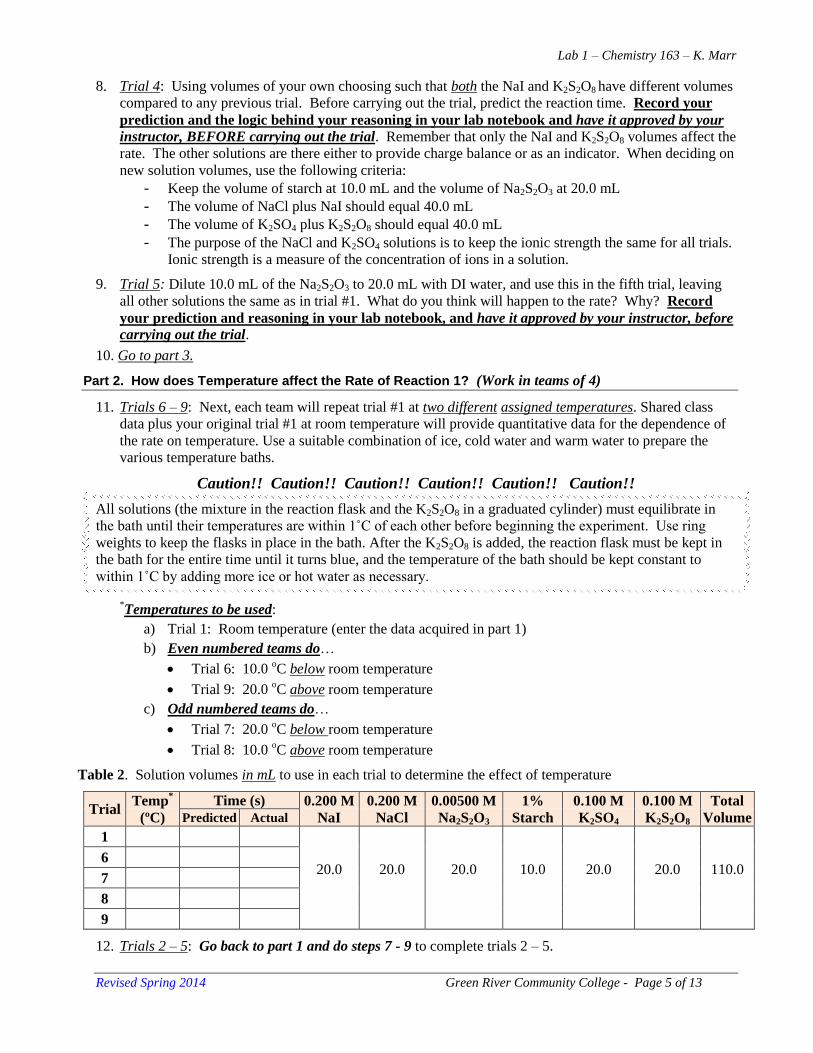
8. Trial 4: Using volumes of your own choosing such that both the NaI and K2S2O8 have different volumes
compared to any previous trial. Before carrying out the trial, predict the reaction time. Record your
prediction and the logic behind your reasoning in your lab notebook and have it approved by your
instructor, BEFORE carrying out the trial. Remember that only the NaI and K2S2O8 volumes affect the
rate. The other solutions are there either to provide charge balance or as an indicator. When deciding on
new solution volumes, use the following criteria:
- Keep the volume of starch at 10.0 mL and the volume of Na2S2O3 at 20.0 mL
- The volume of NaCl plus NaI should equal 40.0 mL
- The volume of K2SO4 plus K2S2O8 should equal 40.0 mL
- The purpose of the NaCl and K2SO4 solutions is to keep the ionic strength the same for all trials.
Ionic strength is a measure of the concentration of ions in a solution.
9. Trial 5: Dilute 10.0 mL of the Na2S2O3 to 20.0 mL with DI water, and use this in the fifth trial, leaving
all other solutions the same as in trial #1. What do you think will happen to the rate? Why? Record
your prediction and reasoning in your lab notebook, and have it approved by your instructor, before
carrying out the trial.
10. Go to part 3.
Part 2. How does Temperature affect the Rate of Reaction 1? (Work in teams of 4)
11. Trials 6 – 9: Next, each team will repeat trial #1 at two different assigned temperatures. Shared class
data plus your original trial #1 at room temperature will provide quantitative data for the dependence of
the rate on temperature. Use a suitable combination of ice, cold water and warm water to prepare the
various temperature baths.
Caution!! Caution!! Caution!! Caution!! Caution!! Caution!!
All solutions (the mixture in the reaction flask and the K2S2O8 in a graduated cylinder) must equilibrate in
the bath until their temperatures are within 1˚C of each other before beginning the experiment. Use ring
weights to keep the flasks in place in the bath. After the K2S2O8 is added, the reaction flask must be kept in
the bath for the entire time until it turns blue, and the temperature of the bath should be kept constant to
within 1˚C by adding more ice or hot water as necessary.
*Temperatures to be used:
a) Trial 1: Room temperature (enter the data acquired in part 1)
b) Even numbered teams do…
Trial 6: 10.0 oC below room temperature
Trial 9: 20.0 oC above room temperature
c) Odd numbered teams do…
Trial 7: 20.0 oC below room temperature
Trial 8: 10.0 oC above room temperature
Table 2. Solution volumes in mL to use in each trial to determine the effect of temperature
Trial Temp
*
(ºC)
Time (s) 0.200 M
NaI
0.200 M
NaCl
0.00500 M
Na2S2O3
1%
Starch
0.100 M
K2SO4
0.100 M
K2S2O8
Total
Volume Predicted Actual
1
20.0
20.0
20.0
10.0
20.0
20.0
110.0
6
7
8
9
12. Trials 2 – 5: Go back to part 1 and do steps 7 - 9 to complete trials 2 – 5.
Lab 1 – Chemistry 163 – K. Marr
Revised Spring 2014 Green River Community College - Page 6 of 13
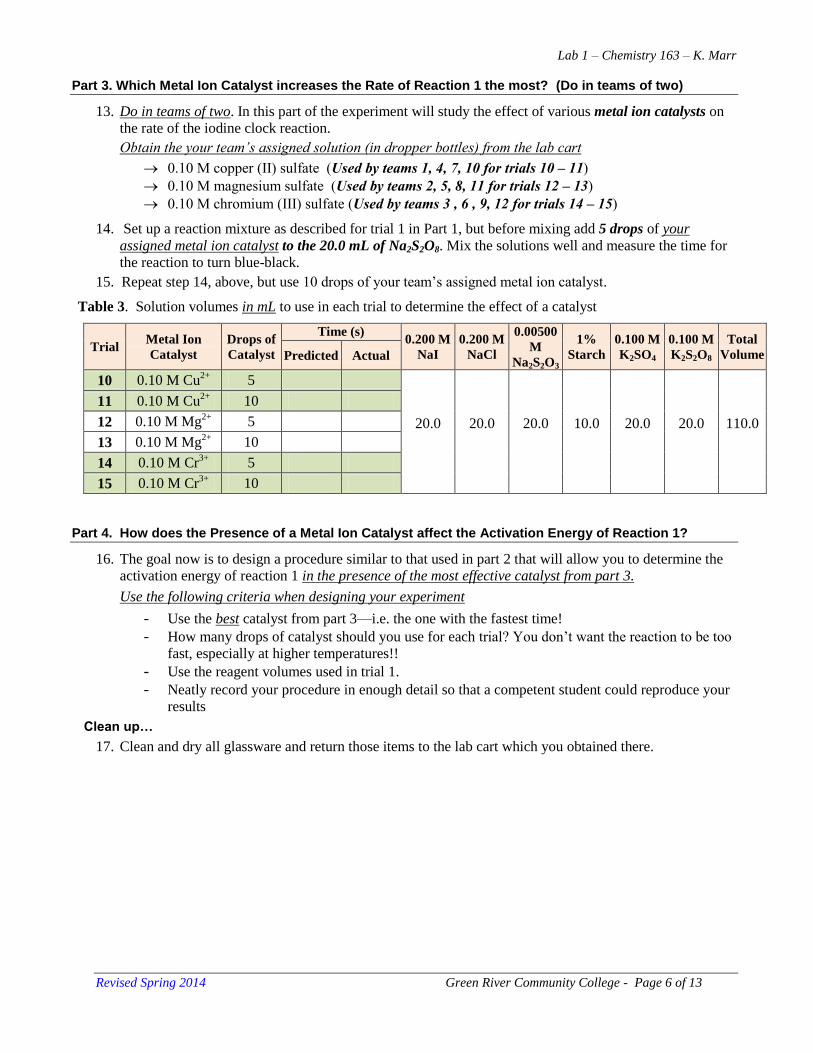
Part 3. Which Metal Ion Catalyst increases the Rate of Reaction 1 the most? (Do in teams of two)
13. Do in teams of two. In this part of the experiment will study the effect of various metal ion catalysts on
the rate of the iodine clock reaction.
Obtain the your team’s assigned solution (in dropper bottles) from the lab cart
0.10 M copper (II) sulfate (Used by teams 1, 4, 7, 10 for trials 10 – 11)
0.10 M magnesium sulfate (Used by teams 2, 5, 8, 11 for trials 12 – 13)
0.10 M chromium (III) sulfate (Used by teams 3 , 6 , 9, 12 for trials 14 – 15)
14. Set up a reaction mixture as described for trial 1 in Part 1, but before mixing add 5 drops of your
assigned metal ion catalyst to the 20.0 mL of Na2S2O8. Mix the solutions well and measure the time for
the reaction to turn blue-black.
15. Repeat step 14, above, but use 10 drops of your team’s assigned metal ion catalyst.
Table 3. Solution volumes in mL to use in each trial to determine the effect of a catalyst
Trial Metal Ion
Catalyst
Drops of
Catalyst
Time (s) 0.200 M
NaI
0.200 M
NaCl
0.00500
M
Na2S2O3
1%
Starch
0.100 M
K2SO4
0.100 M
K2S2O8
Total
Volume Predicted Actual
10 0.10 M Cu2+
5
20.0
20.0
20.0
10.0
20.0
20.0
110.0
11 0.10 M Cu2+
10
12 0.10 M Mg2+
5
13 0.10 M Mg2+
10
14 0.10 M Cr3+
5
15 0.10 M Cr3+
10
Part 4. How does the Presence of a Metal Ion Catalyst affect the Activation Energy of Reaction 1?
16. The goal now is to design a procedure similar to that used in part 2 that will allow you to determine the
activation energy of reaction 1 in the presence of the most effective catalyst from part 3.
Use the following criteria when designing your experiment
- Use the best catalyst from part 3—i.e. the one with the fastest time!
- How many drops of catalyst should you use for each trial? You don’t want the reaction to be too
fast, especially at higher temperatures!!
- Use the reagent volumes used in trial 1.
- Neatly record your procedure in enough detail so that a competent student could reproduce your
results
Clean up…
17. Clean and dry all glassware and return those items to the lab cart which you obtained there.
Lab 1 – Chemistry 163 – K. Marr
Revised Spring 2014 Green River Community College - Page 7 of 13
Calculations
Part 1. How does the Concentration of Reactants affect the Rate of Reaction 1?
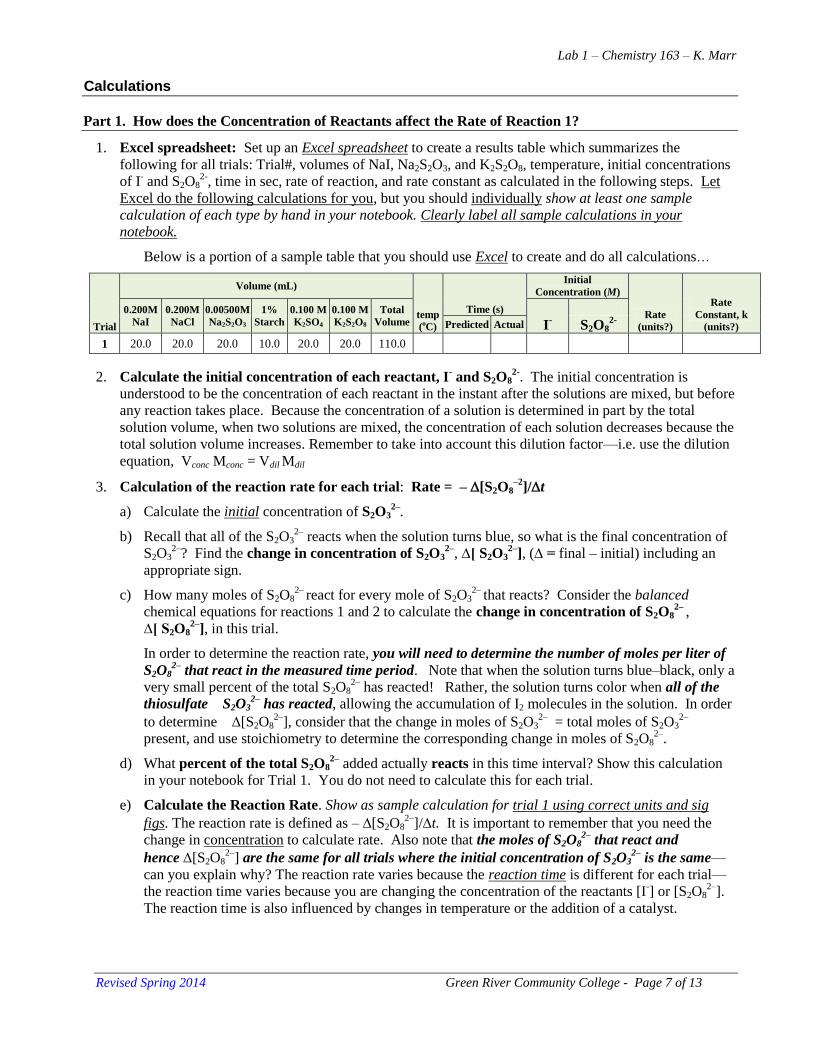
1. Excel spreadsheet: Set up an Excel spreadsheet to create a results table which summarizes the
following for all trials: Trial#, volumes of NaI, Na2S2O3, and K2S2O8, temperature, initial concentrations
of I- and S2O8
2-, time in sec, rate of reaction, and rate constant as calculated in the following steps. Let
Excel do the following calculations for you, but you should individually show at least one sample
calculation of each type by hand in your notebook. Clearly label all sample calculations in your
notebook.
Below is a portion of a sample table that you should use Excel to create and do all calculations…
Trial
Volume (mL)
temp
(oC)
Time (s)
Initial
Concentration (M)
Rate
(units?)
Rate
Constant, k
(units?)
0.200M
NaI
0.200M
NaCl
0.00500M
Na2S2O3
1%
Starch
0.100 M
K2SO4
0.100 M
K2S2O8
Total
Volume I-
Predicted Actual S2O82-
1 20.0 20.0 20.0 10.0 20.0 20.0 110.0
2. Calculate the initial concentration of each reactant, I- and S2O8
2-. The initial concentration is
understood to be the concentration of each reactant in the instant after the solutions are mixed, but before
any reaction takes place. Because the concentration of a solution is determined in part by the total
solution volume, when two solutions are mixed, the concentration of each solution decreases because the
total solution volume increases. Remember to take into account this dilution factor—i.e. use the dilution
equation, Vconc Mconc = Vdil Mdil
3. Calculation of the reaction rate for each trial: Rate = – [S2O8–2
]/t
a) Calculate the initial concentration of S2O32–
.
b) Recall that all of the S2O32–
reacts when the solution turns blue, so what is the final concentration of
S2O32–
? Find the change in concentration of S2O32–
, ∆[ S2O32–
], (∆ = final – initial) including an
appropriate sign.
c) How many moles of S2O82–
react for every mole of S2O32–
that reacts? Consider the balanced
chemical equations for reactions 1 and 2 to calculate the change in concentration of S2O82–
,
∆[ S2O82–
], in this trial.
In order to determine the reaction rate, you will need to determine the number of moles per liter of
S2O82–
that react in the measured time period. Note that when the solution turns blue–black, only a
very small percent of the total S2O82–
has reacted! Rather, the solution turns color when all of the
thiosulfate S2O32–
has reacted, allowing the accumulation of I2 molecules in the solution. In order
to determine [S2O82–
], consider that the change in moles of S2O32–
= total moles of S2O32–
present, and use stoichiometry to determine the corresponding change in moles of S2O82–
.
d) What percent of the total S2O82–
added actually reacts in this time interval? Show this calculation
in your notebook for Trial 1. You do not need to calculate this for each trial.
e) Calculate the Reaction Rate. Show as sample calculation for trial 1 using correct units and sig
figs. The reaction rate is defined as – [S2O82–
]/t. It is important to remember that you need the
change in concentration to calculate rate. Also note that the moles of S2O82–
that react and
hence[S2O82–
] are the same for all trials where the initial concentration of S2O32–
is the same—
can you explain why? The reaction rate varies because the reaction time is different for each trial—
the reaction time varies because you are changing the concentration of the reactants [I-] or [S2O8
2–].
The reaction time is also influenced by changes in temperature or the addition of a catalyst.

Lab 1 – Chemistry 163 – K. Marr
Revised Spring 2014 Green River Community College - Page 8 of 13
4. a) Determine the rate law for Reaction 1. From the data above, determine the rate law for the
reaction, i.e., what are m and n in the rate law, rate = k[S2O8–2
]m[I
–]
n? Solve for m and n precisely
using logarithms—See Section 16.3 and/or the model on page 3 of ALE 2 if you need help! Report
both the decimal number obtained experimentally and the closest integer value. Use the integer
values in the next step.
b) From the above data, write the rate law for reaction 1, i.e., what are m and n in the rate law,
rate = k[S2O82–
]m[I
–]
n?
5. Calculate the rate constant for Reaction 1 at room temperature. Assuming the orders are integers,
calculate the rate constant, k, for each trial using your Excel spreadsheet!! As long as the temperature is
constant, k should be the same for the first five trials, so use your Excel spreadsheet to find an average
rate constant, k, at room temperature. Show a sample calculation for trial 1 and be sure to include the
correct units and sig figs.
Part 2. How does Temperature affect the Rate of Reaction 1?
6. Make an Arrhenius Plot and Calculate the Activation Energy for Reaction 1.
a) Using the trial #1 data at different temperatures (including room temperature), make an Excel table
of k, ln k, T, and 1/T. Make Excel do these calculations.
b) Use Excel to make an Arrhenius plot of ln k vs 1/T, and include the correlation R2 and the equation
of the linear trendline on your graph. Use the slope of the linear fit to calculate the activation energy
Ea in kJ for the reaction and show this calculation in your lab notebook (individual). Be sure to
include the correct units and use correct significant figures.
c) Paste or tape in the results section of your notebook the Excel table and a properly formatted
Arrhenius plot.
Part 3. Which Metal Ion Catalyst increases the Rate of Reaction 1 the most?
7. Calculate the rate of reaction in the presence of each of the three catalysts at room temperature.
a) By what factor does each catalyst increase the rate of reaction #1 at room temperature?
b) What effect does doubling the number of drops of catalyst have on the rate of reaction 1? Cite
specific supporting numerical data.
c) Explain why changing the amount of catalyst has the observed effect.
Part 4. How does the Presence of a Metal Ion Catalyst affect the Activation Energy of Reaction 1?
8. Calculate the rate constant for Reaction 1 in the presence of a catalyst. Assuming the orders,
“m” and “n,” are integers, calculate the rate constant, k, for each temperature. Be sure to include the
correct units.
9. Make an Arrhenius Plot and Calculate the Activation Energy for Reaction 1 in the presence of
the metal ion catalyst. Using the data from trial #1 with the best metal ion catalyst at different
temperatures (including room temperature), make an Excel table of k, ln k, T, and 1/T. Make Excel
do these calculations. Use Excel to make an Arrhenius plot of ln k vs 1/T, and include the
correlation R2 and the equation of the linear trendline on your graph. Use the slope of the linear fit
to calculate the activation energy Ea in kJ for the reaction and show this calculation in your lab
notebook (individual). Be sure to include the correct units and use correct significant figures. Paste
or tape in the results section of your notebook the Excel table and a properly formatted Arrhenius
plot.
10. Compare the activation energy of reaction 1 with and without catalyst. Explain why they may or
may not be different. Cite specific numerical data to support any and all conclusions.
Lab 1 – Chemistry 163 – K. Marr
Revised Spring 2014 Green River Community College - Page 9 of 13
Analysis of the Results
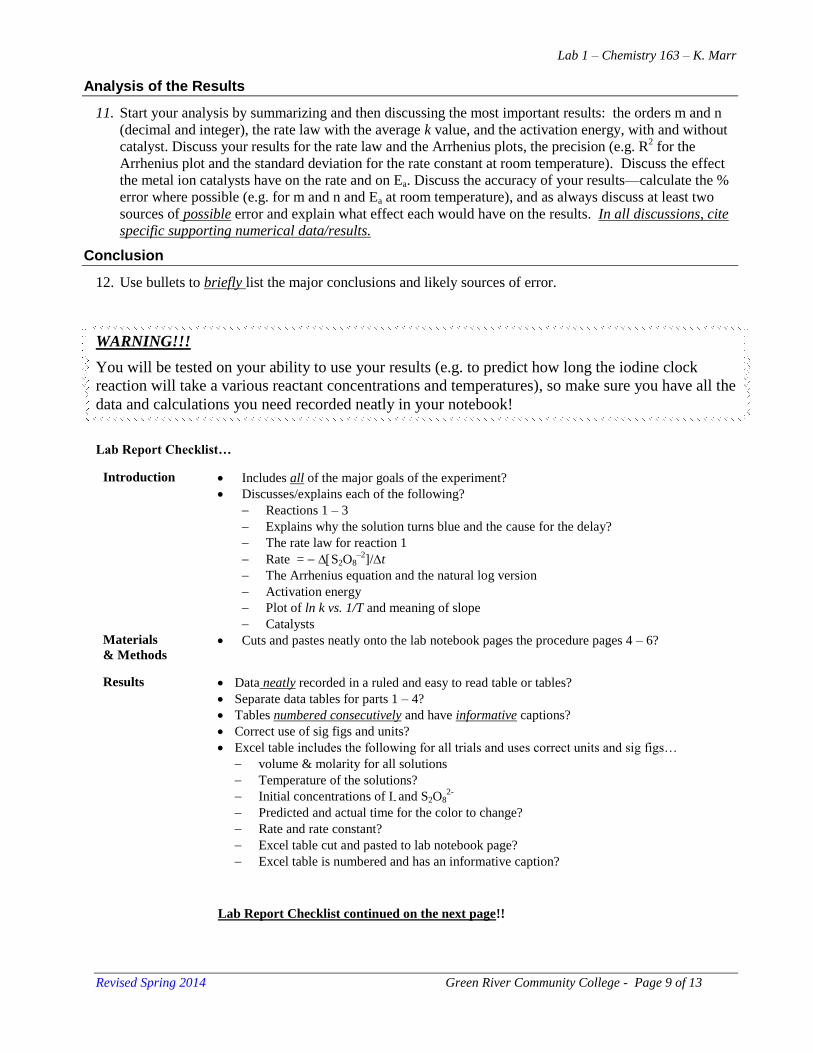
11. Start your analysis by summarizing and then discussing the most important results: the orders m and n
(decimal and integer), the rate law with the average k value, and the activation energy, with and without
catalyst. Discuss your results for the rate law and the Arrhenius plots, the precision (e.g. R2 for the
Arrhenius plot and the standard deviation for the rate constant at room temperature). Discuss the effect
the metal ion catalysts have on the rate and on Ea. Discuss the accuracy of your results—calculate the %
error where possible (e.g. for m and n and Ea at room temperature), and as always discuss at least two
sources of possible error and explain what effect each would have on the results. In all discussions, cite
specific supporting numerical data/results.
Conclusion
12. Use bullets to briefly list the major conclusions and likely sources of error.
WARNING!!!
You will be tested on your ability to use your results (e.g. to predict how long the iodine clock
reaction will take a various reactant concentrations and temperatures), so make sure you have all the
data and calculations you need recorded neatly in your notebook!
Lab Report Checklist…
Introduction Includes all of the major goals of the experiment?
Discusses/explains each of the following?
Reactions 1 – 3
Explains why the solution turns blue and the cause for the delay?
The rate law for reaction 1
Rate = S2O8–2
]/t
The Arrhenius equation and the natural log version
Activation energy
Plot of ln k vs. 1/T and meaning of slope
Catalysts
Materials
& Methods Cuts and pastes neatly onto the lab notebook pages the procedure pages 4 – 6?
Results
Data neatly recorded in a ruled and easy to read table or tables?
Separate data tables for parts 1 – 4?
Tables numbered consecutively and have informative captions?
Correct use of sig figs and units?
Excel table includes the following for all trials and uses correct units and sig figs…
volume & molarity for all solutions
Temperature of the solutions?
Initial concentrations of I- and S2O82-
Predicted and actual time for the color to change?
Rate and rate constant?
Excel table cut and pasted to lab notebook page?
Excel table is numbered and has an informative caption?
Lab Report Checklist continued on the next page!!
Lab 1 – Chemistry 163 – K. Marr
Revised Spring 2014 Green River Community College - Page 10 of 13
Calculations
Lab Report Checklist (cont.)
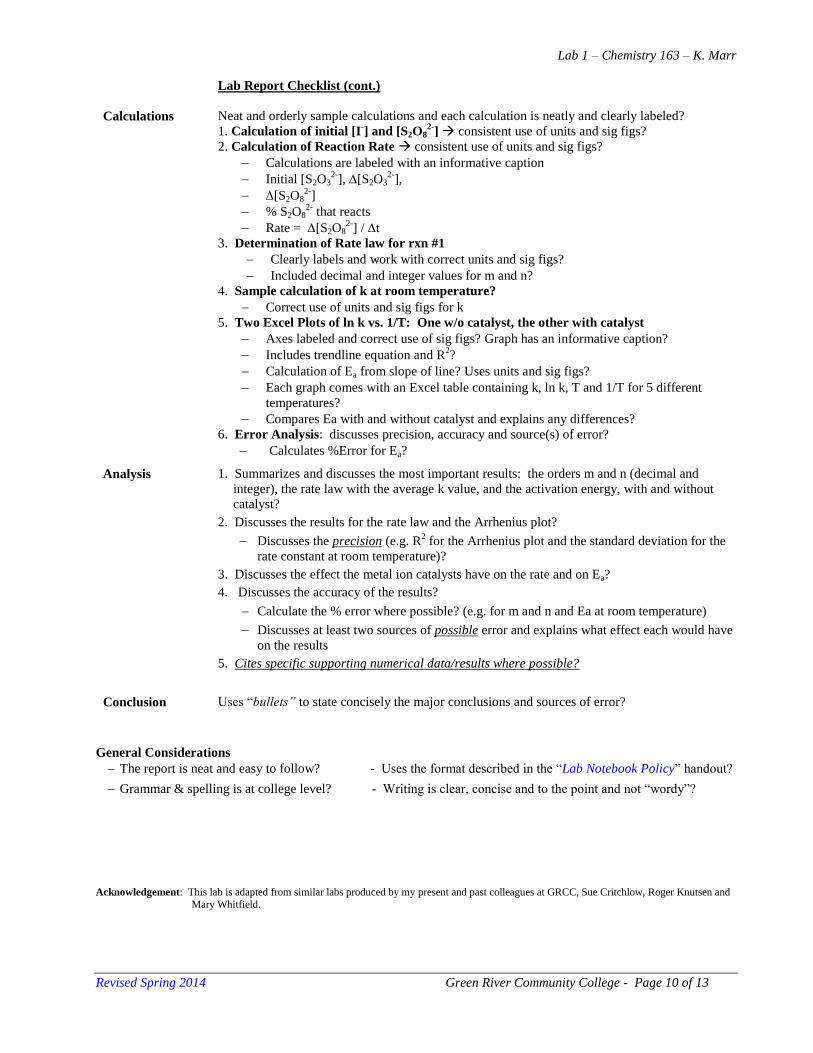
Neat and orderly sample calculations and each calculation is neatly and clearly labeled?
1. Calculation of initial [I-] and [S2O8
2-] consistent use of units and sig figs?
2. Calculation of Reaction Rate consistent use of units and sig figs?
Calculations are labeled with an informative caption
Initial [S2O32-
], [S2O32-
],
[S2O82-
]
% S2O82-
that reacts
Rate = [S2O82-
] / t
3. Determination of Rate law for rxn #1
Clearly labels and work with correct units and sig figs?
Included decimal and integer values for m and n?
4. Sample calculation of k at room temperature?
Correct use of units and sig figs for k
5. Two Excel Plots of ln k vs. 1/T: One w/o catalyst, the other with catalyst
Axes labeled and correct use of sig figs? Graph has an informative caption?
Includes trendline equation and R2?
Calculation of Ea from slope of line? Uses units and sig figs?
Each graph comes with an Excel table containing k, ln k, T and 1/T for 5 different
temperatures?
Compares Ea with and without catalyst and explains any differences?
6. Error Analysis: discusses precision, accuracy and source(s) of error?
Calculates %Error for Ea?
Analysis
1. Summarizes and discusses the most important results: the orders m and n (decimal and
integer), the rate law with the average k value, and the activation energy, with and without
catalyst?
2. Discusses the results for the rate law and the Arrhenius plot?
Discusses the precision (e.g. R2 for the Arrhenius plot and the standard deviation for the
rate constant at room temperature)?
3. Discusses the effect the metal ion catalysts have on the rate and on Ea?
4. Discusses the accuracy of the results?
Calculate the % error where possible? (e.g. for m and n and Ea at room temperature)
Discusses at least two sources of possible error and explains what effect each would have
on the results
5. Cites specific supporting numerical data/results where possible?
Conclusion
Uses “bullets” to state concisely the major conclusions and sources of error?
General Considerations
The report is neat and easy to follow? - Uses the format described in the “Lab Notebook Policy” handout?
Grammar & spelling is at college level? - Writing is clear, concise and to the point and not “wordy”?
Acknowledgement: This lab is adapted from similar labs produced by my present and past colleagues at GRCC, Sue Critchlow, Roger Knutsen and
Mary Whitfield.
Lab 1 – Chemistry 163 – K. Marr
Revised Spring 2014 Green River Community College - Page 11 of 13
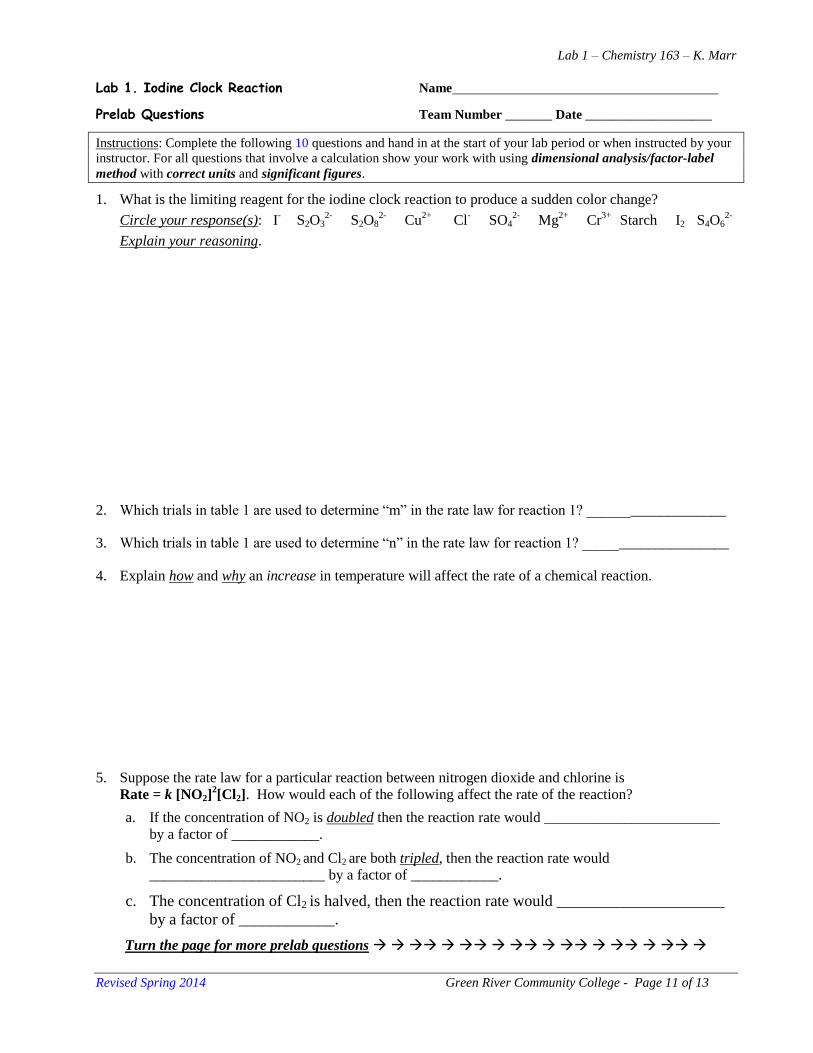
Lab 1. Iodine Clock Reaction Name
Prelab Questions Team Number _______ Date ___________________
Instructions: Complete the following 10 questions and hand in at the start of your lab period or when instructed by your
instructor. For all questions that involve a calculation show your work with using dimensional analysis/factor-label
method with correct units and significant figures.
1. What is the limiting reagent for the iodine clock reaction to produce a sudden color change?
Circle your response(s): I-
S2O32-
S2O82-
Cu2+
Cl- SO4
2- Mg
2+ Cr
3+ Starch I2 S4O6
2-
Explain your reasoning.
2. Which trials in table 1 are used to determine “m” in the rate law for reaction 1? ___________________
3. Which trials in table 1 are used to determine “n” in the rate law for reaction 1? ____________________
4. Explain how and why an increase in temperature will affect the rate of a chemical reaction.
5. Suppose the rate law for a particular reaction between nitrogen dioxide and chlorine is
Rate = k [NO2]2[Cl2]. How would each of the following affect the rate of the reaction?
a. If the concentration of NO2 is doubled then the reaction rate would ________________________
by a factor of ____________.
b. The concentration of NO2 and Cl2 are both tripled, then the reaction rate would
________________________ by a factor of ____________.
c. The concentration of Cl2 is halved, then the reaction rate would _____________________
by a factor of ____________.
Turn the page for more prelab questions
Lab 1 – Chemistry 163 – K. Marr
Revised Spring 2014 Green River Community College - Page 12 of 13
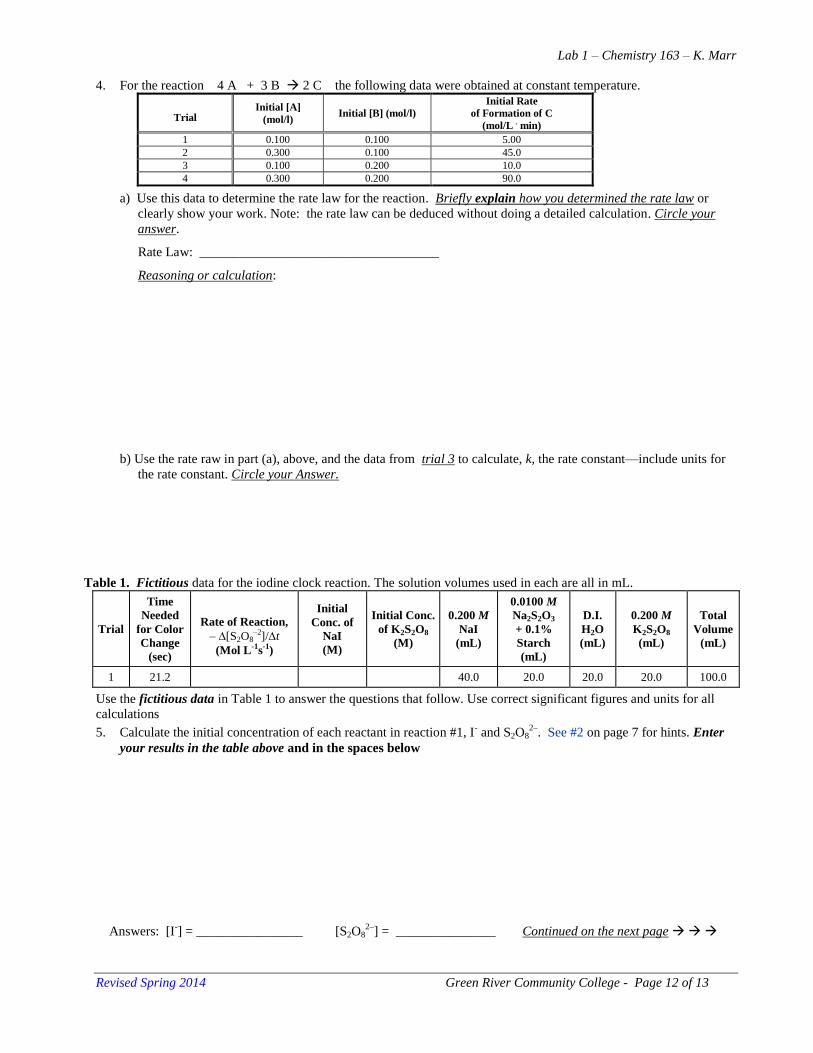
4. For the reaction 4 A + 3 B 2 C the following data were obtained at constant temperature.
Trial Initial [A]
(mol/l) Initial [B] (mol/l)
Initial Rate
of Formation of C
(mol/L . min)
1 0.100 0.100 5.00
2 0.300 0.100 45.0
3 0.100 0.200 10.0
4 0.300 0.200 90.0
a) Use this data to determine the rate law for the reaction. Briefly explain how you determined the rate law or
clearly show your work. Note: the rate law can be deduced without doing a detailed calculation. Circle your
answer.
Rate Law: ____________________________________
Reasoning or calculation:
b) Use the rate raw in part (a), above, and the data from trial 3 to calculate, k, the rate constant—include units for
the rate constant. Circle your Answer.
Table 1. Fictitious data for the iodine clock reaction. The solution volumes used in each are all in mL.
Trial
Time
Needed
for Color
Change
(sec)
Rate of Reaction,
– [S2O8–2]/t
(Mol L-1s-1)
Initial
Conc. of
NaI
(M)
Initial Conc.
of K2S2O8
(M)
0.200 M
NaI
(mL)
0.0100 M
Na2S2O3
+ 0.1%
Starch
(mL)
D.I.
H2O
(mL)
0.200 M
K2S2O8
(mL)
Total
Volume
(mL)
1 21.2 40.0 20.0 20.0 20.0 100.0
Use the fictitious data in Table 1 to answer the questions that follow. Use correct significant figures and units for all
calculations
5. Calculate the initial concentration of each reactant in reaction #1, I- and S2O8
2–. See #2 on page 7 for hints. Enter
your results in the table above and in the spaces below
Answers: [I-] = ________________ [S2O8
2–] = _______________ Continued on the next page

Lab 1 – Chemistry 163 – K. Marr
Revised Spring 2014 Green River Community College - Page 13 of 13
6. Calculate the initial concentration of S2O32–
. See #2 on page 7 for hints. Circle your answer and enter it in the
space below.
[S2O3
2–] = _________________
7. All of the S2O32–
reacts when the solution turns blue, so what is the final concentration of S2O32–
? Find the change
in concentration of S2O32–
(as final – initial) including an appropriate sign. See #3 on page 7 for hints. Circle your
answer and enter it in the space below.
∆[ S2O32–
] =_____________________
8. How many moles of S2O82–
react for every mole of S2O32–
that reacts? Consider the balanced chemical equations
for reactions 1 and 2 to calculate the change in concentration of S2O82–
, [S2O82–
], in this trial. See #3 on page 7 for
hints. Circle your answer and enter it in the space below.
∆[ S2O8
2–] =_____________________
9. What percent of the total S2O82–
added actually reacts in this time interval? See #3 on page 7 for hints. Circle your
answer and enter it in the space below.
% S2O82–
that reacts =_____________________
10. Calculate the rate of reaction for this trial. See #3 on page 7 for hints. Circle your answer and enter it in the space
below.
∆[ S2O82–
]/T =_____________________