ioe481/ioe481_past_reports/f1309.docx · web viewanalysis of time studies highlights certain...
TRANSCRIPT

MCRU 2U Workflow Analysis
Final Report
Submitted To:
Cyndi BowerAdministrative Director
Michigan Institute for Clinical Research1500 E. Medical Center Dr.
Ann Arbor, MI 48109
Margaret McCammonResearch Translation Specialist
Michigan Institute for Clinical Research1500 E. Medical Center Dr.
Ann Arbor, MI 48109
Amanda SilvaCentral Lean Coach and Coordinator
University of Michigan Health System2101 Commonwealth Blvd, Suite A
Ann Arbor, MI 48105
Chris Kafantaris Industrial Engineering Fellow and Coordinator
Program & Operations Analysis2101 Commonwealth Blvd, Suite A
Ann Arbor, MI 48105
Professor Mark Van OyenAssociate Professor
University of Michigan Industrial and Operations Engineering Department1205 Beal Ave.
Ann Arbor, MI 48109
Submitted By:
Team 9Joseph Beck, Emily Lozon, Shair Malik
Date Submitted: December 10, 2013

Table of Contents
Executive Summary.........................................................................................................................1
Project Goals...............................................................................................................................1
Methods........................................................................................................................................1
Findings.......................................................................................................................................2
Process Variation.....................................................................................................................2
Volume through Processes.......................................................................................................2
Conclusions..................................................................................................................................3
Conclusions from Process Variation........................................................................................3
Conclusions from Volume through Processes..........................................................................3
Recommendations........................................................................................................................3
Short Term Recommendations.................................................................................................3
Long Term Recommendations..................................................................................................3
Introduction......................................................................................................................................4
Background......................................................................................................................................4
Key Issues.....................................................................................................................................6
Goals and Objectives...................................................................................................................6
Project Scope...............................................................................................................................6
Methodology....................................................................................................................................6
Observations and Time Studies....................................................................................................7
Research for Workflow and Staff Assignment and Allocation.........................................................7
MCRU 2U Employee Survey........................................................................................................8
Historical Data Set Analysis........................................................................................................8
Methods for Data Analysis...........................................................................................................9
Findings and Conclusions..............................................................................................................10
Process Variation.......................................................................................................................10
High Variation in Process Steps............................................................................................10
Variation in Protocol Locations.............................................................................................12
Variation of Staff Performance and Opinions........................................................................12
Conclusions from Process Variation......................................................................................15
Volume through Processes.........................................................................................................15

Time Range Analysis..............................................................................................................16
Location Analysis...................................................................................................................17
Protocol Analysis...................................................................................................................18
Conclusions from Volume through Processes........................................................................19
Recommendations..........................................................................................................................20
Short Term Recommendations...................................................................................................20
Long Term Recommendations....................................................................................................21
Expected Impact or Outcome........................................................................................................21
Understanding Process Variability............................................................................................21
Understanding Volume through Processes................................................................................22
Appendix 1: Time Studies Data Collection Sheet.........................................................................23
Appendix 2: MCRU Survey..........................................................................................................24
Appendix 3: Protocol Trends.........................................................................................................26
Appendix 4: Further Survey Results..............................................................................................29
Appendix 5: Average Man Time...................................................................................................33

List of Figures and Tables
Figure E-1 : MCRU 2U Workflow Process2
Figure 1 : Trigger Process for Mobile Clinical Research Unit5
Figure 2 : MCRU 2U Workflow Process0
Figure 3 : Interval A has Highest Average Process Time and Spread1
Figure 4 : Extended MCRU 2U Workflow Process1
Figure 5 : Over Half of MCRU 2U Staff Does Not Take Backpack3
Figure 6 : MCRU 2U Backpack is Disorganized and Heavy4
Figure 7 : MCRU 2U Staff Agree Walking Takes a Good Portion of Service Time5
Figure 8 : Tuesday and Thursday Receive Highest Number of Calls
Figure 9 : Five Protocols Contribute 31% of Mobile Visits8
Figure 4-1 : Most Employees go on 3 to 5 Mobile Visits per Week29
Figure 4-2 : MCRU 2U Staff Agree that Number of Calls Vary Daily30
Figure 4-3 : MCRU 2U Staff Believe Assigned Scheduling will Interfere with Work
Figure 4-4 : MCRU 2U Staff Disagree that there is enough staff to meet MCRU 2U Demand
Figure 4-5 : MCRU 2U Staff are Neutral Regarding MCRU 2U Interfering with Daily Work3
Figure 4-6 : MCRU 2U Staff Disagree that large portion of their job involves MCRU 2U3
Table 1: Duration by Location and Process Step (minutes)..........................................................12
Table 2: Average Call Frequency by Time....................................................................................17
Table 3: Average Call Frequency by Location..............................................................................17
Table 4: Trends for the Top Five Serviced Protocols....................................................................19
Table 5: Expected Man Time and Staffing Requirements at 80th percentile (minutes)
Table 3-1: Protocol Frequency Data
Table 5-1: Average Man Time (minutes)

Executive Summary
The Michigan Clinical Research Unit (MCRU) provides clinical staff and resources to perform human clinical trial research protocols at the University of Michigan. The Administrative Director reported that an increase in demand (from 15 to 2700 visits since 2007) has led to a chaotic and inefficient model for one of their core clinical services, the Mobile Clinical Research Team (MCRU 2U). Workers within MCRU report inefficiency and high variability in the workflow process, which have resulted in unpredictability in demand, demand exceeding staff capacity, and research protocols that interrupt the daily duties of nurses and medical assistants. To address these problems, workers within MCRU 2U asked an IOE 481 student team from the University of Michigan to conduct a series of observations and analyses to help understand current workflow and recommend an improved workflow. The team was also asked to determine if the current model can be scaled to fit current and future demand or if MCRU 2U needs to be offered as a separate service with more allocated resources.
Project Goals
To help sustain and improve the current MCRU 2U model, the student team achieved the following tasks:
Conducted a series of studies to understand the current workflow and demographic trends within MCRU 2U
Identified sources of inefficiencies, redundancy, disorganization, and variation
Methods
The team performed four types of tasks to evaluate and improve the current MCRU 2U workflow process.
Performed Time studies. First, the student team shadowed 10 mobile visits to understand time between processes and to understand process variability. The team calculated average duration and standard deviation for each process step.
Administered MCRU employee surveys. The team developed and administered a survey to 9 MCRU 2U staff to quantify the opinions of the staff regarding MCRU 2U. The student team further analyzed surveys to reflect on process variability from staff perspective.
Analyzed historical data set. The team analyzed demographic trends from 1590 mobile visits dated between June 2012 and May 2013. The team received this information from the Research Translation Specialist and used it to answer the following questions:
o What day of the week receives a majority of MCRU 2U calls? What is the variability in calls on these days?
o What times are a majority of the calls being received?o What location is being serviced the most based on time of day?o What location is being serviced the most based on day of week?

o What protocols are serviced the most? o What protocols are serviced on the same day within 30 minutes (back-to-back)?
How often? Developed recommendations for improving the workflow. The team created a list of steps
that MCRU 2U could take to understand their demand better and minimize process variability.
Findings
Analysis of the time studies, surveys, and historical data set were divided into two main categories: Process Variation and Volume through Process.
Process Variation Analysis of time studies highlights certain problems within the MCRU 2U workflow process. Process steps in Figure E-1 were grouped into different intervals to help identify these problems. Figure E-1 shows that traveling from MCRU to the site and traveling back to MCRU after the completion of a service accounted for 7 and 9 minutes on average, respectively. Intervals A1 and B2 have high standard deviations, at 6 and 5 minutes, respectively. The high standard deviations means that there is high variation from the time a call is received to when supplies are collected and from the start of a service to the end of a service.
Figure E-1: MCRU 2U Workflow ProcessOctober 9-19, 2013; N = 10; Time Studies
Volume through Processes Findings from the historical data set show that Tuesdays and Thursdays had the highest average number of calls, at 7.32 and 7.10 calls, respectively. In addition, Thursday had the highest variability in calls while Monday had the lowest. Analysis of different time blocks showed that Tuesdays between 11:00 and 13:00 had highest average number of calls at 2.84 calls. Finally, analysis of different locations indicated that Mott Hospital, on Thursdays, had the highest average number of calls at 3.09 calls.

Conclusions
The following section provides the conclusions formed after analysis and evaluation of the findings, which are based on Process Variation and Volume through Processes
Conclusions from Process Variation Analysis of the process variation data showed that there is high variation from the time a call is received to the time staff starts their service, specifically when the calls come from the University Hospital and Mott Hospital. In addition, the amount of time MCRU 2U staff waits to start a service upon arrival at the site needs to be shortened. Finally, walking constituted over 40% of the total process time and needs to be reduced.
Conclusions from Volume through ProcessesAnalysis of the demographic trends showed that MCRU 2U should schedule more staff more Tuesdays and Thursdays, specifically between 09:00 and 13:00. MCRU 2U should plan to service the Taubman Center primarily on Mondays, Tuesdays, and Wednesdays, and Mott Hospital on Thursdays and Fridays. Finally, analysis of all protocols showed that 11% of all protocols are contributing to 50% of total mobile visits from June 2012 to May 2013.
Recommendations
The student team developed a list of short term and long term recommendations to help MCRU 2U increase the predictability of their process and meet demand.
Short Term Recommendations The short term recommendations are actions MCRU 2U can implement in the near future. The team recommends that MCRU 2U implement guidelines and organizational methods that help control the variable demand and predict future calls. This can be done by making the following changes:
Screen investigators during the initial call Add storage units at the most frequently served locations, such as the Taubman Center
and Mott’s Hospital Develop new organizational method for backpack Develop nurse assignments based on demographic trends Regulate calls by establishing guidelines with PIs
Long Term Recommendations The long term recommendations focus on continual improvement and sustainability of the MCRU 2U process.
Clean and validate data regularly so it is easier to understand for all users Record and input data using a standardized method (create organized excel template,
discuss with employees the importance of recording accurate measurements) Regularly analyze (every 3-4 months) trends between times, locations, and protocols to
understand workflow and to assess the need for potential improvements

Perform further studies to analyze demand and potential areas of improvementsIntroduction
The Michigan Clinical Research Unit (MCRU) is a unit within University of Michigan Health Services (UMHS) that provides clinical staff and resources to perform human clinical trial research protocols at the University of Michigan (UM). Many of these research protocols take place at UM’s Cardiovascular Center (CVC). In 2007, MCRU implemented a Mobile Clinical Research Support Team (MCRU 2U) as an addition to its core services. MCRU 2U staff provides clinical research support to clinical investigators. Instead of having participants come into the CVC to perform these protocols, MCRU 2U staff goes to the participant. Since its implementation in 2007, the service has grown from 15 to 2700 visits annually through word of mouth.
The Administrative Director of the Research Innovation Core reported that an increase in demand for mobile visits has led to a chaotic and no longer efficient model. Workers within this unit report inefficiency and disorganization in the workflow process. Inefficiencies result in high variation and unpredictability in the workflow process, demand exceeding staff capacity, and research protocols that interrupt the daily duties of nurses and medical assistants.
To address this problem, workers within MCRU 2U asked an IOE 481 student team from the University of Michigan to conduct a series of tests to analyze the current workflow and to provide an improved workflow. After conducting observations, interviews, and further analyses, the team has determined if the current model can be scaled to fit current and future demand, or if MCRU 2U needs to be offered as a separate service with more allocated resources. This report details the student team’s data collection and analysis methods, and presents the team’s findings, conclusions and recommendations.
Background
MCRU, located in the Cardiovascular Center (CVC), is a unit within UMHS and the Michigan Institute for Clinical and Health Research (MICHR) that provides the clinical staff and resources necessary to perform human clinical research protocols at the University of Michigan. MCRU also serves as an institutional resource, allowing investigators to perform pilot studies. Investigators who are federally, philanthropically, and industrially sponsored are serviced by MCRU.
One of the core clinical services provided by MCRU is the mobile service, MCRU 2U. MCRU 2U was implemented in 2007 with hopes of providing improved access to clinical research support services with little increase in resources. In addition, the mobile service hoped to extend the practice of clinical research outside the MCRU, increase enrollment, and decrease dropout rates.
The clinical staff within the MCRU 2U team provides services and support to clinical investigators. The mobile team services investigators by responding to specialized protocols, which include PK blood draws, ECGs, etc.

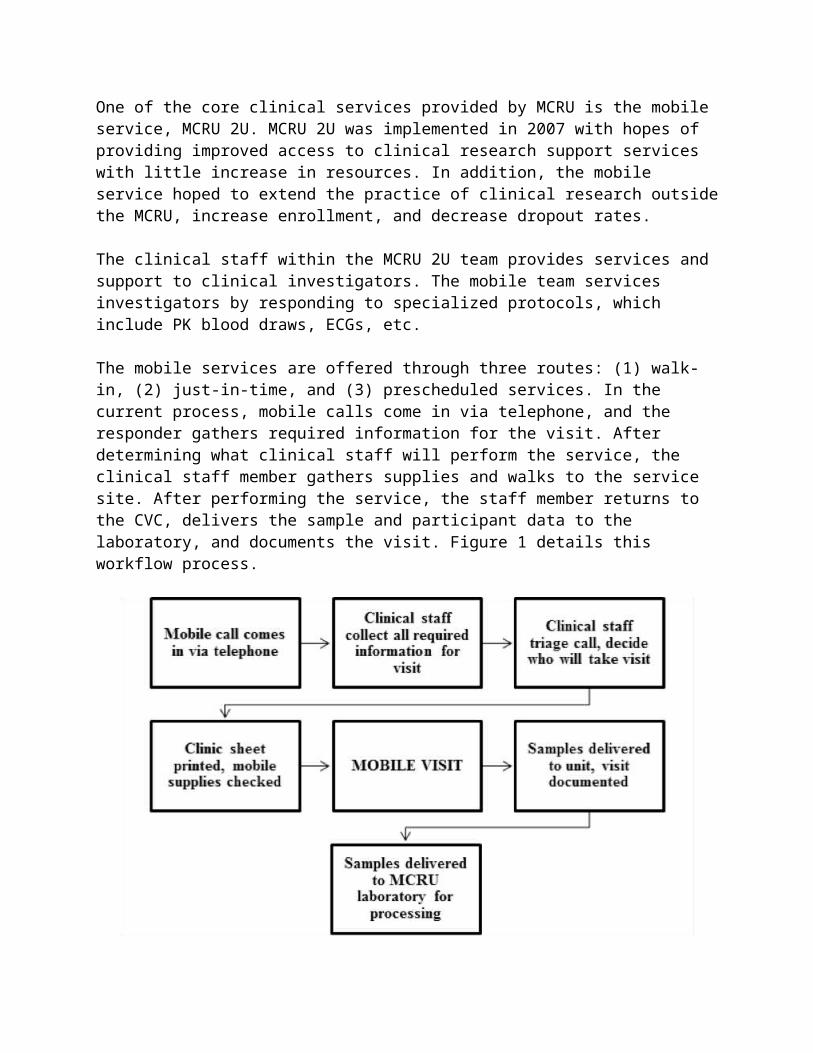
The mobile services are offered through three routes: (1) walk-in, (2) just-in-time, and (3) prescheduled services. In the current process, mobile calls come in via telephone, and the responder gathers required information for the visit. After determining what clinical staff will perform the service, the clinical staff member gathers supplies and walks to the service site. After performing the service, the staff member returns to the CVC, delivers the sample and participant data to the laboratory, and documents the visit. Figure 1 details this workflow process.
Figure 1: Trigger Process for Mobile Clinical Research UnitAdapted From: MCRU JIT Process, Administrative Director and Research Translation Specialist
The inefficiencies begin to surface when high demand for the services occur. MCRU 2U has limited staff and resources and attempting to meet the service demand can lead to disorganization and chaos. For example, there are demographic trends in which certain days, times, or sites will have low demand for the service, but other times will have high demand. The staff who perform these services must also perform their daily duties, which include servicing walk-in participants. The daily duties of the staff can be interfered with on a day with multiple protocol calls. The high amount of variation and unpredictability has prompted MCRU 2U to ask the IOE 481 team to look at demographic trends, inefficiencies and wasted work, and to offer a current and future workflow analysis.
The essential goal was to quantify the current process and identify potential areas of improvement. In addition, the team determined if the existing model can be scaled to meet current and future demand. This project helped identify these key issues and provide recommendations for an improved workflow.

Key Issues
The following key issues are driving the need for this project: Demand has led to inefficiencies Inefficiencies result in high variation and unpredictability in the workflow process Protocol calls interrupt the daily in-clinic workflow for nurses and medical assistants
Goals and Objectives
To help sustain and improve the current model within the Mobile Clinical Research Unit, the student team achieved the following tasks:
Conducted a series of studies to understand the current workflow and demographic trends within the MCRU
Identified sources of inefficiencies, redundancy, disorganization, and variation
With this information, the team developed recommendations to: Determine if the current model is sustainable or if additional resources are needed Increase efficiency Eliminate redundancy Increase predictability
Project Scope
This project included only the MCRU 2U workflow process. The protocol process begins when MCRU 2U is notified of a protocol call and ends when the MRCU 2U staff member returns to the clinic, gives participant data to the lab, and documents the visit. The project scope included the 55 out of the 245 active protocols that require the mobile services of the MCRU 2U.
Any task not connected to the protocol process was not included in this project. Specifically, the team did not study research protocols not serviced by MCRU 2U, or activities associated with departments outside of MCRU 2U. The project did not focus on details regarding participant information nor did it focus on the details involving specific protocol services. The project did not focus on complex protocols such as EKGs.
Methodology
The team developed recommendations based on a select group of simple protocols. This adjustment in focus reduced variation in the workflow process and allowed the team to recommend changes to a more specific function of the MCRU 2U.

Observations and Time Studies
The team observed the MCRU 2U workflow process prior to the time studies to develop a data collection sheet (see Appendix 1) that matched the MCRU 2U workflow process. The team utilized this data collection sheet and a stopwatch to record start and end times for the steps in the workflow process depicted in Figure 1. Data was collected for two weeks. The team observed several staff members and performed 10 time studies on MCRU 2U mobile visits.
Mobile visit was further divided into the following steps: Arrive at site Start Service End Service Leave site
These steps were chosen because the team wanted to observe the activities before a protocol and the steps following a protocol to understand process variability. Specifically, the team focused on preparation and travel time to a site location to standardize the start and end of each step in the workflow process. Team members utilized the data collection sheet to record staff name, route type, site location, date and time, and notes for each step in the workflow process.
Each member of the student team conducted time studies individually. Data was collected from a random sample of nine MCRU staff. A student followed either a Registered Nurse (RN) or a Medical Assistant (MA) to a location site and recorded times while observing the process.
Research for Workflow and Staff Assignment and Allocation
The team conducted a literature search and each team member consulted three documents. The team searched through past IOE 481 reports and gathered ideas and methods, which have been incorporated into this project.
The first document, titled Operations Research Methods Applied to Workflow in a Medical Records Departments [1], uses both stochastic and deterministic models to analyze a hospital information system, more specifically the workflow of the Medical Records and Word Processing Department at the Madonna Rehabilitation Hospital in Lincoln, Nebraska. The workflow in this paper is described as the way jobs arrive into the department and the way in which they are transcribed. The situation analyzed in the paper is similar to the one at MCRU 2U. The team analyzed a situation where staff requirements and stochastic demand is a concern.
The second document, titled An Integrated System for Patient Assessment and Classification and Nurse Staff Allocation for Long Term Care Facilities [2], explains factors to consider when assessing staff allocation, and proper ways to utilize skill levels of nurses. Constraints include (1) an upper limit on funds available for staffing, (2) legal staffing minimums, (3) limitations on the amount of nursing time available for patient care because of other staff responsibilities, and (4) assurance that patients with high priority nursing needs are not neglected. The student team’s
recommendations focus on nursing assignment and allocation, and this document helped determine the constraints to consider.
Finally, the last article used in the team’s research was the Indian Journal of Medical Ethics [3]. This journal presents three case studies that attempt to find ways to improve inter-departmental cooperation in healthcare settings. These case studies are relevant to the analysis of MCRU 2U workflow because a recommendation is to add storage units in different areas of the hospital.
MCRU 2U Employee Survey
The team created and distributed an employee survey. Survey questions were discussed with both the coordinators and clients to ensure relevance and importance. The team wanted to gather staff opinions regarding the positive and negative aspects of the current workflow. To quantify staff opinions, question themes included:
amount of work per week use of supplies meeting demand implementation of a new scheduling system
Survey questions were designed to exclude subjective answers. The survey consisted of 9 multiple-choice questions; a comments section; and personal information including name, position, and years with MCRU. See Appendix 2 for the complete survey.
The Administrative Director distributed these surveys on November 1, 2013 and returned the surveys to the student team on November 8, 2013. Nine out of eleven employee surveys were completed. The team and the clients agreed that nine surveys were sufficient in representing staff opinions.
Historical Data Set Analysis
The Research Translation Specialist provided the student team with a spreadsheet of 1,835 MCRU 2U performed mobile visits spanning from June 2012 to May 2013. For each mobile visit, MCRU 2U documented the following information in the spreadsheet:
Date of performed visit Protocol number Nurse Prescheduled or Just-In-Time (JIT) Call time, site time, service time, and lab time Delays encountered Visit location Type of protocol (SOC, blood draw, EKG, Infusion, etc.)
Because the team did not observe any of the complex protocols (EKGs, Infusions, Injections), the team removed these data points from the historical data set as to not confound the analysis of

the simple protocols (blood draws). Therefore, the analysis of the historical data set included only the blood draws, which comprise 80% of the total protocols.
In addition, when initially cleaning the data, the student team found various fields left blank or filled with inconsistent information. After further consultation with the Administrative Director, the student team eliminated all data points with inconsistent and missing information.
After eliminating inconsistent and missing information, and the complex protocols from the historical data set, the team was left with 1590 mobile visits to analyze. The student team extracted demographic information and trends relating to volume of calls and time duration of a visit by variables such as day of the week, time of day, location, and protocol number.
Extracting this data and identifying trends based on the variables helped the student team understand the current model and discuss it with the Administrative Director and the Research Translation Specialist. In addition, it served as a crucial component in developing recommendations regarding nurse assignment and allocation.
Methods for Data Analysis
The student team entered all the collected data (time studies, surveys, and historical data) into three spreadsheets to set up statistical analysis. Each data collection method helped the team to understand the current model and to develop recommendations for a future model that reduces inefficiencies and variability, and improves nurse assignment.
Time studies allowed the student team to understand time between processes and process variability.
Surveys helped quantify the opinions of the staff regarding MCRU 2U. By understanding the opinions of the various staff members who perform these visits, the student team assessed the positive and negative aspects of the current workflow.
Finally, the historical data set was useful in analyzing demographic trends within the data and answering the following questions:
o What day of the week receives a majority of MCRU 2U calls? What is the variability in calls on these days?
o What times are a majority of the calls being received?o What location is being serviced the most based on time of day?o What location is being serviced the most based on day of week?o What protocols are serviced the most? o What protocols are serviced on the same day within 30 minutes (back-to-back)?
How often?
Through Microsoft Excel and Minitab, the team utilized functions, pivot tables, and graphical analysis to stratify data. The team developed a series of tables and graphs to answer the previous questions. Utilizing these tools allowed the team to understand much of the variability in the current process, which then helped the team develop recommendations for improving workflow and reducing variability within MCRU 2U.

Findings and Conclusions
The following section details the data analysis, findings and conclusions drawn from the data. Findings are subdivided by Process Variation and Volume through Processes. Conclusions are given for each finding.
Process Variation
The use of time studies, employee surveys, and analysis of historical data helped identify areas of high variation in the current process.
High Variation in Process StepsThe historical data set identified variation between each process step. Figure 2 depicts the average duration and standard deviation between each step recorded in the historical data. Interval A represents the duration between ‘Call Received’ and ‘Arrive at Site’. Interval B represents the duration between ‘Arrive at Site’ and ‘End of Service’, and finally Interval C represents the duration between ‘End of Service’ and ‘Drop Specimen off at Lab’.
Figure 2: MCRU 2U Workflow Process June 2012 - May 2013, N = 1590, Historical Data Set
Figure 2 shows that interval A had the highest average time and interval C had the highest standard deviation. The boxplot in Figure 3 shows the spread for each interval.

Figure 3: Interval A has Highest Average Process Time and SpreadJune 2012 - May 2013, N = 1590, Historical Data Set
Figure 3 shows that interval A had the highest spread and that interval B had the lowest spread.
Figure 4 shows the extension of intervals A and B based on the variation in processes found from the historical data set. Ten time studies were conducted to analyze the average time and standard deviation between process steps of the current MCRU 2U workflow. Figure 4 displays the specific process steps observed during the time studies.
Figure 4: Extended MCRU 2U Workflow ProcessOctober 9-19, 2013; N = 10; Time Studies

Intervals A3 and C represent walking time, which accounts for the majority of time spent during a mobile visit. Traveling from MCRU to the site and traveling back to MCRU after the completion of a service account for 7 and 9 minutes on average, respectively. The process was further analyzed to identify areas where MCRU 2U could improve on the current process. Improvements of opportunity were chosen based on intervals with high variation. These areas of improvement are shown in Figure 4 as well.
Variation in Protocol LocationsTo further understand the variability of process time due to location, Table 1 shows a comparison of each process step duration for each location.
Table 1: Duration by Location and Process Step (minutes)June 2012 - May 2013, N = 1590, Historical Data Set
Location
AAverage Call to
Site Duration
BAverage Site
to End of Service
Duration
CAverage End
Service to LabAverage
Total Duration
Cancer Center 15.95 6.92 12.32 34.92
Cardiovascular Center 14.85 9.87 12.98 32.83
Emergency Room 15.20 9.20 15.60 40.00
Mott Hospital 23.95 11.34 19.13 54.22
Taubman Center 15.82 8.14 14.76 38.61
University Hospital 35.84 9.57 15.69 60.09
Average 22.49 9.07 15.37 46.29
The data represented in Table 1 shows that there is a large range in Average Total Duration. For example, mobile visits to the University Hospital are on average 27 minutes longer than those to the Cardiovascular Center. Additionally, the two highest durations for call to site are for protocols serviced at Mott Hospital and University Hospital with 23.95 and 35.84 minutes, respectively. This trend continues with Mott Hospital and University Hospital for the largest duration for site to service and service to lab. The Cancer Center and Taubman Center have the shortest call to site duration with 15.95 and 15.82 minutes, respectively.
Variation of Staff Performance and OpinionsBased on the findings from the employee surveys, analysis showed staff opinions on areas for improvement. The surveys had nine questions and nine staff members completed the surveys.

Analysis of the surveys primarily focused on assessing the issues of backpacks and total walking time to and from a serviced location because these two issues best explained the variation in process steps.
The Administrative Director expressed concern that a large number of employees did not take all of the supplies required to perform multiple services, specifically backpacks, on protocols. Questions 2 and 3 in the survey were designed to specifically address the issue of backpacks. Question 2 asked staff how often they take backpacks on a mobile visit. Responses ranged from ‘Always’ to ‘Never’. The results are shown in Figure 5.
Always Most of the time
Sometimes Hardly ever Never 0
1
2
3
4
Do you take the backpack with you on protocols?
Num
ber
of R
espo
nses
Figure 5: Over Half of MCRU 2U Staff Does Not Take BackpackNovember 1-8, 2013; N= 9; MCRU 2U Employee Survey
Figure 5 shows that 5 out of 9 employees ‘Hardly Ever’ or ‘Never’ take the backpack and 4 out of 9 employees take the backpack ‘Most of the Time’ or ‘Always’ on mobile visits.
If employees answered ‘Hardly Ever’ or ‘Never’ to question 2, then question 3 asked the employees their reasons for not taking the backpack. For question 3, Figure 6 shows the response frequency for each answer choice. Staff members were allowed to select multiple answers.

The ba
ckpa
ck is
too di
sorga
nized
It is to
o heav
y.
I feel
that I
do no
t need
all th
e sup
plies
at on
ce
I take
the b
ackpa
ck on
a reg
ular b
asis
Other R
eason
s
Left bl
ank
012345
I do not take the backpack because:N
umbe
r of
Res
pons
es
Figure 6: MCRU 2U Backpack is Disorganized and HeavyNovember 1-8, 2013; N= 9; MCRU 2U Employee Survey
7 of the 14 total responses from employees signified that they do not take the backpack on mobile visits because it is too disorganized or too heavy.
Surveys gathered opinions about the usage of backpacks and walking time to and from a serviced location. Time studies analysis indicated that walking contributed 43% of the total process time. Therefore, the survey asked staff if they felt that walking took a good portion of the total process time. The responses for this question ranged from ‘Strongly Agree’ to ‘Strongly Disagree’. The results from this question are shown in Figure 7.

Strongly Agree
Agree Neutral Disagree Strongly Disagree
0
1
2
3
4
5
6
Walking takes a good portion of the MCRU 2U pro-tocol service time.
Num
ber
Of R
espo
nses
Figure 7: MCRU 2U Staff Agree Walking Takes a Good Portion of Service TimeNovember 1-8, 2013; N= 9; MCRU 2U Employee Survey
Figure 7 shows that 6 out of 9 employees agree that walking takes a good portion of the MCRU 2U protocol service time. This response emphasizes the need to decrease the amount of time the staff spend walking.
To help the Administrative Director and Research Translation Specialist understand employee’s opinions, survey results related to demand, workload, and a new scheduling system are attached in Appendix 4. The team did not form any recommendations from these results.
Conclusions from Process Variation Analysis of the process variation data showed that there is high variation from the time a call is received to the time staff begins their service, especially when the calls come from the University Hospital and Mott Hospital. In addition, the amount of time MCRU 2U staff waits to start a service upon arrival at the site needs to be shortened. The purchase of a new backpack or organization of the current backpack is necessary. Finally, walking constituted over 40% of the total process time and needs to be reduced.
Volume through Processes
After analyzing the current process variability, analysis of the historical data helped identify demographic trends. Demographic trends help understand the current model, as they provide insight into incoming demand by different frequencies, times, locations, and protocols.
To help understand demographic trends, the boxplot in Figure 6 shows the average number of calls on each weekday.

Figure 8: Tuesday and Thursday Receive Highest Number of CallsJune 2012 - May 2013, N = 1590, Historical Data Set
Figure 8 shows that in the year June 2012 to May 2013, Tuesdays and Thursdays had the highest average number of calls, at 7.32 and 7.10 calls, respectively. In addition, the boxplots help understand the spread of calls for each weekday. For example, the boxplot for Monday suggests that the number of calls on Mondays did not have a large spread and that Thursdays had the largest spread.
Time Range AnalysisTo further understand the demographic trends of the MCRU 2U calls, Table 2 shows the frequency of calls by different time periods. After discussion with both the coordinators and clients, the student team chose to analyze trends in time by two-hour blocks of a typical work week (Monday through Friday, 7 AM to 5 PM).
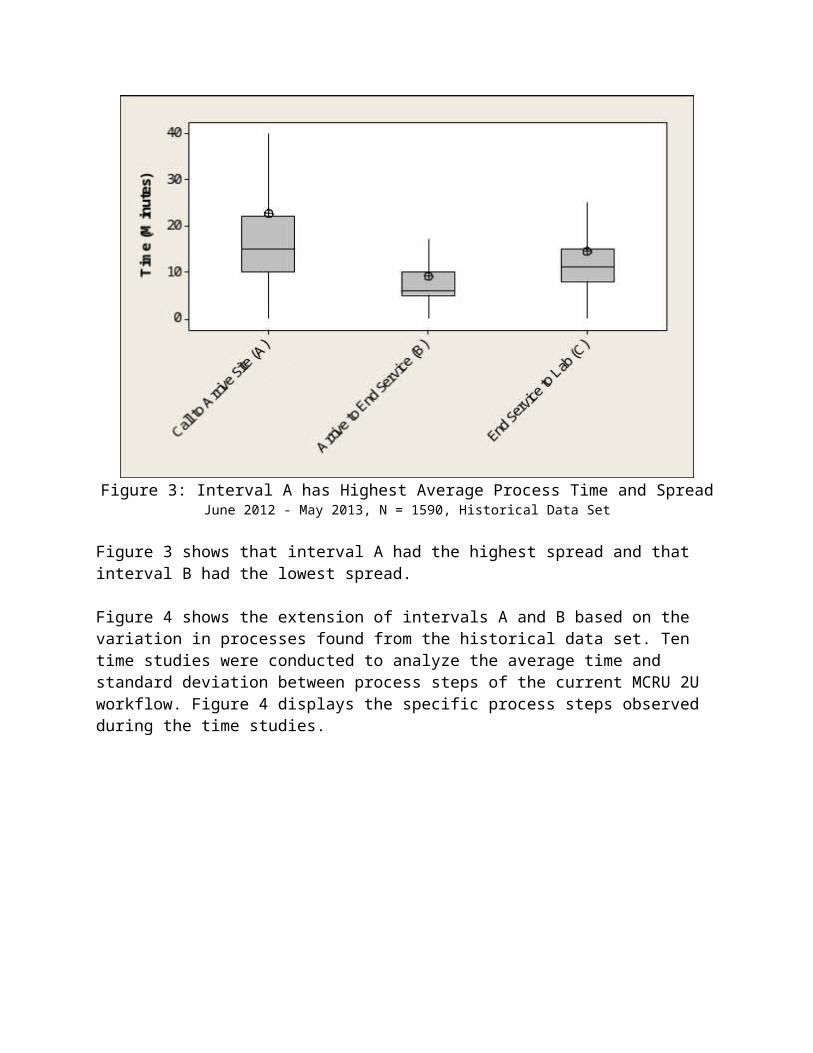
Table 2: Average Call Frequency by Time June 2012 - May 2013, N = 1590, Historical Data Set
Time Range MondayTuesda
yWednesda
yThursda
y Friday07:00 - 09:00 1.47 1.25 1.17 1.22 1.3109:00 - 11:00 1.71 2.42 2.00 2.78 2.5411:00 - 13:00 1.83 2.84 2.00 2.45 2.4013:00 - 15:00 1.96 1.87 1.67 1.76 1.7915:00 - 17:00 1.50 1.68 1.44 1.65 1.38
Each value in Table 2 represents the average number of calls MCRU 2U receives for that weekday and time range. For example, MCRU 2U receives an average of 1.47 calls on Mondays between 07:00 and 09:00. The red circles indicate the time block during which MCRU 2U received the highest average number of calls for a particular weekday. For example, on Monday, MCRU 2U receives its highest volume of calls between 13:00 and 15:00, at 1.96 calls. Similarly, the busiest time block on Tuesdays is between 11:00 and 13:00, with an average of 2.84 calls. On Wednesday, two time blocks (09:00 – 11:00, 11:00 – 13:00) tied for highest volume of calls, averaging 2.00 calls. Finally, on both Thursdays and Fridays, the busiest time block is between 09:00 and 11:00, with average of 2.78 calls and 2.54 calls, respectively.
Location AnalysisTable 3 looked at the demographic trends within certain locations that MCRU 2U services. After discussion with the Administrative Director, analysis focused specifically on the six locations shown in Table 3.
Table 3: Average Call Frequency by LocationJune 2012 - May 2013, N = 1590, Historical Data Set
Location Monday Tuesday Wednesday Thursday FridayCancer Center 1.54 1.88 2.09 1.56 1.77
Cardiovascular Center 1.00 1.27 1.10 1.00 1.42Emergency Room 1.00 1.00 1.00 1.00 1.00
Mott Hospital 1.42 1.48 1.65 3.09 2.27Taubman Center 2.08 2.03 2.14 1.65 1.59
University Hospital 1.77 1.72 1.70 2.00 1.66
The values in Table 3 are similar to the values in Table 2. Each value in Table 3 represents the average number of calls received by MCRU 2U for a particular location for some weekday. For example, MCRU 2U received an average of 1.54 calls at the Cancer Center on Mondays. The red circles represent the location with the highest volume calls for a particular weekday. For example, on Mondays, Tuesdays, and Wednesdays, the MCRU 2U serviced at the Taubman Center the most frequently, with an average of 2.08, 2.03, and 2.14 calls, respectively. Finally, on Thursdays and Fridays, MCRU 2U serviced at Mott Hospital the most frequently, with an average of 3.09 and 2.07 calls, respectively.

Protocol AnalysisMCRU 2U serviced 92 protocols between June 2012 and May 2013. The Pareto Chart in Figure 9 depicts demographic trends found for the serviced protocols.
Figure 9: Five Protocols Contribute 31% of Mobile VisitsJune 2012 - May 2013, N = 1590, Historical Data Set
The Pareto Chart in Figure 9 shows the number of total calls serviced by different protocols. For example, the first protocol, ‘2643’, had 8% of all mobile visits between June 2012 and May 2013. The Pareto Chart shows that the top five most frequently serviced protocols (‘2643’, ‘2730’, ‘2441’, ‘2742’, ‘2717’) made up 31% of all mobile visits from June 2012 to May 2013 and that the top 10 most frequently serviced protocols made up 50% of all mobile visits. Finally, Figure 9 shows that out of 92 total protocols, 19 of them contributed to 71% of all mobile visits. To see the relative frequency and cumulative frequency of each individual protocol, see Appendix 3.
Table 4 shows further analysis of the top five most frequently serviced protocols. To perform the analysis, the student team created a parameter called ‘Back-to-Back Frequency’. This parameter measured the occurrence of two mobile calls received within 30 minutes of each other. Table 4 shows the top five most serviced protocols, the number of times each protocol had a ‘Back to Back’ call, the average number of ‘Back-to-Back’ calls per day, the number of days with ‘Back-to-Back’ calls, and calls per day.

Table 4: Trends for the Top Five Serviced ProtocolsJune 2012 - May 2013, N = 1590, Historical Data Set
Protocol Back to BackFrequency
Average Back to
Back per Day
Number of Days with Back to
Back CallsCalls Per
Day
2643 44 0.68 30 1.86
2730 36 0.73 25 1.44
2441 28 0.39 24 1.18
2742 28 0.35 27 1.86
2717 23 0.46 16 1.60
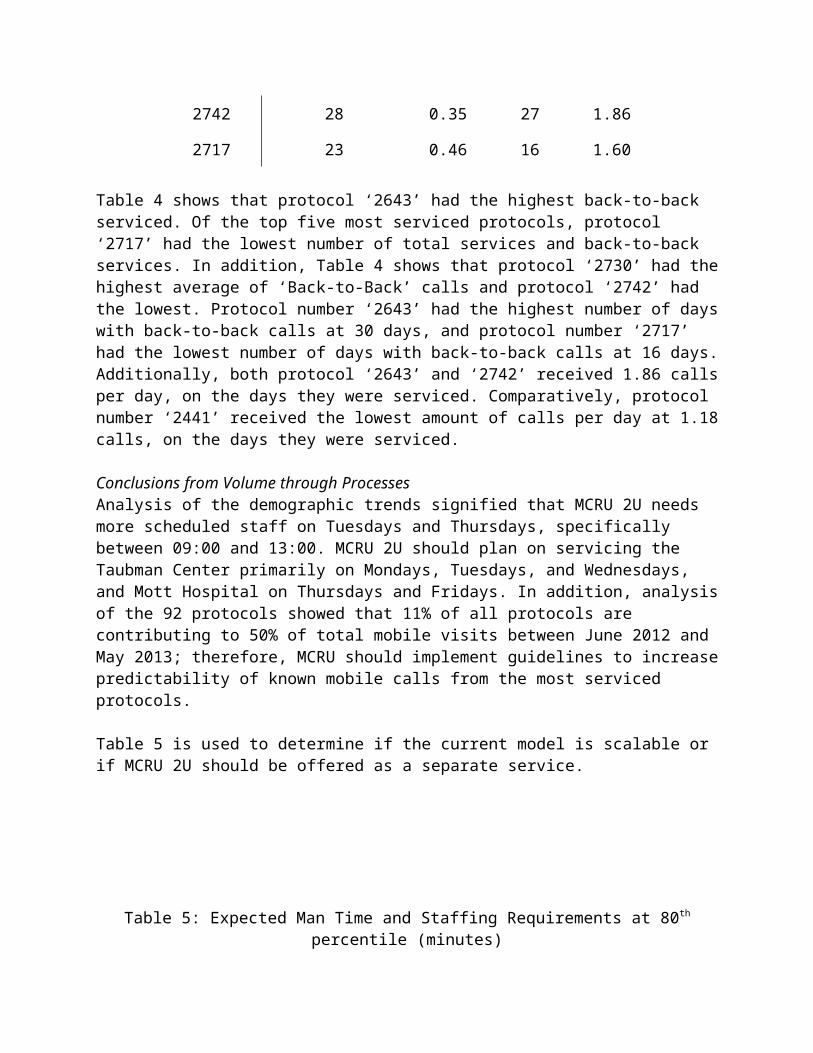
Table 4 shows that protocol ‘2643’ had the highest back-to-back serviced. Of the top five most serviced protocols, protocol ‘2717’ had the lowest number of total services and back-to-back services. In addition, Table 4 shows that protocol ‘2730’ had the highest average of ‘Back-to-Back’ calls and protocol ‘2742’ had the lowest. Protocol number ‘2643’ had the highest number of days with back-to-back calls at 30 days, and protocol number ‘2717’ had the lowest number of days with back-to-back calls at 16 days. Additionally, both protocol ‘2643’ and ‘2742’ received 1.86 calls per day, on the days they were serviced. Comparatively, protocol number ‘2441’ received the lowest amount of calls per day at 1.18 calls, on the days they were serviced.
Conclusions from Volume through ProcessesAnalysis of the demographic trends signified that MCRU 2U needs more scheduled staff on Tuesdays and Thursdays, specifically between 09:00 and 13:00. MCRU 2U should plan on servicing the Taubman Center primarily on Mondays, Tuesdays, and Wednesdays, and Mott Hospital on Thursdays and Fridays. In addition, analysis of the 92 protocols showed that 11% of all protocols are contributing to 50% of total mobile visits between June 2012 and May 2013; therefore, MCRU should implement guidelines to increase predictability of known mobile calls from the most serviced protocols.
Table 5 is used to determine if the current model is scalable or if MCRU 2U should be offered as a separate service.
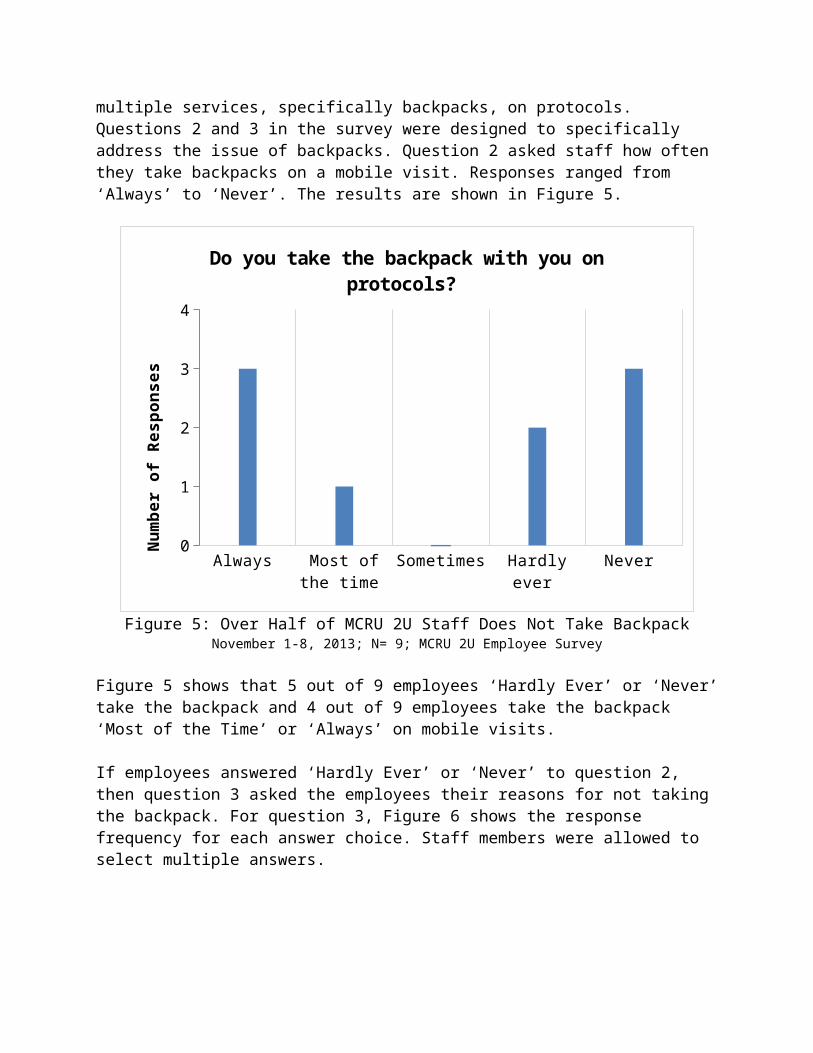
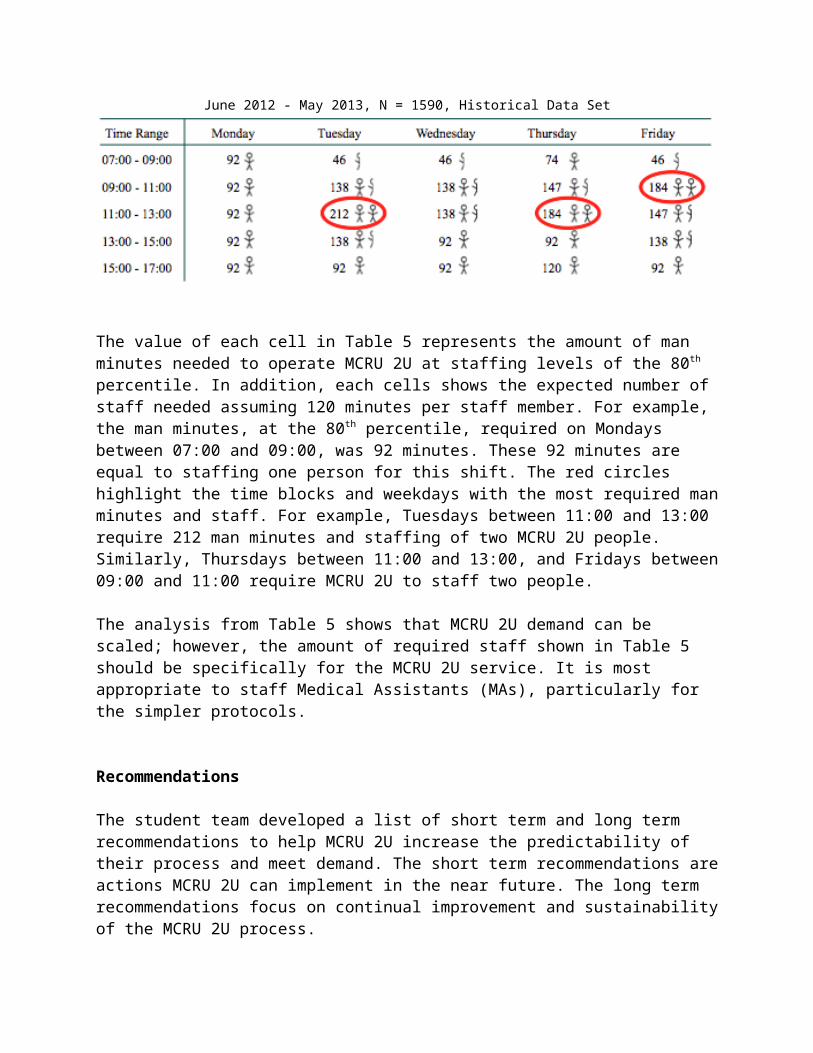
Table 5: Expected Man Time and Staffing Requirements at 80th percentile (minutes)June 2012 - May 2013, N = 1590, Historical Data Set
The value of each cell in Table 5 represents the amount of man minutes needed to operate MCRU 2U at staffing levels of the 80th percentile. In addition, each cells shows the expected number of staff needed assuming 120 minutes per staff member. For example, the man minutes, at the 80th percentile, required on Mondays between 07:00 and 09:00, was 92 minutes. These 92 minutes are equal to staffing one person for this shift. The red circles highlight the time blocks and weekdays with the most required man minutes and staff. For example, Tuesdays between 11:00 and 13:00 require 212 man minutes and staffing of two MCRU 2U people. Similarly, Thursdays between 11:00 and 13:00, and Fridays between 09:00 and 11:00 require MCRU 2U to staff two people.
The analysis from Table 5 shows that MCRU 2U demand can be scaled; however, the amount of required staff shown in Table 5 should be specifically for the MCRU 2U service. It is most appropriate to staff Medical Assistants (MAs), particularly for the simpler protocols.
Recommendations
The student team developed a list of short term and long term recommendations to help MCRU 2U increase the predictability of their process and meet demand. The short term recommendations are actions MCRU 2U can implement in the near future. The long term recommendations focus on continual improvement and sustainability of the MCRU 2U process.
Short Term Recommendations
The team recommends that MCRU 2U implement guidelines and organizational methods that help control the variable demand and predict future calls. This can be done by making the following changes:
Screen investigators during the initial call by asking the following questions and steps: o Will MCRU 2U staff be able to start service upon arrival?o Does the PI have the proper consent forms? o Does the protocol location have the appropriate equipment?

o Provide a thirty minute time range of when the patient will be ready. o If MCRU 2U can start service upon arrival, proceed with call as usual.
Add storage units for supplies at the most frequently served locations, such as the Taubman Center and Mott’s Hospital
o Coordinate and discuss with other hospital units about installing storage units. These storage units can help to reduce walking time between protocols serviced at the same location.
Develop new organizational method for backpacko Organize supplies for easy and accessible usage. This will incentivize staff to use
backpack on mobile visits. Develop nurse assignments based on demographic trends
o Use trends related to location, time range, and weekday to assign appropriate staff levels that meet demand of MCRU 2U
Regulate calls by establishing guidelines with PIs and protocolso Accept no more than 2 calls per hour for a particular protocolo Develop more prescheduled visits with most serviced protocols to increase
predictability in demand o Require PIs to notify MCRU of multiple calls for a particular location that will be
within one hour
Long Term Recommendations
Clean and validate data regularly so it is easier to understand for all users Record and input data using a standardized method (create organized excel template,
discuss with employees the importance of recording accurate measurements) Regularly analyze (every 3-4 months) trends between times, locations, and protocols to
understand workflow and to assess the need for potential improvements Perform further studies to analyze demand and potential areas of improvements
Expected Impact or Outcome
Using the results from this report, the team has provided recommendations that will improve the productivity and efficiency of MCRU 2U. The following is expected upon project completion.
Understanding Process Variability
MCRU 2U has shown significant variability in the mobile process. Standardizing this process by screening investigators will shorten the total process time by 5 minutes. Organizing the backpack will incentivize at least 4 out of 9 staff members to take it with them on mobile visits, which will then reduce walking time during ‘back-to-back’ calls.

Understanding Volume through Processes
Implementing changes based on the demographic trends of location, protocol, and time of day will allow MCRU to better predict demand and the expected number of man time required for MCRU 2U, resulting in variation reduction and allowing MCRU to staff appropriately for the mobile service. This will improve the overall quality and efficiency of the service.

Appendix 1: Time Studies Data Collection Sheet
Staff Name: Route Type: Site: Date and Time:
27
Process Step Start Time
End Time Notes
Mobile call comes in via telephone and clinical staff requires information for visit
Clinical staff triage call, decide who will take visit
Clinic sheet printed, mobile supplies checked
MOBILE VISIT
LEAVE CVC
ARRIVE AT SITE (walk back)
START SERVICE (end service)
END SERVICE
ARRIVE BACK AT MCRU2U
Samples delivered to MCRU laboratory for processing
Documentation

Appendix 2: MCRU Survey
Name:Position:Years with MCRU:
1. On average, how many protocols do you go on a week?a. 0-2b. 3-5c. 5-8d. 8-10e. 10+
2. Do you take the backpack with you on protocols?a. Alwaysb. Most of the timec. Sometimesd. Hardly evere. Never
3. I do not take the backpack because: a. It is too heavy. b. I feel that I do not need all the supplies at once. c. The backpack is too disorganized. d. I take the backpack on a regular basis.
4. The number of calls vary tremendously every day.a. Strongly Agreeb. Agreec. Neutrald. Disagreee. Strongly Disagree
5. Would you be in favor of being assigned to a specific time slot in which you were responsible for all MCRU 2U calls in that given time period with a lesser workload on the unit?
a. Yesb. No. Explain:
i. I do not want to be assigned to a specific time slot.ii. This will interfere with my daily work.
iii. It will affect my relationship with the participants.
28

Appendix 2: MCRU Survey (cont.)
6. There is currently enough staff to meet the demand of MCRU 2U and the daily tasks on the unit.
a. Strongly Agreeb. Agreec. Neutrald. Disagreee. Strongly Disagree
7. MCRU 2U interferes with my regular work on the unit. a. Strongly Agreeb. Agreec. Neutrald. Disagreee. Strongly Disagree
8. A large portion of my job involves performing MCRU 2U services. a. Strongly Agreeb. Agreec. Neutrald. Disagreee. Strongly Disagree
9. Walking takes a good portion of the MCRU 2U protocol service time. a. Strongly Agreeb. Agreec. Neutrald. Disagreee. Strongly Disagree
Are there any additional comments you would like to include to clarify your responses to the above questions?
29

Appendix 3: Protocol Trends
Table 3-1: Protocol Frequency DataJune 2012 - May 2013, N = 1590, Historical Data Set
Protocol Number
Relative Frequency
Cumulative Frequency
Most Serviced Location
Most Serviced
Time Block2643 7.6% 7.6% MCRU Drop In 11:00 – 13:002730 6.5% 14.2% Cancer Center 09:00 – 11:00
2441 5.8% 20.0%University Hospital
15:00 – 17:00
2742 5.7% 25.7% Mott Hospital 09:00 – 11:002717 5.0% 30.8% Cancer Center 09:00 – 11:002651 4.6% 35.3% Mott Hospital 11:00 – 13:00
2832 4.0% 39.3%University Hospital
13:00 – 15:00
2696 3.8% 43.1% Cancer Center 13:00 – 15:002569 3.6% 46.7% MCRU Drop In 09:00 – 13:002614 3.5% 50.3% Taubman Center 09:00 – 11:002767 3.3% 53.6%2523 3.0% 56.6%2050 2.8% 59.4%2633 2.6% 61.9%2949 2.5% 64.5%2749 2.3% 66.7%2926 2.0% 68.7%2617 1.8% 70.6%2637 1.8% 72.3%2579 1.7% 74.0%2785 1.7% 75.7%2842 1.6% 77.3%2408 1.2% 78.5%2686 1.1% 79.6%2781 1.1% 80.7%2916 1.0% 81.7%2621 1.0% 82.7%2927 1.0% 83.7%2513 0.9% 84.6%2768 0.9% 85.5%2856 0.9% 86.4%2729 0.8% 87.2%2655 0.8% 88.0%2911 0.8% 88.7%2622 0.8% 89.5%
30

Appendix 3: Protocol Trends (cont.)
2743 0.7% 90.2%2697 0.6% 90.8%2672 0.5% 91.3%2759 0.5% 91.8%2964 0.5% 92.3%2679 0.5% 92.8%2516 0.4% 93.3%2956 0.4% 93.7%2609 0.4% 94.1%2807 0.4% 94.5%2827 0.4% 94.8%2588 0.3% 95.2%2606 0.3% 95.5%2940 0.3% 95.7%2720 0.3% 96.0%2829 0.2% 96.2%2814 0.2% 96.4%2690 0.2% 96.5%2894 0.2% 96.7%2687 0.1% 96.9%2581 0.1% 97.0%2824 0.1% 97.1%3025 0.1% 97.2%2549 0.1% 97.4%2900 0.1% 97.5%2803 0.1% 97.6%2702 0.1% 97.7%2413 0.1% 97.9%2780 0.1% 98.0%2401 0.1% 98.1%2918 0.1% 98.2%2833 0.1% 98.4%2747 0.1% 98.5%2709 0.1% 98.6%2034 0.1% 98.6%2869 0.1% 98.7%2947 0.1% 98.7%2694 0.1% 98.8%2821 0.1% 98.9%2415 0.1% 98.9%2838 0.1% 99.0%
31
Appendix 3: Protocol Trends (cont.)
2199 0.1% 99.1%2592 0.1% 99.1%2874 0.1% 99.2%2659 0.1% 99.2%2444 0.1% 99.3%2658 0.1% 99.4%2416 0.1% 99.4%2733 0.1% 99.5%2634 0.1% 99.6%2574 0.1% 99.6%2671 0.1% 99.7%2972 0.1% 99.7%2843 0.1% 99.8%2896 0.1% 99.9%2756 0.1% 99.9%2782 0.1% 100.0%
32
Appendix 4: Further Survey Results
0-2 3 to 5 5 to 8 8 to 10 More than 100
1
2
3
4
5
On average, how many protocols do you go on per week?
# of protocols
Num
ber
Of R
espo
nses
Figure 4-1: Most Employees go on 3 to 5 Mobile Visits per WeekNovember 1-8, 2013; N= 9; MCRU 2U Employee Survey
Appendix 4: Further Survey Results (cont.)
33

Figure 4-2: MCRU 2U Staff Agree that Number of Calls Vary DailyNovember 1-8, 2013; N= 9; MCRU 2U Employee Survey
Appendix 4: Further Survey Results (cont.)
34
Strongly Agree
Agree Neutral Disagree Strong Disagree
0
1
2
3
4
5
6
The number of calls vary every day
Num
ber
of R
espo
nses

0
2
4
6
8
Why do you not want to be assigned a specific time slot for all MCRU 2U calls?
Num
ber
of R
espo
nses
Figure 4-3: MCRU 2U Staff Believe Assigned Scheduling will Interfere with WorkNovember 1-8, 2013; N= 9; MCRU 2U Employee Survey
Strongly Agree
Agree Neutral Disagree Strongly Disagree
0
1
2
3
4
5
There is currently enough staff to meet demand of MCRU 2U and the daily tasks on the unit. (N = 9)
Num
ber
of R
espo
nses
Figure 4-4: MCRU 2U Staff Disagree that there is enough staff to meet MCRU 2U DemandNovember 1-8, 2013; N= 9; MCRU 2U Employee Survey
Appendix 4: Further Survey Results (cont.)
35

Strongly Agree
Agree Neutral Disagree Strongly Disagree
0
1
2
3
4
5
6
MCRU 2U interferes with my regular work on the unit.
Num
ber
of R
espo
nses
Figure 4-5: MCRU 2U Staff are Neutral Regarding MCRU 2U Interfering with Daily WorkNovember 1-8, 2013; N= 9; MCRU 2U Employee Survey
Strongly Agree
Agree Neutral Disagree Strongly Disagree
0
1
2
3
4
5
A large portion of my job involves performing MCRU 2U services.
Num
ber
of R
espo
nses
Figure 4-6: MCRU 2U Staff Disagree that large portion of their job involves MCRU 2UNovember 1-8, 2013; N= 9; MCRU 2U Employee Survey
36

Appendix 5: Average Man Time
Table 5-1: Average Man Time (minutes)June 2012 - May 2013, N = 1590, Historical Data Set
Time Range MondayTuesda
yWednesda
yThursda
y Friday07:00 - 09:00 68 58 54 56 6009:00 - 11:00 79 111 92 128 11711:00 - 13:00 84 131 92 113 11013:00 - 15:00 90 86 77 81 8215:00 - 17:00 69 77 66 76 63
37